Gas Monitoring of Volcanic-Hydrothermal Plumes in a Tropical Environment: The Case of La Soufrière de Guadeloupe Unrest Volcano (Lesser Antilles)
 Severine Moune1,2,3*
  Roberto Moretti1,2
  Arnand Burtin1
  David Edward Jessop1,2,3 Tristan Didier1,2
  Vincent Robert1,2
  Magali Bonifacie1,2
  Giancarlo Tamburello4
  J-Christophe. Komorowski1
  Patrick Allard1 Margaux Buscetti5
- 1CNRS, Institut de Physique Du Globe de Paris, Université de Paris, Paris, France
- 2Observatoire Volcanologique et Sismologique de Guadeloupe, Institut de Physique du Globe de Paris, Gourbeyre, France
- 3CNRS, UMR 6524, Laboratoire Magmas et Volcans, OPGC, Clermont-Ferrand, France
- 4Istituto Nazionale di Geofisica e Vulcanologia, Bologna, Italy
- 5Ecole et Observatoire des Sciences de la Terre, Strasbourg, France
Fumarolic gas survey of dormant volcanoes in hydrothermal activity is crucial to detect compositional and mass flux changes in gas emissions that are potential precursors of violent phreatic or even magmatic eruptions. Here we report on new data for the chemical compositions (CO2, H2S, SO2) and fluxes of fumarolic gas emissions (97–104°C) from La Soufrière volcano in Guadeloupe (Lesser Antilles) obtained from both mobile MultiGas measurements and permanent MultiGas survey. This paper covers the period 2016–2020, encompassing a period of enhanced hydrothermal unrest including an abrupt seismic energy release (M 4.1) on April 27, 2018. Our dataset reveals fumarolic CO2/H2S and SO2/H2S gas trends correlated to the evolution of surface activity and to other geochemical and geophysical parameters. We demonstrate that, even under tropical conditions (high humidity and rainfall), MultiGas surveys of low-T fumarolic emissions permit to distinguish deeply sourced signals of volcanic unrest from secondary changes in degassing due to shallow forcing processes such as water-gas-rock interactions in the hydrothermal system and meteorological effects.
1 Introduction
Hydrothermal manifestations at many dormant andesitic volcanoes are commonly sustained by a supply of heat and volatiles from a magma reservoir at depth to the shallow parts of the volcanic system. Through interactions with shallow aquifers and the host rocks this magmatic supply sustains a hydrothermal system beneath and within the edifice and thus hydrothermal manifestations at the surface (e.g., Rye et al., 1992; Hedenquist and Lowenstern, 1994; Rye, 2005). Volcanic-hydrothermal systems can remain in equilibrium as long as the input and output of heat and volatiles compensate each other. Over time, however, they may be disrupted by various processes, such as gradual self-sealing (e.g., Christenson et al., 2010) leading to overpressurization and enhanced gas supply from depth (e.g., de Moor et al., 2016; Christenson et al., 2017) or even the ascent of a magma intrusion (Cashman and Hoblitt, 2004), or instead, by surficial processes, such as sector collapse, leading to their sudden decompression. Depending on the actual process involved, the resulting eruptions can vary from hydrothermal eruptions to magma-driven explosive events eventually evolving into a magmatic eruption. In most cases, both magma-derived volatiles and hydrothermal fluids are emitted altogether during such eruptive events. Moreover, even hydrothermal eruptions involving no magma emission can be hazardous volcanic events given their sudden occurrence, lack of precursor signals, potentially high intensity and co-associated phenomena such as ash clouds, ballistic ejecta, pyroclastic density currents, partial edifice collapse, outgassing and lahars. The risks from hydrothermal eruptions were further illustrated by the deadly events that happened at Ontake volcano (Japan, 2014; Maeno et al., 2016), White Island (New-Zealand, 2019; Dempsey et al., 2020), Ruapehu volcano (New-Zealand, 2007; Kilgour et al., 2010) and fortunate near-miss disaster at Te Maari, Tongariro (New-Zealand) in 2012 (Procter et al., 2014).
The ability to forecast hydrothermal eruptions depends on their driving mechanism, which will determine the intensity and duration of their precursory signals, but also on the availability of an adequate instrumental monitoring. Sudden events, with limited precursory signals, are rarely predictable but are often of modest size (Barberi et al., 1992; Hurst et al., 2014). Instead, dormant volcanoes with long-lived hydrothermal systems can experience years or decades of unrest, involving a variety of signals, prior to erupting (e.g., Sano et al., 2015; Oikawa et al., 2016). Therefore, detecting the forerunning signals of hydrothermal eruptions requires monitoring the behaviour of volcanic systems on both short and long-time scales. In addition to geophysical monitoring, the survey of hydrothermal gas emissions can provide key warning information because the gas compositions and the gas fluxes are both expected to vary in response to underground processes prior to an eruption (Fischer et al., 1997; Chiodini, 2009; Werner et al., 2013; Allard et al., 2014; de Moor et al., 2016; Moretti et al., 2020a; Girona et al., 2021). However, gas compositions can also be affected by secondary effects linked to scrubbing and other water-gas-rock interactions in the hydrothermal system (Symonds et al., 2001) and meteorological variability at the surface (e.g., Shimoike and Notsu, 2000). Hot magmatic gases infiltrating hydrothermal aquifers become partly depleted in their most water-soluble acid components (SO2, HCl, HF). Hence, surface fumaroles are correspondingly enriched in less soluble species (CO2, H2S, H2, CH4, CO) and steam (Symonds et al., 2001). Moreover, the scrubbing of these acid components into aquifers promotes acid alteration of the host rocks, which in turn determines complex chemical reactions and buffering effects during further gas-rock interactions (Moretti and Stefánsson, 2020 and references therein). As a consequence, the original chemical signature of a magma-derived gas supply can be significantly modified, or even almost hidden, in surface fumarolic emissions. These secondary chemical processes are potentially much more important at volcanoes located in tropical environments, where a high rate of rainfall and groundwater infiltration favours extensive gas dilution, scrubbing and water-gas-rock interactions. Meteorological conditions themselves can also influence the composition and flux of volcanic fumaroles in a tropical environment (Faber et al., 2003; Keely et al., 2013). Hence, deciphering the source mechanism of hydrothermal unrest at dormant volcanoes in tropical environments is particularly challenging and requires an adapted geochemical monitoring strategy. Clear unrest signals or even precursors of eruptions were previously detected on such volcanoes, even though contradictory interpretations about the nature of unrest arose in some cases (Symonds et al., 1994; Fischer et al., 1997; Werner et al., 2009; Procter et al., 2014; Allard et al., 2014; Chiodini et al., 2015, 2016; de Moor et al., 2016; Maeno et al., 2016; Moretti et al., 2013, 2017, 2020a; Battaglia et al., 2019; Troise et al., 2019).
Here we focus on La Soufrière of Guadeloupe, an active andesitic volcano of the Lesser Antilles arc, which has been displaying growing fumarolic unrest since 1992 (Komorowski et al., 2005; Villemant et al., 2014). We report new data for the chemical composition and discharge rate of summit fumarolic gas emissions measured with both mobile and permanent multi-sensors (MultiGas) devices during the 2016–2020 period. Our dataset encompasses a sharp peak in activity in April 2018 (Moretti et al., 2020a) and is interpreted in the framework of the multidisciplinary monitoring of La Soufrière conducted by the local volcano observatory (OVSG-IPGP). We find both short-term and long-term changes in the degassing features that can be related to the dynamics of underground processes (gas mixing and water-gas-rock interactions in the hydrothermal system, sulfur deposition and remobilization) and meteorological forcing, as well as geophysical signals (seismicity and deformation).
2 Volcanological Background
La Soufrière de Guadeloupe (16.0446°N, 61.6642°W, 1,467 m, a.s.l., hereby referred to as La Soufrière) is one of the most active and most dangerous volcanoes of the Lesser Antilles island arc (Komorowski et al., 2005). Its summit part consists of an andesitic lava dome, cut by numerous fractures (Figure 1), that was emplaced during the last major magmatic eruption in 1530 AD. Since then, intense hydrothermal activity has persisted at La Soufrière, under the forms of fumaroles, steaming ground and hot springs, that occasionally culminated in series of non-magmatic phreatic eruptions and/or hydrothermal explosive eruptions (e.g., Komorowski et al., 2005; Komorowski et al., 2008; Legendre, 2012). The most recent phreatic eruptive sequence, in 1976–1977, ranked amongst the longest and most energetic ones (Le Guern et al., 1980; Feuillard et al., 1983; Hincks et al., 2014). After a decade of post-eruptive quiescence La Soufrière has entered since 1992 a new phase of fumarolic and seismic unrest, whose evolution has previously been described in detail (Allard et al., 1994; Komorowski et al., 2005; Villemant et al., 2014; Rosas-Carbajal et al., 2016; Tamburello et al., 2019; Moretti et al., 2020a; Jessop et al., 2021; Metcalfe et al., 2021).
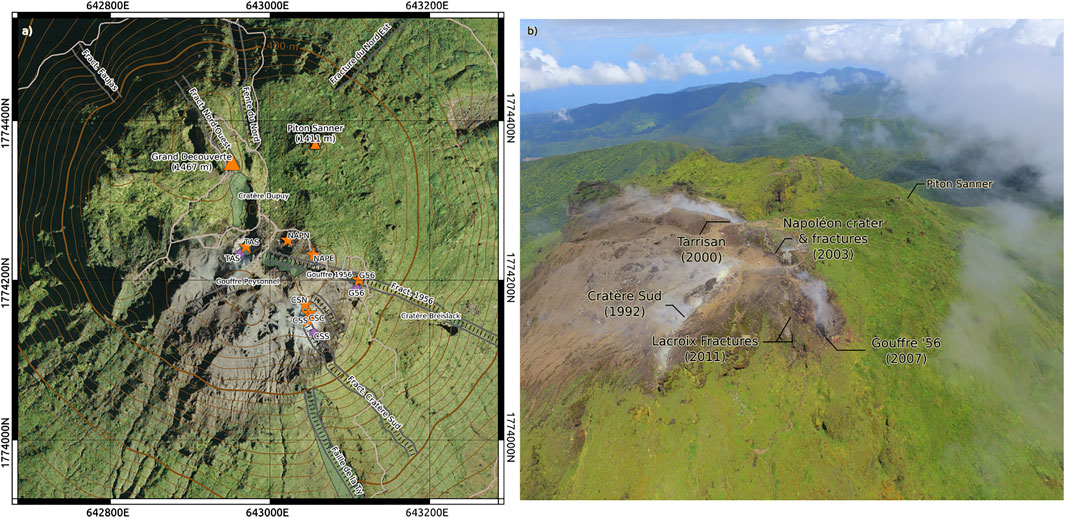
FIGURE 1. (A) Map of the summit of La Soufrière de Guadeloupe (1467 asl) showing the main geological features/fractures, the location of the fumaroles sampled via the MultiGas portable (orange stars: Tarissan, TAS; Cratère Sud-Sud, CSS; Cratère Sud-Centre, CSC; Cratère Sud-Nord, CSN; Gouffre 56, G56; Napoléon Nord, NAPN; Napoléon Est, NAPE) and the location of the three permanent MultiGas stations (purple stars; G56: 643,545 E, 1774499 N; TAS: 643,388 E, 1774541 N; CSS: 643,489 E, 1774441 N). Modified from Jessop et al. (2021). (B) Photo of the main active fumaroles with the date of appearance in brackets. Modified from Jessop et al. (2021).
Persistent hydrothermal activity at La Soufrière is sustained by heat and gas transfer from a 6–7 km deep (b.s.l.) andesitic magma reservoir to shallow aquifers (e.g., Feuillard et al., 1983; Touboul et al., 2007; Allard et al., 2014; Pichavant et al., 2018). Magma-derived gases likely rise through deep fractures in the overlying basement, then interact with the hydrothermal system hosted in a shallower porous and fractured rock body beneath the volcano. Gas mixtures of magma-derived and hydrothermal components then migrate through the most permeable fractures cutting the lava dome to sustain fumarolic activity at the summit. The intense activity of the La Soufrière volcanic-hydrothermal system constitutes a potential threat for several tens of thousands of people living in the immediate surroundings and concern has risen with the increasing degassing unrest over the past 2 decades. This unrest peaked in energy with 1) the highest magnitude felt volcanic-tectonic (VT) event since 1976 (M 4.1 on April 27, 2018; for all characteristics of this event see Moretti et al., 2020a) that was preceded by 350 VTs (2 of which felt) in the previous weeks, 2) horizontal deformation and fracture opening of the lava dome, and 3) gas pulses linked to heating and pressurisation of the hydrothermal system shown by gas geochemistry and consistent with Vp/Vs negative anomalies which determine the rock cracking upon pore pressure build-up in a two-phase fluid (Moretti et al., 2020a; OVSG-IPGP 1999–2021 bulletins). This sequence was interpreted as being due to an enhanced supply of magma-derived gas to the shallow hydrothermal system, whose overpressurization effect could safely be released as the system was sufficiently fractured and opened enough (Moretti et al., 2020a). The total heat output from La Soufrière has recently been re-evaluated at 36.5 MW (Jessop et al., 2021). As most of this thermal release concerns a relatively small area, the heat flux density at La Soufrière (1,366 ± 82 W/m2) is amongst the highest for volcanoes in hydrothermal activity (Jessop et al., 2021). Concurrent with the accelerating unrest, heat loss through the ground at the summit has also increased from 0.2 ± 0.1 MW in 2010 to 5.7 ± 0.9 MW in 2019–2020 (Jessop et al., 2021), leading to the development and extension of a widespread region of alteration and thermal anomalies. In summary, La Soufrière is a perfect target for improving the understanding of processes controlling volcanic-hydrothermal unrest in a tropical environment.
Since 1992 regular gas sampling and analysis of La Soufrière fumaroles (96°–110°C) has been performed at Cratère Sud (CS), the most active and single accessible vent (Brombach et al., 2000; Allard et al., 2014; Villemant et al., 2014; Moretti et al., 2020a; Figure 1). CS hosts three different fumarolic vents: CSS, CSN and CSC (Figure 1). Since July 2014, a newly opened vent (Napoléon Nord, NapN; Figure 1) has additionally been sampled regularly. Until now CSC and NapN are the only two vents on La Soufrière that have been accessible for gas sampling using Giggenbach bottles (Giggenbach and Goguel, 1989). Fumarolic emissions from the other main vents, such as Gouffre 56 (G56), Tarissan (TAS), Napoleon Est (NapE; Figure 1), were more recently measured in-situ using MultiGas devices (Aiuppa et al., 2005; Shinohara, 2005). Both G56 and TAS are pit craters with an acid lake present in the latter one. Discrete MultiGas measurements were performed in 2006 and 2012 (Allard et al., 2014) then during three field campaigns between May 2016 and October 2017 (Tamburello et al., 2019). These studies revealed a three-fold increase of the fumarolic gas fluxes between 2012 and 2016, contemporaneous with a widening of fractures cutting the summit lava dome and an increased permeability of the system (e.g., Allard et al., 2014). On the other hand, the compositional variability of the fumaroles observed in 2016–2017 was shown to result from the influence of 1) shallow processes (SO2 scrubbing and near-surface T-related sulfur precipitation in the ground) related to the circulation of hydrothermal fluids inside the lava dome and 2) widening/closing of fractures cutting the dome (Tamburello et al., 2019). It was argued that current gas emissions from peripheral vents on the summit dome (G56, NapN, NapE; Figure 1) were less affected by acid gas scrubbing in the hydrothermal aquifer and thus more representative of the pristine magmatic-hydrothermal gas end-member than more central vents (CS, TAS) (Tamburello et al., 2019). Steam fluxes did not vary significantly since early 2016 (Jessop et al., 2021).
3 Methods
3.1 MultiGas
3.1.1 Field Measurements
Since 2016 we determined the fumarolic gas compositions on top of La Soufrière by using MultiGas to measure the concentration ratios in air-diluted plumes from the different active vents. This was realized via i) monthly measurements with a portable instrument at all vents (orange stars in Figure 1A) and ii) a continuous survey with MultiGas stations installed at downwind proximity to the three main vents (CS, TAS and G56; purple diamonds in Figure 1A). Fumarolic plumes were pumped at a constant flow rate of 1.0–1.5 l/min through the inlet tube of the instruments, equipped with a PTFE filter (1 μm) and positioned at 0.5–1 m height above the ground (in order to minimize any influence from soil degassing).
All MultiGas instruments used in this study combined a Gascard IR spectrometer for CO2 determination (calibration range: 0–3,000 ppmv; accuracy: ±2%; resolution: 0.8 ppmv) and City Technology electrochemical sensors for SO2 (sensor type 3ST/F; calibration range: 0–200 ppm, accuracy: ±2%, resolution: 0.1 ppmv) and H2S (sensor type 2E; range: 0–200 ppm, accuracy: ±5%, resolution: 0.7 ppmv). Atmospheric pressure was recorded by the sensor installed on the CO2 spectrometer card. All sensors were connected to a Campbell Scientific CR6 datalogger for data capture, acquisition and logging at 1 Hz. Power was provided by a couple of 12 V batteries for the permanent stations and by a Li battery for the portable instrument. All sensors were calibrated in the laboratory using target gases of known concentration every 2 months and before installation. Our portable MultiGas also included a GPS receiver to record its position at 1 Hz and a relative humidity (RH) sensor (Galltec, range: 0–100% RH, accuracy: ± 2%) coupled with a temperature sensor (range: −30 to +70°C, resolution: 0.01°C), both fixed externally, which permit indirect determination of the water vapor concentration in plumes as described by Moussallam et al. (2017). H2O determination with these external sensors allowed us to minimise the potential influence of steam condensation within the MultiGas inlet tubing. However, due to rapid partial steam condensation in the fumarolic plumes emitted under the tropical conditions on top of La Soufrière, our measured water/gas ratios are unavoidably underestimated by approximately 35% (Gaudin et al., 2016; Jessop et al., 2021).
The three permanent MultiGas stations, installed in 2016–2017, were programmed to measure during four 20-min long sequences per day, with data recorded at 0.33 Hz and transmitted in real-time via Wi-Fi to the 8-km distant volcano observatory (OVSG-IPGP). Calibration of the permanent stations has been tested regularly in the field by measuring the same gas as the portable instrument (the inlets were close together). However, the network had to be partly re-installed after strong hurricanes in September 2017 (Saurel et al., 2020) and repeatedly suffered from the very hostile conditions prevailing on top of La Soufrière, among which the huge rainfall rate of 10 +/− 2 m/year (e.g., Villemant et al., 2014), with RH generally close to 100% (OVSG-IPGP 1999-2021 bulletins; Allard et al., 2014), and a strong corrosion by acid gases. The challenges encountered at the summit of La Soufrière were that the filters were saturated very quickly (within 2–3 weeks) allowing acid water droplets to enter the system and damaging the pump, and sometimes the sensors themselves. The electronic part of the CO2 IR sensor was more sensitive than the electrochemical ones and the board was damaged more often. As a consequence, large gaps exist in our data set.
With our portable MultiGas, gas concentrations were measured in each plume at 1 Hz during 10–20 min and the data were displayed in real-time on a hand-held tablet connected via Wi-Fi link to the instrument. Furthermore, following previous demonstrations by Allard et al. (2014) and Tamburello et al. (2019), the same instrument was used to determine fumarolic gas fluxes from the three main vents contributing most the gas output and where the fumarolic emissions are strong enough to generate a plume: CS, TAS and G56. We determined these gas fluxes monthly since May 2018. For this, the horizontal and vertical distributions of gas species in the plume cross-sections were measured at two different heights (typically 0.9 and 2 m) during walking traverses orthogonal to the plume direction, a few meters downwind from the vents. Most commonly the fumarolic plumes were flattened to the ground by strong trade winds (up to 14 m/s) and their upper boundary stood at ca. 3–4 m above the ground, with a maximum gas density centred at between ∼1.5 and 2 m above the ground (our visual observations; Gaudin et al., 2016; Tamburello et al., 2019). Wind speed was measured with an anemometer at the same height than the MultiGas inlet during all traverses.
Despite many challenges due to ambient meteorological conditions, steam condensation and corrosion by acid gases, we could thus use MultiGas instruments to survey La Soufrière fumarolic gas emissions over the entire summit dome and at a reasonably high frequency. In the case of high (>250°C) temperature fumaroles, MultiGas measurements produce chemical results that are closely similar to direct analyses of direct fumarole sampling via Giggenbach bottles (Aiuppa et al., 2005; Aiuppa et al., 2007), undoubtedly the best technique for a precise determination of vent outlet gas composition. Moretti et al. (2020b) demonstrated that this also applies to low-temperature fumaroles (∼100°C) at La Soufrière, despite some minor offset due to secondary phenomena such as gas scrubbing from water droplets in air and diffusive-effusive gradients in the MultiGas inlet pumping line. Finally, because the oxidation of H2S into SO2 can be faster under humid (RH > 90%) tropical conditions than in cold and less humid environments, we followed the recommendation by Allard et al. (2014) of analysing fumarolic plumes at La Soufrière at short distance (<20 m) from their source vent. However, in case of G56 and TAS, the plume has already risen few tens of meters from their deep pit crater before arriving at the surface.
3.1.2 Data Processing
MultiGas data were post-processed at the OVSG-IPGP. Gas ratios were derived from linear regression of the concentrations of each component referred to H2S, this latter being of purely volcanic origin. Such a simple procedure does not require any correction for the atmospheric background in case of CO2 and H2O, which are both volcanic and atmospheric components. In order to minimise residuals, we tested two different methods: the commonly used least-square method (e.g., RatioCalc; Tamburello, 2015) and the least-absolute difference method. Both methods were found to yield similar ratios, even though the latter method is known to be less sensitive to outliers (Bloomfield and Steiger, 1983; Dodge, 1997). Following Roberts et al. (2014), we constrained the t90 behaviour (the time required to reach 90% of the final signal following a step change in gas abundance) of our sensors via calibration tests with various gas mixture ratios. Our t90 tests were performed outdoors at the observatory with similar conditions as at the summit (same inlet tubing and high humidity (RH close to ∼80% outside the OVSG while at the summit the RH ranges from 80 to 95% during our measurements). Our sensor response is characterised as follows (Figures 2A,B): CO2 (t90 = 21 s), H2S (t90 = 26 s), H2 (t90 = 50 s) and SO2 (t90 = 58 s). We did not test the interference of SO2 on H2S since there is little to no SO2 in La Soufrière gas emissions. However, for a cross-sensitivity typically of order 15% of SO2 over H2S (Roberts et al., 2017), we estimated the interference based on mean SO2 and H2S measurements in the plume to be about 1%, so that it can considered negligible. Hence, all gas pulses with a duration <26 s for the CO2/H2S ratio and <60 s for both SO2/H2S and H2/H2S ratios are not well-captured by our sensors. In order to overcome this, we applied a low-pass filter at either 26 or 60 s (Figures 2C,D) depending on the ratios. The effects of filtering on the gas ratios, and the associated R2 and errors have been investigated for filters at 20, 60 and 120 s, as shown in Figure 2E. The gas ratios in non-filtered and filtered datasets are quite similar (<6% difference) but we improve the R2 (typically 0.83–0.95) and the 2σ errors on the calculated gas ratios are decreased by a factor up to ∼ two (Figure 2E).
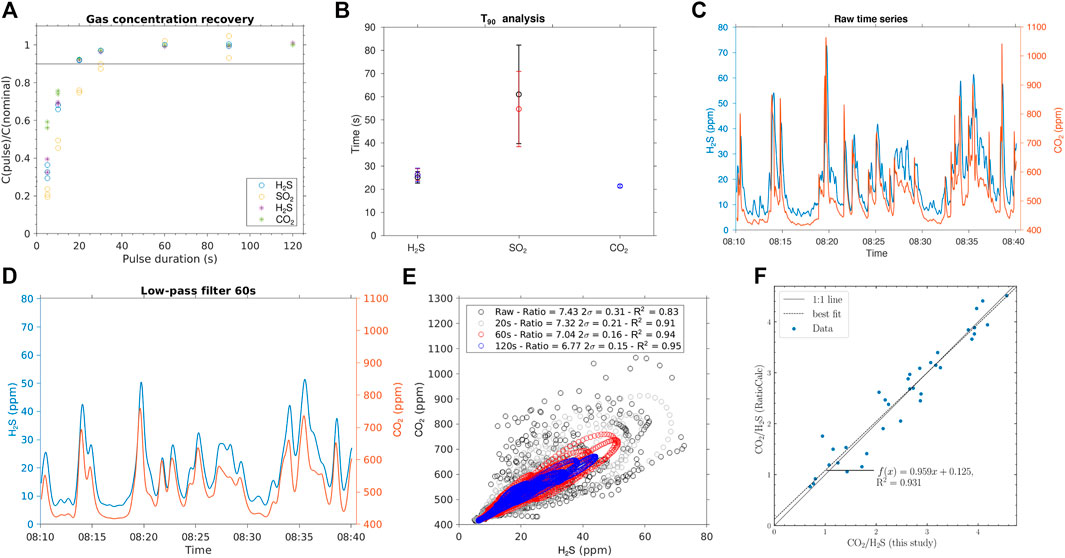
FIGURE 2. (A,B) t90 behavior of the different sensors (H2S, SO2, CO2). For H2S, we tested two concentrations (100 and 40 ppm) (C) Raw H2S and CO2 time series at CS (D) Same H2S and CO2 time series at CS, but after a 60 s low-pass filter (E) The resulting CO2/H2S ratios with low-pass filter with various thresholds [raw (i.e., no low pass filter), 20 s low-pass filter, 60 and 120 s low-pass filter]. The gas ratios between non-filtered and filtered dataset are quite similar (<6% of difference) but we improve the R2 (typically 0.8 to 0.9) and 2σ errors on calculated ratios are decreased by a factor up to ∼ two. (F) Comparison, for the fumaroles of CS, between the CO2/H2S ratios processed in this study and the CO2/H2S ratios calculated with the RatioCalc software (Tamburello, 2015). The best fit shows a very good agreement between these two data post-processing.
The dataset filtered using the least-absolute difference method was then cross-correlated to correct the shift between two signals and selected on the basis of several criteria, such as R2 > 0.6 and a CO2 baseline (background composition) < 490 ppm. Moreover, given the low SO2 content of La Soufrière gases we only post-processed the SO2/H2S ratio when the average SO2 concentration was higher than the resolution of our SO2 sensor (0.5 ppm). This threshold gives us confidence in our reported SO2/H2S ratios. CO2/H2S ratios were corrected for the effect of pressure. Some of the gas ratios presented in this paper were processed using the RatioCalc software (Tamburello, 2015) and have previously been reported in Moretti et al. (2020a), Moretti et al. (2020b), Jessop et al. (2021) and Massaro et al. (2021). When re-evaluating these data with our improved processing approach we obtain gas ratios that are in a good agreement with the earlier results (see example for CO2/H2S ratio at CS: Figure 2F). Gas molar ratios and concentrations (ppm by volume) from our MultiGas-based monitoring of La Soufrière are given in Tables 1, 2 and Figures 3, 4, 5.
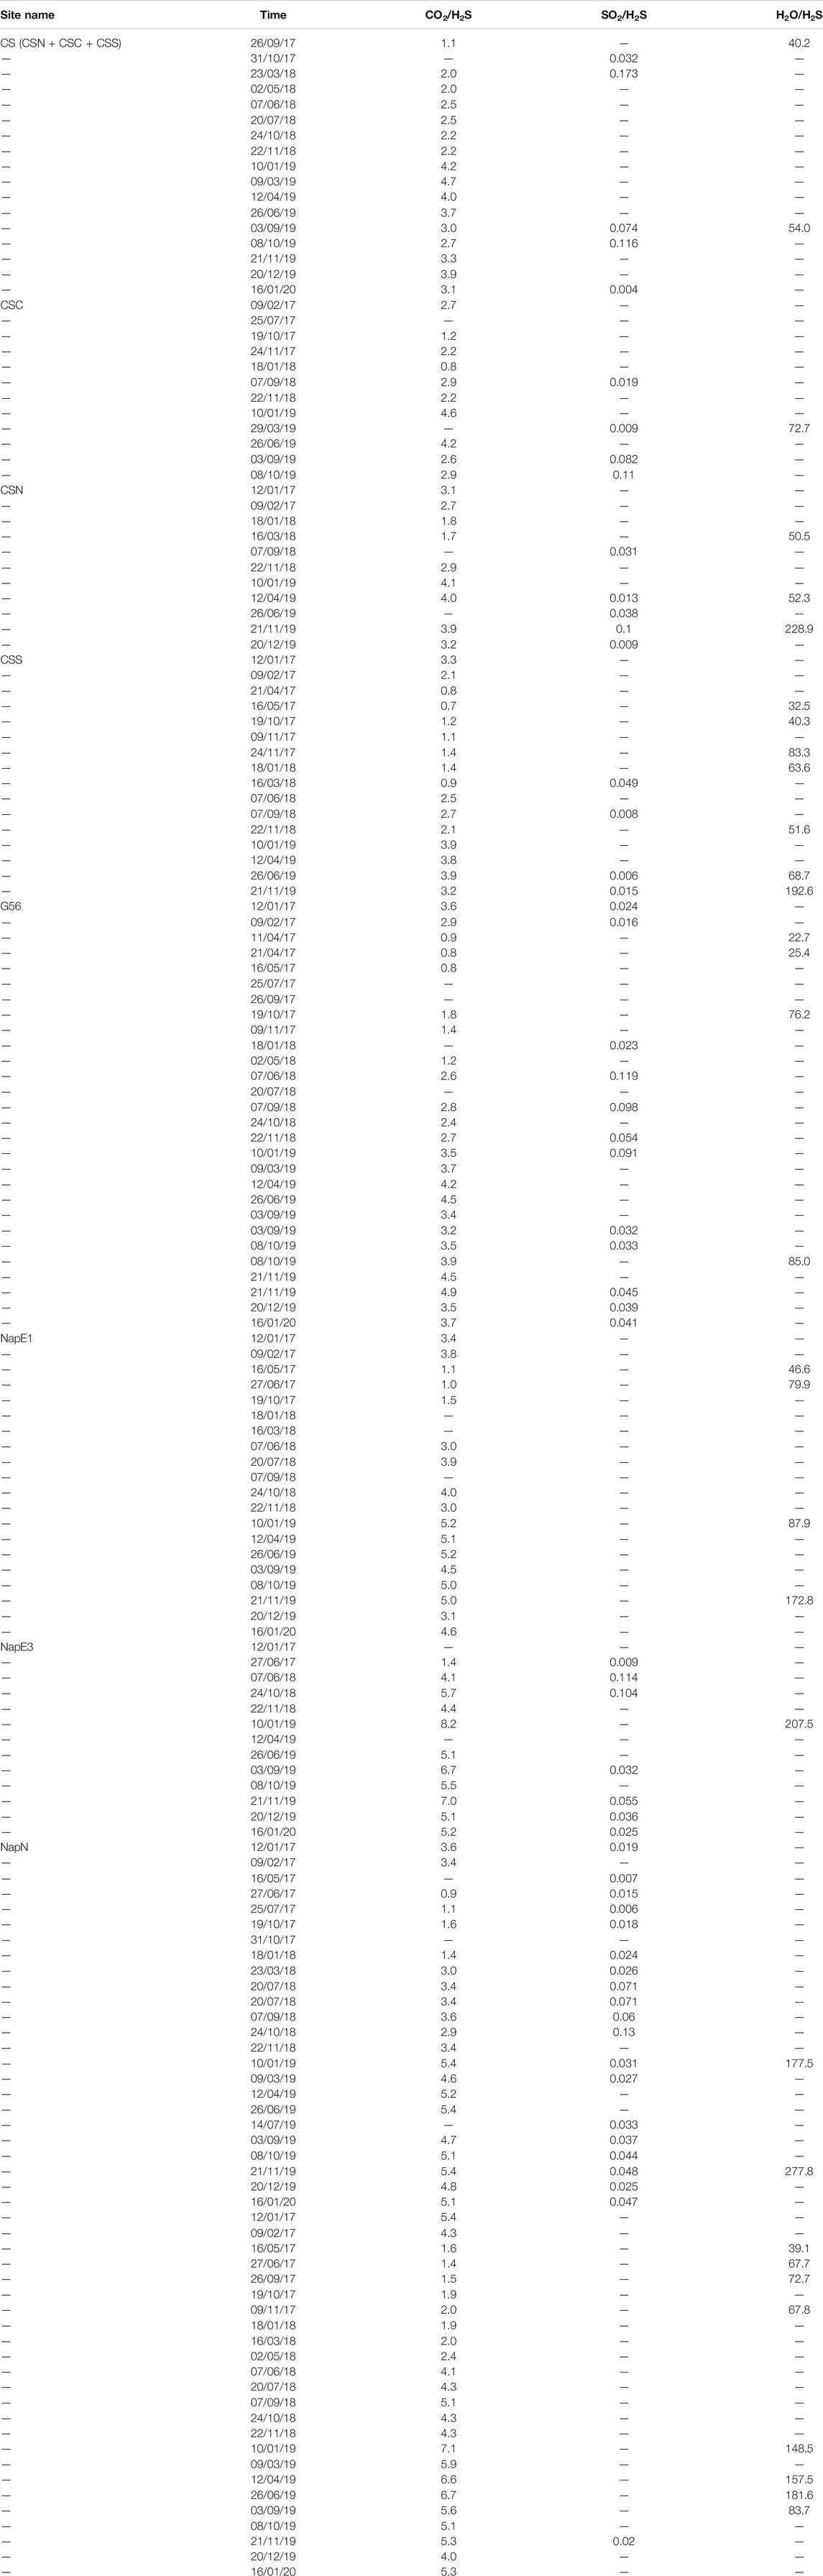
TABLE 1. Molar gas ratios in fumarolic emissions from La Soufrière volcano measured with portable MultiGas in 2017–2020.
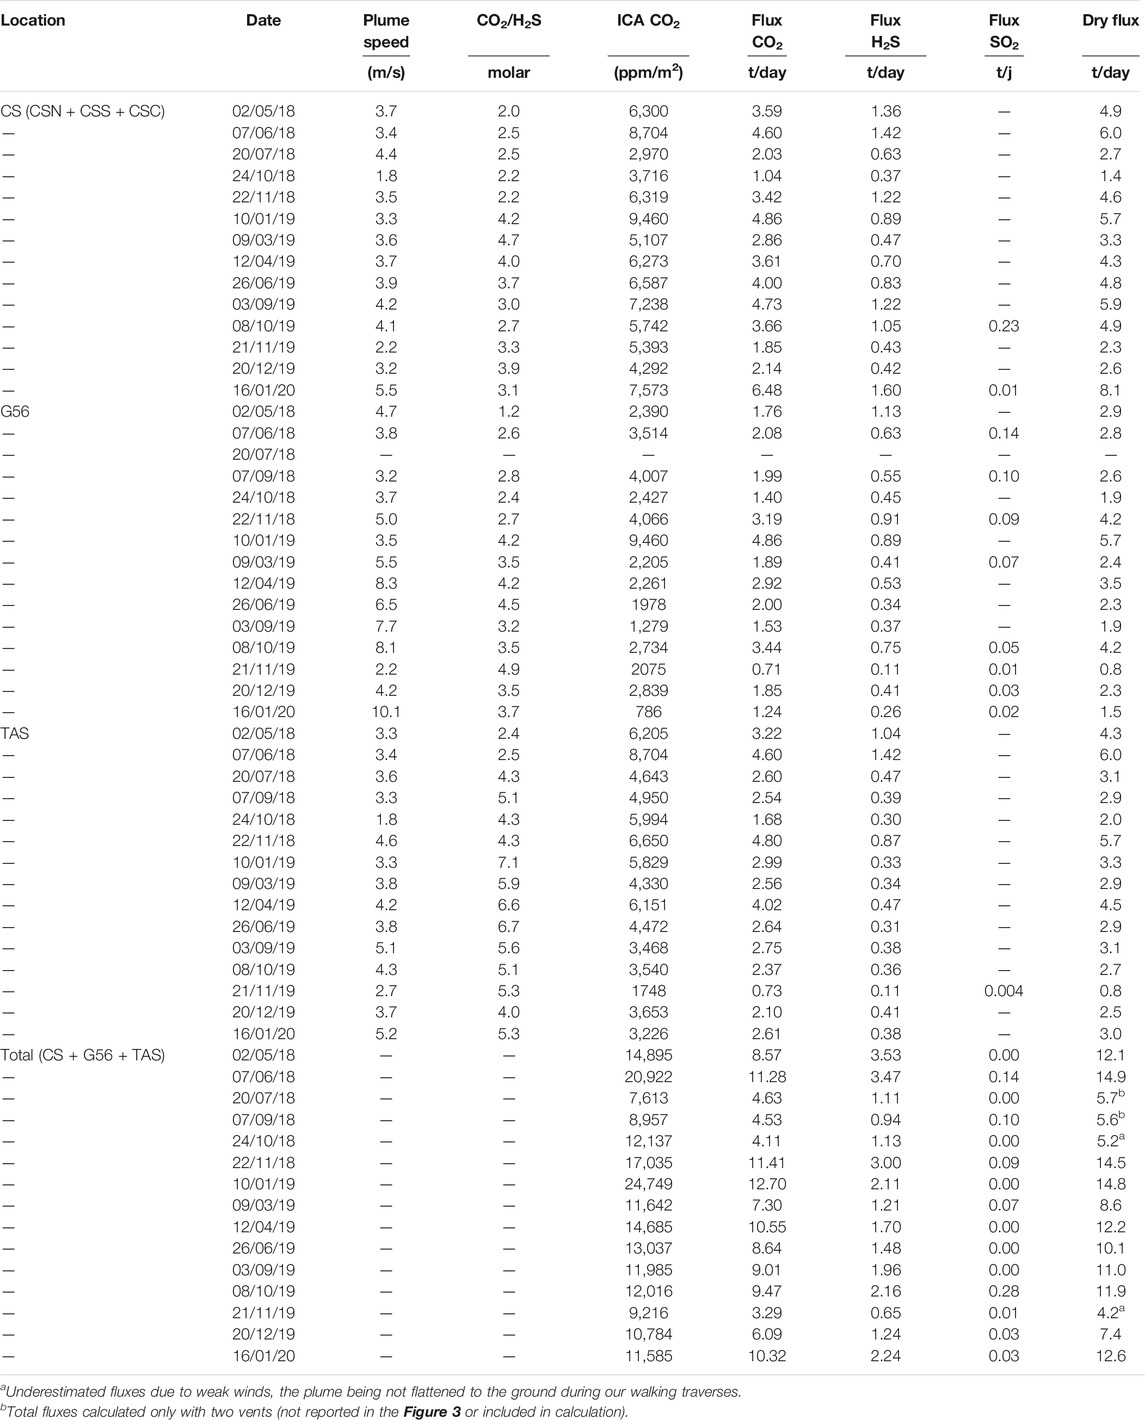
TABLE 2. CO2, H2S and SO2 fluxes in tonnes per day, at La Soufrière in 2018–2020, computed from CO2 ICAs and gas moral ratios (Table 1). Dry gas flux is calculated as the sum of CO2, H2S and CO2. Wind speeds used for gas flux calculation are indicated. The sensors heights above the ground during the MultiGas traverses were always the same (90 cm and 2 m).
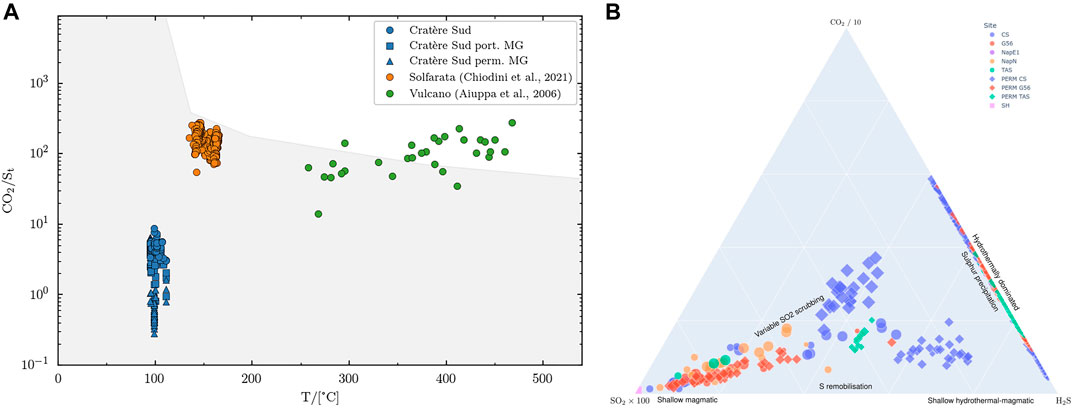
FIGURE 3. (A) Temperature vs. CO2/St (St = H2S) gas ratios for La Soufrière at Cratère Sud fumaroles (CS). Both MultiGas settings are shown: orange dots for portable MultiGas, green dots for permanent MultiGas, while the blue ones correspond to the Giggenbach bottle results. The grey shaded area represents the temperature dependence of CO2/St gas ratios in published analyses of volcanic arc gases (Aiuppa et al., 2017) while the other data correspond to Vulcano and Solfatara low-temperature fumarolic emissions obtained by Giggenbach bottles. (B) Ternary plot of CO2/10-H2S-SO2*100 of La Soufrière emissions measured by MultiGas (permanent and portable) representing the proposition of each species. Maximum concentrations for CO2, H2S and SO2 for each measurement are shown. Colors are different by site, circles represent portable MultiGas, squares permanent MultiGas, and the size of the symbol indicates the period of interest (P1 and P3 having smallest and biggest symbols, respectively). The Montserrat-type magmatic end-member is shown as a square symbol.
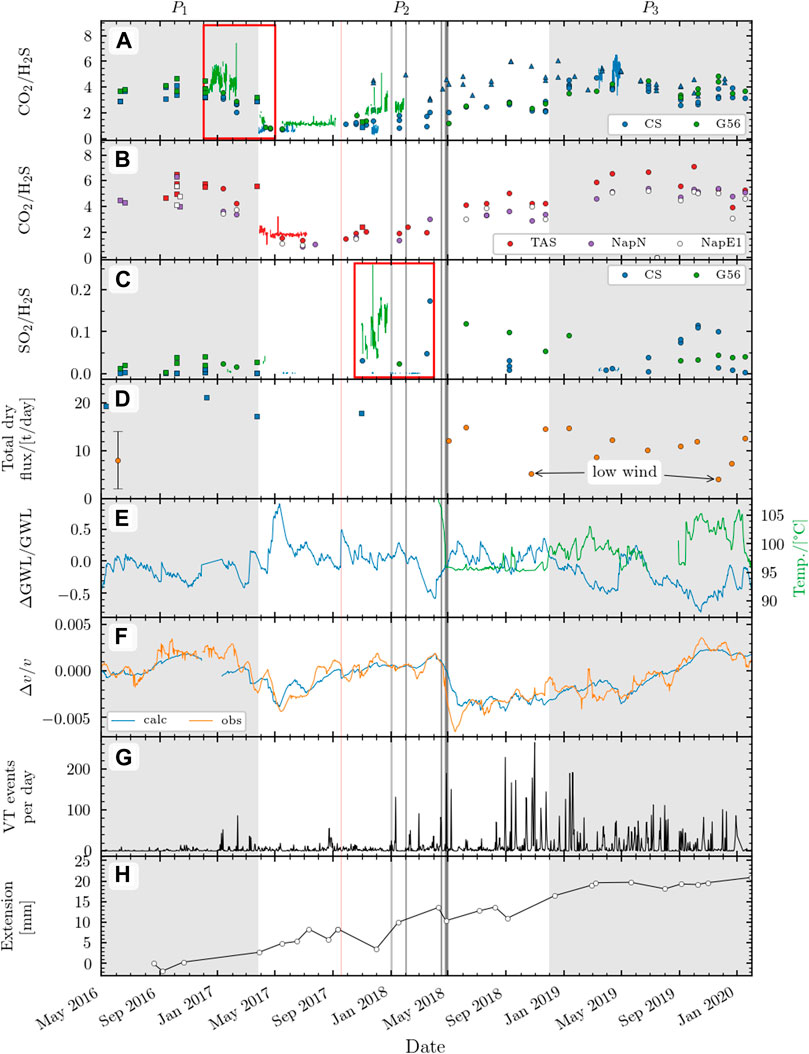
FIGURE 4. Time series of volcano monitoring for La Soufrière since 2016. (A–D) MultiGas data: (A,B) Molar CO2/H2S ratios for four main fumarolic vents, (C) Molar SO2/H2S ratios only for CS and G56, (D) Total dry gas fluxes (CO2 +SO2+ H2S fluxes at CS, G56 and TAS). MultiGas square data are from Tamburello et al. (2019). (E) Groundwater table level (m) along with temperature (°C) (F) Relative velocity fluctuations dV/V, observed and calculated. (G) Seismic activity showing volcanic tectonic (VTs) counts per day. (H) extensometry data for NAP1 (m). Three different periods (P1, P2, P3) of chemical variations are identified. Major VTs are marked in grey and Maria hurricane in red line. Both red insets are periods focused in Figure 5.
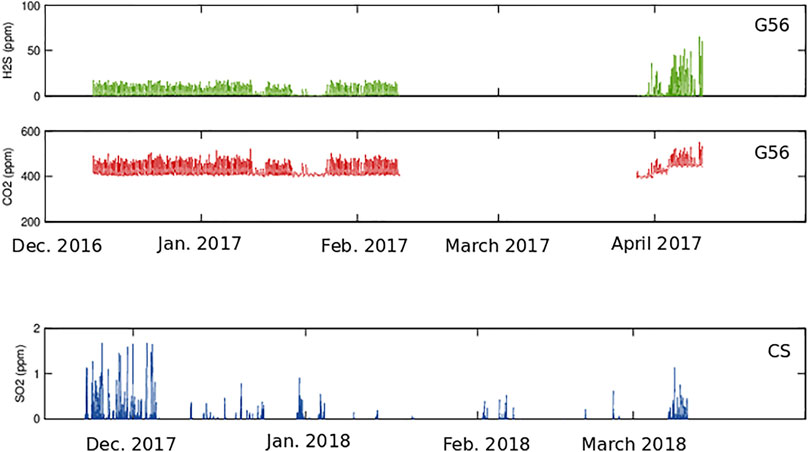
FIGURE 5. Inset focusing on SO2, H2S and CO2 concentrations of the MultiGas permanent stations during the transition between P1 and P2 (between December 01, 2016 and May 01, 2017), and during P2 (between November 15, 2017 and April 01, 2018) which encompasses the highest peak of activity on La Soufrière since 1976. Note that during P2, the H2S sensor of the permanent station at CS was saturated.
For determining the gas fluxes, we first interpolated the measured gas concentrations using a 2D spline function and then computed the integrated concentration amounts (ICAs) over the plume cross-section using RatioCalc (Tamburello, 2015). Tamburello et al. (2019) have shown that more reliable flux determination is obtained by using CO2 instead of H2S as the volcanic marker, owing to the more conservative behaviour of CO2 and the faster response of the IR CO2 sensor compared to the H2S chemical sensor. We thus followed this approach and computed CO2 fluxes by scaling the integrated CO2 column amount in plume cross-sections with the wind speed measured during each gas survey. The fluxes of other gas species were derived by scaling their average weight ratio to CO2 with the CO2 flux. Due to the high atmospheric background of CO2 and H2O, each of our walking profiles were started and ended in pure air in order to characterize and subtract the ambient air composition from our recorded data. The reported error on gas fluxes, which is typically of about 40%, includes the uncertainty on the measured average wind speed, usually the main source of error. Steam flux estimates are shown and discussed in Jessop et al. (2021). In this present work we focus on the dry gas fluxes that we measured and calculated in routine at the OVSG-IPGP since May 2018.
3.2 Seismic and Hydrology Properties
3.2.1 Relative Seismic Velocity Changes
Relative seismic velocity changes (dV/V) are deduced from the interferometry of ambient seismic noise correlation functions. It is widely used to monitor the rock properties and fracturation state of a medium through time (Snieder et al., 2002; Nakahara et al., 2007; Wegler and Sens-Schönfelder, 2007; Brenguier et al., 2008a; Gassenmeier et al., 2016). On active volcanoes, dV/V is a proxy of inflation/deflation at depth and could reveal precursory signals of future eruptions (Brenguier et al., 2008b). At shallow depths (<500 m), seismic velocity changes are influenced by environmental forcing. Several studies have explored the potential use of dV/V to monitor the hydrology of medium (Sens-Schönfelder and Wegler, 2006; Lecocq et al., 2017; Clements and Denolle, 2018; Illien et al., 2021). Groundwater level changes modify the water saturation in the medium and modify the seismic velocity. This variation can range from less than 1% up to 10%. Comparing a reference groundwater level, representing for instance the average level at a hydrological season scale, and a reference state of the medium seismic properties, given by an average noise correlation function over a long time period, a higher (lower) groundwater level will produce a decrease (increase) of seismic velocity. This decrease (increase) of seismic velocity produces slight modifications in the medium Green’s function by dilating (compressing) the coda waveform of a noise correlation function (Hadziioannou et al., 2009; Sens-Schönfelder and Wegler 2011). To properly interpret the dV/V at shallow depths, we must consider a possible influence of groundwater level changes, especially in a tropical environment with high cumulative rainfall (>8 m/year), such as in La Soufrière.
In this study, the seismic velocity changes are processed from the continuous seismic signal recorded by the OVSG permanent array. Noise correlation functions are computed at a daily scale for each station couple and seismic components. The daily relative velocity changes (dV/V) are deduced from a stretching technique and with a reference Green’s function averaged over more than 3 years (e.g., Sens-Schönfelder and Wegler 2011). Finally, to better reflect the changes at the dome, we use all dV/V records and we spatialise them using a region of +/− 500 m around the Tarissan pit. The spatialization is an equivalent to a weighted mean by the length of the ray path crossing the region of interest. This observed relative velocity changes (dV/V obs.) are shown in Figure 4.
3.2.2 Groundwater Level Modelling
Having an estimate of the groundwater level at La Soufrière is not possible since no monitored borehole is available. However, in order to obtain at a first order an estimate of groundwater fluctuations, we use an alternative approach to quantify the dynamics of the aquifer. Groundwater is known to be tightly linked to rainfall. Since the dome is the top part of a large watershed no other contributor than rainfall is expected. Water advection due to hydrothermal circulation is only a minor contributor. We thus reconstruct the groundwater level through time with rainfall records according to Akasaka and Nakanishi (2000). In such a model, the aquifer is described by Darcy’s law and the drainage is proportional to the height of the groundwater table. At a time ti, the groundwater level results from the convolution of rainfall with an exponential function and aquifer parameters according to the expression
where GWL0 is the asymptotic groundwater level, φ the connected porosity, τ the drainage characteristic time and p (tn) the rainfall at time tn. Rainfall input for the hydrological model is estimated from an average of three rain gauges all located at la Soufrière (Sanner (16.04497°N, 61.66272°W, 1,076 m) and Savane à Mulets (16.038540°N, 61.665190°W, 1,139 m) managed by OVSG, and Citerne (16.03270°N, 61.65583°W, 1,076 m) managed by Meteo-France).
To estimate the aquifer parameters (GWL0, φ and τ), we chose to model the groundwater level following Eq. 1 and we fit a linear relation with the monthly observed level of the Tarissan lake. In such an approach, we assume that the Tarissan lake level is a direct proxy of the aquifer level, a first order equivalent to monitored borehole. This assumption being a drastic constraint for the modelling of the groundwater level, we also convert the absolute variation of the groundwater level to a relative level, which can be interpreted as an anomaly of groundwater content in the medium. The normalization stage is defined by an average groundwater level GWLyear, corresponding to the mean level for the year 2018, and a range of fluctuation ΔGWLyear, corresponding to the difference of extreme values of the same year. We end with an equivalent of an anomaly of groundwater level dGWL/GWL defined as
The asymptotic level is discarded by the term GWLyear and the connected porosity by ΔGWLyear. The final signal for groundwater anomaly is given in Figure 4. A negative anomaly will reflect a lower level of the groundwater with respect to the average and a positive anomaly an excess of water in the aquifer. The only parameter to invert is the drainage characteristic time and is estimated to be 40 days. This value is coherent with the results from hydrologeogical tracing by Bigot et al. (1994) that pointed to a fracture-dominated groundwater transport at the scale of the entire dome.
Finally, we use the groundwater anomaly to calculate the induced relative velocity fluctuation (dV/V calc; Sens-Schönfelder and Wegler, 2011) and we compare with the observed relative velocity changes (dV/V obs). Most of the time the calculated and observed dV/V are showing coherent fluctuations implying that velocity changes at sub-surface are driven by the aquifer dynamics. Nevertheless, some discrepancies are observed, like after the April 2018 M.4 earthquake where an important velocity drop is noticed. This drop explained by the damaging of the sub-surface following the solicitation of the seismic waves after the main shock. Such an observation has been widely documented for other context (e.g., Brenguier et al., 2008a; Takagi and Okada, 2012). Other periods of discrepancies could be related to geochemical signals and are discussed in the following sections.
Details of the seismic, extensometry and temperature networks and methods are available in Jacob et al. (2005), Tamburello et al. (2019), Moretti et al. (2020a), Jessop et al. (2021). Seismic data are distributed by IPGP on the public access Volobsis server (http://volobsis.ipgp.fr) and the Data center (http://datacenter.ipgp.fr). Rainfall data from Sanner and Savane à Mulets as well as the Tarissan lake level are available on request from OVSG.
4 Results
4.1 Gas Compositions
Our nearly 4-year long surveys of La Soufrière gas emissions with both portable and permanent MultiGas show a wide temporal variability in gas compositions (Figures 3, 4). However, for a same vent at a given date both portable and permanent MultiGas provide consistent compositions (Figures 3, 4), except for small differences observed at CS. The latter simply result from the fact that few portable measurements were performed during the lifespan of the permanent station at CS and, moreover, not always at the same CSS vent monitored by the permanent MultiGas station. On the other hand, the temporal variability in gas compositions revealed by our MultiGas measurements at CS is also confirmed by the data obtained from direct fumarole sampling via Giggenbach bottles over the same timeframe (Figures 3, 4), even though the chemical variability from the bottles is narrower. One can observe a minor offset between these two techniques, mainly due to secondary effects in the MultiGas inlet line (Moretti et al., 2020b). This offset is minimized from Dec. 2019, since when very high exit vent emission velocities were observed (see IPGP-OVSG 1999–2021 Bulletins).
Over the studied period, both MultiGAS setups reveal CO2/H2S ratios varying over an order of magnitude, from <0.5 to >6, and SO2/H2S varying from 0 to ∼0.25 (Table 1; Figures 3, 4). The CS fumarole temperatures varied from 93 to 107°C (Figures 3, 4), which is typical of hydrothermally-dominated emissions (Giggenbach, 1995; Aiuppa et al., 2017; Figure 3A). However, the observed large compositional variations of La Soufrière fumaroles also indicate a magmatic influence (compositions richer in SO2 in such ternary diagram; Giggenbach, 1996; Stix et de Moor, 2018; Moretti et al., 2020a; Figure 3B). After steam, CO2 and H2S are the predominant species in the fumarolic gases and hence contribute most of the total dry gas flux (Table 2). Taking SO2 fluxes also into account, we find that the total dry gas flux has diminished roughly by a factor of two from 2016 (∼19 ± 2 tons/day) to 2020 (11 ± 3 tons/day; Table 2, Figure 4). We actually observe a decrease in gas flux at all the main vents in this period (Table 2). The lowest values measured in October 2018 and November 2019 may simply be biased by the very weak winds that prevailed on occasion of these two measurements, as the low wind did not allow us to catch the whole volcanic plume during our walking traverses.
4.2 Meteorological Forcing and Geophysical Signals
The normalised water table level ranges from −0.8 to 0.9, with its lowest peaks occurring during dry seasons and its highest values observed during an abnormal rainy period in May 2017 and Hurricane Maria in Sept. 2017 (Figure 4). The fumarole temperature seems to be anti-correlated with the variation of the normalised water-table level, with higher temperature when the water table level lowers. Major fluctuations of the observed and calculated dV/V ratios are shown in Figure 4. These fluctuations are almost identical for both curves, meaning that the dV/V variations are mostly controlled by the normalised table water level variation (dGWL/GWL; Figure 4). Despite the overall background nominal control on the dV/V behaviour by external forcing, some differences between calculated and observed dV/V can be identified, such as after the April 2018 M.4 earthquake where a important velocity drop is noticed. This drop is explained by the damaging of the sub-surface following the solicitation of the seismic waves after the main shock. Such an observation has been widely documented for other contexts (e.g., Brenguier et al., 2008a; Takagi and Okada, 2012). Other periods of discrepancies (late March 2017, late February 2018 and December 2019; Figure 4) could be related to geochemical signals and are discussed in the following sections. These differences underline the need of internal forcing to explain the dV/V variability.
The increase in the occurrence of VT seismicity is positively correlated to the general tendency of increased opening of almost all fractures in the active fumarolic zones since May 2017 as determined with one-dimensional extensometry measurements (Moretti et al., 2020a; OVSG-IPGP 1999–2021 bulletins). Gouffre Napoleon (NAP1) is the site affected by the largest extension (∼20 mm in 3 years) and is shown in Figure 4. However, the periods from mid-2016 to mid 2017 and since Jan. 2019 are marked by much lower extension rates (Figure 4, bottom panel).
4.3 Temporal Variability
We identify three distinct periods in our 2016–2020 data set during which gas emissions from all vents followed a similar general trend (cf. shaded regions in Figure 4). These periods are defined as P1 (March 2016–April 2017), P2 (April 2017–December 2018) and P3 (December 2018–January 2020).
The P1 period was characterised by high CO2/H2S (∼4 at CS and G56; ∼5 at TAS, NAPN and NAPE1) and low SO2/H2S (<∼0.015 at all sites), followed by a drastic decrease in the CO2/H2S ratio. This rapid and abrupt decrease occurred in late March 2017 and was observed simultaneously at all vents (Figure 4). During this period the dry gas fluxes were high and stable at all sites (CS: 7+/−1.5 t/d; G56: 6+/−2.7 t/d; TAS: 6+/−2 t/d; Table2; Figure 3; Tamburello et al., 2019). A gap in measurements between April and October 2017 makes it impossible to assess any change in gas flux. The water table level remained mostly below the reference level (range: −0.43 to 0.16; average: −0.15) and the fluctuation in observed dV/V ratios are well reproduced by the model (dV/V cal., Figure 4). However, by late March 2017 a significant negative dV/V anomaly occurred; this cannot be explained by external forcing (Figure 4). Overall the occurrence of VT seismicity was relatively low during the P1 period and the lowest of the entire 2016–2020 period of analysis. In the same time the extensometry survey showed little to no opening or closure of the active faults on top of the dome (OVSG-IPGP 1999–2021 bulletins, Figure 4). However, a change in extension rate became observed from late March 2017, especially at NAP1 (Figure 4). In January, February and March 2017, small seismic swarms also started to occur.
The P2 period was instead characterised by low CO2/H2S (∼1 at CS and G56; ∼2 at TAS, NAPN and NAPE1) and low SO2/H2S (<∼0.015 at all sites) ratios, followed by a strong chemical perturbation from November 2017. This chemical perturbation occurred months before the four seismic swarms of January 2018 (70 events), February 2018 (30 events, 1 felt), mid-April (140 events, 1 felt) and late April 2018 (180 events, 2 felt) (Figure 4; Moretti et al., 2020a). During the latter swarm, La Soufrière reached its highest level of release of seismic energy on April 27, 2018 with the largest felt volcanic-tectonic (VT) earthquake (ML 4.1) since the last eruption in 1976 (Moretti et al., 2020a). The perturbation is first characterised by an increase of both CO2/H2S and SO2/H2S at G56 (permanent station at the beginning of Nov. 2017; Figure 4). During this period, chemical ratios involving H2S from the permanent station could not be estimated at CS because the H2S sensors became saturated. Instead, relatively high SO2 concentrations (almost up to 2 ppm) were measured by the permanent station at CS at the end of Nov. 2017 and also in March-April 2018 (Figure 5 and Moretti et al., 2020a). Trends from the permanent stations are coherent with the portable measurements, showing a similar maximum SO2/H2S ratio (0.18) at G56 in November 2017 then at CS in March 2018. This ratio was the highest ever measured at La Soufrière since the start of MultiGas measurements in 2012 (Figure 5 and Moretti et al., 2020a), implying a factor 2 increase in SO2. With such an increase of SO2, the geochemical composition of gas at CS and G56 but also the emissions of TAS and NapN, acquired in March 2018, shifted towards a typical andesitic magmatic end-member (Figure 3B). A small but significant increase in CO2/H2S was simultaneously observed at NAPN, and this ratio also increased significantly at NAPE1 and TAS 1 month later. From June to December 2018 there was a continuous decrease of the SO2/H2S ratio and a small increase of the CO2/H2S ratio all over the dome. Gas flux measurements from MultiGas traverses were not performed successfully from November 2017 to May 2018, making it difficult to infer any quantitative flux change during this major event. However, a noticeable decrease of the dry gas fluxes occurred after the major earthquake, by a factor up to ∼2 compared to 2016–2017 values (CS: 4.2 ± 1.8 t/d; G56 2.4 ± 1.4 t/d; TAS: 4 ± 1.6 t/d); Table 2; Figure 4), and Jessop et al. (2021) noticed, via Pitot tube measurements, that gas fluxes dropped by a factor 3 concurrent with this event. The anomalously low fluxes in October 2018 reflect partial plume analysis, as the low wind did not allow us to catch the whole volcanic plume during our walking traverses. The water table level stood mostly above the reference level (range: −0.59 to 0.9; average: 0.07), with the highest level by early May and the lowest one in April 2018 (Figure 4). In Sept. 2017, Hurricane Maria induced a sudden rise of the water table. The fluctuations in observed dV/V ratios are well reproduced by the model (dV/V cal., Figure 4) during P2. However, two negative and one positive dV/V anomalies occurred before and after the major VT events (late February and mid-May 2018) and in December 2019. These anomalies cannot be explained by variations in the normalised water table level (Figure 4). However, notable increases in seismic rate, in number of VTs (Figure 4) and especially in released seismic energy with felt VT earthquakes are observed (Moretti et al., 2020a). These events marked the onset of seismic swarms. Moreover, during P2 almost all fractures of the dome showed opening at a higher rate (Moretti et al., 2020a; OVSG-IPGP 1999–2021 Bulletins; Figure 4). However, a reversal of this trend occurred between March and April 2018, implying a slight closure of the active fumarolic zones on top of the dome (Figure 4; Moretti et al., 2020a).
The P3 period is characterised by P1-type high CO2/H2S (∼4 at CS and G56; ∼5 at TAS, NAPN and NAPE1) ratios and low SO2/H2S ratio (<∼0.02 at all the sites), with the exception of few data points higher SO2/H2S ratios up to 0.11. CO2/H2S ratios remained quite constant over 2019 and similar to those during P1. While remaining low, the SO2/H2S displayed some fluctuations from September to December 2019. In January 2019, both CO2 and H2S fluxes had decreased from 14.1 t/d in P2 to 10.5 t/d in P3 and then remained relatively constant all over the dome until January 2020 (Table 2; Figure 4). Low flux in November 2019 is again an artefact due an extremely too low wind speed that prevented reliable plume analysis. The water table level stood mainly below the reference level (range: −0.8 to 0.25; average: −0.28; Figure 4), with the lowest peak in 3 years occurring between September and December 2019. No anomaly was noticed between the observed and calculated dV/V values. This period is also marked by recurrent seismic VT swarms that started markedly in September 2018 and continued throughout 2019 (Figure 4). From September 2018 until Jan. 2020, 49 swarms with tens to hundreds of VTs developed at shallow depth beneath the dome (Figure 4, OVSG-IPGP 1999-2021 bulletins). They constitute an unprecedented rate of seismicity VT but of very low energy. On the other hand, the stability observed in MultiGAS data is also consistent with a low extension rate on most summit fractures, as observed also during P1. These features during P3 indicate that, in that period, the magmatic-hydrothermal system of La Soufrière had recovered the P1 conditions that prevailed before the April 2018 unrest crisis, except for the VT activity.
5 Discussion
5.1 Chemical Controls on Gas Composition at La Soufrière de Guadeloupe
Figure 3A shows the temperature dependence of the CO2/St ratios in La Soufrière’s hydrothermal gases at the CS vent, with St being here represented by H2S. It has been shown that volcanic gases exhibit a general exponential trend of decreasing CO2/St ratios with increasing temperature (Aiuppa et al., 2017). The CO2/St signature of typical hydrothermal fluids is generally more scattered and higher (up to 100,000) than that of magmatic gases essentially because of sulfur scrubbing by hydrothermal reactions (Symonds et al., 2001). However, even though La Soufrière fumarolic gases are thermally defined as hydrothermal (T < 250°C; Giggenbach, 1987; Aiuppa et al., 2017), our dataset shows that they are characterized by quite low CO2/St ratios evolving in a narrow range. This may indicate that they are less affected by scrubbing effects than other low-temperature fumarole emissions at other volcanoes (Aiuppa et al., 2017), such as Vulcano (Aiuppa et al., 2006) and Solfatara of Campi Flegrei (Chiodini et al., 2021) for instance (Figure 3A).
Figure 3B shows the measured fumarole compositions of La Soufrière in a CO2-SO2-H2S ternary diagram. The high-temperature (720°C) SO2-rich gas collected in 1996 from the extruding andesite lava dome of Soufrière Hills on nearby Montserrat island (Hammouya et al., 1998) is taken as a reliable proxy for the andesitic magmatic end-member at La Soufrière and is also shown in Figure 3B. Fumarolic gas emissions at La Soufrière display quite large compositional variations between a purely hydrothermal end-member and a mixed hydrothermal-magmatic shallow pole (Figure 3B; Giggenbach, 1987; Stix and deMoor, 2018). Specifically, the fumarolic gases display large variations in SO2/H2S ratio at relatively steady CO2/H2S ratio, along a trend that extends from the SO2-rich Montserrat-type magmatic end-member towards strongly SO2-depleted samples (Figure 3B). Such a trend is best accounted for by variable SO2 scrubbing in the hydrothermal liquid water (Tamburello et al., 2019). In the most SO2 depleted gas emissions, an impoverishment of H2S is also observed, suggesting a variable but significant loss of H2S in the volcanic ground prior to gas emission at the surface (Tamburello et al., 2019).
SO2 scrubbing in liquid water phase is a common process at volcanoes with hydrothermal systems. Because of the very high sulfur reactivity, particularly in hydrothermal environments where sulfur is partitioned between interacting gas, liquid and solid phases, few essential processes can be used to describe how magma-derived SO2 is efficiently removed from the gas phase during gas-water interactions. The following dissociation reactions (Giggenbach, 1980):
Subtract SO2 into the hydrothermal liquid, leading to surface gas emissions essentially composed of CO2 and H2S besides water vapour. Besides, metastable precipitation of elemental sulfur within the volcanic ground through the gaseous reactions.
and
can deplete low-temperature volcanic gas in both H2S and SO2.
Specific depletion of H2S that is degassed from a magma or deeper hydrothermal fluids may occur by forming sulfuric acid, H2SO4, because of oxidation by atmospheric oxygen in a steam-heated environment. According to
This is one main mechanism (together with pyrite wet oxidation) that produces so-called acid-sulfate waters, which like at La Soufrière react quickly with host rocks to give advanced argillic alteration parageneses (Heap et al., 2021) dominated by kaolinite and alunite, as well as gypsum, opal, and hydrated iron oxides (Steiner, 1977). H2S partial pressure, hence concentration, in such hydrothermal environments is then buffered by such parageneses via coexisting pyrite, an unspecified Fe-Al-silicate [indicated as (FeO), such as chlorite or epidote and the corresponding Al-silicate in its protonated, Fe-free form, (H2O) via (Giggenbach, 1980; Giggenbach, 1987):
Which can be turned into a gas-solid proxy reaction (Moretti et al., 2013, 2017; 2020a) by considering a shallow or even superficial gas-water-rock interactions involving ferrous iron in the wet volcanic ground:
Minor thermally and/or redox-driven fluctuations of the hydrothermal system may thus be accommodated by reaction such as (Eqs 5, 8, 9), which can either consume or remobilise sulfur from solid phases to restore equilibrium. In particular, sulphur accumulated in hydrothermal systems can be occasionally remobilised from the previously sealed hydrothermal system (Giggenbach, 1987) which can thus explain part of the fluctuation in C/St that ratios we measured at La Soufrière (Figure 3B), such as observed for instance at Ruapehu volcano (Christenson et al., 2010). Besides, lowest measured ratios may reflect prolonged and enhanced hydrolysis of either crystalline S (Eq. (5)) or pyrite (Eqs 8, 9) associated with significant water-rock ratios in the shallow system.
Figure 3B also provides more detailed insight into the spatial and temporal variations in gas composition. Gas emissions from NapE1 and TAS are systematically the most affected by SO2 scrubbing, which is coherent with the fact that TAS emissions arise from an acid crater lake (Tamburello et al., 2019) and with the low temperature of nearby NapE1 fumarole (40–60°C). SO2 scrubbing effect is more variable over time in the case of gas emissions from CS and, to a lesser extent, G56 and NapN. As a matter of fact, the extent of SO2 scrubbing, sulfur precipitation or instead, of remobilisation processes, depend not only on temperature but also on external factors, such as rainfalls and the dynamics of the water table level, which may induce some cycling behavior. Looking at temporal variations, two main features appear in Figure 3B: 1) the data points for G56 in Nov. 2017 and for CS, NapN and TAS in March 2018 plot the closest to the andesitic magmatic end-member, in agreement with the inferred magmatic gas pulse in that period (see section 5.3; Moretti et al., 2020b); and 2) the data for the period P3, especially at CS, show higher CO2/H2S and lower SO2/H2S ratios than during P2, indicating extensive sulfur loss in the hydrothermal system (see section 5.3). Thereafter, using additional information from geophysical signals, we attempt to better decipher the different processes determining the gas compositional variability observed during our nearly 4-year long survey.
5.2 Gas-Water-Rock Reactions and the Role of Permeability
At La Soufrière, native sulfur deposits are widespread at all active fumarolic vents whereas abundant pyrite (FeS2) is produced in the shallow volcanic ground as well as in the La Soufrière host-rock (Saläun et al., 2011) by gas interaction with ferrous iron oxides in the wet rocks. Thus, both gas-water-rock reactions in the shallow volcanic ground and sulfur precipitation through gas reaction and oxidation at the surface deplete sulfur in the fumarolic gas phases, leading to an increased CO2/St (essentially CO2/H2S) ratio. A dominant buffering process by these reactions may indeed account for the high and stable CO2/H2S ratios during the period P1. As these interactions proceed, S deposits accumulate underground and S-rich sealing processes promote the gradual development of impermeable layers. Sealing by precipitation, in the host-rock voids, of silica dissolved in hydrothermal fluids can also lead to reduced permeabilities in different regions of the hydrothermal system (e.g., Komorowski et al., 1997, 2008, 2010; Boudon et al., 1998). Opal (i.e., hydrothermal silica) was identified in the non-juvenile fragments of the ash produced by explosions during the 1976–1977 eruption of La Soufrière (Feuillard et al., 1983; Salaün et al., 2011; Heap et al., 2021; Inostroza et al., sub-judice). Hence, continuous degassing at depth, verified by a high total dry gas flux at the surface (Figure 4), progressively leads to impermeable sealing at the hydrothermal system-host-rock interface, only allowing concentrated gas escape through preferential drains. For instance, this can explain the lack of thermal ground anomalies around the Cratère Sud (CS) despite a high gas flux and extensive surface sulfur deposition at this most active central vent (Jessop et al., 2021).
The drastic decrease of CO2/H2S ratio that occurred in late March 2017 all over the dome, along with the negative anomaly of dV/V, cannot be explained by external forcing (i.e., variation of the table water level; Figure 4). These simultaneous changes in two different volcanic parameters are better accounted for by increasing gas accumulation in the vapour-saturated seal of the shallow hydrothermal system at a few hundred meters depth. This interpretation is supported by the dramatic decrease of density in La Soufrière dome on late March 2017 as detected by muon imagery (Le Gonidec et al., 2019). Such a broad decrease of density was explained by an increased vapour/liquid ratio in the shallow hydrothermal system due to a rise in thermal input (Le Gonidec et al., 2019). At that time, the gas exit temperature at CS rose during 3 days (29th–31st of March 2017) from 98.1 to 99.3°C. Higher steam production due to this heat input may have generated an overpressure, flushing the hot fluids in fractures within the lava dome and in the first hundred of meters below (Le Gonidec et al., 2019). This phenomenon likely provoked an increase of pore pressure, inducing hydro-fracturing in the hydrothermal system that likely propagated through the overlying sealed caps and caused an increase of the permeability of the seal region (decreasing dV/V). An expected consequence of these processes is the remobilization of hydrothermal sulfur deposits (S and sulfate) that would have triggered an increase in H2S degassing and a decrease in CO2/H2S ratio, such as observed in our MultiGas dataset (Figures 4, 5). Such a scenario is consistent with the higher number of VTs recorded since January 2017, that indicate the pressure increased in the sismogenic zone until triggering rock fracturing and with extensometric observations that show that the rate of fracture opening increased by late March 2017. Permeability modulations related to hydrothermal convective circulation and involving cycles of clogging and reopening of the dome fractures, transferring heat from deep aquifers to shallower ones, were already proposed by Zlotnicki et al. (1992) as a possible source mechanism for triggering recurrent explosions during the 1976–1977 phreatic eruption crisis.
Le Gonidec et al. (2019) proposed that this destabilisation of the hydrothermal system originated at relatively shallow depth beneath the G56 vent. However, we show here that the sharp gas compositional change by late 2017 occurred at the same time at all active vents on La Soufrière lava dome. Therefore, we rather infer a wider and deeper source destabilisation of the hydrothermal system, triggering an increased ascent of hot fluids through the whole dome. This is further supported by 1) the overall gas chemistry obtained from Giggenbach bottles at both CS and NapN (OVSG-IPGP 1999–2021 bulletins) and 2) the spatial extension of increased ground heating all over the dome (Jessop et al., 2021).
5.3 Detecting Gas Unrest Signals
The changes in CO2/H2S and SO2/H2S during the period P2, from Nov. 2017 until June 2018, demonstrate a pressure increase in the hydrothermal system. Moretti et al. (2020a) showed that the total S- and increase SO2 content of gas emissions at the summit CS fumarole resulted from an enhanced influx of magma-derived gas from depth that heated (by 30–40°C) and pressurised by about 60 bar) the La Soufrière hydrothermal system. This increase in pressure and temperature occurred over only 15 days (Moretti et al., 2020a). Whereas gas variations in late March 2017 during P1 had affected all the vents, the different times observed for the increase in SO2/H2S and CO2/H2S (from November 2017 to March 2017 and from Nov. 2017 to June 2018, respectively) at the different vents during P2 indicate a differing proportion of magmatic versus hydrothermal fluids at each vent. The fact that these changes occurred first at G56, where SO2 scrubbing has less influence than at the more central vents of CS, NapN, TAS and NapE1 (Figure 3B), confirms that gas emissions at G56 are more pristine where they allow monitoring of a deeply sourced unrest at La Soufrière (Tamburello et al., 2019). On the other hand, the delayed signals at CS and then NapN, TAS and NapE1 indicate that these sites are more efficiently buffered by hydrothermal aquifers that promote scrubbing of the soluble acid sulfur-rich gases. Progressive release of a magmatic gas pulse during the period from November 2017 to March 2018 is clearly evidenced by the shift of our data points towards the andesitic magmatic end-member (Figure 3B). Finally, it is noteworthy that the two negative dV/V anomalies, as well as the differences between the calculated and observed dV/V values, indicate that the compositional gas changes observed at the surface during P2 were not related to any external forcing.
The entire volcanic system was strongly perturbed by the major M4.1 earthquake on April 27, 2018, and these effects have persisted for several months afterwards. From June to December 2018 we observed both a continuous decrease of SO2/H2S ratio and a small increase of CO2/H2S ratio all over the dome, along with a lowering of the dry gas fluxes by a factor up to ∼2 compared to 2016–2017 values. In December 2018 the positive dV/V anomaly and the difference between the calculated and observed dV/V values suggest a renewed sealing of the system, in agreement with the lower gas flux and lower opening rate of the dome fractures, that returned to levels similar as those during P1.
In December 2018, the summit fumaroles recovered background compositions similar to those in P1, suggesting that the volcanic/hydrothermal system was no longer disturbed. Indeed, the subsequent period P3 (Dec. 2018 to Jan. 2020) displays high CO2/H2S and low SO2/H2S ratios similar to P1. This return to background compositions is also confirmed by the composition of gases routinely sampling with Giggenbach bottles, not only for the C/S ratio (Figure 4) but also for CO2/CH4 and He/CH4 ratios which are sensitive indicators of magma-derived gas input (OVSG-IPGP 1999-2021 bulletins). We thus infer that during the post-unrest period P3 gas transfer was reduced and sulfur loss was re-initiated in the hydrothermal system as evidenced by the high CO2/H2S and low SO2/H2S ratios. S loss was even more marked at CS (Figures 3B, 4) where extensive sulfur deposition was also observed during P3. However, we outline that since September 2018 recurrent seismic swarms of very low-magnitude but with tens to hundreds of VTs developed at shallow depth beneath the dome (OVSG-IPGP 1999-2021 bulletins). These VT swarms became more and more frequent, suggesting the alternance of fluid accumulation and release in an increasingly sealed hydrothermal system. The fractured state of the dome allowed the fluid pressure to be released naturally, thereby limiting the risk of a hydrothermal eruption. However, this may not be always the case in future, further highlighting how the permeability of the volcanic system can vary on short spatio-temporal scales and how it determines the probability of a hydrothermal eruption at La Soufrière (e.g., Zlotnicki et al., 1992; Le Gonidec et al., 2019).
5.4 External Forcing
10 +/− 2 m of rain falls annually at the summit of La Soufrière (e.g., Villemant et al., 2014). Extensive fracturation of the lava dome strongly favours the infiltration of up to 30% of meteoric water into the ground and the shallow hydrothermal system (Moretti et al., 2021 and refs. therein). At first sight, our dataset does not show clear compositional changes of fumarolic gases in response to seasonal or/and meteorological variations, contrary to previous observations (e.g., Faber et al., 2003; Keely et al., 2013). In fact, an increase of the normalised water table level seems to have no impact on the gas composition and/or the gas fluxes measured with MultiGas, even during its highest peak in May 2017 or during its sudden increase as a result of the passage of hurricane Maria (September 2017; Figure 4), when 440 mm of rainfall in 24 h were recorded by the OVSG rain gauge in Savane à Mulets (Moretti et al., 2021). On the other hand, the gas ratios seem to be more influenced when the normalised water table level decreases. The period P3, unaffected by internal forcing, was characterized by the lowest water table level observed between 2016 and January 2020, which makes it ideal to constrain the effect of external forcing on our MultiGas results. During the lowest water table level (−0.8; September to December 2019), SO2 concentrations and so SO2/H2S ratio increased significantly (Figure 4). Even though the corresponding data points moved towards the SO2-rich magmatic end-member in Figure 3B, these higher SO2 concentrations can be simply explained by lower SO2 scrubbing in the hydrothermal aquifer. However, no similar signal was observed during another period of low water table level in February to May 2019 (−0.5). Thus, our study reveals a complex situation in which enhanced SO2/H2S ratio may track internal forcing related to a magma-derived gas supply, such as observed during P2, but can also result from a lower water table level due to the rainfall regime, i.e., external forcing, such as observed during P3. In April 2018, just before the major earthquake, the water table was also at low level but the difference in calculated and observed dV/V confirmed that an internal forcing process was occurring. Moreover, a low water table level in April 2018 might have amplified the SO2 signal generated by the influx of magma-derived gas and heat. Hence, while rainy periods do not seem to affect our MultiGas measurements, we find that extended dry periods may amplify relatively the magmatic signal normally hidden and supressed by scrubbing in the hydrothermal system. Hence, for monitoring purposes, it is of prime importance to combine the survey of both geochemical and geophysical parameters in order to have the ability to discriminate the respective influence of internal and external forcing upon volcanic gas compositions and fluxes.
6 Conclusion
Our MultiGas monitoring of the degassing activity of La Soufrière in Guadeloupe in 2016–2020, especially with the CO2/H2S and SO2/H2S trends, provides insight into the temporal and spatial influence of fracturing, permeability and underground hydrothermal fluid circulation upon fumarolic gas compositions. Our data allowed us to 1) track change in the permeability of the dome, which can be modified by internal forcing due to either superficial processes or deep processes, and 2) detect a pulse of magma-derived gas and heat prior to a strong volcano-seismic unrest in April 2018. Moreover, our study highlights the importance of combining MultiGas measurements with other geochemical and geophysical monitoring if one wishes to be able to discriminate external forcing (e.g., rainfall-related) influences from underground processes, the latter being either primary (mixing of magma-derived and hydrothermal fluids) or secondary (fluid-rock alterations, scrubbing, fluid condensation, sulfur deposition and remobilisation). While rainy periods do not seem to affect MultiGas survey, we find that drier periods may trigger or amplify SO2-rich magmatic signal usually hidden by the hydrothermal system. Our study thus demonstrates that MultiGas surveys are a useful tool for volcano monitoring even under tropical environment. However, the regular change of filters is necessary (every 2 weeks) to prevent the water to enter and damage the system. A new MultiGas architecture could be developed removing the pump, as already suggested in Moretti et al. (2020b), which is the most sensitive part of the system.
The pressurisation of La Soufrière hydrothermal system in April 2018 might have caused a phreatic eruption if the fracturing state of the summit dome had not allowed spontaneous release of the excess pressure (Moretti et al., 2020a). Therefore, surveying the permeability degree of the volcanic system or, reciprocally, its sealing extent is a key approach to assess the probability of an eruption. Our study shows that even without enhanced magmatic gas input, such as in March 2017, sealing effects and the clogging of fractures in a volcanic/hydrothermal system can lead to pressure increase in deep aquifers, generating volcano-tectonic seismic swarms and possibly a phreatic eruption without any change in the magma recharge zone at depth. Our results underscore the necessity to continue MultiGas monitoring at La Soufrière in order to improve our capability to detect and accurately interpret multiparameter monitoring data as eruption precursors.
Data Availability Statement
Details of the seismic, extensometry and temperature networks and methods are available in Jacob et al. (2005), Tamburello et al. (2019), Moretti et al. (2020a), Jessop et al. (2021). Seismic data are distributed by IPGP on the public access Volobsis server (http://volobsis.ipgp.fr) and the Data center (http://datacenter.ipgp.fr). Rainfall data from Sanner and Savane à Mulets as well as the Tarissan lake level are available on request from OVSG. Gas ratios and concentrations from the MultiGas-based monitoring of La Soufrière de Guadeloupe are also available on request from OVSG.
Author Contributions
SM acquired the MultiGas measurements, processed and analyzed all the data, wrote the draft of the manuscript and drafted the figures. SM, TD, VR, MBo, DJ, RM, J-CK, and GT undertook fieldwork, installation of permanent stations, calibration and repair of the different instruments. AB, VR, and SM realised the additional calibration tests to obtain the characteristics of the sensors (e.g., t90). AB and MBu during an internship with SM, wrote the codes to post-process the data. AB processed and analyzed the data for the meteorological and geophyiscal parameters. AB and DJ helped with the figures. SM, RM, MBo, AB, VR, and DJ had intense discussions about the geochemical dataset about La Soufrière de Guadeloupe. PA and J-CK provided an extensive reading of the ms. All authors discussed the data, wrote and revised the manuscript and the figures.
Funding
General funding to the Observatoires Volcanologiques et Sismologiques (OVS), the INSU-CNRS for funding provided by Service National d’Observation en Volcanologie (SNOV), a Tellus-Aleas project to SM (2014- Investigation of the hydrothermal system of La Soufrière volcano, Guadeloupe) and the Ministère pour la Transition Ecologiques et Solidaires (MTES) for financial support. This work has been supported by the ClerVolc (UCA-LMV) and the AO-IPGP 2018 project “Depth to surface propagation of fluid-related anomalies at La Soufrière de Guadeloupe volcano (FWI): timing and implication for volcanic unrest” (coord. RM), the project “Vers la Plateforme Régionale de Surveillance Tellurique du futur” (PREST) co-funded by INTERREG Caraïbes V for the European Regional Development Fund, and the European Union’s Horizon 2020 research and innovation programme, under grant agreement No 731070 (EUROVOLC project).
Conflict of Interest
The authors declare that the research was conducted in the absence of any commercial or financial relationships that could be construed as a potential conflict of interest.
Publisher’s Note
All claims expressed in this article are solely those of the authors and do not necessarily represent those of their affiliated organizations, or those of the publisher, the editors and the reviewers. Any product that may be evaluated in this article, or claim that may be made by its manufacturer, is not guaranteed or endorsed by the publisher.
Acknowledgments
We thank both reviewers to have read thoroughly the ms. The authors thank the OVSG-IPGP team for logistical support and constant help with data collection and repair. We thank IPGP for general funding the installation of the initial permanent MultiGAS stations and for recurrent funding to the Observatoires Volcanologiques et Sismologiques (OVS IPGP), the INSU-CNRS for funding provided by Service National d’Observation en Volcanologie (SNOV), a Tellus-Aleas projects to SM (2020, Insights into the dynamics of the active hydrothermal system of La Soufrière de Guadeloupe from past eruptions) and to RM (2021, Progress in volcanic UNREST science: filtering hydrothermal chemical signals and tracking the magmatic source), and the Ministère pour la Transition Ecologique et Solidaire (MTES) for financial support. We are grateful to the Parc National de Guadeloupe for allowing us to undertake research and obtain geological samples. This study contributes to the IdEx Université de Paris ANR-18-IDEX-0001 and is Laboratory of excellence ClerVolc contribution number 512.
References
Aiuppa, A., Federico, C., and Giudice, G., (2006). Hydrothermal Buffering of the SO2/H2S Ratio in Volcanic Gases: Evidence from La Fossa Crater Fumarolic Field, Vulcano Island. Geophys. Res. Lett. 33. doi:10.1029/2006gl027730
Aiuppa, A., Federico, C., Giudice, G., and Gurrieri, S. (2005). Chemical Mapping of a Fumarolic Field: La Fossa Crater, Vulcano Island (Aeolian Islands, Italy). Geophys. Res. Lett. (13), 32. doi:10.1029/2005gl023207
Aiuppa, A., Fischer, T. P., Plank, T., Robidoux, P., and Di Napoli, R. (2017). Along-arc, Inter-arc and Arc-To-Arc Variations in Volcanic Gas CO 2/S T Ratios Reveal Dual Source of Carbon in Arc Volcanism. Earth-Science Rev. 168, 24–47. doi:10.1016/j.earscirev.2017.03.005
Aiuppa, A., Moretti, R., Federico, C., Giudice, G., Gurrieri, S., Liuzzo, M., et al. (2007). Forecasting Etna Eruptions by Real-Time Observation of Volcanic Gas Composition. Geol 35, 1115–1118. doi:10.1130/G24149A10.1130/g24149a.1
Akasaka, C., and Nakanishi, S. (2000). “Correction of Background Gravity Changes Due to Precipitation: Oguni Geothermal Field, Japan,” in Proceedings World Geothermal Congress, 2471–2475.
Allard, P., Aiuppa, A., Beauducel, F., Gaudin, D., di Napoli, R., Calabrese, S., et al. (2014). Steam and Gas Emission Rate from La Soufriere Volcano, Guadeloupe (Lesser Antilles): Implications for the Magmatic Supply during Degassing Unrest. Chem. Geology. 384, 76–93. doi:10.1016/j.chemgeo.2014.06.019
Allard, P., Carbonnelle, J., Métrich, N., Loyer, H., and Zettwoog, P. (1994). Sulphur Output and Magma Degassing Budget of Stromboli Volcano. Nature 368, 326–330. doi:10.1038/368326a0
Barberi, F., Bertagnini, A., Landi, P., and Principe, C. (1992). A Review on Phreatic Eruptions and Their Precursors. J. volcanology geothermal Res. 52 (4), 231–246. doi:10.1016/0377-0273(92)90046-g
Battaglia, J., Hidalgo, S., Bernard, B., Steele, A., Arellano, S., and Acuña, K. (2019). Autopsy of an Eruptive Phase of Tungurahua Volcano (Ecuador) through Coupling of Seismo-Acoustic and SO2 Recordings with Ash Characteristics. Earth Planet. Sci. Lett. 511, 223–232. doi:10.1016/j.epsl.2019.01.042
Bigot, S., Roucou, P., Moron, V., Camberlin, P., and Fontaine, B. (1994). Présentation d'un fichier de précipitations mensuelles en points de grille sur la zone tropicale africaine et sud-américaine (1951–1990) Ateliers de Modélisation de l'Atmosphére, 435–442.
Bloomfield, P., and Steiger, W. L. (1983). Least Absolute Deviations: Theory, Applications, and Algorithms. Boston: Birkhäuser, 349.
Boudon, G., Villemant, B., Komorowski, J.-C., Ildefonse, P., and Semet, M. P. (1998). The Hydrothermal System at Soufriere Hills Volcano, Montserrat (West Indies): Characterization and Role in the On-Going Eruption. Geophys. Res. Lett. 25, 3693–3696. doi:10.1029/98gl00985
Brenguier, F., Campillo, M., Hadziioannou, C., Shapiro, N. M., Nadeau, R. M., and Larose, E. (2008a). Postseismic Relaxation along the San Andreas Fault at Parkfield from Continuous Seismological Observations. Science 321, 1478–1481. doi:10.1126/science.1160943
Brenguier, F., Shapiro, N. M., Campillo, M., Ferrazzini, V., Duputel, Z., Coutant, O., et al. (2008b). Towards Forecasting Volcanic Eruptions Using Seismic Noise. Nat. Geosci 1, 126–130. doi:10.1038/ngeo104
Brombach, T., Marini, L., and Hunziker, J. C. (2000). Geochemistry of the thermal Springs and Fumaroles of Basse-Terre Island, Guadeloupe, Lesser Antilles. Bull. Volcanol. 61, 477–490. doi:10.1007/PL00008913
Cashman, K. V., and Hoblitt, R. P. (2004). Magmatic Precursors to the 18 May 1980 Eruption of Mount St. Helens, USA. Geol 32 (2), 141–144. doi:10.1130/g20078.1
Chiodini, G., Paonita, A., Aiuppa, A., Costa, A., Caliro, S., De Martino, P., et al. (2016). Magmas Near the Critical Degassing Pressure Drive Volcanic Unrest towards a Critical State. Nat. Commun. 7 (1), 13712–13719. doi:10.1038/ncomms13712
Chiodini, G., Caliro, S., Avino, R., Bini, G., Giudicepietro, F., De Cesare, W., et al. (2021). Hydrothermal Pressure-Temperature Control on CO2 Emissions and Seismicity at Campi Flegrei (Italy). J. Volcanology Geothermal Res. 414, 107245. doi:10.1016/j.jvolgeores.2021.107245
Chiodini, G. (2009). CO2/CH4 Ratio in Fumaroles a Powerful Tool to Detect Magma Degassing Episodes at Quiescent Volcanoes. Geophys. Res. Lett. (2), 36. doi:10.1029/2008gl036347
Chiodini, G., Vandemeulebrouck, J., Caliro, S., D'Auria, L., De Martino, P., Mangiacapra, A., et al. (2015). Evidence of thermal-driven Processes Triggering the 2005-2014 Unrest at Campi Flegrei Caldera. Earth Planet. Sci. Lett. 414, 58–67. doi:10.1016/j.epsl.2015.01.012
Christenson, B. W., Reyes, A. G., Young, R., Moebis, A., Sherburn, S., Cole-Baker, J., et al. (2010). Cyclic Processes and Factors Leading to Phreatic Eruption Events: Insights from the 25 September 2007 Eruption through Ruapehu Crater Lake, New Zealand. J. Volcanology Geothermal Res. 191 (1-2), 15–32. doi:10.1016/j.jvolgeores.2010.01.008
Christenson, B. W., White, S., Britten, K., and Scott, B. J. (2017). Hydrological Evolution and Chemical Structure of a Hyper-Acidic spring-lake System on Whakaari/White Island, NZ. J. Volcanology Geothermal Res. 346, 180–211. doi:10.1016/j.jvolgeores.2017.06.017
Clements, T., and Denolle, M. A. (2018). Tracking Groundwater Levels Using the Ambient Seismic Field. Geophys. Res. Lett. 45 (13), 6459–6465. doi:10.1029/2018GL077706
de Moor, J. M., Aiuppa, A., Pacheco, J., Avard, G., Kern, C., Liuzzo, M., et al. (2016). Short-period Volcanic Gas Precursors to Phreatic Eruptions: Insights from Poás Volcano, Costa Rica. Earth Planet. Sci. Lett. 442, 218–227. doi:10.1016/j.epsl.2016.02.056
Dempsey, D. E., Cronin, S. J., Mei, S., and Kempa-Liehr, A. W. (2020). Automatic Precursor Recognition and Real-Time Forecasting of Sudden Explosive Volcanic Eruptions at Whakaari, New Zealand. Nat. Commun. 11, 3562. doi:10.1038/s41467-020-17375-2
Dodge, Y. (1997). LAD Regression for Detecting Outliers in Response and Explanatory Variables. J. Multivariate Anal. 61, 144–158. doi:10.1006/jmva.1997.1666
Faber, E., Morán, C., Poggenburg, J., Garzón, G., and Teschner, M. (2003). Continuous Gas Monitoring at Galeras Volcano, Colombia: First Evidence. J. volcanology geothermal Res. 125 (1-2), 13–23. doi:10.1016/s0377-0273(03)00086-6
Feuillard, M., Allegre, C. J., Brandeis, G., Gaulon, R., Le Mouel, J. L., Mercier, J. C., et al. (1983). The 1975-1977 crisis of la Soufriere de Guadeloupe (F.W.I): A still-born magmatic eruption. J. Volcanology Geothermal Res. 16, 317–334. doi:10.1016/0377-0273(83)90036-7
Fischer, T. P., Sturchio, N. C., Stix, J., Arehart, G. B., Counce, D., and Williams, S. N. (1997). The Chemical and Isotopic Composition of Fumarolic Gases and spring Discharges from Galeras Volcano, Colombia. J. Volcanol. Geoth. Res 77 (1–4), 229–253. doi:10.1016/s0377-0273(96)00096-0
Gassenmeier, M., Sens-Schönfelder, C., Eulenfeld, T., Bartsch, M., Victor, P., Tilmann, F., et al. (2016). Field Observations of Seismic Velocity Changes Caused by Shaking-Induced Damage and Healing Due to Mesoscopic Nonlinearity. Geophys. J. Int. 204 (3), 1490–1502. doi:10.1093/gji/ggv529
Gaudin, D., Beauducel, F., Coutant, O., Delacourt, C., Richon, P., de Chabalier, J.-B., et al. (2016). Mass and Heat Flux Balance of La Soufrière Volcano (Guadeloupe) from Aerial Infrared thermal Imaging. J. Volcanol. Geoth. Res. 320, 107–116. doi:10.1016/j.jvolgeores.2016.04.007
Giggenbach, W. F. (1996). “Chemical Composition of Volcanic Gases,” in Monitoring and Mitigation of Volcano Hazards. Editors R. Scarpa, and R. I. Tilling (Berlin, Heidelberg: Springer Berlin Heidelberg), 221–256. doi:10.1007/978-3-642-80087-0_7
Giggenbach, W. F. (1980). Geothermal Gas Equilibria. Geochimica et Cosmochimica Acta 44, 2021–2032. doi:10.1016/0016-7037(80)90200-8
Giggenbach, W. F., and Goguel, R. L. (1989). Methods for the Collection and Analysis of Geothermal and Volcanic Water and Gas Samples.
Giggenbach, W. F. (1987). Redox Processes Governing the Chemistry of Fumarolic Gas Discharges from White Island, New Zealand. Appl. Geochem. 2 (2), 143–161. doi:10.1016/0883-2927(87)90030-8
Giggenbach, W. F. (1995). Variations in the Chemical and Isotopic Composition of Fluids Discharged from the Taupo Volcanic Zone, New Zealand. J. Volcanology Geothermal Res. 68 (1-3), 89–116. doi:10.1016/0377-0273(95)00009-j
Girona, T., Realmuto, V., and Lundgren, P. (2021). Large-scale thermal Unrest of Volcanoes for Years Prior to Eruption. Nat. Geosci. 14, 238–241. doi:10.1038/s41561-021-00705-4
Hadziioannou, C., Larose, E., Coutant, O., Roux, P., and Campillo, M. (2009). Stability of Monitoring Weak Changes in Multiply Scattering media with Ambient Noise Correlation: Laboratory Experiments. The J. Acoust. Soc. America 125 (6), 3688–3695. doi:10.1121/1.3125345
Hammouya, G., Allard, P., Jean-Baptiste, P., Parello, F., Semet, M. P., and Young, S. R. (1998). Pre- and Syn-Eruptive Geochemistry of Volcanic Gases from Soufriere Hills of Montserrat, West Indies. Geophys. Res. Lett. 25, 3685–3688. doi:10.1029/98gl02321
Heap, M. J., Baumann, T. S., Rosas‐Carbajal, M., Komorowski, J. C., Gilg, H. A., Villeneuve, M., et al. (2021). Alteration‐Induced Volcano Instability at La Soufrière de Guadeloupe (Eastern Caribbean). J. Geophys. Res. Solid Earth 126 (8), e2021JB022514. doi:10.1029/2021jb022514
Hedenquist, J. W., and Lowenstern, J. B. (1994). The Role of Magmas in the Formation of Hydrothermal Ore Deposits. Nature 370 (6490), 519–527. doi:10.1038/370519a0
Hincks, T. K., Komorowski, J.-C., Sparks, S. R., and Aspinall, W. P. (2014). Retrospective Analysis of Uncertain Eruption Precursors at La Soufrière Volcano, Guadeloupe, 1975-77: Volcanic hazard Assessment Using a Bayesian Belief Network Approach. J. Appl. Volcanol. 3, 1–26. doi:10.1186/2191-5040-3-3
Hurst, T., Jolly, A. D., and Sherburn, S. (2014). Precursory Characteristics of the Seismicity before the 6 August 2012 Eruption of Tongariro Volcano, North Island, New Zealand. J. Volcanology Geothermal Res. 286, 294–302. doi:10.1016/j.jvolgeores.2014.03.004
Illien, L., Andermann, C., Sens‐Schönfelder, C., Cook, K. L., Baidya, K. P., Adhikari, L. B., et al. (2021). Subsurface Moisture Regulates Himalayan Groundwater Storage and Discharge. AGU Adv. 2, e2021AV000398. doi:10.1029/2021AV000398
Inostroza, M., Moune, S., Moretti, R., Bonifacie, M., Robert, V., Burtin, A., et al. Submitted to JVGR, Decoding Water-Rock Interaction and Volatile Input at La Soufriere Volcano (Guadeloupe) by Using Major and Trace Element Time-Series Analyses in Condensed Gases.
Jacob, T., Beauducel, F., Hammouya, G., David, J. G., and Komorowski, J. C. (2005). “Ten Years of Extensometry at Soufrière of Guadeloupe: New Constraints on the Hydrothermal System,” in Soufrière Hills Volcano -Ten Years on International Workshop (Seismic Research Unit, University of West Indies).
Jessop, D., Moune, S., Moretti, R., Gibert, D., Komorowski, J. C., Robert, V., et al. (2021). A multi-decadal view of the heat and mass budget of a volcano in unrest: La Soufrière de Guadeloupe (French West Indies). Bull. Volcanology 83 (16), 1–19. doi:10.1007/s00445-021-01439-2
Kilgour, G., Manville, V., Della Pasqua, F., Graettinger, A., Hodgson, K. A., and Jolly, G. E. (2010). The 25 September 2007 Eruption of Mount Ruapehu, New Zealand: Directed Ballistics, Surtseyan Jets, and Ice-Slurry Lahars. J. Volcanology Geothermal Res. 191 (1-2), 1–14. doi:10.1016/j.jvolgeores.2009.10.015
Komorowski, J.-C., Boudon, G., Semet, M., Beauducel, F., Anténor-Habazac, C., Bazin, S., et al. (2005). “Guadeloupe,” in Volcanic Hazard Atlas of the {Lesser Antilles}. Editors J. M. Lindsay, R. E. A. Robertson, J. B. Shepherd, and S. Ali, 65–102.
Komorowski, J-C., Hoblitt, R. P., and Sheridan, M. F. (1997). “ Silicification and Brecciation Microtextures of the Mt. St. Helens'1980 Cryptodome-Country Rock Interface: Implications for Hydrothermal Fluid Processes, Precursory Seismicity, and Eruptive Style,” in” Volcanic Activity and the Environment (abstracts), International Association of Volcanology and Chemistry of the Earth's Interior, General Assembly Puerto Vallarta, Mexico, 76.
Komorowski, J.-C., Legendre, Y., Caron, B., and Boudon, G. (2008). Reconstruction and Analysis of Sub-plinian Tephra Dispersal during the 1530 A.D. Soufrière (Guadeloupe) Eruption: Implications for Scenario Definition and Hazards Assessment. J. Volcanology Geothermal Res. 178, 491–515. doi:10.1016/j.jvolgeores.2007.11.022
Komorowski, J.-C., Legendre, Y., Christopher, T., Bernstein, M., Stewart, R., Joseph, E., et al. (2010). Insights into Processes and Deposits of Hazardous Vulcanian Explosions at Soufrière Hills Volcano during 2008 and 2009 (Montserrat, West Indies). Geophys. Res. Lett. 37, a–n. doi:10.1029/2010GL042558
Le Gonidec, Y., Rosas-Carbajal, M., Bremond d’Ars, J. d., Carlus, B., Ianigro, J.-C., Kergosien, B., et al. (2019). Abrupt Changes of Hydrothermal Activity in a Lava Dome Detected by Combined Seismic and Muon Monitoring. Sci. Rep. 9, 3079. doi:10.1038/s41598-019-39606-3
Le Guern, F., Bernard, A., and Chevrier, R. M. (1980). Soufrière of guadeloupe 1976-1977 Eruption - Mass and Energy Transfer and Volcanic Health Hazards. Bull. Volcanol 43 (3), 577–593. doi:10.1007/bf02597694
Lecocq, T., Longuevergne, L., Pedersen, H. A., Brenguier, F., and Stammler, K. (2017). Monitoring Ground Water Storage at Mesoscale Using Seismic Noise: 30 Years of Continuous Observation and Thermo-Elastic and Hydrological Modeling. Sci. Rep. 7 (1), 1–16. doi:10.1038/s41598-017-14468-9
Legendre, Y. (2012). Reconstruction de l’histoire éruptive et scenarii éruptifs àLaSoufriere de Guadeloupe : vers un mode intégralde fonctionnement du volcan .(French )[A high resolution reconstruction of the eruptive past and definition of eruptive scenario at La Soufriere of Guadeloupe ]. Ph .D.thesis. Paris.
Maeno, F., Nakada, S., Oikawa, T., Yoshimoto, M., Komori, J., Ishizuka, Y., et al. (2016). Reconstruction of a Phreatic Eruption on 27 September 2014 at Ontake Volcano, central Japan, Based on Proximal Pyroclastic Density Current and Fallout Deposits. Earth Planet. Sp 68, 82. doi:10.1186/s40623-016-0449-6
Massaro, S., Dioguardi, F., Sandri, L., Tamburello, G., Selva, J., Moune, S., et al. (2021). Testing Gas Dispersion Modelling at La Soufrière Volcano (Gudeloupe, Lesser Antilles). JVGR 417, 107312. doi:10.1016/j.jvolgeores.2021.107312
Metcalfe, A., Moune, S., Komorowski, J.-C., Kilgour, G., Jessop, D. E., Moretti, R., et al. (2021). Magmatic Processes at La Soufrière de Guadeloupe: Insights From Crystal Studies and Diffusion Timescales for Eruption Onset. Front. Earth Sci. 9, 617294. doi:10.3389/feart.2021.617294
Moretti, R., Arienzo, I., Civetta, L., Orsi, G., and Papale, P. (2013). Multiple Magma Degassing Sources at an Explosive Volcano. Earth Planet. Sci. Lett. 367, 95–104. doi:10.1016/j.epsl.2013.02.013
Moretti, R., De Natale, G., and Troise, C. (2017). A Geochemical and Geophysical Reappraisal to the Significance of the Recent Unrest at Campi Flegrei Caldera (Southern Italy). Geochem. Geophys. Geosyst. 18, 1244–1269. doi:10.1002/2016GC006569
Moretti, R., Komorowski, J.-C., Ucciani, G., Moune, S., Jessop, D., de Chabalier, J.-B., et al. (2020a). The 2018 Unrest Phase at La Soufrière of Guadeloupe (French West Indies) Andesitic Volcano: Scrutiny of a Failed but Prodromal Phreatic Eruption. J. Volcanology Geothermal Res. 393, 106769. doi:10.1016/j.jvolgeores.2020.106769
Moretti, R., Moune, S., Jessop, D., Glynn, C., Robert, V., and Deroussi, S. (2021). The Basse-Terre Island of Guadeloupe (Eastern Caribbean, France) and its Volcanic-Hydrothermal Geodiversity: A Case Study of Challenges, Perspectives, and New Paradigms for Resilience and Sustainability on Volcanic Islands. Geosciences 11 (11), 454. doi:10.3390/geosciences11110454
Moretti, R., Moune, S., Robert, V., Jessop, D. E., Didier, T., Bonifacie, M., et al. (2020b). Intercomparison of geochemical techniques at La Soufrière de Guadeloupe (FWI) volcano: their advantages and their limits over a long-standing unrest. Ijg 139 (3), 398–412. doi:10.3301/ijg.2020.13
Moretti, R., and Stefánsson, A. (2020). Volcanic and Geothermal Redox Engines. Elem. Int. Mag. Mineralogy, Geochem. Petrol. 16 (3), 179–184. doi:10.2138/gselements.16.3.179
Moussallam, Y., Peters, N., Masias, P., Apaza, F., Barnie, T., Ian Schipper, C., et al. (2017). Magmatic Gas Percolation through the Old Lava Dome of El Misti Volcano. Bull. Volcanol. 79, 46. doi:10.1007/s00445-017-1129-5
Nakahara, H., Wegler, U., and Shiomi, K. (2007). “Detection of Temporal Changes in Subsurface Structures with the Passive Image Interferometry: Application to the 2005 Fukuoka-Ken Seiho-Oki Earthquake,” in Seismological Society of Japan, Fall Meeting (Sendai, Japan.
Oikawa, T., Yoshimoto, M., Nakada, S., Maeno, F., Komori, J., Shimano, T., et al. (2016). Reconstruction of the 2014 Eruption Sequence of Ontake Volcano from Recorded Images and Interviews. Earth, Planets and Space 68 (1), 1–13. doi:10.1186/s40623-016-0458-5
Ovsg-Ipgp, (1999-2021). Monthly reports on the activity of La Soufrière de Guadeloupe and on regional seismicity. Gourbeyre, Guadeloupe. http://www.ipgp.fr/fr/ovsg/bulletins-mensuels-de-lovsg.
Pichavant, M., Poussineau, S., Lesne, P., Solaro, C., and Bourdier, J.-L. (2018). Experimental Parametrization of Magma Mixing: Application to the Ad 1530 Eruption of La Soufrière, Guadeloupe (Lesser Antilles). J. Pet. 59, 257–282. doi:10.1093/petrology/egy030
Procter, J. N., Cronin, S. J., Zernack, A. V., Lube, G., Stewart, R. B., Nemeth, K., et al. (2014). Debris Flow Evolution and the Activation of an Explosive Hydrothermal System; Te Maari, Tongariro, New Zealand. J. Volcanology Geothermal Res. 286, 303–316. doi:10.1016/j.jvolgeores.2014.07.006
Roberts, T. J., Lurton, T., Giudice, G., Liuzzo, M., Aiuppa, A., Coltelli, M., et al. (2017). Validation of a Novel Multi-Gas Sensor for Volcanic HCl Alongside H2S and SO2 at Mt. Etna. Bull. Volcanol 79, 36. doi:10.1007/s00445-017-1114-z
Roberts, T. J., Saffell, J. R., Oppenheimer, C., and Lurton, T. (2014). Electrochemical Sensors Applied to Pollution Monitoring: Measurement Error and Gas Ratio Bias - A Volcano Plume Case Study. J. volcanology geothermal Res. 281, 85–96. doi:10.1016/j.jvolgeores.2014.02.023
Rosas-Carbajal, M., Komorowski, J.-C., Nicollin, F., and Gibert, D. (2016). Volcano Electrical Tomography Unveils Edifice Collapse hazard Linked to Hydrothermal System Structure and Dynamics. Sci. Rep. 6, 29899. doi:10.1038/srep29899
Rye, R. O. (2005). A Review of the Stable-Isotope Geochemistry of Sulfate Minerals in Selected Igneous Environments and Related Hydrothermal Systems. Chem. Geology. 215 (1-4), 5–36. doi:10.1016/j.chemgeo.2004.06.034
Rye, R. O., Bethke, P. M., and Wasserman, M. D. (1992). The Stable Isotope Geochemistry of Acid Sulfate Alteration. Econ. Geology. 87 (2), 225–262. doi:10.2113/gsecongeo.87.2.225
Salaün, A., Villemant, B., Gérard, M., Komorowski, J-C., and Michel, A. (2011). Hydrothermal Alteration in Andesitic Volcanoes : a Study of Trace Element Redistribution in Active and Paleohydrothermal Systems of Guadeloupe (Lesser Antilles). Jour of Geochemical Exploration 111, 59–83. doi:10.1016/j.gexplo.2011.06.004
Sano, Y., Kagoshima, T., Takahata, N., Nishio, Y., Roulleau, E., Pinti, D. L., et al. (2015). Ten-year Helium Anomaly Prior to the 2014 Mt Ontake Eruption. Sci. Rep. 5, 13069. doi:10.1038/srep13069
Saurel, J.-M., Corbeau, J., Deroussi, S., Didier, T., Lemarchand, A., Moune, S., et al. (2020). Building a Natural-Hazard-Resilient High-Quality Seismic Network: How WI Network Sustained Hurricanes Maria and Irma. Seismological Res. Lett. 92, 77–84. doi:10.1785/0220200270
Sens-Schönfelder, C., and Wegler, U. (2006). Passive Image Interferometry and Seasonal Variations of Seismic Velocities at Merapi Volcano, Indonesia. Geophys. Res. Lett. 33 (21), 1029–1033. doi:10.1029/2006GL027797
Sens-Schönfelder, C., and Wegler, U. (2011). Passive Image Interferometry for Monitoring Crustal Changes with Ambient Seismic Noise. Comp. Rend. Geosci. 343 (89), 639–651.
Shimoike, Y., and Notsu, K. (2000). Continuous Chemical Monitoring of Volcanic Gas in Izu-Oshima Volcano, Japan. J. Volcanology Geothermal Res. 101 (3), 211–221. doi:10.1016/s0377-0273(00)00178-5
Shinohara, H. (2005). A New Technique to Estimate Volcanic Gas Composition: Plume Measurements with a Portable Multi-Sensor System. J. Volcanology Geothermal Res. 143, 319–333. doi:10.1016/j.jvolgeores.2004.12.004
Snieder, R., Grêt, A., Douma, H., and Scales, J. (2002). Coda Wave Interferometry for Estimating Nonlinear Behavior in Seismic Velocity. Science 295, 2253–2255. doi:10.1126/science.1070015
Steiner, A. (1977). The Wairakei Geothermal Area, North Island, New Zealand. N. Z. Geol. Surv. Bull. 90, 136.
Stix, J., and de Moor, J. M. (2018). Understanding and Forecasting Phreatic Eruptions Driven by Magmatic Degassing. Earth Planets Space 70, 83. doi:10.1186/s40623-018-0855-z
Symonds, R. B., Gerlach, T. M., and Reed, M. H. (2001). Magmatic Gas Scrubbing: Implications for Volcano Monitoring. J. Volcanology Geothermal Res. 108, 303–341. doi:10.1016/S0377-0273(00)00292-4
Symonds, R. B., Rose, W. I., Bluth, G. J. S., and Gerlach, T. M. (1994). Chapter 1. VOLCANIC-GAS STUDIES: METHODS, RESULTS, and APPLICATIONS. Rev. Miner. Geochem. 30, 1–66. doi:10.1515/9781501509674-007
Takagi, R., and Okada, T. (2012). Temporal Change in Shear Velocity and Polarization Anisotropy Related to the 2011 M9.0 Tohoku-Oki Earthquake Examined Using KiK-Net Vertical Array Data. Geophys. Res. Lett. 39, a–n. doi:10.1029/2012GL051342
Tamburello, G., Moune, S., Allard, P., Venugopal, S., Robert, V., Rosas-Carbajal, M., et al. (2019). Spatio-Temporal Relationships between Fumarolic Activity, Hydrothermal Fluid Circulation and Geophysical Signals at an Arc Volcano in Degassing Unrest: La Soufrière of Guadeloupe (French West Indies). Geosciences 9, 480. doi:10.3390/geosciences9110480
Tamburello, G. (2015). Ratiocalc: Software for Processing Data from Multicomponent Volcanic Gas Analyzers. Comput. Geosciences 82, 63–67. doi:10.1016/j.cageo.2015.05.004
Touboul, M., Bourdon, B., Villemant, B., Boudon, G., and Joron, J. L. (2007). 238 U–230 Th–226 Ra Disequilibria in Andesitic Lavas of the Last Magmatic Eruption of Guadeloupe Soufriere, French Antilles: Processes and Timescales of Magma Differentiation. Chem. Geol. 246 (3), 181–206. doi:10.1016/j.chemgeo.2007.09.009
Troise, C., De Natale, G., Schiavone, R., Somma, R., and Moretti, R. (2019). The Campi Flegrei Caldera Unrest: Discriminating Magma Intrusions from Hydrothermal Effects and Implications for Possible Evolution. Earth-science Rev. 188, 108–122. doi:10.1016/j.earscirev.2018.11.007
Villemant, B., Komorowski, J. C., Dessert, C., Michel, A., Crispi, O., Hammouya, G., et al. (2014). Evidence for a New Shallow Magma Intrusion at La Soufrière of Guadeloupe (Lesser Antilles). J. Volcanology Geothermal Res. 285, 247–277. doi:10.1016/j.jvolgeores.2014.08.002
Wegler, U., and Sens-Schönfelder, C. (2007). Fault Zone Monitoring with Passive Image Interferometry. Geophys. J. Int. 168, 1029–1033. doi:10.1111/j.1365–246X.2006.03284.x
Werner, C., Evans, W. C., Poland, M., Tucker, D. S., and Doukas, M. P. (2009). Long-term Changes in Quiescent Degassing at Mount Baker Volcano, Washington, USA; Evidence for a Stalled Intrusion in 1975 and Connection to a Deep Magma Source. J. Volcanology Geothermal Res. 186, 379–386. doi:10.1016/j.jvolgeores.2009.07.006
Werner, C., Kelly, P. J., Doukas, M., Lopez, T., Pfeffer, M., McGimsey, R., et al. (2013). Degassing of CO2, SO2, and H2S Associated with the 2009 Eruption of Redoubt Volcano, Alaska. J. Volcanology Geothermal Res. 259, 270–284. doi:10.1016/j.jvolgeores.2012.04.012
Keywords: MultiGas, monitoring, La Soufrière de Guadeloupe, fumaroles, hydrothermal unrest
Citation: Moune S, Moretti R, Burtin A, Jessop DE, Didier T, Robert V, Bonifacie M, Tamburello G, Komorowski J-C, Allard P and Buscetti M (2022) Gas Monitoring of Volcanic-Hydrothermal Plumes in a Tropical Environment: The Case of La Soufrière de Guadeloupe Unrest Volcano (Lesser Antilles). Front. Earth Sci. 10:795760. doi: 10.3389/feart.2022.795760
Received: 15 October 2021; Accepted: 04 January 2022;
Published: 14 March 2022.
Edited by:
David M. Pyle, University of Oxford, United KingdomReviewed by:
Marco Neri, National Institute of Geophysics and Volcanology, ItalyTjarda Roberts, UMR7328 Laboratoire de physique et chimie de l’environnement et de l’Espace (LPC2E), France
Copyright © 2022 Moune, Moretti, Burtin, Jessop, Didier, Robert, Bonifacie, Tamburello, Komorowski, Allard and Buscetti. This is an open-access article distributed under the terms of the Creative Commons Attribution License (CC BY). The use, distribution or reproduction in other forums is permitted, provided the original author(s) and the copyright owner(s) are credited and that the original publication in this journal is cited, in accordance with accepted academic practice. No use, distribution or reproduction is permitted which does not comply with these terms.
*Correspondence: Severine Moune, moune@ipgp.fr