Geochemical reactions altering the mineralogical and multiscale pore characteristics of uranium-bearing reservoirs during CO2 + O2 in situ leaching
 Xingyu Zhou1,2,3
  Wei Wang1,2,3*
  Qinghe Niu1,2,3*
  Qizhi Wang4,5 Xuebin Su6 Genmao Zhou6 Lixin Zhao6 Zhongmin Ji7 Xiaofei Qi8 Lanlan Tian8 Jianhui Zhang1,2,3 Beibei Sun1,2,3
- 1Key Laboratory of Roads and Railway Engineering Safety Control, Ministry of Education (Shijiazhuang Tiedao University), Shijiazhuang, China
- 2State Key Laboratory of Mechanical Behavior and System Safety of Traffic Engineering Structures, Shijiazhuang Tiedao University, Shijiazhuang, China
- 3Hebei Technology and Innovation Center on Safe and Efficient Mining of Metal Mines, Shijiazhuang, China
- 4School of Civil Engineering, Hebei University of Science and Technology, Shijiazhuang, China
- 5Innovation Center of Disaster Prevention and Mitigation Technology for Geotechnical and Structural Systems of Hebei Province (Preparation), Shijiazhuang, China
- 6Department of In Situ Leaching Technology, Beijing Research Institute of Chemical Engineering and Metallurgy, Beijing, China
- 7School of Civil Engineering, Zhengzhou University of Technology, Zhengzhou, China
- 8The Second Geological Team of Hebei Coalfield Geology Bureau, Xingtai, China
CO2 + O2 in situ leaching has been extensively applied in uranium recovery in sandstone-type uranium deposits of China. The geochemical processes impact and constrain the leaching reaction and leaching solution migration; thus, it is necessary to study the CO2 + O2–water–rock geochemical reaction process and its influence on the physical properties of uranium-bearing reservoirs. In this work, a CO2 + O2–water–rock geochemical reaction simulation experiment was carried out, and the mineralogical and multiscale pore characteristics of typical samples before and after this simulation experiment were compared by X-ray diffraction and high-pressure mercury intrusion porosimetry (HPMIP). The results show that the CO2 + O2–water–rock geochemical reaction has complicated effects on the mineral compositions due to the various reaction modes and types. After the CO2 + O2–water–rock geochemical reaction, the femic minerals decrease and the clay minerals in the coarse sandstone, medium sandstone, fine sandstone, and siltstone increase, while the femic minerals and clay minerals in sandy mudstone show a contrary changing trend. The CO2 + O2–water–rock geochemical reaction decreases the total pore volume of uranium-bearing reservoirs and then promotes pore transformation from small scale to large scale. The fractal dimensions of macropores are decreased, and the fractal dimensions of mesopores, transition pores, and micropores are increased. The effects of felsic mineral and carbonate dissolution, secondary mineral precipitate, clay mineral swelling, and mineral particle migration are simultaneously present in the CO2 + O2 in situ leaching process, which exhibit the positive transformation and the negative transformation for the uranium-bearing reservoirs. The mineral dissolution may improve reservoir permeability to a certain degree, while the siltation effect will gradually reveal with the extension of CO2 + O2 in situ leaching. This research will provide a deep understanding of the physical property response of uranium-bearing reservoirs during CO2 + O2 in situ leaching and indicate the direction for the efficient recovery of uranium resources.
1 Introduction
Nuclear energy is a type of clean and green energy, and the development of nuclear power can increase the proportion of non-fossil energy, which conforms to the needs of the national energy strategy and helps achieve the “double carbon” goal in China. Natural uranium is the vital raw material for nuclear fuel (Cui et al., 2019), and accelerating the recovery of uranium resources has been highly valued by uranium mining and metallurgy departments (Kim et al., 2013). The sandstone-type uranium deposit is the main type of uranium resource in China (Yang et al., 2009), its main mining method is in situ leaching, and the uranium output of in situ leaching mining accounts for 90% of China’s total natural uranium output in 2021. Long-term technical research and field application transformed the in situ leaching mining method from acid in situ leaching and alkaline in situ leaching to CO2 + O2 in situ leaching. With the characteristics of low pollution and high efficiency, CO2 + O2 in situ leaching has been applied to low-grade, low-permeability, high-carbonate, and high-salinity uranium deposits and has achieved good effects in uranium resource exploitation (Zhao K. et al., 2022; Yang et al., 2022).
During the CO2 + O2 leaching process, the gas (CO2 + O2), liquid (reservoir water), and solid (rock matrix) are coupled and coexist in the uranium reservoir; thus, the complex geochemical reactions generate (dissolution, precipitation, and oxidation.) (Saunders et al., 2016) and change the internal structure and permeability of the reservoir (Zhao et al., 2018), restricting the efficiency of uranium resource exploitation (Zhao Y. et al., 2022).
Previous studies on gas–liquid–solid three-phase geochemical reactions were mainly carried out in the field of CO2 geological storage in saline water layers, oil/gas reservoirs, and deep coal seams (Shao et al., 2011; Niu et al., 2019a; Niu et al., 2019b; Niu et al., 2020a; Niu et al., 2020b; Niu et al., 2021a; Niu et al., 2021b). For example, Zhou et al. found that the CO2–water–rock reaction can induce mineral swelling, mineral precipitation, and mineral dissolution (Zhou et al., 2021); Niu et al. (2022) discussed the changes in the multiscale microstructure and permeability of the bedrock caused by a supercritical CO2–water–rock reaction, and this phenomenon can reduce the sealing property of the capping layer; Chen et al. (2018) analyzed the pore-scale multiphase flow, mass transport, and reactions during the CO2 dissolution trapping process and then built a pore-scale numerical model to describe the physicochemical processes. In terms of research on CO2 + O2 in situ leaching of uranium, on one hand, scholars mainly focus on the concentration, pH, and HCO3− of the leaching solution and determine the in situ leaching scheme of uranium deposits through on-site and indoor tests; for example, Du et al. (2013) conducted the industrial test of CO2 + O2 in situ leaching with seven point-type well groups, studied the uranium concentration in the leaching solution, and validated the feasibility of CO2 + O2 in situ leaching in the study area; Chen et al. (2013) predicted that the uranium leaching rate of a uranium mine in Inner Mongolia can reach about 65% based on the indoor leaching test. On the other hand, scholars mainly focus on the reaction mechanism of CO2 + O2 in situ leaching. Qiu et al. (2022) simulated the hydrodynamic process of solution evolution in the in situ leaching process, based on the numerical model of the TOUGHREACT framework, and found that the main influencing factors of uranium leaching concentration are the initial uranium ore grade and O2 injection concentration. Jia et al. (2021) investigated the in situ seepage field and geochemical reaction in a uranium reservoir and analyzed the influencing factor and mechanism of the uranium leaching rate based on the coupling of COMSOL-PHREEQC.
There is no doubt that the pore structure is the key factor affecting the solution leaching reaction and gas–liquid migration of the ore bed (Niu et al., 2017a; Niu et al., 2017b; Zeng et al., 2021; Zeng et al., 2022). The pore morphology, pore size distribution, fractal characteristic, and pore connectivity all affect the seepage capacity of the uranium reservoir, and it is, thus, crucial to finely evaluate these characteristic parameters. However, previous investigations on the CO2 + O2 in situ leaching process is superficial and defective, manifesting in three aspects: 1) the geochemical behavior and type during the CO2 + O2 in situ leaching process are inadequately cognizant, 2) the differential evolution characteristics of the CO2 + O2–water–rock geochemical reaction on the pore structure parameters of various uranium-bearing reservoirs are unknown, and 3) the influence mechanism of the multiscale pore structure during the CO2 + O2 in situ leaching process is insufficiently studied. Therefore, this work is organized to clarify the complex geochemical reactions that appeared in the CO2 + O2 in situ leaching process and their cooperative control mechanism on the multiscale pore structure.
In this study, the CO2 + O2–water–rock geochemical reaction of samples from the Qianjiadian uranium deposit is first performed; then, X-ray diffraction (XRD) and high-pressure mercury intrusion porosimetry (HPMIP) are performed to analyze the mineral composition and pore structure of samples, and finally, the geochemical behavior, evolution law, and mechanism of the pore structure in different uranium-bearing reservoirs are clarified. This study can be a guide for better understanding the coupling process and dynamically regulating the construction technique of CO2 + O2 in situ leaching in sandstone-type uranium deposits.
2 Experiment
2.1 Geological overview of the study area
The study area of this paper is the Qianjiadian uranium deposit, Inner Mongolia, China (Figures 1A, B). The Qianjiadian uranium deposit is distributed in the southeast uplift belt of the Songliao Basin (Wang Q. et al., 2022), where the main exposed strata include the Qingshankou Formation (K2qn), Yaojia Formation (K2y), and Nenjiang Formation (K2n) of the Upper Cretaceous and the Quaternary (Q) (Figure 1C). The Yaojia Formation is the main ore-bearing formation, and the Qingshankou Formation is the secondary ore-bearing formation (Figure 1D). The thickness of the Yaojia Formation ranges from 181.20 to 214.20 m, with an average of 197.88 m. The bottom depth of the ore formation ranges from 311.30 to 455.00 m, with an average of 420.18 m. The red and gray fine sandstones and a small amount of medium and coarse sandstones deposited in the fluvial phase are composed of more mudstone and siltstone interlayers with loose structures. The thickness of the mudstone interlayer is highly variable, with poor continuity in strike and tendency, and mostly lenticular. The thin mudstone is mostly gray and grayish, and the thicker mudstone is mostly purplish-red. Sediment grain size is mainly medium-to-fine sand, with coarse sand and a small amount of gravel seen at the bottom and more silt and mud at the top. Sandstone fragments of the Yaojia Formation are relatively rich in silica and aluminum elements, and the rock types are mainly lithic sandstone and feldspathic sandstone. The deposit has four aquifers, of which the lithology of the mineral-bearing aquifer in the upper section of the Yaojia Formation is mainly gray fine sandstone, with a small amount of thin-layered gray and purplish-red mudstone and gray muddy siltstone which are characterized by weak water-richness and permeability. The lithology of the mineral-bearing aquifer at the lower end is mainly light gray and light red fine-medium sandstone, with a small amount of fine siltstone.
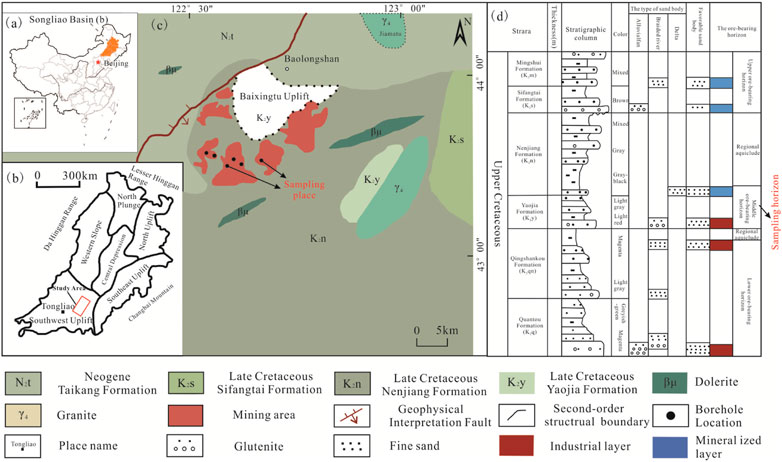
FIGURE 1. Geological background and sampling location. (A) shows that the Songliao Basin is located in northeast China, (B) shows that the Songliao Basin can be divided into six first-order tectonic units, (C) shows the exposed strata of the Qianjiadian uranium deposit, and (D) shows the comprehensive histogram of uranium-bearing deposits.
2.2 Sample collection
The rock samples were collected from the geological-prospecting boreholes drilled by the Beijing Institute of Chemical Metallurgy of Nuclear Industry. The selected samples originated from the middle ore-bearing horizon (Figure 1D). According to the differences in particle size, cementation degree, and mineral composition, the samples were classified as coarse sandstone, medium sandstone, fine sandstone, siltstone, and sandy mudstone (named CS, ZS, XS, FS, and SN, respectively) (Figure 2). The bulk samples were first prepared and dried in a constant temperature and humidity test box for 24 h at 60°C. Then, about 30 g of the processed samples was picked out and placed in the gas–liquid–solid high-temperature/pressure reactor for the CO2 + O2–water–rock geochemical reaction experiment. Finally, the deionized water and a certain proportion of CO2 and O2 were injected into the glass container in the reactor to conduct the CO2 + O2 in situ leaching simulation experiment.
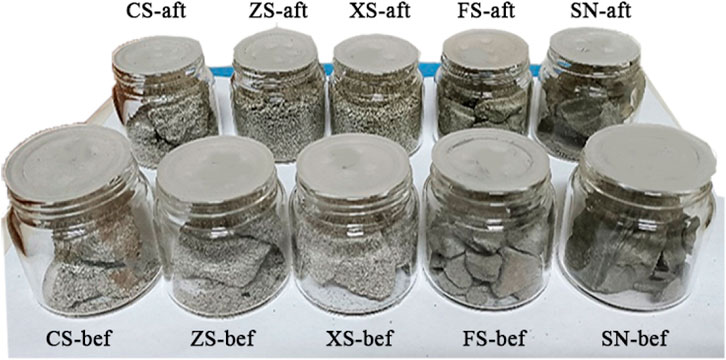
FIGURE 2. Images of samples used in this paper. CS-bef, ZS-bef, XS-bef, FS-bef, and SN-bef represent the samples before the geochemical reaction; CS-aft, ZS-aft, XS-aft, FS-aft, and SN-aft represent the samples after the geochemical reaction.
2.2 Experimental device and scheme
The CO2 + O2–water–rock geochemical reaction experiment was conducted in a gas–liquid–solid high-temperature/pressure reactor (Figure 3). This device mainly consists of three subsystems: the gas storage subsystem, the gas pressurization subsystem, and the reaction retort. The gas pressurization subsystem elevates the pressure of CO2/O2 from the gas storage subsystem to the design value. The pressurized gas CO2/O2 is injected into the reaction retort for participating in the geochemical reaction. The thermocouple, temperature sensor, and pressure sensor are installed on the reaction retort to maintain the required temperature/pressure conditions. The control accuracies of the temperature and pressure are 0.01°C and 0.01 MPa, respectively. The maximum temperature and pressure values of this device that can be reached are 150°C and 60 MPa, respectively.
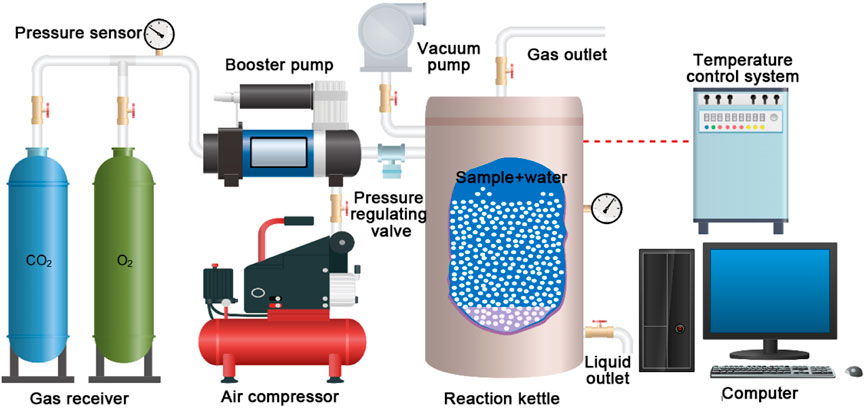
FIGURE 3. Schematic diagram of gas–liquid–solid high-temperature/pressure reactor.
Each sample was immersed in 30 ml deionized water. During the CO2 + O2–water–rock geochemical reaction process, the pressure of CO2 and O2 was set as 10 MPa and 6 MPa, respectively, according to the solution proportioning parameter field test (Yang et al., 2020). The ambient temperature of the geochemical reaction is 40°C, and the reaction time is 20 days.
2.3 Test method
The mineral component identification of the samples was conducted using an X-ray diffractometer (Bruker D8 Advance). Approximately 50-g samples were ground using a fully automatic crusher, and 10 g of each was screened using a sieve to obtain powder samples of less than 300 mesh. Then, the prepared powder sample was placed on the test instrument, and a copper X-ray tube operating at 40 kV and 30 mA was used with counts collected from 3° to 90° in steps of 0.02° and at a speed of 3°/min to obtain the scattering curve of the samples (Li et al., 2022a; Li et al., 2022b). After the test, the mineral compositions were obtained by profile fitting of the scattering curve.
The mineral constituent of samples during the CO2 + O2–water–rock geochemical reaction process was measured using the Empyrean X-ray diffractometer (Panako, Netherlands). Original rock blocks collected on site were first ground and sieved to obtain the powder samples with a size of <300 mesh. Then, they were placed on the test instrument, and the copper X-ray tube operating at 40 kV and 30 mA was used with counts collected from 3° to 90° in steps of 0.02° and at a speed of 3°/min to obtain the scattering curve of the samples. Finally, the mineral composition characteristics of samples were acquired by calculating the peak area of the X-ray spectrum.
The micropore structural characteristics of the samples were analyzed by the HPMIP method, which can measure pores of sizes between 3 nm and 950 μm. For HPMIP, the pores are assumed to be cylindrical, and the relationship between the mercury pressure and the pore radius can be determined by the Washburn equation (Kumar and Bhattacharjee, 2003):
where p is the mercury pressure, γ is the surface tension of mercury, θ is the wetting angle between mercury and the solid medium, and r is the pore radius.
The internal microstructure of uranium-bearing sandstone is extremely heterogeneous and has been confirmed to have fractal characteristics (Zeng et al., 2019; Zeng et al., 2022). The fractal dimension is usually used to characterize the irregularity of complex structures and can be calculated from the date of HPMIP, which is defined as
where N(r) is the number of units with the radius of r required to fill the entire fractal object; D is the fractal dimension.
The relationship between the diameter and length of capillaries follows a similar fractal scaling law (Yu et al., 2009):
where l is the tortuous length, r is the diameter of capillary tubes, l0 is the representative length of a straight capillary tube, and DT is the tortuosity dimension.
The mercury saturation SHg is defined as
where VHg is the mercury inlet volume and Vp is the total pore volume.
By combining Eqs 4, 5 and taking the logarithm, the following equation can be obtained (Su et al., 2018):
The fractal dimension can be obtained by the gradient of SHg and pc by using the double-logarithmic coordinate.
3 Results and discussion
3.1 Influence of the CO2 + O2–water–rock geochemical reaction on the mineral composition
The test results of XRD show that the quartz content, the albite content, and the micro-plagioclase content contribute 13.21%–38.23%, 19.66 %–28.40%, and 27.67 %–35.26%, respectively, of the total minerals of samples without a CO2 + O2–water–rock geochemical reaction, indicating that the felsic mineral dominates the substance composition in the Qianjiadian uranium deposit. Moreover, a small number of clay minerals are also developed in these samples, including chlorite, illite, and kaolinite. The chlorite content and the illite content of sample SN can reach 17.53% and 21.92%, displaying the typical mineral distribution characteristic of sandy mudstone.
Equations 7–13 show the ion changes after CO2 + O2 is injected in water and the geochemical reaction process of typical minerals. The formed solution of CO2 + O2 and water creates an acidic-oxidation environment, causing the occurrence of chemical reactions such as dissolution and precipitation.
The changes in the mineral content of samples before and after the CO2 + O2–water–rock geochemical reaction are shown in Figure 4. The mineral composition of the original sample is complex, and the types of geochemical reactions are various; thus, the mineral content demonstrates significantly inconsistent change trends. The samples CS, ZS, XS, FS, and SN represent coarse sandstone, medium sandstone, fine sandstone, siltstone, and sandy mudstone, respectively. After the CO2 + O2–water–rock geochemical reaction, the contents of quartz, albite, and micro-plagioclase in the coarse sandstone decrease by 9.05%, 12.68%, and 2.99%, respectively, while the contents of chlorite and illite in the coarse sandstone increase by 69.68% and 97.29%, respectively; the contents of albite, micro-plagioclase, chlorite, and illite in the medium sandstone increase by 4.29%, 8.27%, 77.45%, and 100%, respectively, and only the quartz content in the medium sandstone decreases by 31.44%; the contents of quartz and micro-plagioclase in the fine sandstone decrease by 54.4% and 51.13%, respectively, while the contents of albite, chlorite, and illite in the fine sandstone increase by 2.41%, 37.88%, and 92.07%, respectively; the contents of quartz and albite in the siltstone decrease by 54.43% and 51.13%, while the contents of micro-plagioclase, chlorite, and illite in the siltstone increase by 29.67%, 66.50%, and 68.85%, respectively; the contents of quartz, albite, and micro-plagioclase in the sandy mudstone increase by 81.23%, 49.34%, and 7.99%, while the chlorite and illite in the sandy mudstone decrease by 68.63% and 48.36%, respectively. To sum up, the felsic mineral and clay mineral exhibit an opposed change trend after the CO2 + O2–water–rock geochemical reaction. Specifically, the felsic mineral of coarse sandstone, medium sandstone, fine sandstone, and siltstone reduces by 1.95 %–103.15%; the clay mineral of coarse sandstone, medium sandstone, fine sandstone, and siltstone increases by 61.54–88.72%; and the felsic mineral and clay mineral of sandy mudstone increase and decrease by 138.55% and 57.36%, respectively.
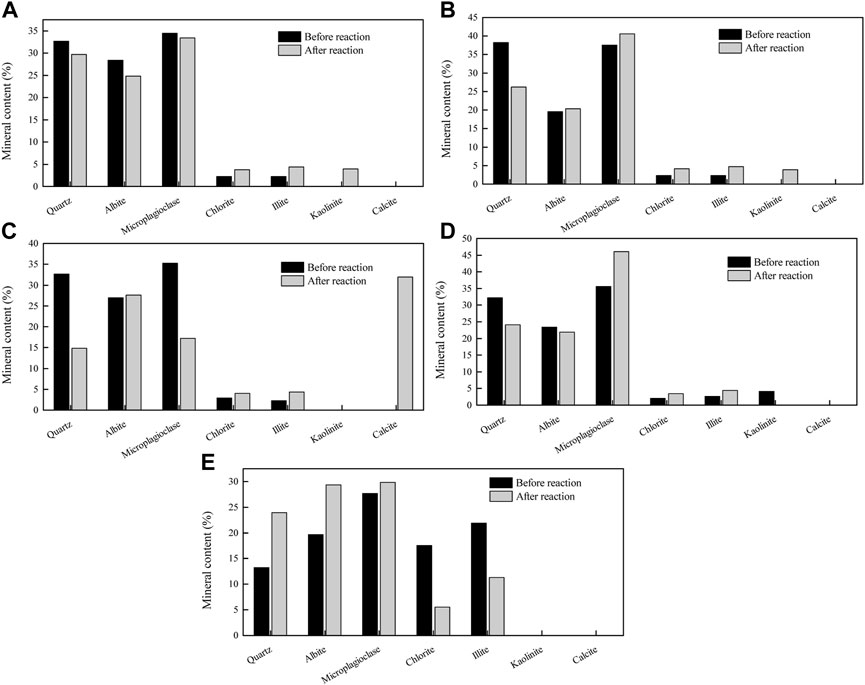
FIGURE 4. Change in the mineral content of samples before and after the CO2 + O2–water–rock geochemical reaction: (A–E) represent the samples CS, ZS, XS, FS, and SN.
According to Eqs 7–13, all the quartz, albite, micro-plagioclase, chlorite, and illite can react with the CO2 + O2 aqueous solution. For coarse sandstone, medium sandstone, fine sandstone, and siltstone, the dissolution of felsic mineral dominates the geochemical reaction, while the dissolution reaction of clay mineral in sandy mudstone occupies the main position during the CO2 + O2–water–rock geochemical reaction. Thus, the differential geochemical reaction is dramatically influenced by the initial mineral content in the ore bed, the reactions involving clay minerals may be unfavorable for CO2 + O2 in situ leaching, and the ore bed with high argillaceous content always acts as the aquiclude in the solution leaching process (Zhang T. et al., 2021).
3.2 Influence of the CO2 + O2–water–rock geochemical reaction on the pore structure
3.2.1 Analysis of the mercury intrusion/extrusion curve
The mercury intrusion/extrusion curves of samples measured by HPMIP are shown in Figure 5. The mercury intrusion curves of the samples belong to the “S” type in general, while the mercury extrusion curves approach the linear type. The extrusion hysteresis phenomenon appears during the HPMIP tests; the “hysteresis loop” of mercury intrusion and extrusion curves of coal can reflect the basic morphology of pores and their connectivity. As mentioned by many scholars (Song et al., 2019; Zhang et al., 2021; Pan et al., 2022), the open pores induce the mercury extrusion curve to form the “hysteresis loop,” while semi-closed pores do not have the “hysteresis loop” due to the equal inlet and outlet mercury pressures. Thus, the sandy mudstone is mostly composed of open pores, while a given mass of semi-closed pores with weak connectivity is developed in coarse sandstone, medium sandstone, fine sandstone, and siltstone.
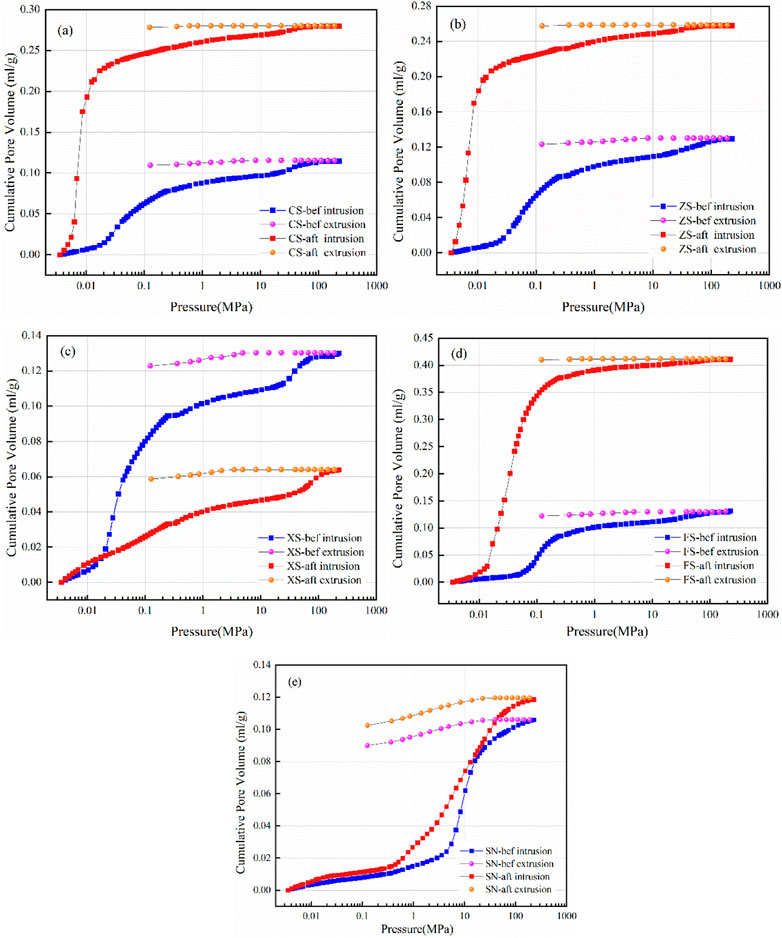
FIGURE 5. Mercury intrusion/extrusion curves of samples: (A–E) represent the samples CS, ZS, XS, FS, and SN.
After the CO2 + O2–water–rock geochemical reaction, the shapes of the hysteresis loop of the five samples have not changed, indicating that the CO2 + O2–water–rock geochemical reaction cannot change the pore morphological characteristic. However, the mercury intrusion curve before and after the CO2 + O2–water–rock geochemical reaction shows significant differences. The slope of the intrusion curve of coarse sandstone, medium sandstone, and siltstone samples becomes steepened after the CO2 + O2–water–rock geochemical reaction, while that of fine sandstone and sandy mudstone samples exhibits the opposite evolutionary trend. This reflects the difference in the difficulty of mercury injection in various aperture sections, which can be related to the influence of CO2 + O2–water–rock geochemical reaction on the pore size distribution.
The mercury withdrawal efficiencies of coarse sandstone, medium sandstone, fine sandstone, siltstone, and sandy mudstone are 4.53%, 4.80%, 5.47%, 6.94%, and 15.03%, respectively, while those of coarse sandstone, medium sandstone, fine sandstone, siltstone, and sandy mudstone reduce to 0.465%, 0.155%, 3.85%, 0.19%, and 14.52%, respectively, after the CO2 + O2–water–rock geochemical reaction. The decrease in mercury withdrawal efficiency indicates that part of mercury is intercepted and hindered in the pores with poor connectivity during the ejection process, which may be attributed to the precipitate during the CO2 + O2–water–rock geochemical reaction blocking the pore throats and changing the open pore to the semi-closed pore.
3.2.2 Analysis of pore size distribution
Many researchers have made the pore size classification for the resource and energy reservoirs, such as the classifications by Fu et al. (2005), Liu et al. (2018), Zhang et al. (2017), and IUPAC (Everett, 1972), while Ходот (1966) divided the pores into macropore (>1,000 nm), mesopore (100–1,000 nm), transition pore (10–100 nm), and micropore (<10 nm) according to the pore diameter, and this division method is more appropriate for this study.
The pore size distribution characteristics of samples before and after the CO2 + O2–water–rock geochemical reaction are shown in Figure 6. For the samples without the CO2 + O2–water–rock geochemical reaction, the pore size distribution of samples is quite uneven, showing that several pore volume peaks are distributed on the curves. Except for the sandy mudstone, the pore volume peaks of the other samples are within the range of the transition pore and macropore, while the pore volume stably is distributed within the range of the micropore and mesopore. The pore size distribution of sandy mudstone is special, and the pore volume peaks are mainly shown in the transition pore and mesopore. Apparently, after the CO2 + O2–water–rock geochemical reaction, larger pore volume peaks occur (samples CS, ZS, and FS) and more pore volume peak numbers form (samples XS and SN). This indicates that the CO2 + O2–water–rock geochemical reaction can change the pore size distribution and increase the heterogeneity of pores in samples.
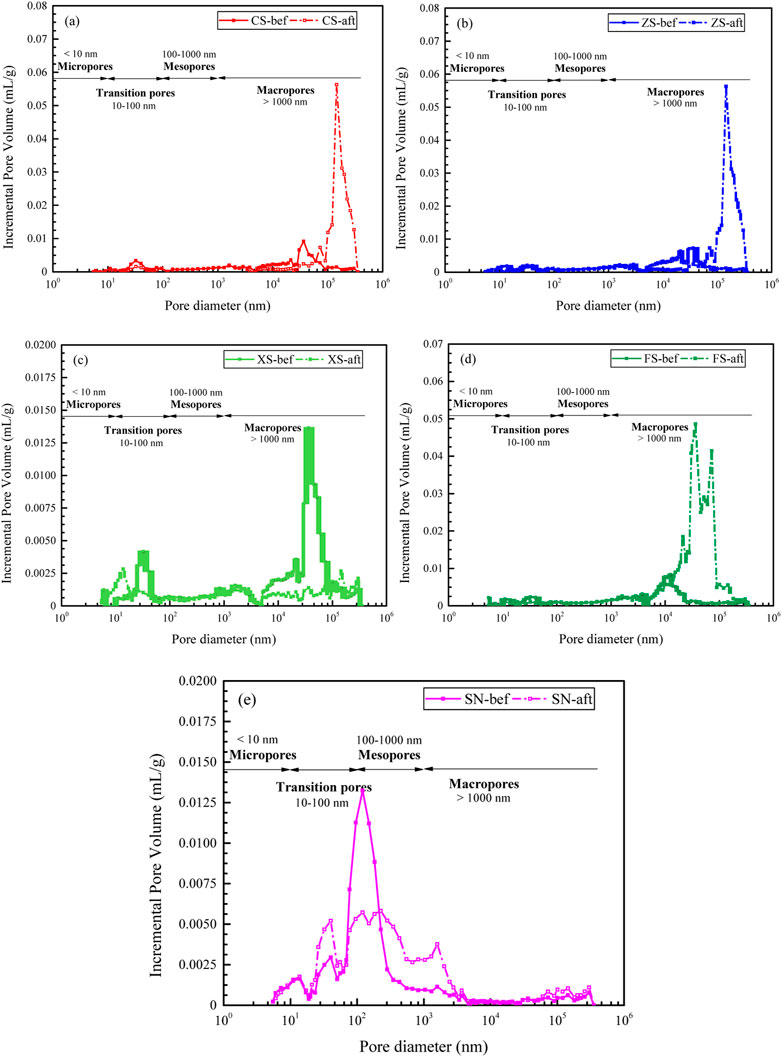
FIGURE 6. Pore distribution characteristics of samples: (A–E) represent the samples CS, ZS, XS, FS, and SN.
3.2.3 Analysis of the pore volume contribution rate
The total pore volumes of coarse sandstone, medium sandstone, fine sandstone, siltstone, and sandy mudstone without the CO2 + O2–water–rock geochemical reaction are 0.279 ml/g, 0.258 ml/g, 0.130 ml/g, 0411 ml/g, and 0118 ml/g, while those after the CO2 + O2–water–rock geochemical reaction decrease to 0.115 ml/g, 0130 ml/g, 0064 ml/g, 0.131 ml/g, and 0.106 ml/g, respectively. This means that the CO2 + O2–water–rock geochemical reaction has an adverse effect on the total pore volume.
Considering the heterogeneity of the mineral and microstructure of different uranium-bearing reservoirs (Sun et al., 2020), the influence of CO2 + O2–water–rock geochemical reaction on the full-scale pore may be inconsistent. The pore volume contribution rate is thus calculated and compared between different-sized pores (Figure 7). For the samples without CO2 + O2–water–rock geochemical reaction, the macropore dominates in all pores for coarse sandstone, medium sandstone, fine sandstone, and siltstone, followed by the mesopore and transition pore, and the micropore is inappreciable. The mesopore and transition pore of sandy mudstone have a larger proportion than the macropore and micropore. This is because of the large clay mineral content (chlorite and illite) in sandy mudstone; the particle of clay mineral is extremely small, and thus, the formed abundant pores are also small.
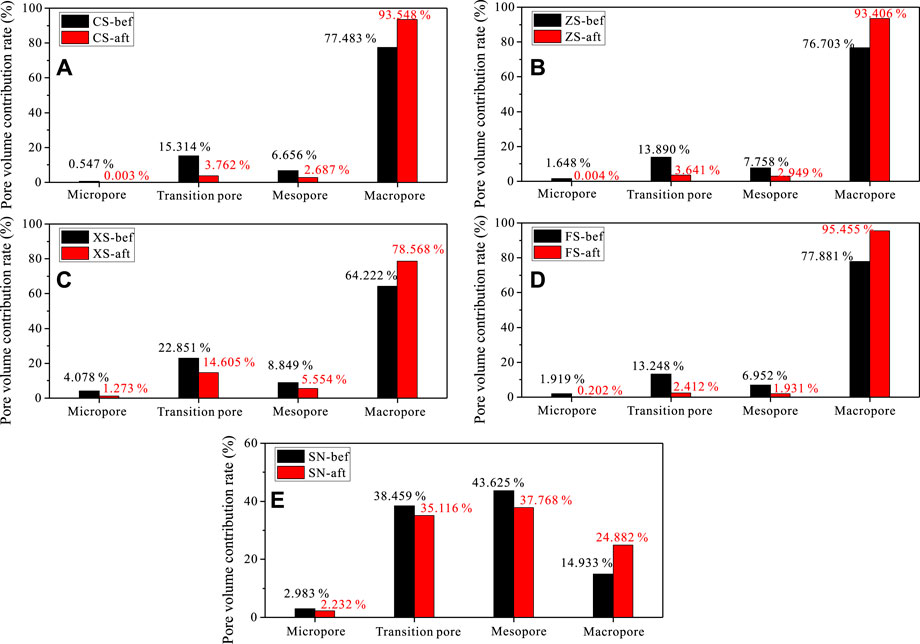
FIGURE 7. Pore volume contribution rate of samples: (A–E) represent the samples CS, ZS, XS, FS, and SN.
Although the macropore, mesopore, transition pore, and micropore are distributed unevenly, there exists a consistent evolutionary law of pores after the CO2 + O2–water–rock geochemical reaction. Evidently, the micropore, transition pore, and mesopore decrease, while the macropore increases when the samples undergo the CO2 + O2–water–rock geochemical reaction. Specifically, the total pore volume contribution rates of the micropore, transition pore, and mesopore of coarse sandstone, medium sandstone, fine sandstone, siltstone, and sandy mudstone reduce from 22.517%, 23.296%, 35.778%, 22.119%, 85.067% to 6.452%, 6.594%, 21.432%, 4.545%, and 75.116%, respectively, while the pore volume contribution rate of the macropore of coarse sandstone, medium sandstone, fine sandstone, siltstone, and sandy mudstone improves from 77.483%, 76.703%, 64.222%, 77.881%, 14.933% to 93.548%, 93.406%, 78.568%, 95.455%, and 24.882%, respectively. This knowledge is consistent with the studies conducted by Zhou et al. (2021) and Geng et al. (2022) because the reaction environment and rock lithology are analogous; however, Li H. et al (2020) found that the supercritical CO2 treatment can increase the micropore volume and connectivity in granite, which is contradictory to this study because the mineral constituent in the samples shows a large difference. This indicates that the CO2 + O2–water–rock geochemical reaction first affects the mineral composition and spatial distribution, and the full-scale pore structure is varied immediately.
3.3 Influence of the CO2 + O2–water–rock geochemical reaction on fractal characteristics
The relationship between lgSHg vs. lgpc of samples in this work are shown in Figure 8, which are fit by Eq. 6 with high correlation coefficients (R2 > 0.90), indicating that the pores of the samples have fractal properties and the fractal theory can be applied, as described in this work. For the coarse sandstone, medium sandstone, fine sandstone, and siltstone, the curves of lgSHg and lgpc can be divided into two segments, i.e., the low-pressure stage and the high-pressure stage, which, respectively, represent the macropore and the mesopore, transition pore, and micropore. For the sandy mudstone, the curves of lgSHg and lgpc can be divided into four segments, representing the four pore types.
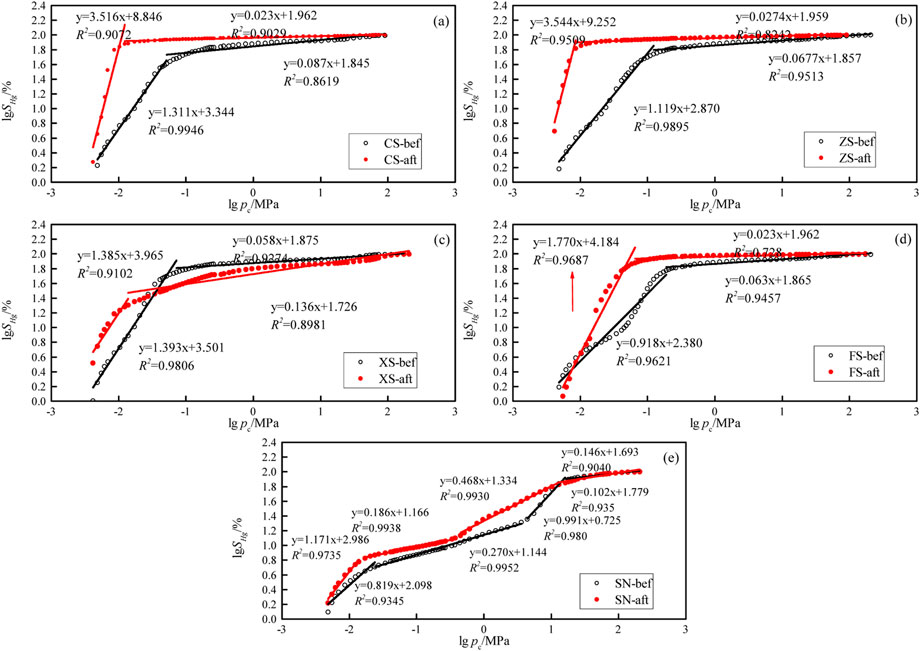
FIGURE 8. The relationship between lgSHg and lgpc of samples. (A–E) represent the samples CS, ZS, XS, FS, and SN.
The fractal dimension calculation results are shown in Table 1. The fractal dimension D1 ranges from 3 to 6 because it contains fractal dimensions for pore space and tortuosity, and the fractal dimension D2 ranges from 2 to 3. It can be seen that D1 is greater than D2, demonstrating that macropores are more complicated than mesopores, transition pores, and micropores (Jiang et al., 2016; Peng et al., 2017; Su et al., 2018). From the fractal dimension curve of samples SN-bef and SN-aft, it is found that there are notable multiple inflection points, and because the pore structure of samples SN-bef and SN-aft are more complex, four segments are divided and compared with samples CS, ZS, XS, and FS. After the CO2 + O2–water–rock geochemical reaction, the fractal dimensions of the macropore in coarse sandstone, medium sandstone, fine sandstone, siltstone, and sandy mudstone are in the range of 2.819–3.311, which are lower than those (3.385–5.544) before the CO2 + O2–water–rock geochemical reaction; the fractal dimensions of mesopore, transition pore, and micropore in coarse sandstone, medium sandstone, fine sandstone, siltstone, and sandy mudstone after the CO2 + O2–water–rock geochemical reaction are in the range of 2.063–2.991, which are larger than those (2.023–2.468) before the CO2 + O2–water–rock geochemical reaction; this reflects that the CO2 + O2–water–rock geochemical reaction makes large pores more smooth and uniform, promoting the improvement of roughness and heterogeneity of small pores.
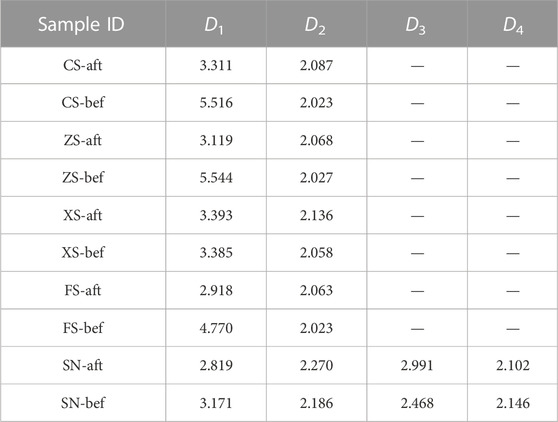
TABLE 1. Fractal dimension calculation results.
3.4 Reconstruction mechanism and enlightenment of the CO2 + O2–water–rock geochemical reaction on uranium-bearing reservoirs
As discussed previously, the geochemical reaction types are complex and their reconstruction effects on the pore structure are multifarious. The sample surface of representative coarse sandstone is relatively dense (Figure 9A), which then becomes rougher and bumpier (Figure 9B) by the destruction and reorganization of the pore structure. The intergranular pores are mainly developed in the original sample, while after the CO2 + O2–water–rock geochemical reaction, one part of the intergranular pores is dissolved and enlarged, and another part of adjacent intergranular pores is connected and formed to fracture. Moreover, some precipitates generated during the CO2 + O2–water–rock geochemical reaction process can block the pore. These reconstruction effects will occur simultaneously and influence the pore characteristics.
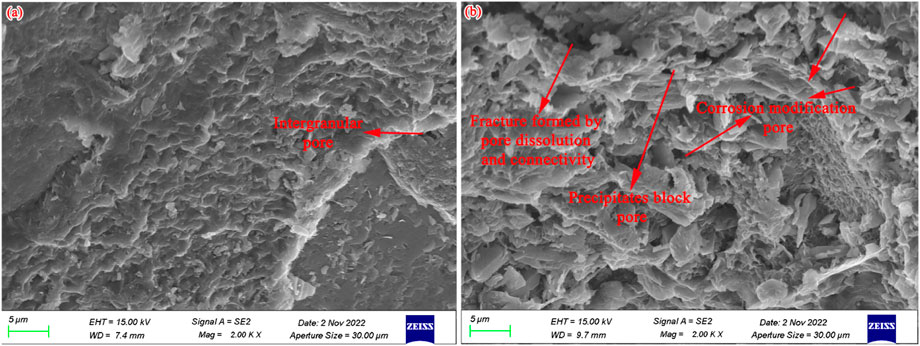
FIGURE 9. SEM images showing the reconstruction effect of the CO2 + O2–water–rock geochemical reaction on pore morphology. (A) Before the CO2 + O2–water–rock geochemical reaction; (B) after the CO2 + O2–water–rock geochemical reaction.
To clarify this reconstruction behavior, a schematic diagram describing the different reconstruction modes during the CO2 + O2–water–rock geochemical reaction process is shown in Figure 10. Considering the mineral composition and its fabric mode of uranium-bearing reservoirs, the microstructure of samples is shown in Figure 10A; the pores with different sizes are developed between the mineral detritus, including the connected macropores, the narrow mesopore, transition pore, and micropore with pore throats. The geochemical reactions between CO2 + O2, water, and rock expressed by Eqs 7–13 appear (Mitiku et al., 2013; Cui et al., 2021; Li S. et al., 2022), showing that 1) the quartz is dissolved weakly and its surface becomes rough and uneven, 2) the feldspar minerals (micro-plagioclase and albite) are resolved into the clay minerals (kaolinite, chlorite, and illite), 3) the carbonate minerals are completely dissolved into ions and preserved in the solution, and 4) the secondary mineral precipitates are generated during the geochemical reactions (Figure 10B). Additionally, the physical effects also appear in this process, such as clay mineral swelling by water absorption and the secondary mineral particle migration driven by the leaching solution.
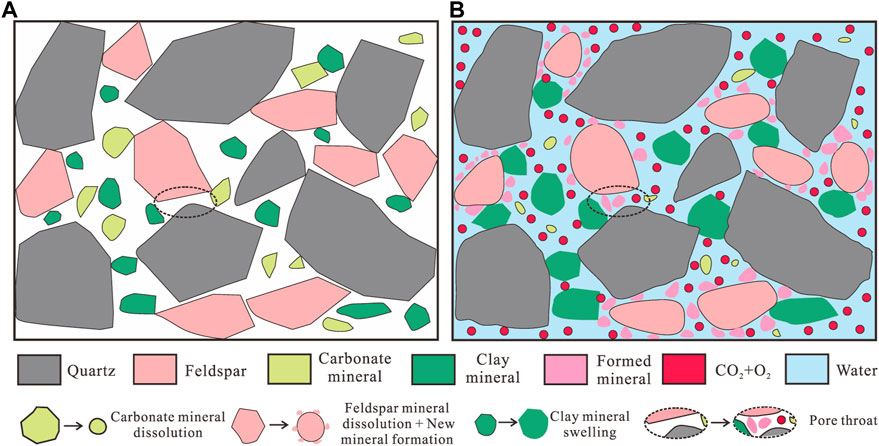
FIGURE 10. Schematic diagram of the CO2 + O2–water–rock geochemical reaction and its influence on the pore structure. (A) Before the CO2 + O2–water–rock geochemical reaction; (B) after CO2 + O2–water–rock geochemical reaction.
The aforementioned reactions lead to the differential transformation of the pore structure of uranium-bearing reservoirs, which can be classified as the positive transformation and negative transformation for CO2 + O2 in situ leaching. The positive transformation includes the dissolution of carbonate and feldspar minerals, which enlarges the pore space and promotes the connectivity between pores of different sizes and types; it shows a favorable aspect for the leaching of hosted uranium and the migration of the leaching solution. The negative transformation includes the secondary mineral precipitates and clay mineral swelling by water absorption. The formed mineral precipitates and clay mineral swelling can occupy the original space and reduce the pore volume, and simultaneously, these small mineral particles can flow with the leaching solution and block the pore throat, decreasing the connectivity of pores. The macropores always have a larger pore throat and are unaffected by the blocking effect; thus, the positive transformation is stronger than the negative transformation in the macropores. However, the pore throats with a small size (mesopore, transition pore, and micropore) are narrow and susceptible to the blocking effect, and then the positive transformation is weaker than the negative transformation in the mesopore, transition pore, and micropore, which exhibits the disadvantageous aspect for CO 2+ O2 in situ leaching. The two transformations are simultaneous and mutually restrictive, depending on the mineral composition, pore size distribution, and pore throat distribution (Li S. et al., 2020). For uranium-bearing reservoirs in the study area, the CO2 + O2–water–rock geochemical reaction promotes the expansion of the small pore percentage and reduction of the large pore percentage. This effect may improve the reservoir permeability to a certain degree, while the reservoir siltation effect will gradually reveal with the extension of CO2 + O2 in situ leaching (Zhao et al., 2018; Zhao K. et al., 2022); the reduction of the total pore volume of samples during the CO2 + O2–water–rock geochemical reaction process has confirmed this phenomenon. Moreover, in the field tests, the clay-blocking seepage had occurred in a part of uranium deposits (Xu, 2014; Wang et al., 2022), and there were no particularly effective solutions because of the weak acid–alkali solubility of clay minerals.
Therefore, only adopting the chemical enhancement permeability can hardly solve the blocking problem of uranium in situ leaching. The CO2 phase-change blasting method realizes reservoir stimulation using the rapid expansion of CO2 from the liquid state to gas state, whose technical principles are to 1) promote the fracture network generation induced by blasting shock waves and 2) extend and increase connectivity of the pore-fracture system by the gas wedging effect. This will provide the source power and smooth passage for the discharge of siltation sediment, and CO2 phase-change blasting and CO2 + O2 in situ leaching possess natural technology intersection. The residual CO2 in uranium reservoirs can also be used as one source of solvent for CO2 + O2 in situ leaching. Therefore, combining the CO2 phase-change blasting and CO2 + O2 in situ leaching method may be a potential physical-chemical reservoir stimulation direction for uranium-bearing reservoirs, and the mechanism and method for the dynamic regulation of permeability enhancement and CO2 + O2 in situ leaching are the focus of future research.
4 Conclusion
(1) The CO2 + O2–water–rock geochemical reaction has complicated effects on the mineral compositions due to the various reaction modes and types. After the CO2 + O2–water–rock geochemical reaction, the femic minerals decrease and the clay minerals in the coarse sandstone, medium sandstone, fine sandstone, and siltstone increase, while the femic mineral and clay mineral in sandy mudstone show the contrary changing trend. The dissolution of femic minerals mainly appears in coarse sandstone, medium sandstone, fine sandstone, and siltstone, while the dissolution of clay minerals always occurs in sandy mudstone.
(2) The mineral changes induced by the CO2 + O2–water–rock geochemical reaction are responsible for the reformation of the pore volume and pore size distribution. The CO2 + O2–water–rock geochemical reaction decreases the total pore volume of uranium-bearing reservoirs and promotes pore transformation from a small scale to large scale. The fractal dimensions of macropores are decreased, and the fractal dimensions of mesopore, transition pore, and micropore are increased, indicating that the CO2 + O2–water–rock geochemical reaction strengthens the homogeneity of large pores and heterogeneity of small pores.
(3) The effects of felsic mineral and carbonate dissolution, secondary mineral precipitate, clay mineral swelling, and mineral particle migration are simultaneously present in the CO2 + O2 in situ leaching process, which exhibit the positive and negative transformation for the uranium-bearing reservoirs. Mineral dissolution may improve reservoir permeability to a certain degree, while the siltation effect will gradually reveal with the extension of CO2 + O2 in situ leaching. To overcome this problem, the fusion of CO2 phase-change blasting and CO2 + O2 in situ leaching should be focused on to realize the efficient recovery of uranium resources.
Data availability statement
The original contributions presented in the study are included in the article/Supplementary Material, further inquiries can be directed to the corresponding authors.
Author contributions
Writing—original draft: XZ and QN; conceptualization: WW and QN; investigation: QW; validation: XS, GZ, and LZ; visualization: ZJ; supervision: XQ and LT; data curation: JZ and BS.
Funding
This work was supported by the National Natural Science Foundation of China (U1967208, 51979170, 11902208, and U2244228), the Hebei Natural Science Foundation (E2021210128, E2021210077, and E2020208071), the S&T Program of Hebei (22374102D and 216Z5403G), the Science and Technology Project of Hebei Education Department (QN2021129 and BJK2022010), the Autonomous Subject of School of Civil Engineering of Shijiazhuang Railway University (TMXN2204), and the Natural Science Foundation of Henan (222300420366).
Conflict of interest
The authors declare that the research was conducted in the absence of any commercial or financial relationships that could be construed as a potential conflict of interest.
Publisher’s note
All claims expressed in this article are solely those of the authors and do not necessarily represent those of their affiliated organizations, or those of the publisher, the editors, and the reviewers. Any product that may be evaluated in this article, or claim that may be made by its manufacturer, is not guaranteed or endorsed by the publisher.
References
Chen, J., Zhu, P., Xu, Q., Wei, X., and Liu, W. (2013). Laboratory test of neutral leaching of a uranium ore in Inner Mongolia. Uranium Min. Metallurgy 32, 72–75. [In Chinese]. doi:10.13426/j.cnki.yky.2013.02.013
Chen, L., Wang, M., Kang, Q., and Tao, W. (2018). Pore scale study of multiphase multicomponent reactive transport during CO2 dissolution trapping. Adv. Water Resour. 116, 208–218. doi:10.1016/j.advwatres.2018.02.018
Cui, G., Wei, J., Feng, X., Liu, J., Elsworth, D., Chen, T., et al. (2019). Preliminary study on the feasibility of co-exploitation of coal and uranium. Int. J. Rock Mech. Min. Sci. 123, 104098. doi:10.1016/j.ijrmms.2019.104098
Cui, G., Yang, L., Fang, J., Qiu, Z., Wang, Y., and Ren, S. (2021). Geochemical reactions and their influence on petrophysical properties of ultra-low permeability oil reservoirs during water and CO2 flooding. J. Pet. Sci. Eng. 203, 108672. doi:10.1016/j.petrol.2021.108672
Du, Z., Niu, X., Su, X., Liu, N., Guo, Z., Cheng, Z., et al. (2013). CO2+O2in-situ leaching test of one uranium deposit in Inner Mongolia. Uranium Min. Metallurgy 32, 1–4. [In Chinese].
Everett, D. (1972). Manual of Symbols and Terminology for physicochemical Quantities and Units, Appendix II: Definitions, Terminology and Symbols in colloid and surface Chemistry. Colloid Surf. Chem. 31, 577–638. doi:10.1351/pac197231040577
Fu, X., Qin, Y., Zhang, W., Wei, C., and Zhou, R. (2005). Fractal classification and natural classification of coal pore structure based on migration of coal bed methane. Chin. Sci. Bull. 50, 66–71. doi:10.1007/bf03184085
Geng, W., Wang, J., Zhang, X., Wang, J., Dong, C., Zhou, G., et al. (2022). Influence of acid treatment on pore structure and fractal characterization of a tight sandstone: A case study from Wudun sag, Dunhuang basin. Acta. Geol. sin-engl. doi:10.1111/1755-6724.15008
Jia, M., Jin, J., Chen, M., and Su, X. (2021). Simulation and analysis technology of leaching performance of sandstone-type uranium deposit based on COMSOL-PHREEQC. Uranium Geol. 37, 745–754. [In Chinese]. doi:10.3969/j.issn.1000-0658.2021.37.081
Jiang, F., Chen, D., Chen, J., Li, Q., Liu, Y., Shao, X., et al. (2016). Fractal analysis of shale pore structure of Continental gas shale reservoir in the Ordos basin, NW China. Energy fuels. 30, 4676–4689. doi:10.1021/acs.energyfuels.6b00574
Kim, J., Tsouris, C., Mayes, R. T., Oyola, Y., Saito, T., Janke, C. J., et al. (2013). Recovery of uranium from Seawater: A Review of Current Status and future research needs. Sep. Sci. Technol. 48, 367–387. doi:10.1080/01496395.2012.712599
Kumar, R., and Bhattacharjee, B. (2003). Study on some factors affecting the results in the use of MIP method in concrete research. Cem. Concr. Res. 33, 417–424. doi:10.1016/s0008-8846(02)00974-2
Li, H., Zhou, L., Lu, Y., Yan, F., Zhou, J., and Tang, J. (2020a). Changes in pore structure of Dry-hot rock with supercritical CO2 treatment. Energy fuels. 34, 6059–6068. doi:10.1021/acs.energyfuels.0c00250
Li, S., Zhang, S., Zou, Y., Ma, X., Ding, Y., Li, N., et al. (2020b). Pore structure alteration induced by CO2–brine–rock interaction during CO2 energetic fracturing in tight oil reservoirs. J. Pet. Sci. Eng. 191, 107147. doi:10.1016/j.petrol.2020.107147
Li, Y., Chen, J., Yang, J., Liu, J., and Tong, W. (2022a). Determination of shale macroscale modulus based on microscale measurement: A case study concerning multiscale mechanical characteristics. Pet. Sci. 19, 1262–1275. doi:10.1016/j.petsci.2021.10.004
Li, Y., Chen, J., Elsworth, D., Pan, Z., and Ma, X. (2022b). Nanoscale mechanical property variations concerning mineral composition and contact of marine shale. Geosci. Front. 13, 101405. doi:10.1016/j.gsf.2022.101405
Li, S., Zhang, S., Xing, H., and Zou, Y. (2022c). CO2–brine–rock interactions altering the mineralogical, physical, and mechanical properties of carbonate-rich shale oil reservoirs. Energy 256, 124608. doi:10.1016/j.energy.2022.124608
Liu, Y., Yao, Y., Liu, D., Zheng, S., Sun, G., and Chang, Y. (2018). Shale pore size classification: An NMR fluid typing method. Mar. Pet. Geol. 96, 591–601. doi:10.1016/j.marpetgeo.2018.05.014
Mitiku, A. B., Li, D., Bauer, S., and Beyer, C. (2013). Geochemical modelling of CO2–water–rock interactions in a potential storage formation of the North German sedimentary basin. Appl. Geochem. 36, 168–186. doi:10.1016/j.apgeochem.2013.06.008
Niu, Q., Pan, J., Cao, L., Ji, Z., Wang, H., Wang, K., et al. (2017a). The evolution and formation mechanisms of closed pores in coal. Fuel 200, 555–563. doi:10.1016/j.fuel.2017.03.084
Niu, Q., Cao, L., Sang, S., Zhou, X., Wang, Z., and Wu, Z. (2017b). The adsorption-swelling and permeability characteristics of natural and reconstituted anthracite coals. Energy 141, 2206–2217. doi:10.1016/j.energy.2017.11.095
Niu, Q., Cao, L., Sang, S., Zhou, X., and Liu, S. (2019a). Experimental study of permeability changes and its influencing factors with CO2 injection in coal. J. Nat. Gas. Sci. Eng. 61, 215–225. doi:10.1016/j.jngse.2018.09.024
Niu, Q., Pan, J., Jin, Y., Wang, H., Li, M., Ji, Z., et al. (2019b). Fractal study of adsorption-pores in pulverized coals with various metamorphism degrees using N2 adsorption, X-ray scattering and image analysis methods. J. Pet. Sci. Eng. 176, 584–593. doi:10.1016/j.petrol.2019.01.107
Niu, Q., Cao, L., Sang, S., Zhou, X., Wang, W., Yuan, W., et al. (2020a). Study on the anisotropic permeability in different rank coals under influences of supercritical CO2 adsorption and effective stress and its enlightenment for CO2 enhance coalbed methane recovery. Fuel 262, 116515. doi:10.1016/j.fuel.2019.116515
Niu, Q., Wang, W., Liang, J., Yuan, W., Wen, L., Chang, J., et al. (2020b). Investigation of the CO2 flooding behavior and its collaborative controlling factors. Energy fuels. 34, 11194–11209. doi:10.1021/acs.energyfuels.0c01286
Niu, Q., Cao, L., Sang, S., Wang, W., Zhou, X., Yuan, W., et al. (2021a). Experimental study on the softening effect and mechanism of anthracite with CO2 injection. Int. J. Rock Mech. Min. Sci. 138, 104614. doi:10.1016/j.ijrmms.2021.104614
Niu, Q., Cao, L., Sang, S., Wang, W., Yuan, W., Chang, J., et al. (2021b). A small-scale experimental study of CO2 enhanced injectivity methods of the high-rank coal. Pet. Sci. 18, 1427–1440. doi:10.1016/j.petsci.2021.08.006
Niu, Q., Wang, Q., Wang, W., Chang, J., Chen, M., Wang, H., et al. (2022). Responses of multi-scale microstructures, physical-mechanical and hydraulic characteristics of roof rocks caused by the supercritical CO2-water-rock reaction. Energy 238, 121727. doi:10.1016/j.energy.2021.121727
Pan, J., Mou, P., Ju, Y., Wang, K., Zhu, Q., Ge, T., et al. (2022). Micro-nano-scale pore stimulation of coalbed methane reservoirs caused by hydraulic fracturing experiments. J. Pet. Sci. Eng. 214, 110512. doi:10.1016/j.petrol.2022.110512
Peng, C., Zou, C., Yang, Y., Zhang, G., and Wang, W. (2017). Fractal analysis of high rank coal from southeast Qinshui basin by using gas adsorption and mercury porosimetry. J. Pet. Sci. Eng. 156, 235–249. doi:10.1016/j.petrol.2017.06.001
Qiu, W., Liu, Z., Yang, Y., Weng, H., Jia, Y., Wu, J., et al. (2022). Reactive transport numerical modeling of CO2+O2in-situ leaching in sandstone-type uranium ore. Sci. Sin. Technol. 52, 627–638. [In Chinese]. doi:10.1360/SST-2021-0009
Saunders, J. A., Pivetz, B. E., Voorhies, N., and Wilkin, R. T. (2016). Potential aquifer vulnerability in regions down-gradient from uranium in situ recovery (ISR) sites. J. Environ. Manage. 183, 67–83. doi:10.1016/j.jenvman.2016.08.049
Shao, H., Ray, J. R., and Jun, Y. (2011). Effects of salinity and the extent of water on supercritical CO2-induced Phlogopite dissolution and secondary mineral formation. Environ. Sci. Technol. 45, 1737–1743. doi:10.1021/es1034975
Song, Y., Xie, J., Fu, H., and Xin, L. (2019). Pore fractal characteristics of Lignite at different temperatures based on mercury intrusion test. Geotech. Geol. Eng. 37, 4837–4844. doi:10.1007/s10706-019-00943-9
Su, P., Xia, Z., Qu, L., Yu, W., Wang, P., Li, D., et al. (2018). Fractal characteristics of low-permeability gas sandstones based on a new model for mercury intrusion porosimetry. J. Nat. Gas. Sci. Eng. 60, 246–255. doi:10.1016/j.jngse.2018.10.008
Sun, B., Hou, S., Zeng, S., Bai, X., Zhang, S., and Zhang, J. (2020). 3D characterization of porosity and minerals of low-permeability uranium-bearing sandstone based on multi-resolution image fusion. Nucl. Sci. Tech. 31, 105. doi:10.1007/s41365-020-00810-w
Wang, Q., Liang, X., Wang, W., Niu, Q., Zhuo, J., Su, X., et al. (2022a). Mineral composition and full-scale pore structure of Qianjiadian sandstone-type uranium deposits: Application for in situ leaching mining. Geofluids 2022, 1–15. doi:10.1155/2022/2860737
Wang, R., Wang, Q., Li, P., Yang, J., Zheng, W., Niu, B., et al. (2022b). Soluble immersion channel blocking control measures in CO2+O2 leaching process. Nonferrous Met. Sect. 74, 59–64. [In Chinese]. doi:10.3969/j.issn.1671-4172.2022.03.0010
Xu, G. (2014). Analysis of the main technological parameters of CO2+O2in situ leaching uranium and problems by chemical precipitation blocking. Uranium Min. Metallurgy 33, 197–202. [In Chinese]. doi:10.13426/j.cnki.yky.2014.04.006
Yang, X., Ling, M., Sun, W., Luo, X., Lai, X., Liu, C., et al. (2009). The Genesis of sandstone-type uranium deposits in the Ordos basin, NW China: Constraints provided by fluid inclusions and stable isotopes. Int. Geol. Rev. 51, 422–455. doi:10.1080/00206810902757339
Yang, X., Chen, G., Yi, Z., Ma, S., Mula, D., and Ding, Y. (2020). Discussion on relationship between uranium leaching and HCO3- concentration by CO2+O2in-situ leaching sandstone type uranium deposit. Uranium Min. Metallurgy 39, 11–16. [In Chinese]. doi:10.13426/j.cnki.yky.2020.01.003
Yang, Y., Qiu, W., Liu, Z., Song, J., Wu, J., Dou, Z., et al. (2022). Quantifying the impact of mineralogical heterogeneity on reactive transport modeling of CO2 + O2in-situ leaching of uranium. Acta Geochim. 41, 50–63. doi:10.1007/s11631-021-00502-1
Yu, B., Cai, J., and Zou, M. (2009). On the physical properties of apparent two-phase fractal porous media. Vadose Zone J. 8, 177–186. doi:10.2136/vzj2008.0015
Zeng, S., Zhang, N., Zhang, S., Sun, B., Tan, K., Duan, X., et al. (2019). Fractal characteristics of uranium-bearing sandstone structure and their effects on acid leaching. Energy Sci. Eng. 7, 1852–1866. doi:10.1002/ese3.396
Zeng, S., Shen, Y., Sun, B., Zhang, N., Zhang, S., and Feng, S. (2021). Pore structure evolution characteristics of sandstone uranium ore during acid leaching. Nucl. Eng. Technol. 53, 4033–4041. doi:10.1016/j.net.2021.06.011
Zeng, S., Shen, Y., Sun, B., Tan, K., Zhang, S., and Ye, W. (2022). Fractal kinetic characteristics of uranium leaching from low permeability uranium-bearing sandstone. Nucl. Eng. Technol. 54, 1175–1184. doi:10.1016/j.net.2021.10.013
Zhang, P., Lu, S., Li, J., Xue, H., Li, W., and Zhang, P. (2017). Characterization of shale pore system: A case study of Paleogene Xin'gouzui formation in the Jianghan basin, China. Mar. Pet. Geol. 79, 321–334. doi:10.1016/j.marpetgeo.2016.10.014
Zhang, M., Duan, C., Li, G., Fu, X., Zhong, Q., Liu, H., et al. (2021a). Determinations of the multifractal characteristics of the pore structures of low-middle-and high-rank coal using high-pressure mercury injection. J. Pet. Sci. Eng. 203, 108656. doi:10.1016/j.petrol.2021.108656
Zhang, T., He, X., Zhang, K., Wang, X., Liu, Y., and Jia, H. (2021b). Hydrogeology response to the coordinated mining of coal and uranium: A Transparent physical experiment. Geofluids 2021, 1–10. doi:10.1155/2021/6236455
Zhao, L., Deng, J., Xu, Y., and Zhang, C. (2018). Mineral alteration and pore-plugging caused by acid in situ leaching: A case study of the wuyier uranium deposit, xinjiang, NW China. Arab. J. Geosci. 11, 707. doi:10.1007/s12517-018-4064-7
Zhao, K., Sun, Z., Du, C., Zhou, Y., Li, G., Lui, J., et al. (2022a). Blockage and uranium migration via CO2 + O2 leaching within autoclave: A test study from mengqiguer deposit in yili basin, northwest of China. J. Radioanal. Nucl. Chem. 331, 2631–2644. doi:10.1007/s10967-022-08321-1
Zhao, Y., Gao, Y., Luo, C., and Liu, J. (2022b). Improved uranium leaching efficiency from low-permeability sandstone using low-frequency vibration in the CO2+O2 leaching process. J. Rock Mech. Geotech. Eng. 14, 770–780. doi:10.1016/j.jrmge.2021.10.013
Keywords: CO2 + O2–water–rock geochemical reaction, pore size distribution, fractal characteristic, mineral dissolution and precipitation, pore throat
Citation: Zhou X, Wang W, Niu Q, Wang Q, Su X, Zhou G, Zhao L, Ji Z, Qi X, Tian L, Zhang J and Sun B (2023) Geochemical reactions altering the mineralogical and multiscale pore characteristics of uranium-bearing reservoirs during CO2 + O2 in situ leaching. Front. Earth Sci. 10:1094880. doi: 10.3389/feart.2022.1094880
Received: 10 November 2022; Accepted: 09 December 2022;
Published: 06 January 2023.
Edited by:
Hongjian Zhu, Yanshan University, ChinaReviewed by:
Hewu Liu, Anhui University of Science and Technology, ChinaCheng Huang, Luoyang Institute of Science and Technology, China
Zhou He, North China University of Water Conservancy and Electric Power, China
Copyright © 2023 Zhou, Wang, Niu, Wang, Su, Zhou, Zhao, Ji, Qi, Tian, Zhang and Sun. This is an open-access article distributed under the terms of the Creative Commons Attribution License (CC BY). The use, distribution or reproduction in other forums is permitted, provided the original author(s) and the copyright owner(s) are credited and that the original publication in this journal is cited, in accordance with accepted academic practice. No use, distribution or reproduction is permitted which does not comply with these terms.
*Correspondence: Wei Wang, wangweiuuu@163.com; Qinghe Niu, qinghniu@163.com