Application of GMDH model to predict pore pressure
 Guozhong Gao1
  Omid Hazbeh2
  Meysam Rajabi3 Somayeh Tabasi4
  Hamzeh Ghorbani5,6* Reza Seyedkamali7 Milad Shayanmanesh8
  Ahmed E. Radwan9
  Amir H. Mosavi10*
- 1College of Geophysics and Petroleum Resources, Yangtze University, Wuhan, China
- 2Faculty of Earth Sciences, Shahid Chamran University, Ahwaz, Iran
- 3Department of Mining Engineering, Birjand University of Technology, Birjand, Iran
- 4Faculty of Industry and Mining (Khash), University of Sistan and Baluchestan, Zahedan, Iran
- 5Young Researchers and Elite Club, Ahvaz Branch, Islamic Azad University, Ahvaz, Iran
- 6Faculty of General Medicine, University of Traditional Medicine of Armenia (UTMA), Yerevan, Armenia
- 7Department of Petroleum Engineering, Amir Kabir University, Tehran, Iran
- 8Department of Petroleum Engineering, Science and Research Branch, Islamic Azad University, Tehran, Iran
- 9Faculty of Geography and Geology, Institute of Geological Sciences, Jagiellonian University, Kraków, Poland
- 10Independent Researcher, Kyiv, Ukraine
Pore pressure (PP) is one of the essential and very critical parameters in the oil and gas industry, especially in reservoir engineering, exploitation, and production. Forecasting this valuable parameter can prevent huge costs incurred by the oil and gas industry. This research aims to develop a algorithm to better predict PP in subsurface -formations. Based on this, information from three wells (F1, F2, and F3) representing one of the Middle East oil fields was used in this research. The input variables used in this research include; laterolog (LLS), photoelectric index (PEF), compressional wave velocity (Vp), porosity (NPHI), gamma ray (spectral) (SGR), density (RHOB), gamma ray (corrected) (CGR), shear wave velocity (Vs), caliper (CALI), resistivity (ILD), and sonic transit time (DT). Based on the results presented in the heat map (Spearman’s correlation), it can be concluded that the pairs of parameters RHOB-PEF, CGR-SGR, RHOB-CALL, DT-PEF, PP-RHOB, Vs-RHOB, ILD-LLS, DT-CGR, and DT-NPHI are connected. In this research the GS-GMDH methods is used for modeling which is based on the Group method of data handling (GMDH). The results of this research show that this algorithm has an average error of RMSE = 1.88 Psi and R2 = 0.9997, indicating its high-performance accuracy. The difference between this method and the conventional GMDH method is that it can use three or more variables instead of two, which can improve prediction accuracy. Furthermore, by using the input of each neuron layer, the proposed model can communicate with other adjacent and non-adjacent layers to solve complex problems in the simplest possible way.
Introduction
Pore pressure (PP) is one of the most prominent and widely used parameters in various petroleum fields, from the start of drilling to determining and optimizing the production of oil and gas flow as well as reservoir planning (Ma et al., 2015). The high importance of this parameter in reservoir engineering, exploitation, and drilling has sparked the interest of several authors in researching such an important parameter (Peng et al., 2021). This very important parameter is measured and reported through direct measurement of PP using the Modular Formation Dynamics Tester (MDT) (Carnegie et al., 2002; Baouche et al., 2020). Another tool that measures formation pressure is the Repeat Formation Tester (RFT), which is a routine tool in the petroleum industry (MacArthur et al., 2000; Matar et al., 2019; Jafarizadeh et al., 2022). But one of the reasons that has made the use of these tools problematic is that they are expensive and time-consuming to drive (Ma et al., 2018). As a result of such reports, which are generated using expensive tools, the determination and estimation of PP for specific depths are limited. Various methods have been proposed to predict PP, including its determination through petrophysical logs and seismic data (Rajabi et al., 2022b). One of the most important good features in a drilling operation is the safety of the drilling path. Once the PP is determined, drilling engineers can drill a safe well trajectory and reach the target easily. One of the primary causes of the blowout event was the inability to accurately identify PP at various reservoir points and well trajectories. Because blowout events cause irreparable damage to the hydrocarbon fluids inside the reservoir, preventing them can be of great benefit to the oil and gas industry, environmental safety, as well as oil and gas reserves (Hassanpouryouzband et al., 2020).
Literature review
Given the important and constructive role of the PP in drilling, production, and reservoir planning, it can also play a useful role in its prediction. Several authors have developed methods to predict the PP in the last few decades. Among them, we can mention the Eaton model in 1975, which is one of the oldest methods for determining this important parameter. The model used in this method includes the determination of overburden pressure using structural pressure and structural matrix (Eaton, 1975). Following this method, Ethen attempted to modify his method to improve prediction accuracy, and by incorporating porosity and shear wave velocity (Vs), he was able to present a new model (Zhang, 2011). In 1995, Bowers presented a model based on the difference in pressure wave speed and mud wave speed that was able to demonstrate effective stress analysis in this model (Bowers, 1995). In order to examine and analyze this model, two coefficients are needed, which can be examined and analyzed through these two coefficients of the Bowers model (Bowers, 1995; Zhang, 2011). Based on this model, by drawing the measurement point between the effective stress and shear wave speed, a correlation relationship can be created to generate the code and the final model. The model’s ambiguity is that the variety of lithology can have a positive effect on the model’s uncertainty and provide acceptable results (Zhang, 2011). In 2012, Atashbari and Tingay (2012) presented a model based on Eaton’s 1957 model. In this model, the porosity and compressibility parameters of the rock are related to the PP, which generates an analytical model. In this model, porosity intensity is dependent on PP. This model is one of the models that is much more practical than other models and is highly dependent on porosity and shows compressibility pressure (Atashbari and Tingay, 2012). Many researchers have used empirical equations to predict PP, which is based on Eaton’s model. The research results of these researchers show that the error presented in this model increases, especially when it is used in different sedimentary basins with different lithologies (Hutomo et al., 2019; Radwan et al., 2019).
Many researchers have recently been able to forecast the value of PP and fracture pressure using artificial intelligence algorithms in order to better predict the PP and FP in subsurface reservoirs. This is certainly relevant if the model is independent of the normal velocity trend and depends on the porosity (Rabbani and Babaei, 2019; Galkin et al., 2021; Ponomareva et al., 2021; Zakharov, 2021; Martyushev et al., 2022; Ponomareva et al., 2022). In 2000, Sadiq and Nashawi (2000) used artificial intelligence methods to predict formation failure pressure, which is the last point of formation PP. The networks used include the back propagation neural network (BPNN) and the generalized regression neural network (GRNN). The results of this research show that GRNN has a higher performance accuracy than other algorithms (Sadiq and Nashawi, 2000). In the same year, Murakami et al. (2000) predicted PP using the BPNN algorithm. The results demonstrated that this model has a high level of performance accuracy (Murakami et al., 2000). Six years later, Siruvuri et al. (2006) proposed a model employing a neural network algorithm for predicting PP in one of the fields located in the Gulf of Mexico (Siruvuri et al., 2006). Four years later, proposed a model employing a neural network algorithm to predict PP in two of the large oil fields located in Iran. The results of this article are better than the results presented in previous articles (Ashena et al., 2010). Three years later, in 2013, Hu et al. (2013) studied drilling pressure prediction and structure optimization. In this research, three algorithms, BPNN, multilayer perceptron (MLP), and GRNN, have been used to predict PP in one of Iran’s oil reservoirs. In this study, they used four input data sets, including permeability (K), depth (MD), density (RHOB), and porosity (NPHI). The results presented in this article show that the BPNN performance accuracy is higher than that of GRNN and MLP models (Hu et al., 2013). In the same year, Keshavarzi and Jahanbakhshi (2013) used the combined FF-BPNN algorithm to predict PP for one of the fields in southwest Iran. In this research, four input parameters are used to predict this important parameter. The parameters used in this research included RHOB, MD, gamma-ray (GR), and compressive wave (DTCO). The results shown in this research demonstrate the high-performance accuracy of this algorithm (Keshavarzi and Jahanbakhshi, 2013). Six years later, in 2019, Ahmed et al. (2019) used the MLP-NN hybrid algorithm to predict PP using drilling parameters (weight on bit (WOB), rotational speed (ROP), and mud weight (MW)), as well as general logs of NPHI, RHOB, and DTCO. After reviewing the results presented in this article, we came to the conclusion that the performance accuracy of this algorithm was high (Ahmed et al., 2019). Two years later, used three algorithms with the combination of multilayer extreme learning machine model hybridized (MELM), MLP, and least squares support vector machine (LSSVM) with the combination of a particle swarm optimization (PSO) algorithm to predict PP for one oil field in the south of Iran. In this article, petrophysical data were used for this purpose. The results show that the combined MELM-PSO algorithm has a higher performance accuracy than other algorithms. A year later, in 2022, used 9 ML, and four had the best accuracy for predicting PP. Out of the nine algorithms, four algorithms gave more accurate results: decision tree (DT), adaboost (ADA), random forest (RF), and transparent open box (TOB). After examining the results presented in this research, it is clear that the DT algorithm has higher performance accuracy than other algorithms. Photoelectric absorption factor (PEF), GR, temperature (T), RHOB, sonic shear-wave (DS), and compressional shear-wave (DC) were used as input data in this study.
This study aims to determine PP using petrophysical logs (12 petrophysical logs) using a GS-GMDH artificial intelligence algorithm that has not been used previously to predict this key parameter. This algorithm, which is an advanced version of the GMDH algorithm, was able to solve the problems and shortcomings of the GMDH algorithm and was able to provide an accurate prediction for PP. This method differs from the conventional GMDH (GS-GMDH) method in that it can use three or more variables instead of two. Also, this algorithm has been able to communicate with other adjacent and non-adjacent layers by using the input of each neuron layer and can solve complex problems in the simplest possible way. One of the features that distinguishes this article from other articles is that no article has used this algorithm so far, and the capability of this algorithm is that it has the ability to increase the accuracy of performance for small and large data sets at every level.
Methodology
In the past, in order to determine the key and important parameters of the oil and gas industry, old methods, experimental equations, and laboratory methods were used. Among these methods are those that can be used to determine reservoir key parameters; nano-polymer (Khodaeipour et al., 2018; Mohamadian et al., 2022); drilling (Darvishpour et al., 2019); preventing blow out (Abdali et al., 2021); formation damage (Mohammadian and Ghorbani, 2015; Mohamadian et al., 2022); experimental equations for production and reservoir parameters (Tehrani et al., 2022). However, today, with the advancement of technology and a set of artificial intelligence algorithms that are accessible, cheap, and fast, it is possible to replace the old methods that are sometimes full of bugs. Among the articles that used artificial intelligence to determine and predict key parameters, the following can be mentioned: key parameters for reservoirs (Naveshki et al., 2021; Alakbari et al., 2022; Rajabi et al., 2022a; Ayoub Mohammed et al., 2022; Hassan et al., 2022; Jafarizadeh et al., 2022); drilling (Beheshtian et al., 2022; Rajabi et al., 2022c); petrophysics (Ayoub et al., 2022; Gao et al., 2022; Kamali et al., 2022).
Flow diagram
The flow diagram presented in Figure 1 shows the determination and prediction of PP value using the GS-GMDH algorithm. As it is clear in this flow diagram, first the data are collected for the wells of an oil field. Later, by using the normalization method (Eq. 1) (Hazbeh et al., 2021; Beheshtian et al., 2022), the input and output variables are normalized. After that, by using the heat map matrix, it is possible to detect the effect of the parameters on each other, and then, by using technical analysis, a comparison was made between the experimental models and this method. Finally, according to the comparison of the error parameters, the results of this method and its GS-GMDH were evaluated and obtained the most acceptable results.
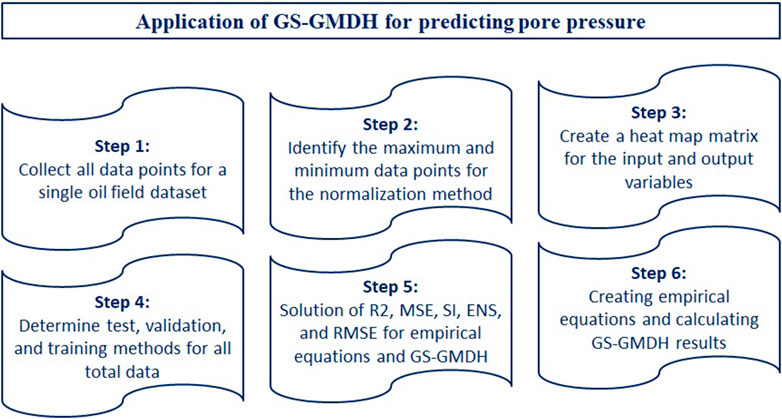
FIGURE 1. Flow diagram for PP prediction.
GMDH for determination of PP
One of the most useful and self-organizing methods is the group data processing method (GMDH). This method is one of the ANN methods and is widely used to predict PP (Ahmadi et al., 2007; Nasir et al., 2019; Kamali et al., 2022). This method is among the methods that act like the human brain (Rahman et al., 2012). This method works in such a way that it uses a multiple input D = [d1i, d2i and .... dni] and after passing through the hidden layers (N) to the output Si [i=1, 2 and .. .] will arrive with complex networks (Nguyen et al., 2019). In this method, the analytical functions are transferred to the quadratic nodes and using complex mathematical methods to solve the equations with the quadratic method, they are connected together and new nodes are created, as well as a new way of communicating with the nodes (Nariman-Zadeh et al., 2002). Using the analytical method and finding the f function, a solution to reach the desired output can be found. The function f can be used as a function close to the output and a number close to the number of the output function (Jafarian et al., 2017). Therefore, the output function (Si) can be shown as follows (Eq. 2):
In order to determine the training related to GMDH, the difference between the least squares estimate and its actual value should be calculated (Armaghani et al., 2022). This equation is shown as Eq. 3:
In order to optimize and find several inputs and pairs of outputs, the following function is used for this purpose (Eq. 4):
In order to express the form of polynomial equation, Eq. 5 is used:
In order to create a general mathematical relationship between limited inputs and individual outputs, this can be done by drawing a quadratic equation and groups related to the neuron (Atashkari et al., 2007). The form of Equation 6 can be obtained by determining and minimizing the coefficients from the relationship between Eqs 3 and 4 (Elbaz et al., 2021). In order to minimize the RMSE, the quadratic equation (δmin) can be expressed as binary [0,1] to obtain and create the values with the highest R value and the lowest RMSE, respectively (Naderpour et al., 2020). Combined Eq. 6 is shown in the following form:
In order to solve and reach the least squared error value, we must use Eq. 7. In this equation, a parameter is defined as a matrix, which is defined as follows:
The processes shown previously have been used to determine the hidden layer connectivity for neurons (Kordnaeij et al., 2015). Therefore, in order to determine the accuracy, the following equation is used (Eq. 8):
GS-GMDH for determination of PP
One of the problems and disadvantages of GMDH is that this algorithm can hardly solve nonlinear problems with high input variables in sentences with only two neurons in each polynomial (Bonakdari et al., 2020). Since the problems related to determining PP using petrophysical variables are non-linear and complex. As a result, in this study, a type of artificial intelligence algorithm called GS-GMDH is investigated, which can solve non-linear problems easily (Tsai and Yen, 2017; Shahbazbeygi et al., 2021). Among the other limitations of this algorithm is that it has only two variables as input for each neuron, and this algorithm has not been able to analyze patterns with complex nonlinear polynomial equations (López-Belchí et al., 2018). In order to solve these problems with this algorithm, a method called GS-GMDH has been used. In order to code this algorithm, MATLAB R2012b software was used. For the suggested method more variables can be used instead of two variables. Also, this algorithm has been able to create communication with other adjacent and non-adjacent layers by using the input of each neuron layer and can solve complex problems in the simplest possible way (Jahed Armaghani et al., 2020). In this method, two adjacent layers and one non-adjacent layer can be selected for each light, and at the end, by using the following equation, the optimal structure can be formed and the problem solved by the Akaike information criterion (AIC). The flowchart of this method is presented in Figure 2 which adapted from Jahed Armaghani et al., 2020.
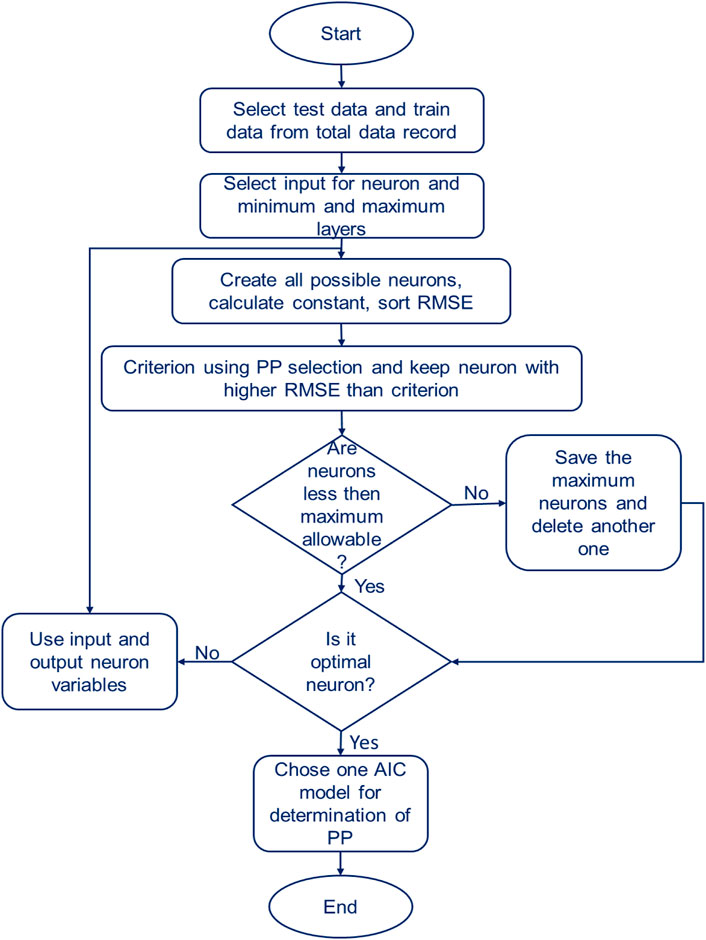
FIGURE 2. GS-GMDH flowchart for PP prediction.
Figure 3 shows the structure of GS-GMDH for predicting PP with three layers and a dip. As shown in this figure, the connection of the input variables (i.e., SGR, PEF, NPHI, ILD, LLS, DT, RHOB, CGR, CALI, Vs. and Vp) to neurons (i.e., N1, N2 and N3) and the network is introduced in this figure. Accordingly, a model for predicting PP has been established and developed.
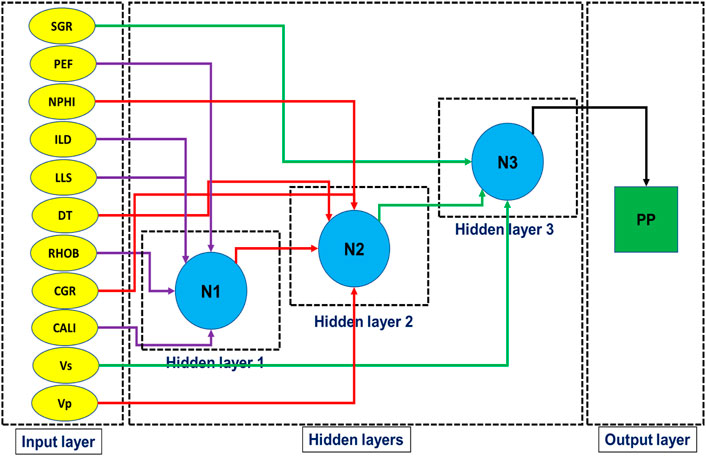
FIGURE 3. GS-GMDH flowchart for PP prediction.
Error parameters
To determine and validate the results of the GS-GMDH model with predictive empirical methods to predict PP based on laterolog (LLS), PEF, compressional wave velocity (Vp), porosity (NPHI), gamma ray (spectral) (SGR), density (RHOB), gamma ray (corrected) (CGR), Vs, caliper (CALI), resistivity (ILD), sonic transit time (DT), the following statistical methods are used for this purpose: root mean square error (RMSE), Nash–Sutcliffe model (EN–S), R-square (R2), mean square error (MSE), and scatter index (SI).
Mean square error (MSE):
Root means square error (RMSE):
Nash–Sutcliffe model (EN–S):
R-square (R2):
Scatter index (SI):
Data description
The data used in this article includes three wells (F1, F2 and F3) related to one of the oil fields located in the Middle East. In order to build this algorithm, data related to two wells, F1 and F2 (1511 data points), has been used, and in order to test this algorithm, data related to well F3 (1237 data points) has been used. Some data points in this study were outliers, and with outlier detection, they were removed from the main data collection. The input and output variables used in this research include: laterolog (LLS), PEF, Vp, porosity (NPHI), SGR, density (RHOB), CGR, Vs, caliper (CALI), resistivity (ILD), DT, PP. The statistical information related to the data related to this article is presented in Table 1.
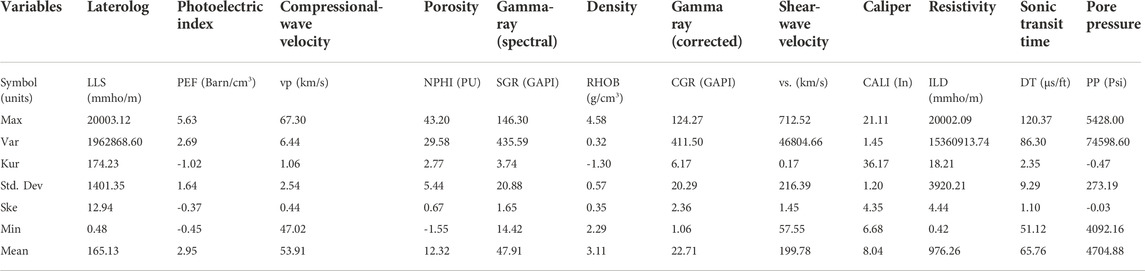
TABLE 1. Statistical information related to three wells F1, F2 and F3 related to one of the oil fields located in Middle East.
Among the equations that can be used to obtain relationships between variables is Spearman’s correlation coefficient (R). Spearman’s relationship is mentioned as Eq. 10:
Figure 4 shows the heat map diagram for input and output variables to determine and predict PP based on Spearman’s correlation. As the information in this figure shows, the pairs of variables RHOB-PEF, CGR-SGR, RHOB-CALL, DT-PEF, PP-RHOB, Vs-RHOB, ILD-LLS, DT-CGR, and DT-NPHI are dependent on each other. The results depicted in this figure show the relationship between the variables, which determines the closeness and relationship between the parameters.
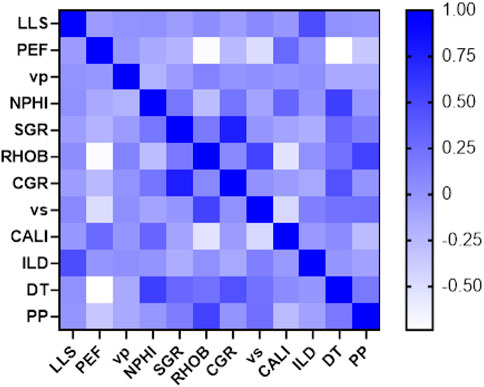
FIGURE 4. Heat map diagram for relationship between input variables.
Result and discussion
Two wells, F1 and F2, with a total of 2151 data sets, were used to obtain and develop the GS-GMDH algorithm. During the algorithm’s development, 1511 data sets (70% of the total data) were utilized as training data sets. This algorithm was validated using 320 data sets (15% of the total data) and tested using 320 data sets (15% of the total data). In order to obtain the performance accuracy of this algorithm (GS-GMDH), the error parameters mentioned in this article have been used. The results of the training, testing, and validation of the data are presented in Table 2.
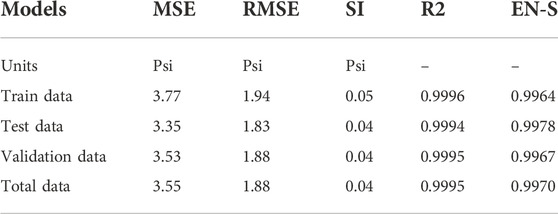
TABLE 2. Prediction of PP based on GS-GMDH model for train (70% of total data), test (15% of total data), validation (15% of total data) and total data (100% of total data) based on two wells F1 and F2 (1511 data points).
The results in Table 2 demonstrate this algorithm’s high-performance accuracy for training, testing, validation, and total data. As shown in Table 2, the error value for this algorithm for test data is MSE = 3.35 Psi, RMSE = 1.83 Psi, R2 = 0.9994, and SI = 0.04.
The results shown in Figure 5 demonstrate the accuracy of this algorithm. As it is well shown in this figure, the output of training, testing, validation, and total data has been shown with good performance accuracy. The results of R2 of the data shown in this algorithm for the whole data are about 0.9995.
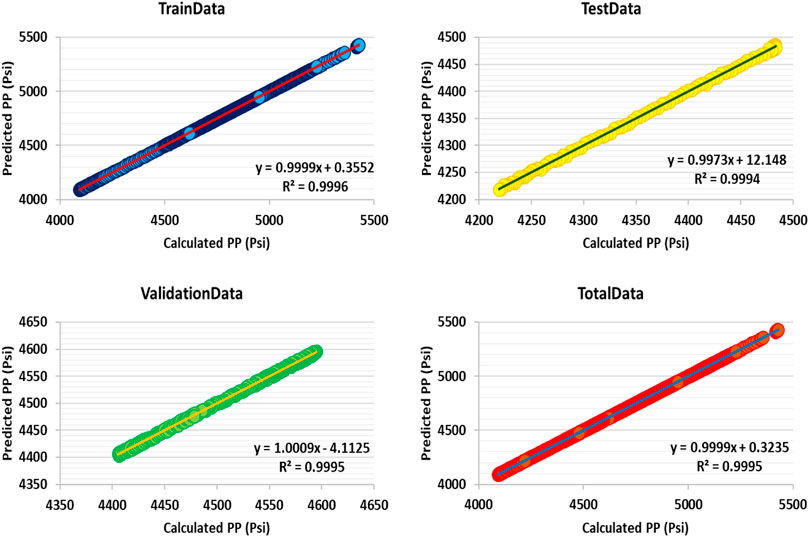
FIGURE 5. Cross plot for PP prediction by GS-GMDH based on two wells F1 and F2 data points (1511 data points).
Based on the results presented in Figure 6 and Table 3, which are reported from the information related to well F3 (1200 data points) and by using this algorithm (GS-GMDH), it can be concluded that this algorithm has high performance accuracy. This algorithm has the capability to show high performance accuracy even with low and high data sets, and it can also be used to determine and predict PP for other models. According to the results presented in this article, this algorithm can even be used to determine other key parameters of the reservoir.
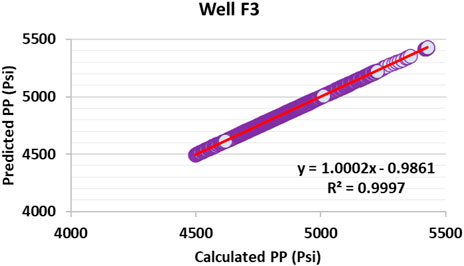
FIGURE 6. Cross plot for PP prediction by GS-GMDH based on wells F1 and F2 data points (1511 data points) for well F3 (1200 data points).
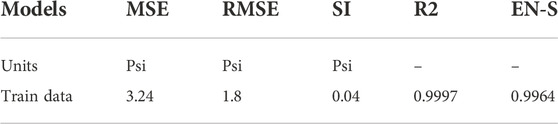
TABLE 3. Prediction of PP based on GS-GMDH model for well F3 (1200 data point) based on wells F1 and F2 data points.
Recommendation for future work
The PP parameter is one of the most critical elements that has many applications in drilling engineering, reservoir, operation, and petrophysics. Because the industry must pay a large fee to obtain this critical parameter, the best (low-cost and fast) way to determine this method is to use other optimizer and network algorithms, or their hybrids. Among the suggestions that can be made to predict this important parameter, the following articles can be mentioned: teaching-learning-based optimization algorithms (TLBO) (Choubineh et al., 2017; Ponomareva et al., 2022); firefly algorithm (FF) (Ghorbani et al., 2017c; Rao and Krishna, 2019; Zakharov et al., 2022); multilayer perceptron’s (MLP), ANN and genetic optimization algorithm (GA) (Zaranezhad et al., 2019; Ghorbani et al., 2020a; Ghorbani et al., 2020b; Abad et al., 2021a; Ranaee et al., 2021); multiple hidden layers extreme learning machine algorithms (MELM) (Hazbeh et al., 2021a; Rajabi et al., 2021; Abad et al., 2022); distance-weighted K-nearest-neighbor (DWKNN) (Rashidi et al., 2020; Farsi et al., 2021); deep learning and fuzzy algorithm (Abad et al., 2021b; Barjouei et al., 2021).
Conclusion
Pore pressure is one of the important and key parameters directly related to drilling and drilling engineers. This parameter is also indirectly related to production, petrophysics, and reservoir engineering. To determine this key parameter, it is necessary to spend a lot of money and time and use special tools, which makes the work difficult for petroleum engineering and the petroleum industry. Therefore, researchers have started to think of a solution to determine this key parameter using artificial intelligence algorithms. The GS-GMDH method was used to predict PP using data from three wells F1, F2, and F3 (2711 data points) associated with an oil field in the Middle East. The developed model was built using 70% of the data related to wells F1 and F2 (1511 data points), then using 15% of the data as test (320 data points) and 15% of the data as validation (320 data points). Input variables to predict PP consist of laterolog (LLS), PEF, Vp, porosity (NPHI), SGR, density (RHOB), CGR, Vs, caliper (CALI), resistivity (ILD), and DT. For this purpose, the coding of a GMDH method called GS-GMDH has been used. This method differs from the traditional GMDH method in that it can use three or more variables instead of two. Furthermore, this algorithm has been able to communicate with other adjacent and non-adjacent layers by using the input of each neuron layer and can solve complex problems in the simplest possible way. Based on the results presented in the heat map (Spearman’s correlation), it can be concluded that the pairs of parameters RHOB-PEF, CGR-SGR, RHOB-CALL, DT-PEF, PP-RHOB, Vs-RHOB, ILD-LLS, DT-CGR, and DT-NPHI have been connected. In order to check this method for predicting PP, data from well F3 (1200 data points) has been used. After checking the results, it is clear that the error of this method is RMSE = 1.88 psi and R2 = 0.9997, which shows the high accuracy of this algorithm. It is suggested to use this method in determining other widely used reservoir parameters that have many input variables. The reason for using this method for these key parameters with many input variables is that the best outcome can be achieved by connecting the variables.
Data availability statement
Data can be available upon reasonable requests for the academic purposes through the corresponding authors.
Author contributions
Author Contributions, Conceptualization, HG, AM, RS, OH, and GG; methodology, MR, GG, and HG; software, AM, GG, and HG; validation, HG, GG, and RS; formal analysis, MR, GG, and HG; investigation, ST, RS, GG, AM, and HG.; resources, OH, ST, GG, and HG; data curation, AM, GG, and HG; writing—original draft preparation, SD, GG, MR, HG, AR, and ST; writing—review and editing, AR, GG, HG, and RS; visualization, MR, ST, GG, HG, and AR; supervision, GG and HG; project administration, GG, HG, and AM All authors have read and agreed to the published version of the manuscript.
Acknowledgments
The authors would like to thank Yangtze University to provide the financial support to conduct the research work presented in this paper.
Conflict of interest
The authors declare that the research was conducted in the absence of any commercial or financial relationships that could be construed as a potential conflict of interest.
Publisher’s note
All claims expressed in this article are solely those of the authors and do not necessarily represent those of their affiliated organizations, or those of the publisher, the editors and the reviewers. Any product that may be evaluated in this article, or claim that may be made by its manufacturer, is not guaranteed or endorsed by the publisher.
References
Abad, A. R. B., Mousavi, S., Mohamadian, N., Wood, D. A., Ghorbani, H., Davoodi, S., et al. (2021a). Hybrid machine learning algorithms to predict condensate viscosity in the near wellbore regions of gas condensate reservoirs. J. Nat. Gas Sci. Eng. 95, 104210. doi:10.1016/j.jngse.2021.104210
Abad, A. R. B., Tehrani, P. S., Naveshki, M., Ghorbani, H., Mohamadian, N., Davoodi, S., et al. (2021b). Predicting oil flow rate through orifice plate with robust machine learning algorithms. Flow Meas. Instrum. 81, 102047. doi:10.1016/j.flowmeasinst.2021.102047
Abad, A. R. B., Ghorbani, H., Mohamadian, N., Davoodi, S., Mehrad, M., Aghdam, S. K.-Y., et al. (2022). Robust hybrid machine learning algorithms for gas flow rates prediction through wellhead chokes in gas condensate fields. Fuel 308, 121872. doi:10.1016/j.fuel.2021.121872
Abdali, M. R., Mohamadian, N., Ghorbani, H., and Wood, D. A.Department of engineering, Najafabad branch, Islamic Azad University, Najafabad, Iran (2021). Petroleum well blowouts as a threat to drilling operation and wellbore sustainability: Causes, prevention, safety and emergency response. J. Constr. Materials| Special Issue Sustain. Petroleum Eng. ISSN 2652, 3752. doi:10.36756/jcm.si1.1
Ahmadi, H., Mottaghitalab, M., and Nariman-Zadeh, N. (2007). Group method of data handling-type neural network prediction of broiler performance based on dietary metabolizable energy, methionine, and lysine. J. Appl. Poult. Res. 16, 494–501. doi:10.3382/japr.2006-00074
Ahmed, A., Elkatatny, S., Ali, A., Mahmoud, M., and Abdulraheem, A. (2019). New model for pore pressure prediction while drilling using artificial neural networks. Arab. J. Sci. Eng. 44, 6079–6088. doi:10.1007/s13369-018-3574-7
Alakbari, F. S., Mohyaldinn, M. E., Ayoub, M. A., Muhsan, A. S., and Hussein, I. A. (2022). A reservoir bubble point pressure prediction model using the Adaptive Neuro-Fuzzy Inference System (ANFIS) technique with trend analysis. PloS one 17, e0272790. doi:10.1371/journal.pone.0272790
Armaghani, D. J., Harandizadeh, H., Momeni, E., Maizir, H., and Zhou, J. (2022). An optimized system of GMDH-ANFIS predictive model by ICA for estimating pile bearing capacity. Artif. Intell. Rev. 55, 2313–2350. doi:10.1007/s10462-021-10065-5
Ashena, R., Moghadasi, J., Ghalambor, A., Bataee, M., Ashena, R., and Feghhi, A. (2010). Neural networks in BHCP prediction performed much better than mechanistic models. Beijing, China: OnePetro.
Atashbari, V., and Tingay, M. (2012). Pore pressure prediction in carbonate reservoirs. Mexico City, Mexico: OnePetro.
Atashkari, K., Nariman-Zadeh, N., Gölcü, M., Khalkhali, A., and Jamali, A. (2007). Modelling and multi-objective optimization of a variable valve-timing spark-ignition engine using polynomial neural networks and evolutionary algorithms. Energy Convers. Manag. 48, 1029–1041. doi:10.1016/j.enconman.2006.07.007
Ayoub, M. A., Elhadi, A., Fatherlhman, D., Saleh, M. O., Alakbari, F. S., and Mohyaldinn, M. E. (2022). A new correlation for accurate prediction of oil formation volume factor at the bubble point pressure using Group Method of Data Handling approach. J. Petroleum Sci. Eng. 208, 109410. doi:10.1016/j.petrol.2021.109410
Ayoub Mohammed, M. A., Alakbari, F. S., Nathan, C. P., and Mohyaldinn, M. E. (2022). Determination of the gas–oil ratio below the bubble point pressure using the adaptive neuro-fuzzy inference system (ANFIS). ACS Omega 7, 19735–19742. doi:10.1021/acsomega.2c01496
Baouche, R., Sen, S., and Boutaleb, K. (2020). Distribution of pore pressure and fracture pressure gradients in the Paleozoic sediments of Takouazet field, Illizi basin, Algeria. J. Afr. Earth Sci. 164, 103778. doi:10.1016/j.jafrearsci.2020.103778
Barjouei, H. S., Ghorbani, H., Mohamadian, N., Wood, D. A., Davoodi, S., Moghadasi, J., et al. (2021). Prediction performance advantages of deep machine learning algorithms for two-phase flow rates through wellhead chokes. J. Pet. Explor. Prod. Technol. 11, 1233–1261. doi:10.1007/s13202-021-01087-4
Beheshtian, S., Rajabi, M., Davoodi, S., Wood, D. A., Ghorbani, H., Mohamadian, N., et al. (2022). Robust computational approach to determine the safe mud weight window using well-log data from a large gas reservoir. Mar. Petroleum Geol. 142, 105772. doi:10.1016/j.marpetgeo.2022.105772
Bonakdari, H., Binns, A. D., and Gharabaghi, B. (2020). A comparative study of linear stochastic with nonlinear daily river discharge forecast models. Water Resour. manage. 34, 3689–3708. doi:10.1007/s11269-020-02644-y
Bowers, G. L. (1995). Pore pressure estimation from velocity data: accounting for overpressure mechanisms besides undercompaction. SPE Drill. Complet. 10, 89–95. doi:10.2118/27488-pa
Carnegie, A., Thomas, M., Efnik, M. S., Hamawi, M., Akbar, M., and Burton, M. (2002). An advanced method of determining insitu reservoir stresses: Wireline conveyed micro-fracturing. Abu Dhabi, United Arab Emirates: OnePetro.
Choubineh, A., Ghorbani, H., Wood, D. A., Moosavi, S. R., Khalafi, E., and Sadatshojaei, E. (2017). Improved predictions of wellhead choke liquid critical-flow rates: Modelling based on hybrid neural network training learning based optimization. Fuel 207, 547–560. doi:10.1016/j.fuel.2017.06.131
Darvishpour, A., Seifabad, M. C., Wood, D. A., and Ghorbani, H. (2019). Wellbore stability analysis to determine the safe mud weight window for sandstone layers. Petroleum Explor. Dev. 46, 1031–1038. doi:10.1016/s1876-3804(19)60260-0
Eaton, B. A. (1975). The equation for geopressure prediction from well logs. Dallas, Texas: OnePetro.
Elbaz, K., Shen, S.-L., Zhou, A., Yin, Z.-Y., and Lyu, H.-M. (2021). Prediction of disc cutter life during shield tunneling with AI via the incorporation of a genetic algorithm into a GMDH-type neural network. Engineering 7, 238–251. doi:10.1016/j.eng.2020.02.016
Farsi, M., Barjouei, H. S., Wood, D. A., Ghorbani, H., Mohamadian, N., Davoodi, S., et al. (2021). Prediction of oil flow rate through orifice flow meters: Optimized machine-learning techniques. Measurement 174, 108943. doi:10.1016/j.measurement.2020.108943
Galkin, V. I., Ponomareva, I. N., and Martyushev, D. A. (2021). Prediction of reservoir pressure and study of its behavior in the development of oil fields based on the construction of multilevel multidimensional probabilistic-statistical models. Gas 2, 17–15. doi:10.18599/grs.2021.3.10
Gao, G., Hazbeh, O., Davoodi, S., Tabasi, S., Rajabi, M., Ghorbani, H., et al. (2022). Prediction of fracture density in a gas reservoir using robust computational approaches. Front. Earth Sci., 1831. doi:10.3389/feart.2022.1023578
Ghorbani, H., Moghadasi, J., and Wood, D. A. (2017c). Prediction of gas flow rates from gas condensate reservoirs through wellhead chokes using a firefly optimization algorithm. J. Nat. Gas Sci. Eng. 45, 256–271. doi:10.1016/j.jngse.2017.04.034
Ghorbani, H., Wood, D. A., Choubineh, A., Mohamadian, N., Tatar, A., Farhangian, H., et al. (2020a). Performance comparison of bubble point pressure from oil PVT data: Several neurocomputing techniques compared. Exp. Comput. Multiph. Flow. 2, 225–246. doi:10.1007/s42757-019-0047-5
Ghorbani, H., Wood, D. A., Choubineh, A., Tatar, A., Abarghoyi, P. G., Madani, M., et al. (2020b). Prediction of oil flow rate through an orifice flow meter: Artificial intelligence alternatives compared. Petroleum 6, 404–414. doi:10.1016/j.petlm.2018.09.003
Hassan, A. M., Ayoub, M. A., Mohyadinn, M. E., Al-Shalabi, E. W., and Alakbari, F. S. (2022). A new insight into smart water assisted foam SWAF technology in carbonate rocks using artificial neural networks ANNs. Malaysia: OnePetro.
Hassanpouryouzband, A., Joonaki, E., Farahani, M. V., Takeya, S., Ruppel, C., Yang, J., et al. (2020). Gas hydrates in sustainable chemistry. Chem. Soc. Rev. 49, 5225–5309. doi:10.1039/c8cs00989a
Hazbeh, O., Aghdam, S. K.-Y., Ghorbani, H., Mohamadian, N., Alvar, M. A., and Moghadasi, J. (2021). Comparison of accuracy and computational performance between the machine learning algorithms for rate of penetration in directional drilling well. Petroleum Res. 6, 271–282. doi:10.1016/j.ptlrs.2021.02.004
Hu, L., Deng, J., Zhu, H., Lin, H., Chen, Z., Deng, F., et al. (2013). A new pore pressure prediction method-back propagation artificial neural network. Electron. J. Geotech. Eng. 18, 4093–4107.
Hutomo, P. S., Rosid, M. S., and Haidar, M. W. (2019). Pore pressure prediction using eaton and neural network method in carbonate field “X” based on seismic data. Mater. Sci. Eng. 546, 032017. doi:10.1088/1757-899X/546/3/032017
Jafarian, H., Sayyaadi, H., and Torabi, F. (2017). Modeling and optimization of dew-point evaporative coolers based on a developed GMDH-type neural network. Energy Convers. Manag. 143, 49–65. doi:10.1016/j.enconman.2017.03.015
Jafarizadeh, F., Rajabi, M., Tabasi, S., Seyedkamali, R., Davoodi, S., Ghorbani, H., et al. (2022). Data driven models to predict pore pressure using drilling and petrophysical data. Energy Rep. 8, 6551–6562. doi:10.1016/j.egyr.2022.04.073
Jahed Armaghani, D., Hasanipanah, M., Bakhshandeh Amnieh, H., Tien Bui, D., Mehrabi, P., and Khorami, M. (2020). Development of a novel hybrid intelligent model for solving engineering problems using GS-GMDH algorithm. Eng. Comput. 36, 1379–1391. doi:10.1007/s00366-019-00769-2
Kamali, M. Z., Davoodi, S., Ghorbani, H., Wood, D. A., Mohamadian, N., Lajmorak, S., et al. (2022). Permeability prediction of heterogeneous carbonate gas condensate reservoirs applying group method of data handling. Mar. Petroleum Geol. 139, 105597. doi:10.1016/j.marpetgeo.2022.105597
Keshavarzi, R., and Jahanbakhshi, R. (2013). Real-time prediction of pore pressure gradient through an artificial intelligence approach: A case study from one of Middle East oil fields. Eur. J. Environ. Civ. Eng. 17, 675–686. doi:10.1080/19648189.2013.811614
Khodaeipour, M., Moqadam, D. L., Dashtbozorg, A., and Ghorbani, H. (2018). Nano clay effect on adsorption of benzene, toluene and xylene from aqueous solution. Am. J. Oil Chem. Technol, 228–236.
Kordnaeij, A., Kalantary, F., Kordtabar, B., and Mola-Abasi, H. (2015). Prediction of recompression index using GMDH-type neural network based on geotechnical soil properties. Soils Found. 55, 1335–1345. doi:10.1016/j.sandf.2015.10.001
López-Belchí, A., Illan-Gomez, F., Cano-Izquierdo, J. M., and García-Cascales, J. R. (2018). GMDH ANN to optimise model development: Prediction of the pressure drop and the heat transfer coefficient during condensation within mini-channels. Appl. Therm. Eng. 144, 321–330.
Ma, T., Chen, P., and Han, X. (2015). Simulation and interpretation of the pressure response for formation testing while drilling. J. Nat. Gas Sci. Eng. 23, 259–271. doi:10.1016/j.jngse.2015.01.044
Ma, T., Peng, N., Chen, P., Yang, C., Wang, X., and Han, X. (2018). Study and verification of a physical simulation system for formation pressure testing while drilling. Geofluids 2018, 1–18. doi:10.1155/2018/1731605
Macarthur, J., Vo, D. T., Palar, S., Terry, A., Brown, T., and May, R. (2000). Integrating pressure data from Formation Tester tool and DST to characterize deepwater fields. Indonesia, East Kalimantan: OnePetro.
Martyushev, D. A., Ponomareva, I. N., and Filippov, E. V. (2022). Studying the direction of hydraulic fracture in carbonate reservoirs: Using machine learning to determine reservoir pressure. Petroleum Res. doi:10.1016/j.ptlrs.2022.06.003
Matar, O., Al Janahi, A., Engineer, Y., and Ali, E. (2019). Integrating production and formation pressure testers analysis for field development in complicated carbonate reservoir. Manama, Bahrain: OnePetro.
Mohamadian, N., Ghorbani, H., Bazrkar, H., and Wood, D. A. (2022). “Carbon-nanotube-polymer nanocomposites enable wellbore cements to better inhibit gas migration and enhance sustainability of natural gas reservoirs,” in Sustainable natural gas reservoir and production engineering (Netherland: Elsevier), 243–268.
Mohammadian, N., and Ghorbani, H. (2015). An investigation on chemical formation damage in Iranian reservoir by focus on mineralogy role in shale swelling potential in Pabdeh and Gurpi formations. Adv. Environ. Biol. 9, 161–166.
Murakami, T., Ueda, Y., and Ohkuma, H. (2000). Field application of multi-dimensional diagnosis of reservoir rock stability against sanding problem. Brisbane, Australia: OnePetro.
Naderpour, H., Eidgahee, D. R., Fakharian, P., Rafiean, A. H., and Kalantari, S. M. (2020). A new proposed approach for moment capacity estimation of ferrocement members using Group Method of Data Handling. Eng. Sci. Technol. Int. J. 23, 382–391. doi:10.1016/j.jestch.2019.05.013
Nariman-Zadeh, N., Darvizeh, A., Darvizeh, M., and Gharababaei, H. (2002). Modelling of explosive cutting process of plates using GMDH-type neural network and singular value decomposition. J. Mater. Process. Technol. 128, 80–87. doi:10.1016/s0924-0136(02)00264-9
Nasir, V., Cool, J., and Sassani, F. (2019). Intelligent machining monitoring using sound signal processed with the wavelet method and a self-organizing neural network. IEEE Robot. Autom. Lett. 4, 3449–3456. doi:10.1109/lra.2019.2926666
Naveshki, M., Naghiei, A., Soltani Tehrani, P., Ahmadi Alvar, M., Ghorbani, H., Mohamadian, N., et al. (2021). Prediction of bubble point pressure using new hybrid computationail intelligence models. J. Chem. Petroleum Eng. 55, 203–222. doi:10.22059/jchpe.2021.314719.1341
Nguyen, T. N., Lee, S., Nguyen-Xuan, H., and Lee, J. (2019). A novel analysis-prediction approach for geometrically nonlinear problems using group method of data handling. Comput. Methods Appl. Mech. Eng. 354, 506–526. doi:10.1016/j.cma.2019.05.052
Peng, N., Ma, T., Chen, P., and Liu, Y. (2021). Pore pressure evaluation of formation testing while drilling under supercharged conditions. J. Petroleum Sci. Eng. 203, 108689. doi:10.1016/j.petrol.2021.108689
Ponomareva, I. N., Galkin, V. I., and Martyushev, D. A. (2021). Operational method for determining bottom hole pressure in mechanized oil producing wells, based on the application of multivariate regression analysis. Petroleum Res. 6, 351–360. doi:10.1016/j.ptlrs.2021.05.010
Ponomareva, I. N., Martyushev, D. A., and Govindarajan, S. K. (2022). A new approach to predict the formation pressure using multiple regression analysis: case study from Sukharev oil field reservoir–Russia. J. King Saud University-Engineering Sci. doi:10.1016/j.jksues.2022.03.005
Rabbani, A., and Babaei, M. (2019). Hybrid pore-network and lattice-Boltzmann permeability modelling accelerated by machine learning. Adv. water Resour. 126, 116–128. doi:10.1016/j.advwatres.2019.02.012
Radwan, A. E., Abudeif, A. M., Attia, M. M., and Mohammed, M. A. (2019). Pore and fracture pressure modeling using direct and indirect methods in Badri Field, Gulf of Suez, Egypt. J. Afr. Earth Sci. 156, 133–143. doi:10.1016/j.jafrearsci.2019.04.015
Rahman, S. M., Khondaker, A. N., and Abdel-Aal, R. (2012). Self organizing ozone model for Empty Quarter of Saudi Arabia: Group method data handling based modeling approach. Atmos. Environ. 59, 398–407. doi:10.1016/j.atmosenv.2012.05.008
Rajabi, M., Beheshtian, S., Davoodi, S., Ghorbani, H., Mohamadian, N., Radwan, A. E., et al. (2021). Novel hybrid machine learning optimizer algorithms to prediction of fracture density by petrophysical data. J. Pet. Explor. Prod. Technol. 11, 4375–4397. doi:10.1007/s13202-021-01321-z
Rajabi, M., Ghorbani, H., and Aghdam, K.-Y. (2022a). Prediction of shear wave velocity by extreme learning machine technique from well log data. J. Petroleum Geomechanics 4, 18–35. doi:10.22107/JPG.2022.298520.1151
Rajabi, M., Ghorbani, H., and Aghdam, K.-Y. (2022b). Sensitivity analysis of effective factors for estimating formation pore pressure using a new method: The LSSVM-PSO algorithm. J. Petroleum Geomechanics 4, 19–39. doi:10.22107/JPG.2022.298551.1152
Rajabi, M., Hazbeh, O., Davoodi, S., Wood, D. A., Tehrani, P. S., Ghorbani, H., et al. (2022c). Predicting shear wave velocity from conventional well logs with deep and hybrid machine learning algorithms. J. Pet. Explor. Prod. Technol., 1–24. doi:10.1007/s13202-022-01531-z
Ranaee, E., Ghorbani, H., Keshavarzian, S., Abarghoei, P. G., Riva, M., Inzoli, F., et al. (2021). Analysis of the performance of a crude-oil desalting system based on historical data. Fuel 291, 120046. doi:10.1016/j.fuel.2020.120046
Rao, Y. K. S. S., and Krishna, B. B. (2019). Modeling diesel engine fueled with tamanu oil-Diesel blend by hybridizing neural network with firefly algorithm. Renew. Energy 134, 1200–1212. doi:10.1016/j.renene.2018.08.091
Rashidi, S., Mohamadian, N., Ghorbani, H., Wood, D. A., Shahbazi, K., and Alvar, M. A. (2020). Shear modulus prediction of embedded pressurized salt layers and pinpointing zones at risk of casing collapse in oil and gas wells. J. Appl. Geophys. 183, 104205. doi:10.1016/j.jappgeo.2020.104205
Sadiq, T., and Nashawi, I. S. (2000). Using neural networks for prediction of formation fracture gradient. Calgary, Alberta, Canada: OnePetro.
Shahbazbeygi, E., Yosefvand, F., Yaghoubi, B., Shabanlou, S., and Rajabi, A. (2021). Generalized structure of group method of data handling to prognosticate scour around various cross-vane structures. Arab. J. Geosci. 14 (12), 1–16. doi:10.1007/s12517-021-07483-8
Siruvuri, C., Nagarakanti, S., and Samuel, R. (2006). Stuck pipe prediction and avoidance: A convolutional neural network approach. Miami, Florida, USA: OnePetro.
Tehrani, P. S., Ghorbani, H., Lajmorak, S., Molaei, O., Radwan, A. E., Ghaleh, S. P., et al. (2022). Laboratory study of polymer injection into heavy oil unconventional reservoirs to enhance oil recovery and determination of optimal injection concentration. AIMS Geosci. 8, 579–592. doi:10.3934/geosci.2022031
Tsai, T. M., and Yen, P. H. (2017). GMDH algorithms applied to turbidity forecasting. Appl. Water Sci. 7 (3), 1151–1160.
Zakharov, L. А., Martyushev, D. А., and Ponomareva, I. N. (2022). Predicting dynamic formation pressure using artificial intelligence methods. J. Min. Inst. 253, 23–32.
Zakharov, L. A. (2021). Application of machine learning for forecasting formation pressure in oil field development, 148. Russia: Bulletin Of the tomsk polytechnic university geo аssets engineering.
Zaranezhad, A., Mahabadi, H. A., and Dehghani, M. R. (2019). Development of prediction models for repair and maintenance-related accidents at oil refineries using artificial neural network, fuzzy system, genetic algorithm, and ant colony optimization algorithm. Process Saf. Environ. Prot. 131, 331–348. doi:10.1016/j.psep.2019.08.031
Zhang, J. (2011). Pore pressure prediction from well logs: Methods, modifications, and new approaches. Earth-Science Rev. 108, 50–63. doi:10.1016/j.earscirev.2011.06.001
Nomenclature
AIC Akaike information criterion
BPNN Back propagation neural network
CALI Caliper
CGR Gamma ray (corrected)
d Input variable datapoint
dmin Minimum input variable datapoint
dmin Maximum input variable datapoint
DC Compressional shear-wave
DS Sonic shear-wave
DT Sonic transit time
DTCO Compressive wave
EN–S Nash–Sutcliffe model
GR Gamma-ray
GRNN Generalized regression neural network
HS Hole size
ILD Deep Induction Log
K Permeability
LLS Shallow Laterolog
MD Measured Depth
MDT Modular Formation Dynamics Tester
MLP Multilayer perceptron
MSE Mean square error
MW Mud weight
NPHI Neuron Porosity
PEF Photoelectric absorption factor
PP Pore pressure
q Quadratic function
R Spearman’s correlation coefficient
R2 R-square
RFT Repeat Formation Tester
RHOB Bulk Density
RMSE Root mean square error
ROP Rotational speed
S Output variable
SGR Gamma ray (spectral)
SI Scatter index
T Temperature
t Bayas
Vp Compressional wave velocity
Vs Shear wave velocity
WOB Weight on bit
TLBO Teaching-learning-based optimization
DWKNN Distance-weighted K-nearest-neighbor
MELM Multiple hidden layers extreme learning machine algorithms
MLP Multilayer perceptron’s
FF Firefly algorithm
GA Genetic optimization algorithm
ANN Artificial neural network
Greek Nomenclature
δmin Minimum rout means square error
Ø Datapoint
Keywords: artificial intelligence, soft computing, Spearman's correlation, GMDH, GMDH-GS, GS-GMDH, pore pressure, petrophysical log
Citation: Gao G, Hazbeh O, Rajabi M, Tabasi S, Ghorbani H, Seyedkamali R, Shayanmanesh M, Radwan AE and Mosavi AH (2023) Application of GMDH model to predict pore pressure. Front. Earth Sci. 10:1043719. doi: 10.3389/feart.2022.1043719
Received: 13 September 2022; Accepted: 31 October 2022;
Published: 13 January 2023.
Edited by:
Numair Siddiqui, University of Technology Petronas, MalaysiaReviewed by:
Dmitriy Martyushev, Perm National Research Polytechnic University, RussiaFahd Alakbari, University of Technology Petronas, Malaysia
Copyright © 2023 Gao, Hazbeh, Rajabi, Tabasi, Ghorbani, Seyedkamali, Shayanmanesh, Radwan and Mosavi. This is an open-access article distributed under the terms of the Creative Commons Attribution License (CC BY). The use, distribution or reproduction in other forums is permitted, provided the original author(s) and the copyright owner(s) are credited and that the original publication in this journal is cited, in accordance with accepted academic practice. No use, distribution or reproduction is permitted which does not comply with these terms.
*Correspondence: Hamzeh Ghorbani, hamzehghorbani68@yahoo.com; Amir H. Mosavi, amirhosein.mosavi@stuba.sk