Response of Peatland CO2 and CH4 Fluxes to Experimental Warming and the Carbon Balance
 Qian Li
 Sébastien Gogo
 Fabien Leroy
 Christophe Guimbaud2
 - 1Université d’Orléans, Institut des Sciences de La Terre d'Orléans, CNRS, BRGM, UMR 7327, Orléans, France
- 2Université d’Orléans, Le Laboratoire de Physique et de Chimie de l'Environnement et de l'Espace (LPC2E), CNRS, UMR 7328, Orléans, France
The function of peatlands as a large carbon (C) reservoir results from the net C uptake under cold, wet, and acid environments. However, in the context of global warming, the balance between C input and release is expected to change, which may further alter the C sink of peatlands. To examine the response to climate warming of a temperate Sphagnum peatland which has been invaded by vascular plants, a mesocosm experiment was conducted with open top chambers (OTCs) to simulate a moderate temperature increase. Gross primary production (GPP), ecosystem respiration (ER), and methane (CH4) emissions were monitored for 2 years. The CO2 and CH4 fluxes were modeled by relating to abiotic and biotic factors, including temperature, water table depth (WTD), and vegetation, in order to calculate the annual C budget. Results showed that the annual cumulated GPP was significantly enhanced by the simulated warming (−602 compared to −501 gC m−2 yr−1 in OTC and control plots, respectively), mainly due to the increase of graminoid biomass by warming, while experimental warming had no significant effect on the annual ER and CH4 emissions (an output of 615 and 500 gC m−2 yr−1 for ER; 21 and 16 gC m−2 yr−1 for CH4 emissions in OTC and control plots, respectively). The annual NEE and C budget were not affected by the short-term experimental warming. The mesocosms under both treatments acted as a gaseous C source with 34 and 14 gC m−2 yr−1 output under OTC and control treatment, respectively. This C source was driven by the strong net carbon dioxide (CO2) release during a low WTD period in summer, as CH4 emissions only accounted for 0.9–2.2% of the total C fluxes. Our study identified the effect of moderate warming on the C fluxes, even on a short-term basis. Also, our findings highlighted that the response of C fluxes to warming largely depends on the WTD and vegetation composition. Thus, long-term monitoring of hydrology and vegetation change under climate warming is essential to examine their interactions in determining the C fluxes in peatlands.
Introduction
Peatlands are important carbon (C) storage terrestrial ecosystems in the world as they accumulate about 30% of the world’s soil C in only 3% of the land area (Gorham, 1991; Yu et al., 2010; Jackson et al., 2017). Their C sink function results from the positive small but long-lasting imbalance between the C input from photosynthesis and the C output from decomposition of soil organic matters (OMs) (Bragazza et al., 2009). The specific abiotic and biotic conditions in peatlands, such as low temperature, waterlogging, acidity, and litter intrinsically recalcitrance to decay (Sphagnum litters) limit the microbial decomposition, thus leading to the accumulation of OMs. Nevertheless, due to the large amount of anthropogenic greenhouse gas (GHG) emissions into the atmosphere, the earth surface temperature has been observed to be increasing since the last century, and it is expected to increase 1–3.7°C by the end of the 21st century (Intergovernmental Panel on Climate Change, 2014). As elevated temperature can stimulate the soil decomposition (Dieleman et al., 2016), the projected warmer climate may shift the C sink of peatlands to a C source. Furthermore, due to the large C stocks in peatlands, small disturbances in the C cycle processes may lead to marked C release, which will in turn exacerbate the global warming. Therefore, understanding the C balance of peatlands in response to climate warming is of great importance and is a subject of considerable concern.
Temperature controls numerous metabolic processes related to photosynthesis as well as autotrophic and heterotrophic respiration (e.g., Lloyd and Taylor, 1994; Medlyn et al., 2002). Generally, higher temperature could induce more carbon dioxide (CO2) release by ecosystem respiration (ER; e.g., Chivers et al., 2009; Flanagan and Syed, 2011). For example, Dorrepaal et al. (2009) observed an increase of over 50% in ER from peat soil induced by a temperature rise of approximately 1°C. However, the response of photosynthesis to temperature change varies with vegetation types and environmental conditions (Medlyn et al., 2002; Voigt et al., 2017). Methane (CH4) emissions from peatlands to the atmosphere depend on the balance of CH4 production, oxidation, and transportation rate. Both CH4 production by methanogens and oxidation by methanotrophs are strongly correlated with temperature (Segers, 1998). Nevertheless, CH4 production was reported to be more sensitive to temperature change than CH4 consumption (Dunfield et al., 1993). Thus, a warmer climate is expected to increase CH4 release into the atmosphere. Due to the different responses of these processes, estimating the net response of C in peatlands to climate warming is still challenging.
In addition, climate warming can affect the peatland C cycle indirectly via modifying the vegetation structure. It has been demonstrated that warming could promote the growth of vascular plants, especially ericaceous shrubs and graminoids, to the detriment of Sphagnum species (Bragazza et al., 2013; Buttler et al., 2015; Dieleman et al., 2015). Sphagnum litter is resistant to decay, which is beneficial for the C sequestration in peatlands (AminiTabrizi et al., 2020). However, the presence of vascular plants alters the litter quality in peatlands with an increase of its degradability, which enhances the decomposition (Straková et al., 2011; Leroy et al., 2019). Furthermore, the root exudates from vascular plants are a source of labile C input, which on the one hand provide substrate for microbial degradation and on the other hand lead to the priming effect, thus stimulating the decomposition of “old” and the so-called recalcitrant OMs (Gavazov et al., 2018; Girkin et al., 2018). Nevertheless, this vegetation shift also increases the C input to peatlands because of the higher primary productivity of vascular plants (Gavazov et al., 2018; Leroy et al., 2019).
To date, numerous studies have tried to understand the response of peatlands to global warming. However, most of them focused on northern peatlands in subarctic regions (e.g., Aurela et al., 2004; Chivers et al., 2009; Dieleman et al., 2015; Munir et al., 2015; Voigt et al., 2017; Laine et al., 2019), where the majority of peatlands are located (Strack, 2008). Previous results showed that the effect of warming on the C sequestration of peatlands varied from strengthening to diminishing (e.g., Waddington et al., 1998; Chivers et al., 2009; Ward et al., 2013; Munir et al., 2015; Hanson et al., 2020). Therefore, it is still difficult to draw a conclusion on the precise feedback of peatlands to climate warming. More importantly, there is still a large gap in the understanding of how temperate peatlands will respond to the warming climate. Temperate low-latitude peatlands are already below the temperature which is the projected level of subarctic regions in the future. Furthermore, they have suffered high anthropogenic pressures (e.g., hydrological disturbance, peat cutting, or nutrient amendment), and a vegetation shift has occurred (Berendse et al., 2001; Bubier et al., 2007). These disturbances have diminished their C storage (Dorrepaal et al., 2005; Gogo et al., 2016). Thus, they have significant potential to act as a C source in the future (Leifeld et al., 2019). Especially under the projected climate warming, it is important to assess how these temperate peatlands will respond to both anthropogenic and climatic disturbances.
In order to understand the response to climate warming of a temperate Sphagnum peatland which has been invaded by vascular plants (especially Molinia caerulea), we conducted a mesocosm experiment. The mesocosms were submitted to two temperature treatments: 1) ambient (control) and 2) moderate experimental warming by open top chambers (OTCs). The CO2 and CH4 fluxes were monitored for two years. Then, they were modeled by relating to abiotic and biotic factors in order to estimate the annual C budget. We hypothesized that the warming treatment would 1) promote both the C input to peatland through photosynthesis and the C release to the atmosphere through respiration and CH4 emissions and 2) diminish the C sink function of this ecosystem.
Materials and Methods
Mesocosm Experiment
Sample Preparation and Monitored Variables
Twelve mesocosms (intact cylindrical peat monoliths, 30 cm in diameter, and 40 cm in depth; Supplementary Figure S1A) were collected from La Guette peatland (France) in June 2018. This site is a transitional acid fen with typical species including Sphagnum mosses (Sphagnum cuspidatum and Sphagnum rubellum) and ericaceous shrubs (Erica tetralix and Calluna vulgaris). However, this site has been invaded by vascular plants (mainly Molinia caerulea and Betula spp.) for 30 years, and the invasion was accelerated in recent decades due to the hydrological disturbance (Gogo et al., 2011). The sampling locations were selected to ensure that all the mesocosms contained a representative species assemblage, including mosses, vascular plants, and ericaceous shrubs. The mesocosms were sealed at the bottom and placed in the holes dug into the ground outside the Institut des Sciences de la Terre d’Orléans (ISTO) laboratory in July 2018 (Supplementary Figure S1B). They were separated into two treatments: six for warming treatment equipped with passive warming OTCs (called “OTC” plots) designed following the International Tundra Experiment (ITEX) protocol (Marion et al., 1997; Aronson and McNulty, 2009; Supplementary Figure S1C), and another six without OTCs were used as control (called “control” plots).
The air temperature at 10 cm above the soil surface, and the soil temperature at 5, 15, and 30 cm depths of the mesocosms were monitored with temperature probes (Campbell Scientific T107, United States). The water content of surface Sphagnum peat at 5 cm depth was monitored with soil moisture probes inserted vertically into the soil (Decagon EC-5, METER group United States). The temperature and relative humidity of the ambient air were monitored by temperature and relative humidity probes (Campbell Scientific CS215, United States), the solar radiation of the ambient environment was monitored by a SP-LITE pyranometer (Campbell Scientific, United States), the precipitation was monitored by a tipping bucket rain gauge (Campbell Scientific AGR100), the wind speed and direction of the ambient environment were monitored by a wind monitor (Campbell Scientific 05103, United States), and the atmospheric pressure of the ambient environment was monitored by a barometric pressure sensor (Campbell Scientific CS100, United States). These probes were connected to dataloggers (Campbell Scientific CR800, United States) in the weather stations installed near the study site (Supplementary Figure S1D), and the data were recorded every 5 min.
The water supply of mesocosms was mainly from natural precipitation. However, in order to maintain a similar WTD in all the mesocosms during the summer drought period, water collected from the drainage ditch near La Guette peatland was added to mesocosms when necessary. The WTD was measured manually by piezometers installed in mesocosms.
The vegetation communities in mesocosms were separated into three groups: bryophytes (Sphagnum spp.), graminoids (Molinia caerulea and Eriophorum angustifolium), and ericaceous shrubs (Erica tetralix and Calluna vulgaris). Each group was regarded as a distinct plant stratum, and the percentage cover of each stratum could reach 100%. The percentage cover of each species in their stratum and the number of graminoid leaves were measured after gas flux measurement. A vegetation index (VI), representing the amount of vegetation present, was calculated by summing the percentage cover of the three groups and dividing it by the total potential maximum cover (Eq. 1; D’Angelo et al., 2021):
where BS, GS, and SS represent the percentage cover of bryophytes, graminoids, and ericaceous shrubs, respectively. TC is the total potential maximum cover calculated as n × 100%, in which n is the number of plant strata.
CO2 and CH4 Fluxes Measurements
The measurements of CO2 and CH4 fluxes were carried out by the static chamber method (e.g., Leroy et al., 2019) from August 2018 to July 2020. The transparent PVC chamber was equipped with a low-speed battery-operated fan to circulate the air inside the chamber during measurements. Between measurements, the chamber was air-flushed to equilibrate the headspace concentration with that of the ambient air. The CO2 measurements were performed using a CO2 sensor (Vaisala Carbocap GMP343, Finland) inserted into the chamber. The transparent chamber was used to measure the net ecosystem exchange (NEE), which is the difference between ecosystem respiration (ER) and gross primary production (GPP). ER was measured by covering the chamber with an opaque cover to prevent the photosynthesis. The NEE was measured under different light conditions which were artificially modulated by adding different numbers of plastic nets above the mesocosms. In this case, the light response of GPP was assessed, and it was used to calculate the GPP modeling parameters (see Gross primary production). During the measurement, CO2 concentration (ppm) was recorded every 5 s. The measurements always lasted until a clear linear slope of CO2 concentration vs. time was obtained, but for a maximum of 5 min. During the CO2 measurements, the air temperature and humidity inside the chamber were also measured with a temperature and humidity meter (Vaisala Humicap HM70, Finland) inserted into the chamber. Photosynthetically active radiation (PAR; mol m−2 s−1), which is measured as the photosynthetic photon flux density (PPFD), was measured by placing a PAR sensor (SDEC JYP 1000, France) on the top of chamber. PAR was measured at the beginning and at the end of each CO2 measurement, and their mean was used to represent PAR during this measurement. CH4 emissions were measured using a LGR Ultraportable Greenhouse Gas Analyzer (Los Gatos Research, United States) connected to the transparent chamber. The measurement of CH4 concentration (ppm) also lasted until a clear linear slope of CH4 concentration vs. time was obtained, but for a maximum of 5 min. The CO2 and CH4 concentrations measured during the first 30 s of measurement were always excluded to remove the fluctuation caused by the placement of the chamber (e.g., ebullition). If saturation occurred at the end of the measurement, the data were also excluded to keep only the linear slope. If ebullition occurred during the CH4 measurement, the measurement was repeated to include only the diffusive emissions of CH4. Atmosphere was regarded as the reference for C fluxes. Thus, positive values of CO2/CH4 fluxes indicated an emission into atmosphere and negative values indicated an uptake by the ecosystem.
The flux of CO2/CH4 (μmol m−2 s−1) was calculated by Eq. 2
where R is the gas constant at 273.15 K (8.314 m3 Pa K−1 mol−1), T is the temperature inside the chamber (°C), V is the volume of the chamber (m3), A is the surface area of the chamber (m2), Patm is the atmospheric pressure (Pa), and dc/dt is the CO2/CH4 concentration change against time (ppm s−1) calculated using linear regression.
Modeling of CO2 and CH4 Fluxes
Gross Primary Production
The relationship between GPP and PPFD was often described by a rectangular hyperbolic saturation curve (Thornley and Johnson, 1990):
where GPPmax (μmol m−2 s−1) is the asymptotic maximum GPP at light saturation and k (μmol photon m−2 s−1) is the half-saturation value. These two variables were calculated by the Michaelis–Menten equation (Johnson and Goody, 2011) based on the light response curve of GPP (methods described above). PAR (mol m−2 s−1) is the photosynthetically active radiation.
This approach was modified by Kandel et al. (2013) who introduced the effect of temperature and vegetation into the light response model. Here, we modeled GPP following their equation, while a simple VI (Eq. 1) was used instead of the ratio vegetation index (RVI) in their equation. The model performance was improved when the number of graminoid leaves and WTD were incorporated with the linear function:
where Graminoidleaves is the number of graminoid leaves, VI is the vegetation index (Eq. 1), and WTD is the water table depth (cm), and its reference value, WTDref, was set at −25 cm, which was the lowest value we observed in the mesocosms. The coefficients a, b, and c are fitted empirical parameters. Tscale represents the temperature sensitivity of photosynthesis (Raich et al., 1991; Mahadevan et al., 2008):
where T is the measured air temperature (°C). Tmin, Tmax, and Topt are the minimum, maximum, and optimum air temperatures (°C) for photosynthesis, respectively. Following Leroy et al. (2019), they were set as 0, 20, and 40°C, respectively.
Ecosystem Respiration
ER was modeled based on the equation of Bortoluzzi et al. (2006) and Leroy et al. (2019). The measured ER data were fitted with temperature using nonlinear power regression. Then, the residuals of this power regression were related to other abiotic and biotic variables. WTD and the number of graminoid leaves were linearly correlated to the residuals of the power regression. Thus, they were included in the model by a linear function:
where the reference of water table depth, WTDref, was also set at −25 cm as mentioned above. Tmin is the minimum temperature (°C) for positive respiration and Tref is the reference temperature (°C). They were set as −5 and 15°C, respectively, following the study of Bortoluzzi et al. (2006). T is the measured temperature (°C). The model was fitted with air temperature and soil temperature at 5, 15, and 30 cm depths. The best fit was found when using the soil temperature at 5 cm. Thus, it was used as T here. The coefficients d, e, and f are fitted empirical parameters.
CH4 Emissions
In accordance with Laine et al. (2007), data of CH4 emissions were fitted with soil temperature using nonlinear regression, and then the residuals of the nonlinear regression were related to other variables. WTD was linearly correlated to the residuals when values were above 9 cm, and the number of graminoid leaves was also linearly correlated to the residuals. Thus, they were included in the model as follows:
where Tmin is the minimum temperature (°C) for CH4 emissions; it was set as 1°C, which was the minimum soil temperature observed at 5 cm depth. Tref is the reference temperature (°C); it was set as 20°C which was the median value of annual soil temperature at 5 cm depth. Ts is the measured soil temperature (°C). The model was fitted with soil temperature at 5, 15, and 30 cm depths. The best fit was found when using the soil temperature at 5 cm. Thus, it was used as Ts here. The coefficients g, h, and i are fitted empirical parameters.
There were 74 WTD data points measured below WTD of −9 cm, that is, 28.6% of the total of 259 measured data. When WTD was below 9 cm, CH4 emissions were independent of temperature and WTD. Thus, the CH4 emissions were not modeled by Eq. 7, but they were linearly interpolated in this case.
Calibration and Evaluation of Models
Two-thirds (randomly selected) of the available data from each treatment were used to calibrate the model, and another one-third of the data were used to evaluate the model. The quality of model was evaluated by the adjusted determination coefficient
where R2 is the coefficient of determination, n represents the number of data, and k is the number of independent regressors.
where y is the measured value, ŷ is the modeled value,
The fitted parameters of the GPP model (a, b, and c), ER model (d, e, and f), and the CH4 emission model (g, h, and i) were calibrated by minimizing the NRMSE using the “SANN” method of the optimum function in R (version 3.6.3, R Core Team, 2020).
Calculation of Annual C Fluxes and C Budget
After calibration and evaluation of the C flux models, the models were parameterized for each mesocosm under both treatments individually. All the variables used in the models were interpolated to set a 1-h dataset. To do so, PAR, air, and soil temperature at 3 depths, which were monitored with a high frequency (5 min), were averaged over a 1-h time step. The other variables which were measured with a low frequency (WTD, number of graminoid leaves, and VI) were linearly interpolated between the punctual measurements to set a 1-h dataset. Then, the GPP, ER, and CH4 emissions were calculated at a 1-h time step using the relationships between C fluxes and environmental variables constructed above (Eq. 6, Eq. 7, and Eq. 8). Due to the technical problems in August 2018 and the lockdown because of COVID-19 from March 2020, the environmental variable data recorded by weather stations were not complete during these periods. Thus, the modeled GPP, ER, and CH4 emissions at a 1-h time step were only calculated from September 2018 to September 2019. Then, the annual cumulated GPP, ER, and CH4 emissions (gC m−2 yr−1) during this period were calculated as the sum of values at a 1-h time step.
The annual greenhouse gas C budget (GGCB; gC m−2 yr−1) indicates the net gaseous C accumulation/release rate of the ecosystem. It was calculated for each mesocosm under both treatments as follows:
where GPP is the annual cumulated gross primary production (gC m−2 yr−1), ER is the annual cumulated ecosystem respiration (gC m−2 yr−1), and
Statistics
The significant differences in the annual mean of air temperature (Ta) and soil temperature (Ts) at 5, 15, and 30 cm depths, and the WTD and water content of surface Sphagnum peat between control and OTC treatment were assessed by one-way ANOVA. The effects of experimental warming and time on the percentage cover of vegetation species, number of graminoid leaves, and vegetation index (VI) were analyzed by two-way repeated measure ANOVA using time as the repeated-measure factor and treatment as the between-group factor. The differences of the measured GPP, ER, NEE, and CH4 emissions between control and OTC plots at different periods of the growing season [early growing season (EG; April–May), middle growing season (MG: June–August), late growing season (LG: September), and the whole growing season (WG: April–September)] were analyzed by two-way repeated measure ANOVA using time as the repeated-measure factor and treatment as the between-group factor. The differences of the calculated GPPmax between the two treatments at different dates were analyzed by one-way ANOVA. The significant differences in the modeled annual cumulated GPP, ER, CH4 emission, NEE, and GGCB between the two treatments were assessed by one-way ANOVA. Before statistical analysis, the normality of distribution and the homogeneity of variance of the data were tested. All the statistics were performed in OriginPro 2019 (OriginLab, United States).
Results
Environmental Variables
The air temperature and soil temperature at 5 and 15 cm depths increased significantly under OTC treatment. The mean air temperature was 0.9°C higher in OTC plots than in control during the 2 years of monitoring (Table 1). The mean soil temperature at 5 cm depth was increased by 1.35°C, and at 15 cm depth, it was increased by 0.92°C with OTC treatment. However, the mean soil temperature at 30 cm was not significantly affected by OTC treatment (Table 1). The mean WTD and water content of surface peat throughout the monitoring were similar between the two treatments (Table 1). During the 2 years of monitoring, the WTD ranged from −0.4 to −23.5 cm for control plots and from −0.5 to −18 cm for OTC plots (Supplementary Figure S2A), with higher levels in winter and lower levels in summer. The water content of surface Sphagnum peat showed similar seasonal variations to the WTD. However, significant differences between the two treatments were found during July–September 2019 and April–May 2020, with higher values in OTC plots than in control plots (Supplementary Figure S2B). The percentage cover of Sphagnum increased significantly with time (p < 0.05; Figure 1A), while that of graminoids and shrubs remained constant (Figures 1B,C), resulting in an increase of the vegetation index (VI) with time (p < 0.05; Figure 1D). However, the differences between the two treatments were not significant. The number of graminoid leaves increased significantly with time (p < 0.05), and it was significantly higher in OTC plots than in control plots in May 2019 (p < 0.05; Figure 1E).
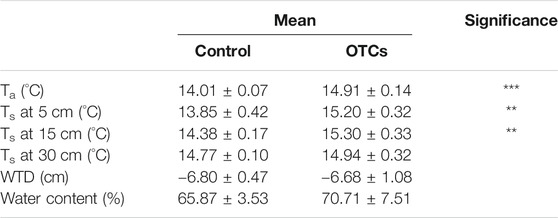
TABLE 1. Mean value of air temperature (Ta) and soil temperature (Ts) at 5, 15, and 30 cm depths of mesocosms, water table depth (WTD), and water content of Sphagnum at 5 cm depth from August 2018 to July 2020. Significant differences of ANOVA are expressed as *p < 0.05, **p < 0.01, and ***p < 0.001. Data are presented as mean ± SD, n = 6.
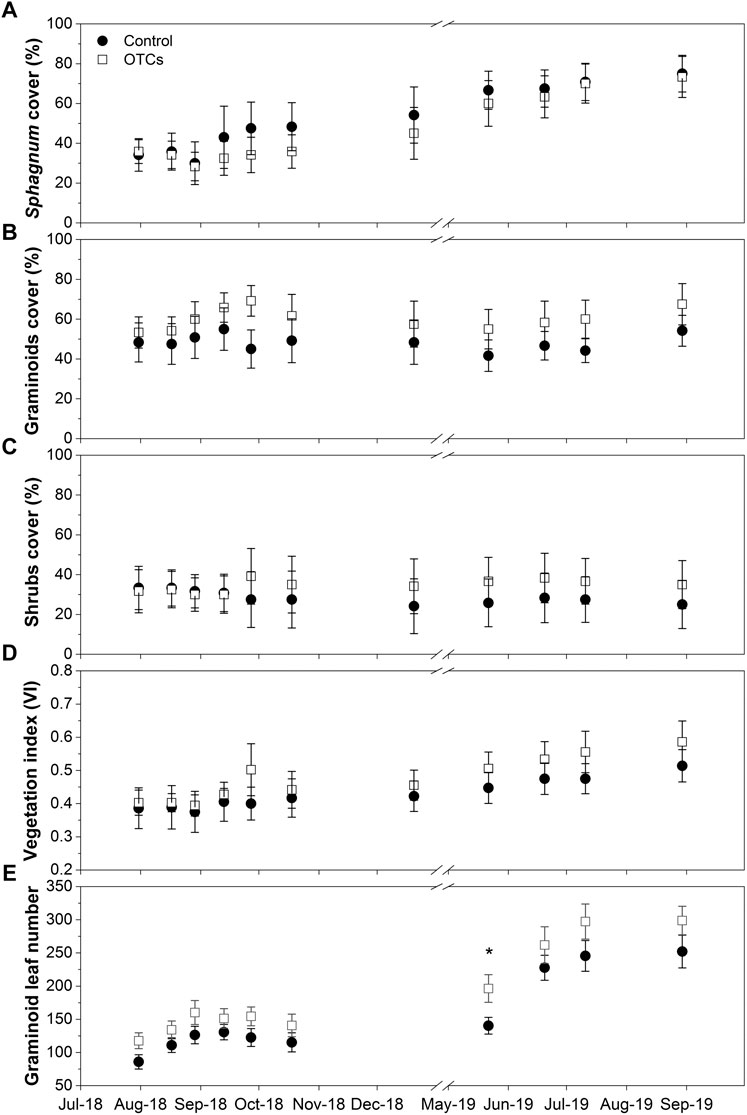
FIGURE 1. Percentage cover (%) of (A) bryophytes (Sphagnum), (B) graminoids (Molinia caerulea and Eriophorum angustifolium), and (C) ericaceous shrubs (Erica tetralix and Calluna vulgaris and (D) vegetation index (VI) and (E) the number of graminoid leaves from August 2018 to September 2019. Significant differences are expressed as *p < 0.05, **p < 0.01, and ***p < 0.001.
Measured CO2 and CH4 Fluxes
The GPP, ER, and NEE showed clear seasonal variations with high absolute values during summer and low absolute values during winter (Figures 2A–C). Comparing the two treatments, GPP was increased by OTC treatment during EG (p < 0.001) and LG (p < 0.05) in 2019, while no significant differences were observed in 2018 (p = 0.41), and during MG (p = 0.60) and WG in 2019 (p = 0.21; Figure 2A). ER was increased during LG in 2018 (p < 0.01), and EG (p < 0.05) and LG in 2019 (p < 0.01; Figure 2B). NEE was enhanced only during EG in 2019 (p < 0.01; Figure 2C). CH4 emissions also showed high values in summer and low values in winter (Figure 2D). Nevertheless, low values were also observed during August–September 2019 and May–July 2020 corresponding to the low WTD (below −10 cm; Supplementary Figure S2A) in these periods. CH4 emissions were not significantly affected by warming treatment during any period of growing season (Figure 2D), while a significant difference between the two treatments was found when the WTD initially reached to the lowest level, with higher values under OTC treatment than in control (p < 0.05; Figure 2D).
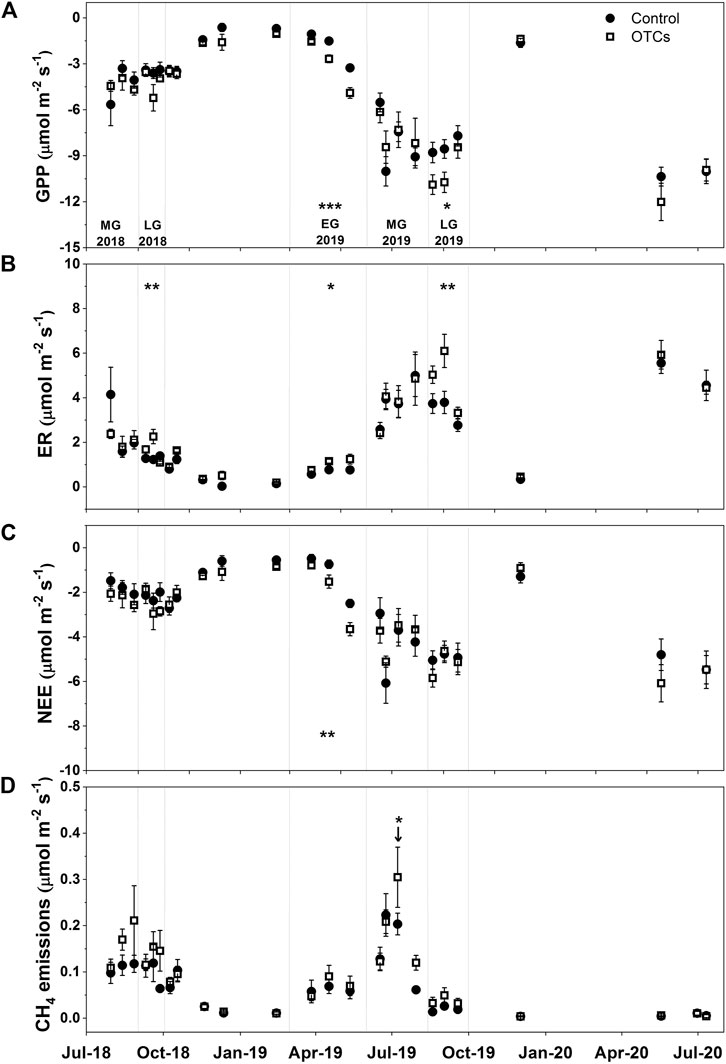
FIGURE 2. Measured (A) GPP (μmol m−2 s−1), (B) ER (μmol m−2 s−1), (C) NEE (μmol m−2 s−), and (D) CH4 emissions (μmol m−2 s−1) from August 2018 to July 2020 in control and OTC plots. Significant differences are expressed as *p < 0.05, **p < 0.01, and ***p < 0.001. Letters indicate different periods of growing season (EG = early growing season, MG = middle growing season, and LG = late growing season).
Modeled CO2 and CH4 Fluxes
The GPP, ER, and CH4 models were calibrated and evaluated for the two treatments separately. Calibration of the models showed that the modeled data were in good agreement with the measured data, with high
Modeled Gross Primary Production
The GPPmax, which was calculated using the Michaelis–Menten equation based on the photosynthesis-irradiation curve, exhibited obvious seasonal trends. It ranged from −1.60 to −15.61 μmol m−2 s−1 for control plots and from −1.96 to −20.26 μmol m−2 s−1 for OTC plots, with higher photosynthetic capacity during summer and lower during winter (Supplementary Figure S3A). GPPmax was enhanced by OTC treatment in September 2018 and September 2019 (Supplementary Figure S3A). A linear relationship between GPPmax and the number of graminoid leaves was observed for both treatments (Supplementary Figure S3B).
The GPP model was parameterized for each replicate under the two treatments individually. The results showed that the

TABLE 2. Modeled annual cumulated gross primary production (GPP; gC m−2 yr−1), ecosystem respiration (ER; gC m−2 yr−1), CH4 emissions (CH4; gC m−2 yr−1), net ecosystem exchange (NEE; gC m−2 yr−1), and greenhouse gases carbon budget (GGCB; gC m−2 yr−1) from September 2018 to September 2019 in control and OTC plots. Data are presented as mean ± SD, n = 6.
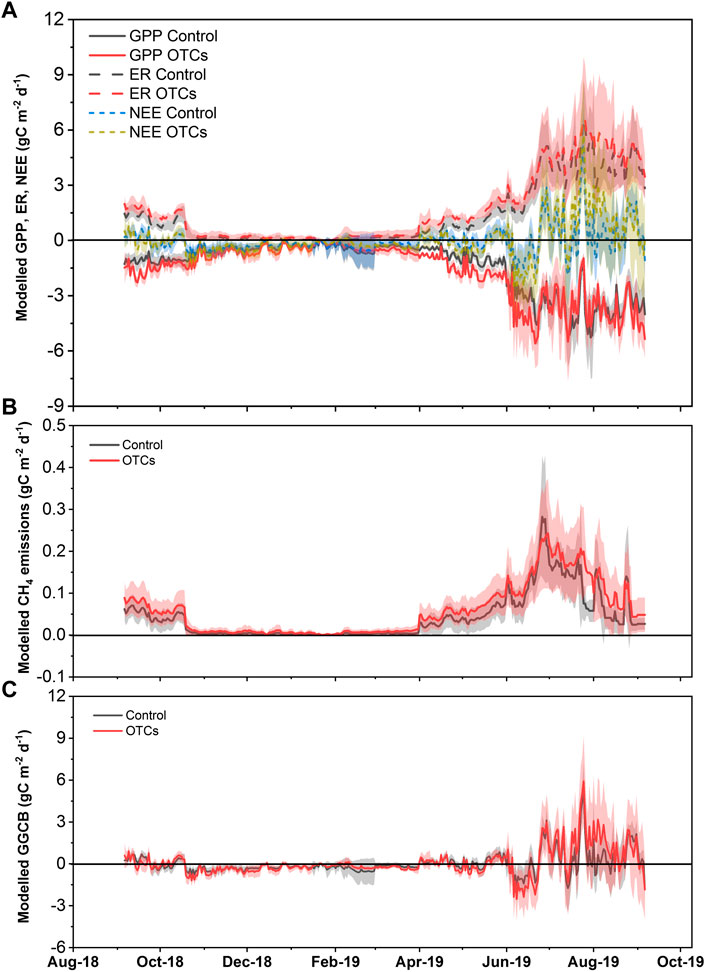
FIGURE 3. Modeled daily cumulated (A) GPP (gC m−2 d−1; solid lines), ER (gC m−2 d−1; dash lines), NEE (gC m−2 d−1; short dash lines), (B) CH4 emissions (gC m−2 d−1), and (C) greenhouse gas carbon budget (GGCB; gC m−2 d−1) from September 2018 to September 2019 in control and OTC plots. Lines indicate the mean values of replicates, and colored shading indicates the error bars of standard deviation.
Modeled Ecosystem Respiration
The results of parameterizing the ER model for each mesocosm showed that the
Modeled CH4 Emissions
After parameterizing the CH4 model for each replicate, we found that the
Modeled Net Ecosystem Exchange and Greenhouse Gas C Budget
The annual NEE of the control plots showed a slight input of CO2 (−2 ± 83 gC m−2 yr−1) but that of OTC plots exhibited a slight output of CO2 (13 ± 136 gC m−2 yr−1; Table 2); however, no significant difference between the two treatments was found (p = 0.83). The annual GGCB showed a release of 14 ± 82 and 34 ± 137 gC m−2 yr−1 for control and OTC treatment, respectively (Table 2). However, the difference was not significant (p = 0.77). Thus, mesocosms under both treatments acted as a C source. Particularly, a strong net C source was found during July–August 2019 for both treatments (Figure 3C), corresponding to the low WTD in this period (Supplementary Figure S2A). This strong net C source mainly resulted from the net CO2 source, as NEE showed similar values as GGCB during this period (Figure 3A), while CH4 emissions only accounted for 0.9–2.2% in the total C fluxes.
Discussion
Climate Regime and Vegetation Control on the CO2 Fluxes
On the whole, the annual GPP (∼450–720 gC m−2 yr−1) and ER (∼350–840 gC m−2 yr−1; Supplementary Table S2) in the present study were higher than those from boreal peatlands, which showed the GPP and ER fluxes between 100 and 500 gC m−2 yr−1 (e.g., Cliche Trudeau et al., 2014; Peichl et al., 2014). This may be caused by the differences in climate regime, particularly by the higher annual temperature in our study site than in sites at higher latitudes. While when compared to studies conducted under the same climatic condition, our values were lower. In the same site (La Guette peatland) where our mesocosms were collected, D’Angelo et al. (2021) reported the GPP and ER were all above 1,000 gC m−2 yr−1 with in situ measurements. In addition, Leroy et al. (2019) estimated an annual GPP of 1,300 gC m−2 yr−1 and ER of 1,000 gC m−2 yr−1 in mesocosms dominated by Molinia caerulea collected from La Guette peatland. This could be attributed to the differences in vegetation. La Guette peatland was almost entirely invaded by Molinia caerulea (Gogo et al., 2011). Thus, the percentage cover of Molinia in both field and Molinia-dominated mesocosms was higher than that of our mesocosms. The GPP of graminoids was higher than that of shrubs and bryophytes, and the GPP of graminoid-dominated peatlands was similar with those of temperate grasslands (Rydin and Jeglum, 2013; Leroy et al., 2019). Therefore, compared with the results of D’Angelo et al. (2021) and Leroy et al. (2019), the lower GPP observed in our study could be attributed to the lower abundance of graminoids. This was supported by the fact that mesocosms with only Sphagnum had a lower GPP and ER (400 and 380 gC m−2 yr−1, respectively, Leroy et al., 2019) than those in our study. In addition, the positive relationship between GPPmax and the number of graminoid leaves also confirmed the strong effect of graminoid abundance on GPP (Supplementary Figure S3B). The lower ER observed in our study can also be attributed to the lower abundance of graminoids. Molinia caerulea has an extensive root system, which is larger than that of other species. Thus, the lower abundance of this species compared with previous studies could induce lower root and leaf respiration in our mesocosms.
Stimulation of Experimental Warming on the Gross Primary Production
In previous studies, the effect of temperature rise on GPP varied from increasing (e.g., Chivers et al., 2009) to decreasing (e.g., Voigt et al., 2017) or no effect (e.g., Johnson et al., 2013; Laine et al., 2019), depending on the peatland type and initial vegetation composition. In our research, the warming treatment significantly increased the annual cumulated GPP of mesocosms from 500 to 615 gC m−2 yr−1 (Table 2). The enhancement mainly occurred during April–May 2019 (Figure 3A), when the number of graminoid leaves was higher under warming treatment than that in control (Figure 1E). Experimental warming facilitated the growth of graminoids, thus increasing the plant biomass (evidenced by the higher leaf number). The increase of plant biomass in turn increased the capacity of vegetation to withdraw CO2 from the atmosphere (higher GPP). Our result of a significant correlation between GPPmax and graminoid leaf number (Supplementary Figure S3B) confirmed this statement. In addition, Tuittila et al. (2004) found that the GPP of Sphagnum increased with the water content. In our study, the Sphagnum at 5 cm depth was wetter under OTC treatment than that under control during summer (Supplementary Figure S2B), probably caused by the lower wind presence and speed in OTCs than in ambient environment, which reduced the evapotranspiration. Thus, the higher water content of Sphagnum in OTC plots may also have contributed to the higher GPP under warming treatment.
Water Table Depth Modulates the Ecosystem Respiration Response to Warming
The warming treatment had no significant effect on the annual cumulated ER in our research. This result was inconsistent with previous studies which reported an increase of ER with temperature (e.g., Updegraff et al., 2001; Chivers et al., 2009; Voigt et al., 2017; Samson et al., 2018). Laine et al. (2019) found a low temperature sensitivity of ER under the wet condition. In their study, warming had no significant effect on ER under the ambient wet condition, while ER was significantly increased by moderate warming under the dry condition. The low temperature sensitivity of ER under the wet condition may be attributed to the low temperature sensitivity of soil respiration as it was reported to be less sensitive to temperature change under the anaerobic than aerobic condition (Szafranek-Nakonieczna and Stepniewska, 2014). Meanwhile, Chen et al. (2018) found a positive relationship between the temperature sensitivity (Q10) of soil respiration and the soil redox potential, which confirmed this result. In our study, the mean WTD throughout the monitoring was −6.80 and −6.68 cm for control and OTC treatment, respectively (Table 1). The WTD was mostly above −5 cm except during summer (Supplementary Figure S2A), suggesting a dominant anaerobic condition in our mesocosms. Therefore, the water saturated condition may lead to a low temperature sensitivity of soil respiration and thus a similar ER under both treatments.
Water Table Depth Dependence of CH4 Emissions
The annual cumulated CH4 emission in our results was lower than 33 gC m−2 yr−1 found by Leroy et al. (2019), with mesocosms collected from the same peatland. This was caused by the lower WTD in our mesocosms (Supplementary Figure S2A) than in their experiment. During our monitoring, WTD reached to a level below −15 cm during July–September 2019, while it remained above −10 cm most of the time in their experiment (data in Leroy et al., 2017). WTD has been reported to be a stronger regulator on CH4 emissions than temperature (Roulet et al., 1992; Turetsky et al., 2008). When the WTD decreased, the amount of water-saturated (i.e., anaerobic) peat decreased and the aerobic layer increased. Thus, the oxidation of CH4 was promoted. In our study, the correlation between CH4 emissions and temperature was only found when WTD ranged between 0 and −9 cm. However, when WTD dropped below −9 cm, CH4 emissions were independent of temperature (Figure 2D). This result confirmed the controlling of WTD on CH4 emissions. In our results of the measured CH4 emissions, the enhancement of CH4 emission by warming treatment was only found when WTD initially reached the lowest level (Figure 2D). Thus, warming alone may have only a slight effect on the CH4 emissions, while if warming interacted with WTD dropdown, their interaction could have a significant effect on the CH4 emissions (Munir and Strack, 2014).
Temperature and Water Table Depth Modulate the Peatland Functioning
Previous research showed that the peatlands varied from C sink (e.g., Koehler et al., 2011; Nilsson et al., 2008; Roulet et al., 2007) to C source (e.g., Waddington and Roulet, 2000; Voigt et al., 2017). In our study, the C balance of individual mesocosm showed large variations ranging from gaseous C sink to the source, with an average of 14 and 34 gC m−2 yr−1 output of C under control and OTC treatment, respectively (Table 2). The La Guette peatland also acted as a C source with an output of 220 gC m−2 yr−1 between 2013 and 2014. The stronger C source in the field than our mesocosms was linked to the repeated droughts in the previous years (D’Angelo et al., 2021). However, in the study of Leroy et al. (2019), both Sphagnum and Molinia caerulea dominated mesocosms collected from this peatland acted as gaseous C sink. This difference may be caused by the low WTD in our mesocosms during summer (Supplementary Figure S2A). We found that the mesocosms under both treatments showed high positive NEE values during July–September 2019 (Figure 3A), suggesting a strong CO2 source. This strong CO2 source corresponded to the low WTD in this period (Supplementary Figure S2A). The low WTD induced a higher respiration under the aerobic condition. Thus, the ER exceeded GPP and led to a net CO2 release. The CH4 emissions decreased following the decline of WTD, while it only accounted for 0.9–2.2% of the total C fluxes. Therefore, the net C losses in our study were mainly driven by the net CO2 output. The controlling of WTD on the CO2 exchange was in accordance with the findings of Laine et al. (2019), who observed a decreasing CO2 uptake with low WTD due to the increase of CO2 release as a result of the increased OM decomposition.
Hanson et al. (2020) have found that an air temperature increase of 2.25–9°C enhanced the net C source of peatland during 3 years of monitoring. Bridgham et al. (2008) conducted a 7-year monitoring, and the results showed that a soil warming of 1.6–4.1°C significantly reduced the C accumulation of peatland. Bragazza et al. (2016) also observed a reduction of peatland C accumulation with 5°C air temperature increase during 3 years. Compared with our study, these studies which found an impact of warming on the C budget of peatlands always have a stronger temperature increase than our study (0.9°C increase in air temperature; 1.35 and 0.95°C increase in soil temperature at 5 and 15 cm depths, respectively) or longer time warming treatment. With moderate warming (+0.7°C soil warming at 2 cm depth) for 2 years like in our study, Chivers et al. (2009) found that warming did not modify the C balance of peatland. In addition, there was another research that found the C sink of peatland can be enhanced by manipulated warming (about 1°C air temperature increase; Munir et al., 2015). This was caused by the enhanced growth of shrubs by warming in their treed bog. It has been demonstrated that the response of GHG emissions to warming largely depended on the vegetation composition and environmental conditions of the study site, as well as the warming methods, the warming rate, and the duration of the experiment (Gong et al., 2020). Any difference in these factors could lead to contrasting results. In our study, we found that a temperate peatland which has suffered a vegetation shift from Sphagnum to vascular plants dominance remained stable in response to short-term moderate warming. However, as the vascular plants could benefit more from warming than Sphagnum (Bragazza et al., 2013; Buttler et al., 2015; Dieleman et al., 2015), a vegetation structure change under long-term warming is expected, which may lead to a modification of C balance in the future.
Conclusion
In our study, the CO2 and CH4 fluxes of mesocosms collected from a temperate peatland were monitored and modeled using abiotic and biotic factors, including temperature, WTD, and vegetation. Models based on these variables described the measured data well. The modeled results showed that the experimental warming significantly enhanced the annual CO2 uptake through photosynthesis but had no effect on the ER and CH4 emissions. The increase of photosynthesis was attributed to the faster growth of graminoids under warming treatment during the early growing season. The mesocosms under both treatments acted as a gaseous C source, and it was caused by the net CO2 release during a low WTD period in summer. The gaseous C balance remained stable under the 2 years of moderate warming. Our study demonstrated the strong effect of moderate warming on the gaseous C fluxes of temperate peatlands. Moreover, we emphasized the necessity of integrating the WTD and vegetation change along with warming to determine the effect of their interactions on the peatland C fluxes. Further studies of long-term monitoring with a consideration of climate induced both abiotic and biotic factors will be needed to better estimate the feedback of peatlands to global changes as well as its magnitude.
Data Availability Statement
The raw data supporting the conclusion of this article will be made available by the authors, without undue reservation.
Author Contributions
QL, SG, and FL-D designed and prepared the experiment. QL collected data. CG helped on the CH4 measurements. QL, SG, and FL performed the data treatment and modeling. QL wrote the article with the help of all coauthors.
Funding
This article is a contribution to the research conducted in the Labex VOLTAIRE (ANR-10-LABX-100-01). This work was funded as part of the CAREX project supported by the Loire Valley Center Region and the FEDER. The study was undertaken in the framework of the French Peatland Observatory, SNO Tourbières, accredited by CNRS-INSU.
Conflict of Interest
The authors declare that the research was conducted in the absence of any commercial or financial relationships that could be construed as a potential conflict of interest.
Acknowledgments
The authors would like to thank J-B. Paroissien for help on the R script for data treatment, E. Salmon and L. Jourdain for their suggestions on the modeling of CH4 fluxes, A-J. Francez from ECOBIO Université de Rennes1 for the help of sampling mesocosms, L. Perdereau for his help in programming the dataloggers, and E. Mochado and X-L. Liu for their help in setting up the mesocosms. We also thank Elizabeth Rowley-Jolivet for English language editing.
Supplementary Material
The Supplementary Material for this article can be found online at: https://www.frontiersin.org/articles/10.3389/feart.2021.631368/full#supplementary-material
References
AminiTabrizi, R., Wilson, R. M., Fudyma, J. D., Hodgkins, S. B., Heyman, H. M., Rich, V. I., et al. (2020). Controls on Soil Organic Matter Degradation and Subsequent Greenhouse Gas Emissions across a Permafrost Thaw Gradient in Northern Sweden. Front. Earth Sci. 8, 381. doi:10.3389/feart.2020.557961
Aronson, E. L., and McNulty, S. G. (2009). Appropriate Experimental Ecosystem Warming Methods by Ecosystem, Objective, and Practicality. Agric. For. Meteorology 149, 1791–1799. doi:10.1016/j.agrformet.2009.06.007
Aurela, M., Laurila, T., and Tuovinen, J.-P. (2004). The Timing of Snow Melt Controls the Annual CO2balance in a Subarctic Fen. Geophys. Res. Lett. 31, L16119. doi:10.1029/2004GL020315
Berendse, F., Van Breemen, N., Rydin, H., Buttler, A., Heijmans, M., Hoosbeek, M. R., et al. (2001). Raised Atmospheric CO2 Levels and Increased N Deposition Cause Shifts in Plant Species Composition and Production in Sphagnum Bogs. Glob. Change Biol. 7, 591–598. doi:10.1046/j.1365-2486.2001.00433.x
Bortoluzzi, E., Epron, D., Siegenthaler, A., Gilbert, D., and Buttler, A. (2006). Carbon Balance of a European Mountain Bog at Contrasting Stages of Regeneration. New Phytol. 172, 708–718. doi:10.1111/j.1469-8137.2006.01859.x
Bragazza, L., Buttler, A., Robroek, B. J. M., Albrecht, R., Zaccone, C., Jassey, V. E. J., et al. (2016). Persistent High Temperature and Low Precipitation Reduce Peat Carbon Accumulation. Glob. Change Biol. 22, 4114–4123. doi:10.1111/gcb.13319
Bragazza, L., Buttler, A., Siegenthaler, A., and Mitchell, E. A. D. (2009). Plant Litter Decomposition and Nutrient Release in Peatlands. GMS 184, 99–110. doi:10.1029/2008GM000815
Bragazza, L., Parisod, J., Buttler, A., and Bardgett, R. D. (2013). Biogeochemical Plant-Soil Microbe Feedback in Response to Climate Warming in Peatlands. Nat. Clim Change 3, 273–277. doi:10.1038/nclimate1781
Bridgham, S. D., Pastor, J., Dewey, B., Weltzin, J. F., and Updegraff, K. (2008). Rapid Carbon Response of Peatlands to Climate Change. Ecology 89, 3041–3048. doi:10.1890/08-0279.1
Bubier, J. L., Moore, T. R., and Bledzki, L. A. (2007). Effects of Nutrient Addition on Vegetation and Carbon Cycling in an Ombrotrophic Bog. Glob. Change Biol. 13, 1168–1186. doi:10.1111/j.1365-2486.2007.01346.x
Buttler, A., Robroek, B. J. M., Laggoun-Défarge, F., Jassey, V. E. J., Pochelon, C., Bernard, G., et al. (2015). Experimental Warming Interacts with Soil Moisture to Discriminate Plant Responses in an Ombrotrophic Peatland. J. Veg. Sci. 26, 964–974. doi:10.1111/jvs.12296
Chen, H., Zou, J., Cui, J., Nie, M., and Fang, C. (2018). Wetland Drying Increases the Temperature Sensitivity of Soil Respiration. Soil Biol. Biochem. 120, 24–27. doi:10.1016/j.soilbio.2018.01.035
Chivers, M. R., Turetsky, M. R., Waddington, J. M., Harden, J. W., and McGuire, A. D. (2009). Effects of Experimental Water Table and Temperature Manipulations on Ecosystem CO2 Fluxes in an Alaskan Rich Fen. Ecosystems 12, 1329–1342. doi:10.1007/s10021-009-9292-y
Cliche Trudeau, N., Garneau, M., and Pelletier, L. (2014). Interannual Variability in the CO2 Balance of a Boreal Patterned Fen, James Bay, Canada. Biogeochemistry 118, 371–387. doi:10.1007/s10533-013-9939-9
D’Angelo, B., Leroy, F., Guimbaud, C., Jacotot, A., Zocatelli, R., Gogo, S., et al. (2021). Carbon Balance and Spatial Variability of CO2 and CH4 Fluxes in a Sphagnum-Dominated Peatland in a Temperate Climate. Wetlands 41, 5. doi:10.1007/s13157-021-01411-y
Dieleman, C. M., Branfireun, B. A., McLaughlin, J. W., and Lindo, Z. (2015). Climate Change Drives a Shift in Peatland Ecosystem Plant Community: Implications for Ecosystem Function and Stability. Glob. Change Biol. 21, 388–395. doi:10.1111/gcb.12643
Dieleman, C. M., Lindo, Z., McLaughlin, J. W., Craig, A. E., and Branfireun, B. A. (2016). Climate Change Effects on Peatland Decomposition and Porewater Dissolved Organic Carbon Biogeochemistry. Biogeochemistry 128, 385–396. doi:10.1007/s10533-016-0214-8
Dorrepaal, E., Cornelissen, J. H. C., Aerts, R., Wallén, B., and Van Logtestijn, R. S. P. (2005). Are Growth Forms Consistent Predictors of Leaf Litter Quality and Decomposability across Peatlands along a Latitudinal Gradient?. J. Ecol. 93, 817–828. doi:10.1111/j.1365-2745.2005.01024.x
Dorrepaal, E., Toet, S., van Logtestijn, R. S. P., Swart, E., van de Weg, M. J., Callaghan, T. V., et al. (2009). Carbon Respiration from Subsurface Peat Accelerated by Climate Warming in the Subarctic. Nature 460, 616–619. doi:10.1038/nature08216
Dunfield, P., Knowles, R., Dumont, R., and Moore, T. (1993). Methane Production and Consumption in Temperate and Subarctic Peat Soils: Response to Temperature and pH. Soil Biol. Biochem. 25, 321–326. doi:10.1016/0038-0717(93)90130-4
Flanagan, L. B., and Syed, K. H. (2011). Stimulation of Both Photosynthesis and Respiration in Response to Warmer and Drier Conditions in a Boreal Peatland Ecosystem. Glob. Change Biol. 17, 2271–2287. doi:10.1111/j.1365-2486.2010.02378.x
Gavazov, K., Albrecht, R., Buttler, A., Dorrepaal, E., Garnett, M. H., Gogo, S., et al. (2018). Vascular Plant-Mediated Controls on Atmospheric Carbon Assimilation and Peat Carbon Decomposition under Climate Change. Glob. Change Biol. 24, 3911–3921. doi:10.1111/gcb.14140
Girkin, N. T., Turner, B. L., Ostle, N., Craigon, J., and Sjögersten, S. (2018). Root Exudate Analogues Accelerate CO2 and CH4 Production in Tropical Peat. Soil Biol. Biochem. 117, 48–55. doi:10.1016/j.soilbio.2017.11.008
Gogo, S., Laggoun-Défarge, F., Delarue, F., and Lottier, N. (2011). Invasion of a Sphagnum-Peatland by Betula Spp and Molinia Caerulea Impacts Organic Matter Biochemistry. Implications for Carbon and Nutrient Cycling. Biogeochemistry 106, 53–69. doi:10.1007/s10533-010-9433-6
Gogo, S., Laggoun-Défarge, F., Merzouki, F., Mounier, S., Guirimand-Dufour, A., Jozja, N., et al. (2016). In Situ and Laboratory Non-additive Litter Mixture Effect on C Dynamics of Sphagnum Rubellum and Molinia Caerulea Litters. J. Soils Sediments 16, 13–27. doi:10.1007/s11368-015-1178-3
Gong, Y., Wu, J., Vogt, J., and Ma, W. (2020). Greenhouse Gas Emissions from Peatlands under Manipulated Warming, Nitrogen Addition, and Vegetation Composition Change: a Review and Data Synthesis. Environ. Rev. 28, 428–437. doi:10.1139/er-2019-0064
Gorham, E. (1991). Northern Peatlands: Role in the Carbon Cycle and Probable Responses to Climatic Warming. Ecol. Appl. 1, 182–195. doi:10.2307/1941811
Hanson, P. J., Griffiths, N. A., Iversen, C. M., Norby, R. J., Sebestyen, S. D., Phillips, J. R., et al. (2020). Rapid Net Carbon Loss from a Whole‐Ecosystem Warmed Peatland. AGU Adv. 1, e2020AV000163. doi:10.1029/2020AV000163
Intergovernmental Panel on Climate Change (2014). Climate Change 2014: The Physical Science Basis: Working Group I Contribution to the Fifth Assessment Report of the Intergovernmental Panel on Climate Change. Cambridge: Cambridge University Press.
Jackson, R. B., Lajtha, K., Crow, S. E., Hugelius, G., Kramer, M. G., and Piñeiro, G. (2017). The Ecology of Soil Carbon: Pools, Vulnerabilities, and Biotic and Abiotic Controls. Annu. Rev. Ecol. Evol. Syst. 48, 419–445. doi:10.1146/annurev-ecolsys-112414-054234
Johnson, C. P., Pypker, T. G., Hribljan, J. A., and Chimner, R. A. (2013). Open Top Chambers and Infrared Lamps: A Comparison of Heating Efficacy and CO2/CH4 Dynamics in a Northern Michigan Peatland. Ecosystems 16, 736–748. doi:10.1007/s10021-013-9646-3
Johnson, K. A., and Goody, R. S. (2011). The Original Michaelis Constant: Translation of the 1913 Michaelis-Menten Paper. Biochemistry 50, 8264–8269. doi:10.1021/bi201284u
Kandel, T. P., Elsgaard, L., and Laerke, P. E. (2013). Measurement and Modelling of CO2flux from a Drained Fen Peatland Cultivated with Reed Canary Grass and spring Barley. GCB Bioenergy 5, 548–561. doi:10.1111/gcbb.12020
Koehler, A.-K., Sottocornola, M., and Kiely, G. (2011). How strong Is the Current Carbon Sequestration of an Atlantic Blanket Bog?. Glob. Change Biol. 17, 309–319. doi:10.1111/j.1365-2486.2010.02180.x
Laine, A., Wilson, D., Kiely, G., and Byrne, K. A. (2007). Methane Flux Dynamics in an Irish lowland Blanket Bog. Plant Soil 299, 181–193. doi:10.1007/s11104-007-9374-6
Laine, A. M., Mäkiranta, P., Laiho, R., Mehtätalo, L., Penttilä, T., Korrensalo, A., et al. (2019). Warming Impacts on Boreal Fen CO 2 Exchange under Wet and Dry Conditions. Glob. Change Biol. 25, 1995–2008. doi:10.1111/gcb.14617
Leifeld, J., Wüst-Galley, C., and Page, S. (2019). Intact and Managed Peatland Soils as a Source and Sink of GHGs from 1850 to 2100. Nat. Clim. Change 9, 945–947. doi:10.1038/s41558-019-0615-5
Leroy, F., Gogo, S., Guimbaud, C., Bernard-Jannin, L., Hu, Z., and Laggoun-Défarge, F. (2017). Vegetation Composition Controls Temperature Sensitivity of CO2 and CH4 Emissions and DOC Concentration in Peatlands. Soil Biol. Biochem. 107, 164–167. doi:10.1016/j.soilbio.2017.01.005
Leroy, F., Gogo, S., Guimbaud, C., Bernard-Jannin, L., Yin, X., Belot, G., et al. (2019). CO2 and CH4 Budgets and Global Warming Potential Modifications in Sphagnum-Dominated Peat Mesocosms Invaded by Molinia Caerulea. Biogeosciences 16, 4085–4095. doi:10.5194/bg-16-4085-2019
Lloyd, J., and Taylor, J. A. (1994). On the Temperature Dependence of Soil Respiration. Funct. Ecol. 8, 315–323. doi:10.2307/2389824
Mahadevan, P., Wofsy, S. C., Matross, D. M., Xiao, X., Dunn, A. L., Lin, J. C., et al. (2008). A Satellite-Based Biosphere Parameterization for Net Ecosystem CO2exchange: Vegetation Photosynthesis and Respiration Model (VPRM). Glob. Biogeochem. Cycles 22, GB2005. doi:10.1029/2006GB002735
Marion, G. M., Henry, G. H. R., Freckman, D. W., Johnstone, J., Jones, G., Jones, M. H., et al. (1997). Open-top Designs for Manipulating Field Temperature in High-Latitude Ecosystems. Glob. Change Biol. 3, 20–32. doi:10.1111/j.1365-2486.1997.gcb136.x
Medlyn, B. E., Dreyer, E., Ellsworth, D., Forstreuter, M., Harley, P. C., Kirschbaum, M. U. F., et al. (2002). Temperature Response of Parameters of a Biochemically Based Model of Photosynthesis. II. A Review of Experimental Data. Plant Cell Environ 25, 1167–1179. doi:10.1046/j.1365-3040.2002.00891.x
Munir, T. M., Perkins, M., Kaing, E., and Strack, M. (2015). Carbon Dioxide Flux and Net Primary Production of a Boreal Treed Bog: Responses to Warming and Water-Table-Lowering Simulations of Climate Change. Biogeosciences 12, 1091–1111. doi:10.5194/bg-12-1091-2015
Munir, T. M., and Strack, M. (2014). Methane Flux Influenced by Experimental Water Table Drawdown and Soil Warming in a Dry Boreal continental Bog. Ecosystems 17, 1271–1285. doi:10.1007/s10021-014-9795-z
Nilsson, M., Sagerfors, J., Buffam, I., Laudon, H., Eriksson, T., Grelle, A., et al. (2008). Contemporary Carbon Accumulation in a Boreal Oligotrophic Minerogenic Mire - a Significant Sink after Accounting for All C-Fluxes. Glob. Change Biol. 14, 2317–2332. doi:10.1111/j.1365-2486.2008.01654.x
Peichl, M., Öquist, M., Ottosson Löfvenius, M., Ilstedt, U., Sagerfors, J., Grelle, A., et al. (2014). A 12-year Record Reveals Pre-growing Season Temperature and Water Table Level Threshold Effects on the Net Carbon Dioxide Exchange in a Boreal Fen. Environ. Res. Lett. 9, 055006. doi:10.1088/1748-9326/9/5/055006
Raich, J. W., Rastetter, E. B., Melillo, J. M., Kicklighter, D. W., Steudler, P. A., Peterson, B. J., et al. (1991). Potential Net Primary Productivity in South America: Application of a Global Model. Ecol. Appl. Publ. Ecol. Soc. Am. 1, 399–429. doi:10.2307/1941899
Roulet, N., Moore, T., Bubier, J., and Lafleur, P. (1992). Northern Fens: Methane Flux and Climatic Change. Tellus B 44, 100–105. doi:10.1034/j.1600-0889.1992.t01-1-00002.x
Roulet, N. T., Lafleur, P. M., Richard, P. J. H., Moore, T. R., Humphreys, E. R., and Bubier, J. (2007). Contemporary Carbon Balance and Late Holocene Carbon Accumulation in a Northern Peatland. Glob. Change Biol. 13, 397–411. doi:10.1111/j.1365-2486.2006.01292.x
R Core Team (2020). A Language and Environment for Statistical Computing. Vienna, Austria: R Foundation for Statistical Computing.
Samson, M., Słowińska, S., Słowiński, M., Lamentowicz, M., Barabach, J., Harenda, K., et al. (2018). The Impact of Experimental Temperature and Water Level Manipulation on Carbon Dioxide Release in a Poor Fen in Northern Poland. Wetlands 38, 551–563. doi:10.1007/s13157-018-0999-4
Segers, R. (1998). Methane Production and Methane Consumption: a Review of Processes Underlying Wetland Methane Fluxes. Biogeochemistry 41, 23–51. doi:10.1023/A:1005929032764
Strack, M. (2008). Peatlands and Climate Change. Saarijärvi, Finland: International Peat Society, Saarijärven Offset Oy.
Straková, P., Niemi, R. M., Freeman, C., Peltoniemi, K., Toberman, H., Heiskanen, I., et al. (2011). Litter Type Affects the Activity of Aerobic Decomposers in a Boreal Peatland More Than Site Nutrient and Water Table Regimes. Available at: https://jukuri.luke.fi/handle/10024/516544 ( (Accessed July 23, 2020).
Szafranek-Nakonieczna, A., and Stepniewska, Z. (2014). Aerobic and Anaerobic Respiration in Profiles of Polesie Lubelskie Peatlands. Int. Agrophysics 28. Available at: http://yadda.icm.edu.pl/yadda/element/bwmeta1.element.agro-9a68ce86-a247-40f5-ae04-41017c4101d4 (Accessed May 31, 2020).
Thornley, J. H. M., and Johnson, I. R. (1990). Plant and Crop Modelling: a Mathematical Approach to Plant and Crop Physiology. Available at: https://agris.fao.org/agris-search/search.do?recordID=XF2016001523 (Accessed August 3, 2020).
Tuittila, E.-S., Vasander, H., and Laine, J. (2004). Sensitivity of C Sequestration in Reintroduced Sphagnum to Water-Level Variation in a Cutaway Peatland. Restor Ecol. 12, 483–493. doi:10.1111/j.1061-2971.2004.00280.x
Turetsky, M. R., Treat, C. C., Waldrop, M. P., Waddington, J. M., Harden, J. W., and McGuire, A. D. (2008). Short-term Response of Methane Fluxes and Methanogen Activity to Water Table and Soil Warming Manipulations in an Alaskan Peatland. J. Geophys. Res. 113, G00A10. doi:10.1029/2007JG000496
Updegraff, K., Bridgham, S. D., Pastor, J., Weishampel, P., and Harth, C. (2001). Response of CO 2 and CH 4 Emissions from Peatlands to Warming and Water Table Manipulation. Ecol. Appl. 11, 311–326. doi:10.2307/3060891
Voigt, C., Lamprecht, R. E., Marushchak, M. E., Lind, S. E., Novakovskiy, A., Aurela, M., et al. (2017). Warming of Subarctic Tundra Increases Emissions of All Three Important Greenhouse Gases - Carbon Dioxide, Methane, and Nitrous Oxide. Glob. Change Biol. 23, 3121–3138. doi:10.1111/gcb.13563
Waddington, J. M., Griffis, T. J., and Rouse, W. R. (1998). Northern Canadian Wetlands: Net Ecosystem CO2 Exchange and Climatic Change. Clim. Change 40, 267–275. doi:10.1023/A:1005468920206
Waddington, J. M., and Roulet, N. T. (2000). Carbon Balance of a Boreal Patterned Peatland. Glob. Change Biol. 6, 87–97. doi:10.1046/j.1365-2486.2000.00283.x
Ward, S. E., Ostle, N. J., Oakley, S., Quirk, H., Henrys, P. A., and Bardgett, R. D. (2013). Warming Effects on Greenhouse Gas Fluxes in Peatlands Are Modulated by Vegetation Composition. Ecol. Lett. 16, 1285–1293. doi:10.1111/ele.12167
Keywords: CO2 fluxes, methane emissions, carbon budget, climate warming, peatland
Citation: Li Q, Gogo S, Leroy F, Guimbaud C and Laggoun-Défarge F (2021) Response of Peatland CO2 and CH4 Fluxes to Experimental Warming and the Carbon Balance. Front. Earth Sci. 9:631368. doi: 10.3389/feart.2021.631368
Received: 19 November 2020; Accepted: 28 May 2021;
Published: 18 June 2021.
Edited by:
Annalea Lohila, University of Helsinki, FinlandCopyright © 2021 Li, Gogo, Leroy, Guimbaud and Laggoun-Défarge. This is an open-access article distributed under the terms of the Creative Commons Attribution License (CC BY). The use, distribution or reproduction in other forums is permitted, provided the original author(s) and the copyright owner(s) are credited and that the original publication in this journal is cited, in accordance with accepted academic practice. No use, distribution or reproduction is permitted which does not comply with these terms.
*Correspondence: Qian Li, qian.li@univ-orleans.fr