Paraglacial Rock Slope Stability Under Changing Environmental Conditions, Safuna Lakes, Cordillera Blanca Peru
 Jan Klimeš1*
  Jan Novotný2 Alejo Cochacin Rapre3 Jan Balek1 Pavel Zahradníček4,5
  Tazio Strozzi6 Hamid Sana1
  Holger Frey7 Miloš René1 Petr Štěpánek4,5 Jan Meitner4 Johan Junghardt8
- 1The Czech Academy of Sciences, Institute of Rock Structure and Mechanics, Prague, Czech Republic
- 2The Czech Geological Survey, Prague, Czech Republic
- 3Autoridad Nacional de Agua, Área de Evaluación de Glaciares y Lagunas, Lima, Peru
- 4The Czech Academy of Sciences, Global Change Research Institute, Brno, Czech Republic
- 5Czech Hydrometeorological Institute, Brno, Czech Republic
- 6Gamma Remote Sensing, Gümligen, Switzerland
- 7Department of Geography, University of Zurich, Zurich, Switzerland
- 8ZHAW School of Life Sciences and Facility Management, Wädenswil, Switzerland
Landslides or landslide-induced impact waves in high mountain lakes represent a high hazard for society, calling for realistic assessments of rock slope stability responsible for the process chain initiation. This task is often hampered by complex interplays of triggers, which effects on slope stability may be delayed by decades or even millennia, while historical records describing slope topography or landslide occurrences are usually shorter and incomplete. This article builds on rarely available detailed historical data describing the site of the 2002 rock avalanche in the Cordillera Blanca, Peru. It caused a dangerous impact wave in the Safuna Alta Lake resulting in a minor flood, but ongoing downstream development significantly increased the risk of a comparable event. Pre-2002 and post-2002 failure slope topography, 70 years long history of glaciation and landslide occurrences were combined with non-invasive field geological surveys and laboratory geotechnical analyses to characterize the distinct morphological parts of the failed slope with reliable engineering geological slope models. Slope stability was calculated for a series of environmental scenarios providing insights into the 2002 rock avalanche failure mechanism and dynamics as well as the role of glacier slope support for its stability. Results show that the rock slope stability is governed by discontinuous slip planes where rock bridges represent the most likely additional resisting forces. The effect of glacier support on the slope stability is limited under full-water saturation of the rocks and due to specific morpho-structural conditions. Importance of the long-term, progressive deterioration of the rock slope strength under paraglacial environment and repeated seismic shaking is illustrated by the fact that even the Little Ice Age maximum glacier extend only had minor positive effect on the pre-2002 rock avalanche slope stability. Despite of that, the slope remained without a major failure for decades or possibly even centuries. Its collapse in 2002 caused retrogressive movements of the adjacent slope, which remains highly unstable until now. Therefore the future safety of the lake would largely benefit from the implementation of a reliable slope movement monitoring system.
Introduction
High, glaciated mountains in seismically active regions represent sensitive environments where various hazardous processes with potentially cascading effects (Schaub et al., 2013; Westoby et al., 2014) occur and adversely affect social and economic development, leading in extreme cases to catastrophic events (Huggel et al., 2005; Allen et al., 2015; Iribarren Anacona et al., 2015; Byers et al., 2019). They are often initiated by landslides, (e.g. rockfalls, rockslides, rock avalanches), which cause disasters themselves or they may trigger a series of hazardous processes, (e.g. impact waves, lake outburst floods—LOF) resulting in damage far from the initiation points (Evans et al., 2009; Schneider et al., 2014; Haeberli et al., 2016). Occurrences of landslides are influenced by mountain glacier recession and thinning (Kos et al., 2016; Dussaillant et al., 2019; Emmer et al., 2020) as well as permafrost degradation (Coe et al., 2017) in addition to the loading and unloading effects of repeated glacial advances and retreats, (e.g. Hugenholtz et al., 2008; McColl, 2012). This has recently been confirmed by numerical modeling (Grämiger et al., 2017), which highlighted the significant role of glacial cycles in the progressive degradation of rock slope strength. However, an in-depth evaluation of triggering factors and landslide occurrence conditions reveals a complex interplay between passive settings, (e.g. morphological, geological and structural) and climatically driven glacier development (Holm et al., 2004) resulting into a non-linear relationship between slope and climate-glacier systems (Holm et al., 2004; Huggel et al., 2012). Further complexity to the stability of mountain slopes is added by earthquakes, which are not only well recognized landslide triggers (Plafker et al., 1971; Jibson et al., 2004), but also contribute to progressive slope stability deterioration (Lacroix et al., 2015; Gischig et al., 2016) and largely occur irrespective to the glaciation history. Nevertheless, they are often neglected when discussing glacier-related hazards in seismically active regions, which leads to biased assumptions about slope stability and its possible future development.
The Cordillera Blanca mountain range in Peru is an example of such a complex environment with numerous catastrophic historical landslide events (Zapata 2002; Klimeš and Vilímek, 2011) originating from the complex interplay of changing slope stability conditions, glacial extend and climatic variables. At the same time, ongoing socio-economic development in regions potentially affected by glacier related hazards leads to increased exposure and risk to very often highly vulnerable local communities (Bury et al., 2011; Hofflinger et al., 2019). In the Cordillera Blanca, a number of works already addressed various aspects of the complex hazard environment. They include regional scale landslide hazard and susceptibility mapping (Strozzi et al., 2018; Bueechi et al., 2019), LOF hazard assessment (Emmer and Vilímek, 2014), mountain-wide glacier retreat description, (e.g. Kasser, 1999; Veettil 2018) and related landform development (Iturrizaga, 2014), as well as the basin-scale effects of future climate change and glacier retreat on hydrological conditions (Kasser et al., 2003). Site specific studies have focused on LOFs triggered by rock-ice avalanches (Klimeš et al., 2014; Schneider et al., 2014; Frey et al., 2018; Megili et al., 2020) and landslides from moraines (Klimeš et al., 2016; Mergili et al., 2018) or very fast moving rock avalanches (Evans et al., 2009). Nevertheless, site specific studies of dangerous rock slides possibly triggering LOFs, (e.g. Hubbard et al., 2005) and their relation to deglaciation history are still missing for the Cordillera Blanca. This is despite the fact that observations from other glaciated mountains suggest that their activity or frequencies of occurrence will most likely increase in the near future (Deline et al., 2015; Kos et al., 2016). This article takes advantages of rarely available but abundant historical data providing pre- and post-failure information about the 2002 Safuna Lake rock avalanche (Hubbard et al., 2005), including slope topography and geology, glacier tongue retreat and downwasting history as well as the 70 years history of slope failures and recent (2007–2017) surface movement records. Using the site specific information, the article provides a complex examination of the interactions between rock slope stability characterized by its factor of safety (Fs) and observed changes of the paraglacial environment. This describes the long-term slope stability development and the major driving forces.
Study Area
Cordillera Blanca Mts
The Cordillera Blanca (Figure 1) is formed by granitic batholit emplaced in Jurassic sediments and forms the highest part of the western central Peruvian Andes with 27 peaks above 6,000 m asl (Juřicová and Fratianni 2018) including Huascarán (6,768 m above sea level— m asl). Its large part is protected as the National park of Huascarán preserving high natural and cultural values of the landscape and its inhabitants. It is located in the outer tropics with strong annual precipitation differences between rainy (October–April, about 90% of annual precipitations) and dry seasons (May–September). On the other hand, the annual temperature variability is low, while diurnal temperature amplitudes are significant (Kasser et al., 1990). The 6,000 km2 large mountain range hosts the most extensive tropical glacier coverage of the world (Kasser, 1999) with significant advances between 1590–1720 and 1790–1880 during two peaks of the Little Ice Age (LIA; Thompson et al., 2000; Rabatel et al., 2013). The following post-LIA glacier retreat was not uniform, but interrupted by a short period of re-advance in the 1920s (Georges 2004), and marked with severe acceleration at the beginning of the 21st century (Veettil 2018). The glacier cover in 1990 represented about 70% of the area of 1930 (900 km2, Georges 2004), but it reduced to only 54% in 2010 (480 km2, Burns and Nolin 2014). The long-term precipitation and temperature data analysis document a delayed response of the glaciers to the climatic forcing. The significant temperature rise (0.31°C per decade) between 1969–1998 slowed down to 0.13°C per decade during 1983–2012, when a cooling trend was detected for maximum daily temperatures, along with increasing precipitation amounts (Schauwecker et al., 2014). But this development, favorable for glacier accumulation and advance, seems not to have balanced the previous temperature increase. Thus, the glacier retreat and thinning is an ongoing process, manifested by a recent development of supraglacial lakes (Vilímek et al., 2015) and formation of hundreds of lakes behind the LIA moraines (Emmer et al., 2016) from which 6 catastrophic LOFs originated, causing at least 4,510 fatalities (Emmer, 2017). Around one third of the LOFs had been caused by landslides of moraine or rock slopes (Emmer et al., 2014) pointing out the importance of mountain slope stability, which is controlled by a number of processes and factors acting on different time scales. Glacial debuttressing acts at tens or hundreds of years up to millennia, while the intensive pluton uplift (>1 mm/year, Margirier et al., 2016) controls slope development at much larger time scales (Pánek and Klimeš, 2016), but could be enhanced by repeated glacial erosion unloading resulting in increased exhumation rates during the last 2 Ma (Margirier et al., 2016). Imminent factors responsible for landslide initiation are either directly related with meteorological conditions, e.g., excessive precipitation (Emmer et al., 2014; Klimeš et al., 2016) or climate change and possible permafrost degradation (Schneider et al., 2014) and glacier retreat or ground shaking during earthquakes (Plafker et al., 1971; Kampher, 2009).
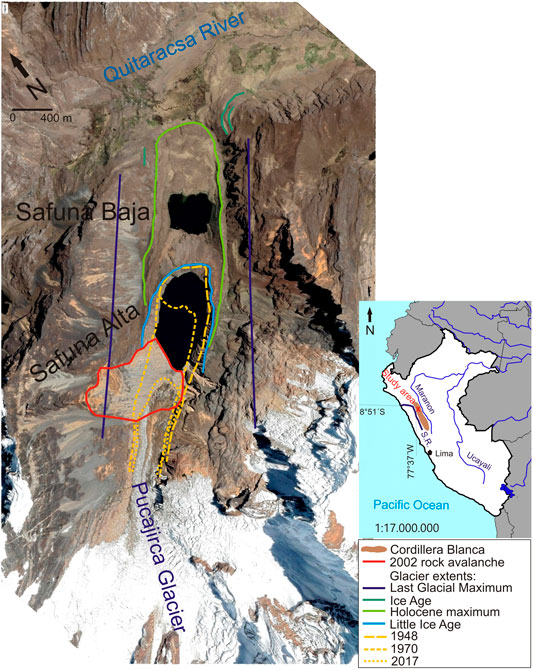
FIGURE 1. Reconstruction of the past glaciations of the Pucajirca trough based on morphological evidence from aerial photographs (1948, 1970) and the 2017 ortophoto map as well as previously published maps (Llibourty et al., 1977a).
Safuna Lakes
The two Safuna Lakes are located in the head of the Quitaracsa River (Figure 1), which flows after about 41 km into the Santa River (draining to Pacific Ocean) above the village of Huallanca located in the deeply incised valley stretch known as Cañon del Pato. Despite the fact that the village and the nearby hydroelectric power plant were devastated by an outburst flood in 1950 (Zapata, 2002), a new hydroelectric plant was build upstream of them (cf. Quitaracsa plant).
The Safuna Lakes valley developed in highly faulted Cretaceous sedimentary rocks mantling the NE limit of the Cordillera Blanca batholith formed by granodiorites and tonalites of Neogene age. These rocks outcrop on the western flank of the parallel valley less than 3 km to the south-west of the study site (Figure 1), which is located in a tectonically highly disturbed area. The west facing slopes of the Safuna Lakes valley are built by Lower Cretaceous limestones, mudstones and sandstones forming the south-west limb of a major syncline which axis strikes subparallel (NW-SE) to the Safuna Lakes valley 2 km away. Underlying quartzites with possible mudstones intercalations form the east facing slopes of the Safuna Valley (Wilson et al., 1995).
There are two Safuna Lakes, the lower one (Safuna Baja) formed behind a Holocene moraine, while the upper (Safuna Alta) is dammed by the Little Ice Age (LIA) moraine (Figure 1) with up to 80 m freeboard. The first supraglacial ponds formed on the Pucajirca glacier behind this moraine in 1950’ (Llibourty et al., 1977a) and the latest bathymetric measurements, acquired in 2017 revealed 14.8 × 10⁶ m3 of stored water with maximum depth of 87 m.
A large rock avalanche with an estimated volume of 8–20·106 m3 occurred on April 22, 2002 on the north-east facing slope above the Safuna Alta Lake (Hubbard et al., 2005, Figure 1). Its accumulation covered the lowest portion of the Pucajirca glacier and was partly (5 × 10⁶ m3) deposited directly into the lake, triggering a displacement wave more than 100 m high, overtopping the impounding moraine. It resulted in extensive erosion and minor flooding affecting only the imminent downstream area of the Safuna Baja Lake (Hubbard et al., 2005).
Methods and Data
Morphology and Landslide Development of the Study Area
A variety of historical, recent topographic and documentary data was used to describe slope morphology and landslide occurrences (Table 1). A historical DEM (hDEM) was derived from eight 1948 aerial photographs. The eight black and white aerial images were processed with Agisoft Photoscan software using Structure for Motion (SfM) method which has been established as a common tool in geoscientific research (Westoby et al., 2012). Eleven Ground Control Points (GCPs) at distinct natural landmarks, identified in Google Earth, were manually selected to assure optimal orthorectification and used to enhance estimation of parameters of internal and external orientation, since the camera calibration parameters and camera positions were unknown. The hDEM was inferred from 2.6 × 10⁶ elevation data points with spatial resolution of 5 m and was used to prepare historical orthophoto with 0.5 m pixel size (Frey et al., 2017). A drone flight in May 2017 collected 181 photographs from an altitude of 410 m above the terrain acquiring high resolution optical data (9.24 × 10⁻² m pixel size). They were processed in the same way as the 1948 aerial photographs producing orthophotos and a DEM with ground resolution of 0.37 m (Frey et al., 2017). Before the flight, twelve GCPs were signalized and their position measured using GNSS and tacheometry.

TABLE 1. List of available documentary data (aerial and field photographs, satellite images) and topographic data (maps, DEMs) used in the study (AEGL—Área de Evaluación de Glaciares y Lagunas).
The availability of the two historical DEMs allowed describing and quantifying the pre-failure topography as well as the changes caused by the 2002 rock avalanche. This required the estimation of positional errors of the two DEMs in areas where little change is expected (cf. site of 2002 rock avalanche and the Pucajirca glacier were left out). Since discrepancies between the two DEMs were found, the identified systematic deviation of the 2017 DEM was removed and both models were coregistered using the Iterative Closest Point algorithm. The resulting standard deviation in the vertical direction was 8.7 m in the area around the 2002 rock avalanche.
Field mapping (2017, 2018) focused on a detailed description of the recent morphology of the 2002 rock avalanche and identification of signs of slope failures around it as well as in the Safuna Valley.
Engineering-Geological Characterization of the Rock Mass
Calculations of the slope stability scenarios required the estimation of the shear strength of the involved rock material represented by highly fractured quartzitic rocks and fractured zones filled with gravel silty soils. Due to the absence of drilling or trenching data, the material description is based on the field measurements, standard laboratory tests and rock mass rating approaches involving surface observations and sampling which are subject to a certain degree of expert assessment. Great attention was paid to the material characterization to obtain reliable inputs for the slope stability calculations which results are aimed to serve for an assessment of future slope failure hazard.
Discontinuities
Pre-existing discontinuities represent the weakest part of the rock slope therefore strength on discontinuities was characterized by following approaches (Table 2): 1) direct measurements by tilt test obtaining friction angle of the discontinuity surfaces φf and basic friction angle φbasic; 2) field measurements of the first-order asperities providing the roughness i angle and 3) field measurement of the second-order asperities obtaining the Joint Roughness Coefficient (JRC; Barton, 1973). We examined surfaces of large boulders and outcrops along the NW landslide limit, which represent the same material as the one forming the failed rock slope. At each documented site, the main sets of discontinuities were identified and described in detail. For 20 documented typical discontinuities, the following information was collected: dip, dip direction, discontinuity spacing and filling (from outcrops) and parameters for the first-order and the second-order (Barton comb) asperities (also from large boulders) on rough rock surfaces. The real discontinuity surface friction angle φf was determined in a lab by a tilt test when two rock samples (approximately of 0.25 × 0.15 m) placed on each other were gradually inclined until the overlying rock sample slid. The sliding angle of 100 measurements on three different natural fracture surfaces was recorded and the average friction angle φf was calculated. Similar experiments were performed on smoothed (cut) surfaces of the quartzitic phyllite obtaining 100 values of the basic friction angle.
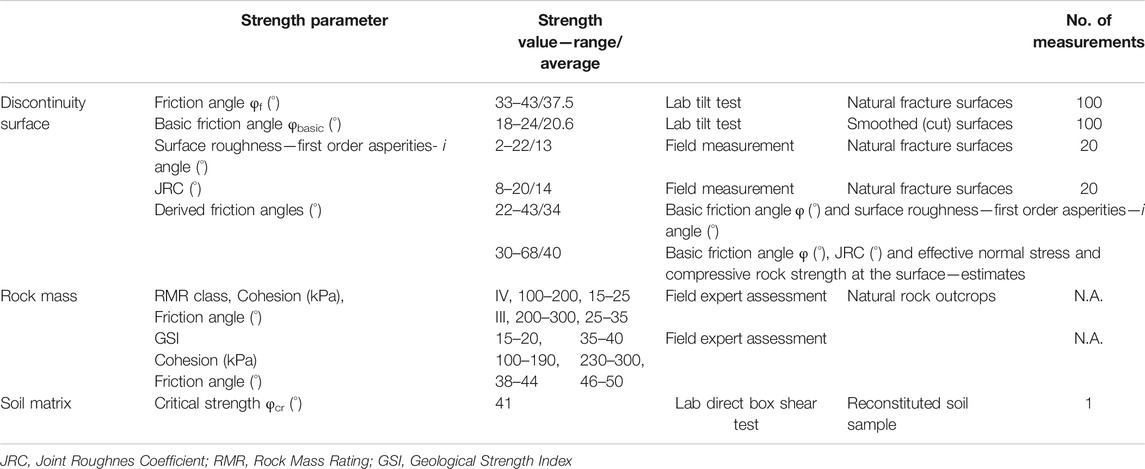
TABLE 2. Strength parameters used to characterize the studied landslide.
Rock Mass and Soil Matrix
Rock mass strength properties were defined by expert estimation using the Rock Mass Rating (RMR, Bienawski, 1989) and the Geological Strength Index (GSI, Hoek, 1994; Marinos and Hoek 2000) classifications. These ratings were based on observations during the field mapping tours around the landslide and along the opposite valley slope allowing the observation of well exposed profiles across the frontal part of the displaced and underlying rock mass up to 100 m below actual rock avalanche surface. These classifications provide estimates of cohesion and friction angle of the rock mass which were later used to describe additional resistance force acting on the discontinuities.
The soil matrix found within the highly disintegrated material in some parts of the rock avalanche was tested by laboratory direct shear box tests investigating reconstituted samples made of grains smaller than 4 mm. We assume that the obtained critical friction angle of this material governs the slope stability at the specific parts of the studied landslide.
Slope Stability Calculations
The stability of a slope is determined by the ratio of forces resisting its downslope movement and forces driving a downhill displacement. Landslides occur when the driving forces are equal to or exceed the resisting forces, which happens when the factor of safety (Fs) ≤ 1 (Schuster and Krizek, 1978). The effects of paraglacial environment and other landslide driving factors on the slope stability were tested to provide reliable results that are suitable for a hazard assessment of the Safuna Alta Lake. The slope stability calculations were performed by the FINE Geo 05 software using the well-established Sarma and Bishop methods for planar and circular sliding planes respectively (Bishop 1955; Sarma, 1975). The calculations were performed on the engineering geological model (Parry et al., 2018) defined by the morphology and structural settings of the so far un-failed slope just NW from the 2002 rock avalanche limit (profile A-2017 in Figure 2) constrained by the 2017 DEM topographic profile. Calculations considering measured and estimated strength parameters where used to identify the most probable rock mass properties governing its recent stability. The results provided reliable constrains for calculating the historical slope stability before the 2002 rock avalanche, which were performed on the 1948 profile (Figure 2) derived from the hDEM data. The stability of the same profile after the 2002 event was also calculated. The slope stability scenarios applied to all profiles included effects of water saturation (ranging from completely dry to fully saturated slopes), effects of seismic shaking using a horizontal seismic acceleration coefficient kh and effects of the slope unloading due to glacier retreat and partial rock slope failures documented on the historical photographs. The kh was set to 0.1 which roughly represents an earthquake of Mw 6–7 (Idris, 1985).
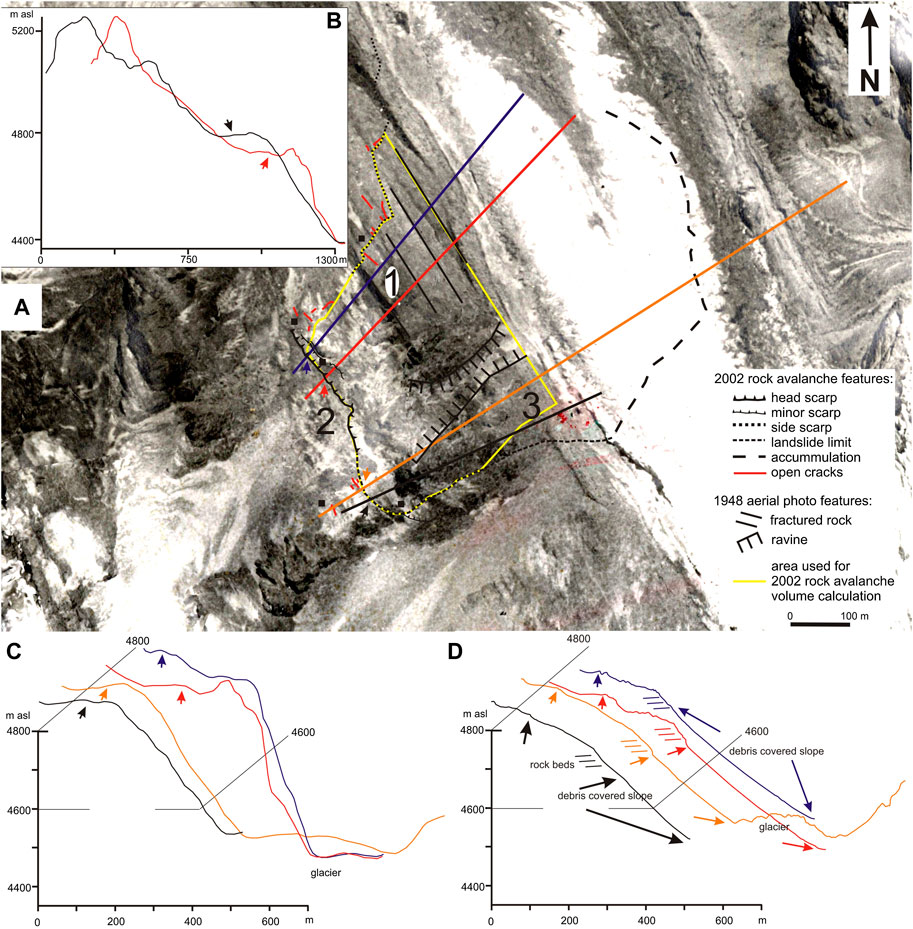
FIGURE 2. Slope morphology before the 2002 rock avalanche. 1948 aerial image (A) and topographic profiles derived from the hDEM (B and C) are shown as well as corresponding topographic profiles from the 2017 DEM (D). Inset B shows the historical topographic profiles from the ridge top to the toe of the slope following the red and black profiles shown on (A). Arrows indicate position of the 2002 rock avalanche scarp; numbers (1, 2, 3) are referred to in the text.
Surface Deformation History (2007–2016)
The prepared engineering geological slope models were combined with the satellite SAR interferometry (InSAR) surface deformation histories to interpret recent slope movements and check their coherence (sensus Simeoni et al., 2020) with the results of the slope stability calculations. Differential interferograms were computed with 5 ascending and 4 descending ALOS-2 PALSAR-2 scenes from December 2014 to February 2016 and with 35 ascending and 42 descending scenes Sentinel-1 IWS scenes from October 2014 to August 2017. Persistent Scatterer Interferometry (PSI) was applied to both Sentinel-1 track geometries. Furthermore, InSAR results from the previous S:GLA:MO project (Strozzi et al., 2018) were used in order to extend the time spans of observations. In particular, we considered a PSI analysis of ALOS-1 PALSAR-1 from 2007 to 2011.
Description of the Selected Environmental Conditions
Earthquakes and prolonged or intense precipitation events are the most significant landslide triggers to be considered for the study site (Plafker et al., 1971; Vilímek et al., 2012). The regional seismicity has its major source in the subduction process of the Nazca plate beneath the South American tectonic plate. It results in strong earthquakes of up to Mw > 8. A further sources of seismicity are internal deformations of the Nazca plate below the Andean range and deformations of the continental crust (Tavera, 2014). Detailed short-term observations of the local seismicity along the Cordillera Blanca fault showed absence of shaking in the north part and a recorded Mw maximum of 3.2 (Deverchére et al., 1989). The global USGS earthquake database (USGS, 2020a) was searched for earthquakes which could affect the initiation of the 2002 rock avalanche. These observations were completed with the description of shaking effects of the Mw 8.0, May 26th, 2019 Loreto earthquake (Miranda, 2019) with the epicenter located about 410 km NE from the rock avalanche. We interpolated the peak ground acceleration (PGA) calculated by USGS. (2020a) obtaining a value of 0.035 g for the study site. Using the same source of information (USGS, 2020b) we also interpolated the PGA of the Mw 7.9, May 31, 1970 Peru earthquake, which caused serious damage and triggered thousands of landslides in the region around the study site. The PGA values for the nearby towns of Huallanca (26 km E of the study site, 0.22 g) and of Pomabamba (18 km W of the study site, 0.11 g) were used to calculate the 0.15 g PGA for the study site. Using the PGA values to determine respective horizontal seismic acceleration coefficient kh for slope stability calculation is a complex task (Jibson, 2012) thus we used a conservative approach where kh is equal to the estimated PGA value. Therefore the kh value of 0.1 used for the slope stability calculations is realistic with respect to historical events affecting the study site.
Precipitations and temperatures at the studied site were analyzed as each of these factors or their combination is capable of triggering high mountain landslides. The global CRU 4.0.1. dataset derived of gridded station observations (Harris et al., 2014) has been selected as suitable input with long time series. The horizontal resolution of the data is 0.5° both in longitude and latitude. The CRU precipitation data for the study site is available since 1943 and the temperature data since 1951. In the first step, the most suitable CRU grid points were selected to calculate new time series in our defined point at 4,800 m asl. The criterion applied included distance and altitude difference. The nearest CRU point is 18 km away and is located at a 3,696 m asl. Overall, the five most appropriate CRU reference series were selected for the calculated point. Before applying inverse distance weighting, data at the neighbor stations were standardized relatively to the altitude of the base grid point. The standardization was carried out by means of linear regression and dependence of values of a particular meteorological element on altitude for each month individually and regionally. For the weighted average (using inverse distance as weight), the power of weights equal to 1 for temperature and 3 for precipitation were applied (Štěpánek et al., 2011).
The Pucajirca glacier extent since the LIA and its retreat during the last decades was described using the available documentary data (Table 1) and geomorphological mapping.
Landslide and LOF Hazard Assessment
A far-reaching outburst flood of the Safuna Alta Lake is a possible, potentially catastrophic consequence of a landslide failure at the investigated slope. Considering the dam properties and geometry, the major displacement wave, caused by a large impacting mass movement is the only possible process that has the potential to trigger a lake outburst, as it was the case of the 2002 landslide. The LOF hazard for the Safuna Alta Lake is therefore directly related to the landslide hazard of the surrounding slopes (cf. Schneider et al., 2014). Therefore, we assessed the landslide hazard separately following the method standardized in Switzerland (Raetzo et al., 2002). The InSAR based landslide mean annual deformation velocities (mm y−1) served as intensity measure and were determined separately for the three slope areas described with the engineering geological profiles (A,B,C-2017; Figure 3). The threshold value for low and medium classes is the mean annual velocity of 20 mm y−1. Results of the slope stability calculations were considered as relative measure of occurrence probability (Raetzo et al., 2002) assuming that the slope closest to the threshold stability value, (e.g. Fs = 1) under the dry conditions, has the highest probability to fail due to meteorological triggers. We also considered the magnitude of the drop in value of the Fs under full saturation conditions as a secondary criterion, assuming that the slope where the Fs is more reduced under the full saturation is more sensitive and thus is more likely to fail due to increasing water content. This is static approach, which neglects occurrence probabilities of meteorological or seismic triggers since their reliable definitions are very difficult due to lack of historical data linking specific triggering conditions and landslide occurrences. Therefore, the assigned probability classes (cf. low, medium, high) have only relative meaning and do not represent the returned periods associated with them in Raetzo et al. (2002).
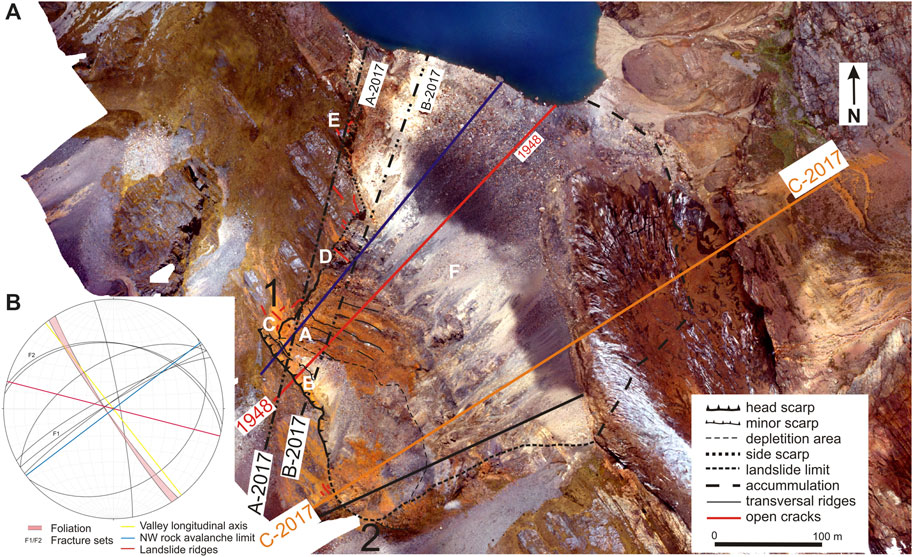
FIGURE 3. Traces of engineering geological slope models used to calculate slope stability under historical topography (1948) and with recent topography outside (A-2017) and inside (B, C-2017) the 2002 rock avalanche. White letters (A–F) locate photographs in Figure 5. Background image is the 2017 drone ortophoto.
Results
Pucajirca Glacier Tongue Development
The Safuna Lakes trough bares evidence of repeated glaciations (Llibourty et al., 1977a), whose timing and extent are constrained only by analogy with information from other parts of the Cordillera Blanca and the morphology of the valley slopes (Figure 1). The Safuna Alta Lake developed during the 1950s caused by glacier recession and thinning (Llibourty et al., 1977a). The total documented glacier tongue retreat until 2019 compared to its LIA maximum extent is 1,140 m, with the recent tongue terminus at 4,410 m asl. At the rock avalanche site, the Holocene and LIA moraines have left evidence at a similar elevation of approximately 4,600 m asl. There are several morphological indications of pre-Holocene glaciation, which is referred to as LGM (Last Glacial Maximum; Figure 1). The maximum glaciation is demonstrated by a short moraine rampart and a subtle textural and dip change in the scree on the SW valley side, while a distinct limit of the trough shoulder marks it on the opposite (NE) slope. This suggested LGM trimline reaches very close to the upper, flat part of the 2002 landslide at an elevation of approximately 4,740 m asl. Approximately 120 m below this trimline and above the Holocene moraine there is evidence of further glaciation of an unknown age (Ice Age in Figure 1).
The Pucajirca glacier tongue development was strongly affected by the 2002 rock avalanche that buried approximately 105 m2 of the glacier terminus, which was still connected with the lake at that time. The landslide accumulation thickness on the glacier was estimated to be up to 50 m (Hubbard et al., 2005). During the following eight years, due to the strong reduction of melting by the insulating effect of the landslide deposits, the glacier re-advanced by approximately 270 m (2002–2010, see also C and D in Figure 4) giving an average advance rate of 33 m y−1. Between 2010 and 2015, a glacier front advancement of 40 m (Audéou, 2017) was accompanied by the development of a distinct 10 m high side moraine below the landslide toe (D, E in Figure 3). The most recent satellite images (2018, 2019) show slow deterioration of the glacier tongue terminus with no obvious advancement or retreat. It remains disconnected from the lake.
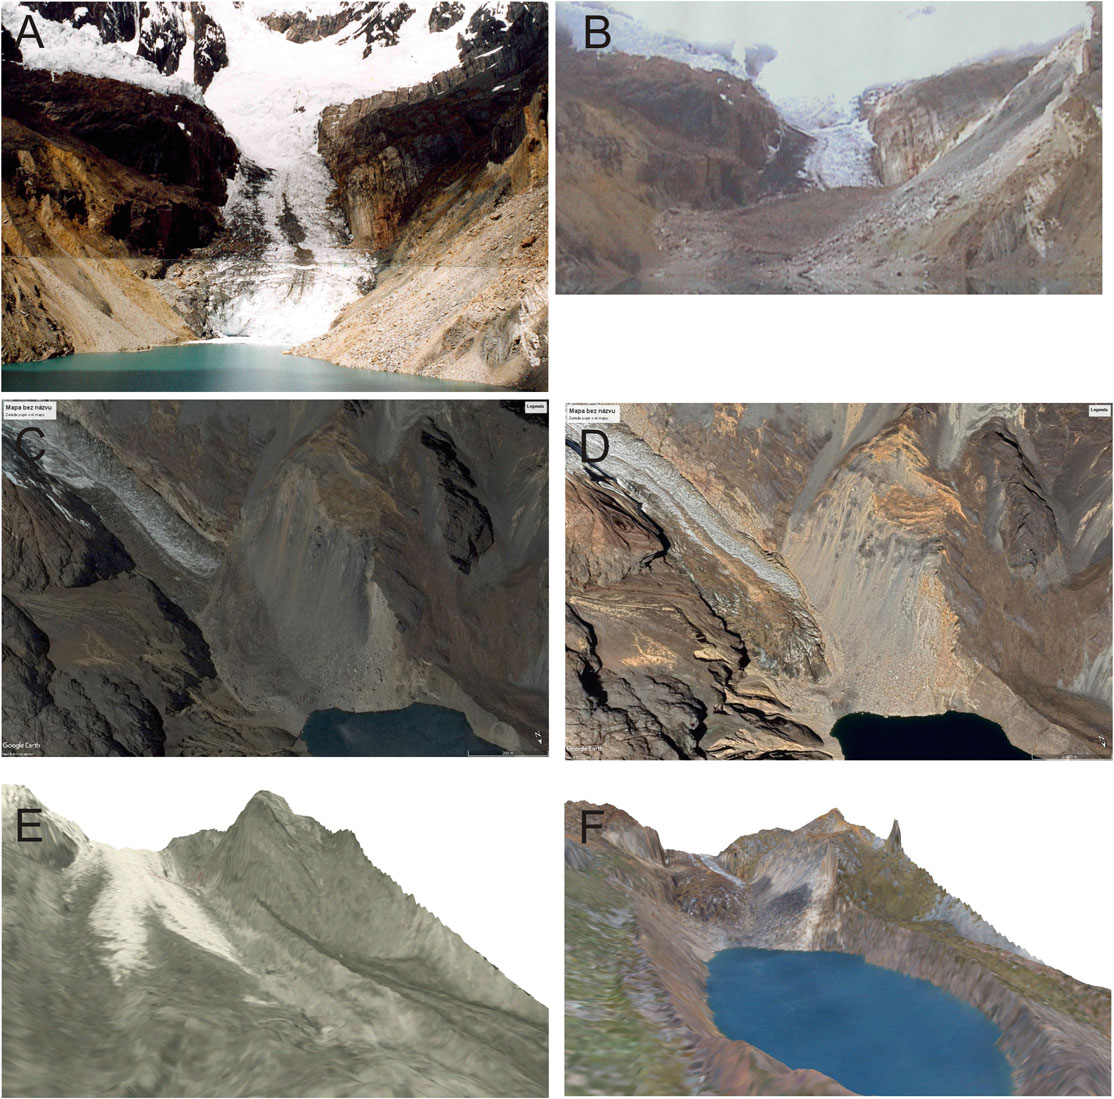
FIGURE 4. Field photographs ((A)–2000 (B)–2002), satellite images from the Google Earth ((C)—2015 (D)–2018), and views of the study area on the ortophotos overlaid on the respective digital elevation models ((E)—1948 (F)–2017) illustrate the state of the Pucajirca glacier before and after the 2002 rock avalanche.
Description of the Slope Before the 2002 Rock Avalanche
Evidence of slope processes found on the historical aerial images (Table 1) represents surface sediment transport and shallow landsliding of the scree above the glacier, or small rockslides (identified on the 1948 aerial photograph) from the steep rock slopes above the future 2002 rock avalanche. The first documented rockfall within the 2002 rock avalanche originated from the steep rock wall (blue profile in Figure 2C) before 1995. A rock slab (15–20 m thick) directly above the scree slope failed partly onto the glacier tongue and into the lake. Another rockfall from the similar site occurred between 1997 and 2000, reaching a combined volume of approximately 1 × 10⁶ m3
Before the 2002 event, the NW part of the future rock avalanche (1 in Figure 2A) was built by steep and up to 300 m high quartzite rock above the Pucajirca glacier (blue and red profiles in Figure 2C) with apparent fractures striking parallel with the valley. The main rock avalanche scarp (2 in Figure 2A) developed behind this rock wall on a gently inclined slope or along an approximately 80 m wide trench (red profile in Figure 2C). The SE part (3 in Figure 2A) of the future landslide was formed by a side ridge striking obliquely (NE-SW) to the valley axis that was separated from the rest of the future rock avalanche by an up to 100 m wide ravine, which cut across the quartzite rocks. This SE 2002 landslide part was characterized by a less steep and approximately 70 m shorter slope above the glacier (orange and black profiles in Figure 2C). The main scarp developed on a gently inclined counter slope platform, which interrupted the side ridge. The slope around the future scarp was covered by weathered material with ochre soil.
Description of the 2002 Rock Avalanche
The rock avalanche initiated as a planar rock slide of quartzites (cf. fine-grained metamorphic rock composed of quartz and a very fine mixture of clay minerals, chlorite and organic matter, Supplementary Material S1) with slip surfaces determined by steeply dipping foliation running parallel to the valley sides (Foliation in Figure 3B, dip direction 234°–238°/dip 85°–90°; also noted by Audéou, 2017; Hubbard et al., 2005) and gently dipping fractures (F2 in Figure 3B, dip direction 8°–12°/dip 40°) along which the slip surface developed. It transported the material across a 300 m high scree slope depositing it on the glacier tongue and into the lake. The material did not run up the opposite slope but was confined by the valley floor and formed a lobate structure over the glacier tongue (Figures 4B,C). The NW part of the main scarp of the rock avalanche (1 in Figure 3A) is up to 10 m high with a 15 m wide tension trench below, extending 30 m beyond the landslide’s NW lateral limit (A, B in Figure 5). There are WWN-EES striking transversal ridges and platforms covering the landslide below this portion of the main scarp. The ridges form counter slope platforms usually compound by a mixture of thin (approximately 0.15–0.3 m) slabs of quartzitic phyllite and chlorite quartzite with an ochre soil matrix. The NW side limit follows the sub-vertical fissures (F1 in Figure 3B) in the chlorite quartzite beds (0.2–0.6 m) and foliated quartzitic phyllite, which are interbedded with highly weakened zones filled with disintegrated angular rocks and an ochre sediment matrix (D in Figure 5). The gently down-slope (10°) or even counter-slope dipping depletion zone below the NW scarp turns into a steep (45°–75°) slope formed by seemingly sub-horizontally bedded rocks deformed into wide syncline, which were not affected by the rock avalanche movement (F in Figure 5). The below-lying scree slope has a uniform dip of approximately 35° across the entire landslide width. Angular rock blocks on its surface have dimensions from approximately 0.5 m up to 15 m.
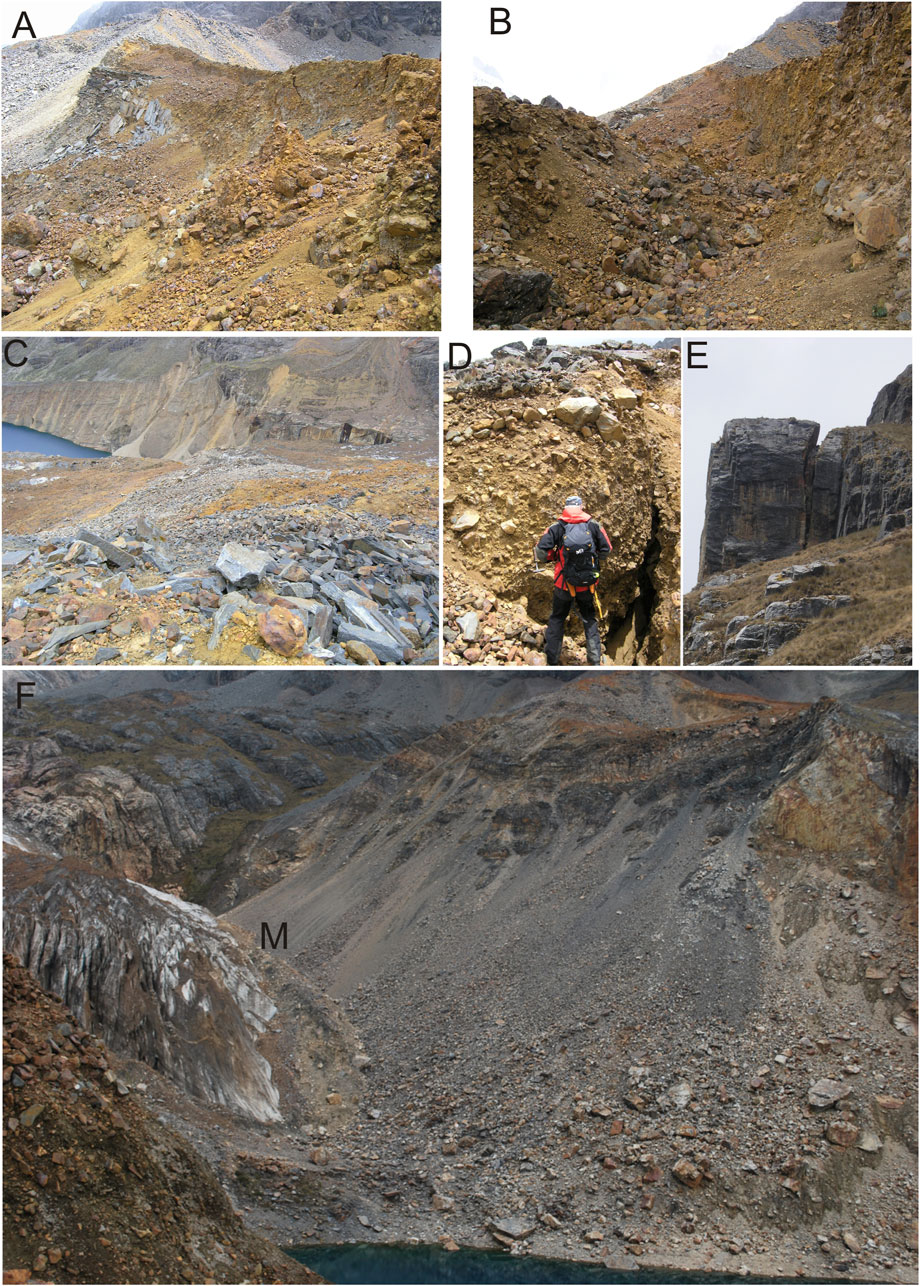
FIGURE 5. (A)—main scarp (B)—trench below the main scarp at the W limit of the rock avalanche (C)—material below the main scarp near the W limit of the rock avalanche (D)–highly weakened zone filled with disintegrated angular rocks andochre sediment matrix; (E)—crack detaching large rock block at the slope toe at the W rock avalanche limit; (F)—frontal view of the rock avalanche shows seemingly sub-horizontal bedded rocks, debris slope and tip of the Pucajirca glacier tongue with side moraine (M) formed chiefly by the avalanche accumulation. Photographs taken in 2018, for their location see Figure 3.
On the other hand, the SE scarp and side landslide limit are not well morphologically developed (2 in Figure 3 in Figure 5), but open tension cracks were identified approximately 50 m above the scarp. The scarp limits the depletion zone with a planar surface exposing highly fragmented and weathered landslide material (angular boulders with ochre silty sand with a gravel admixture).
A comparison of the historical and 2017 DEMs allowed us to estimate the total volume of the material transported away from the source area (Figure 2) to be 10 × 106 ± 2.5 × 10⁶ m3 (with a 95% confidence level). This volume does not contain landslide material above the slip surface, which was not completely evacuated during the movement and, therefore, fits into the range (8–20 × 106 m3) suggested by Hubbard et al., 2005 who estimated the entire volume of the avalanche.
Strength Characteristics of the Rock Mass
Strength on Discontinuities
The fracture surface friction angle φf (Table 2) in the quartzitic phyllite measured by tilt tests on natural surfaces had a very narrow range of four degrees (36°–39°) for almost 70% of the measured values. Results for the smoothed, cut surfaces had an even smaller variance, with 60% of the values falling in a two-degree interval (20°–21°) and 90% of the values in a four-degree interval of 19°–22°. These narrow value ranges contrast with the field measurements of the fracture surface roughness i angle for the first order asperities, which ranged over an interval of 21° (2°–22°) with an average value of 13° (Table 2). The fracture surface characteristics were combined to determine the peak frictional angle as φbasic + i (Table 2) obtaining an average value of 34° (first order asperities used) or 40° (second order asperities used) with a wide variability (30°–68°) considering the different normal stresses according to the depth of the suggested sliding surface.
Rock Mass Strength
The quality of the rock massif surrounding the 2002 rock avalanche was classified as poor rock (IV, RMR), while the fair rock (III, RMR) class may only be considered for its deeper part where the unfavorable fracturing is not so significant. The GSI for the near surface, highly fractured material with poor to very poor fracture surface quality, was estimated to be between 15 and 20; while for the deeper, more compact rock material with fair fracture surface quality, the index may vary between 35 and 40. The respective rock mass shear strengths are presented in Table 2.
Soils Strength
The strength of the soil material was described using the standard box direct shear test on a reconstituted sample collected from the weak, fractured zone near the landslide scarp. In the normal stress interval of 50–400 kPa, the critical angle of internal friction (φcr) was 41° for the material with maximum 4 mm grain size. The residual shear strength was estimated based on the granulometric curve in the interval 33°–36° (Novotný and Klimeš 2014), which means lower than measured. Higher measured values of the critical angle of internal friction may be explained by the very angular state of the gravel grains, which cannot be taken into account in estimates based purely on granulometry.
Slope Stability Assessment From LGM to Recent
Stability of Rock Slope West of the 2002 Rock Avalanche
We used all of the available data gathered in the field, laboratory and through remote sensing techniques to create the most representative engineering geological model of the rock slope to the immediate west of the NW limit of the 2002 rock avalanche (profile A-2017 in Figure 3A). In the first test calculation, we assumed that the slope stability is governed only by the strength of fracture surfaces, which form a continuous slip surface determined by steeply dipping foliation and gently dipping fractures. In this case, the resistant force is represented only by the fracture friction angle (φf, 37°) or by a combination of the basic friction angle φ and roughness i angle (34°, Table 2). The calculations resulted in a factor of safety (Fs) value well below the threshold (Fs = 1) even under dry slope conditions (0.92 and 0.81, respectively). Such a result is unrealistic, considering the observed temporal stability of the slope, where a Fs above the threshold value is expected. Rock bridges of a discontinuous slip plane represent the most likely additional resisting forces. We used our assumptions about the entire rock mass strength to introduce this factor to the calculations by adding different cohesion values corresponding to a medium strong rock mass (class III according to the RMR). Then the slope stability exceeded the threshold value with a cohesion of 200 kPa under dry slope conditions (Fs = 1.2, Figure 6), but became highly unstable if the effect of seismic shaking roughly corresponding to Mw 6–7 (Kh = 0.1) was added (Fs = 1.01, Figure 6). The slope under fully saturated conditions was below the threshold value (Fs = 0.82, Figure 6). We consider the assumption about rock bridges applied in the calculations as realistic with respect to the observed temporal stability of the modeled slope.
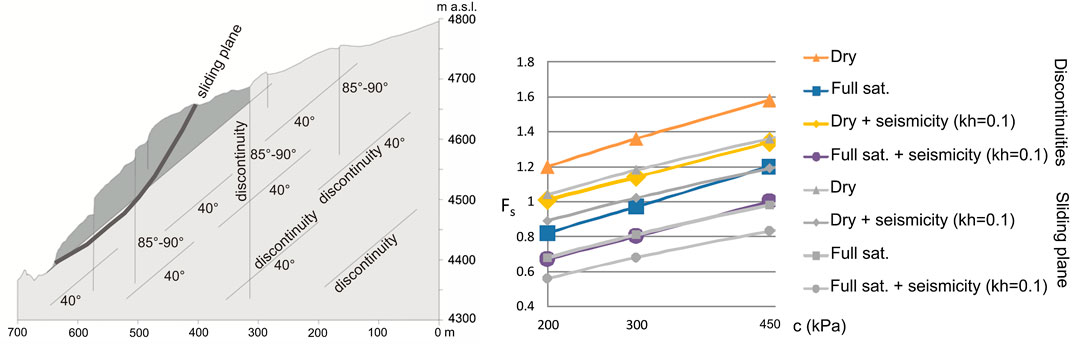
FIGURE 6. Engineering geological model (left) of the slope profile A-2017 (for location see Figure 3). Factor of safety (Fs) is calculated for different cohesions and combination of environmental conditions (right) for planar sliding along identified discontinuities (color lines) and semi-circular sliding plane (gray lines). Dry – slope without any groundwater, Full sat. – full saturation of the slope.
It is difficult to assess the actual structural conditions, (e.g. fracture density and spacing) below the surface of the modeled rock mass. Therefore, we also tested a scenario where dense fractures allow the development of a semi-circular slip surface within a tectonically or gravitationally disturbed rock mass (Figure 6). The resulting Fs values under all of the environmental scenarios are considerably lower than in the previous case where the slope stability is governed by discontinuities observed on the slope surface (Supplementary Material S1). This is because the best-fitted semi-circular slip surface determined by the software is mostly 10° steeper than the fractures (40°) considered as the main slip surface of the study site based on the available structural data. The threshold value of Fs = 1.04 was achieved with a cohesion of 200 kPa only under dry slope conditions. Because of the temporal stability of the slope, we think that such highly unstable conditions do not represent the actual state of the slope well and, therefore, we think it is highly unlikely that the rock slope stability is governed by a semi-circular slip surface.
Next, we performed a series of scenario calculations testing the effects of slope unloading resulting from the glacier fluctuations and potential rock slides of the slope toe representing a hypothetical adjustment to the ice loss. The estimated levels of the LGM and LIA glacier supported the entire or a substantial part of the slope (Figure 7); therefore, we did not perform separate calculations for these conditions as the slope stability would be very high, representing a stable slope. However, we tested the effect of the 1948 glacier level slope support as it was approximately 100 m thicker than it is now. Under the 1948 glacier conditions, the slope stability drops below the threshold value only under the least favorable conditions, (e.g. full slope saturation or full slope saturation combined with seismicity with cohesion of 200 kPa, Figure 7). When compared with recent conditions without glacier support (Figure 6), we can see that due to glacier downwasting, the slope Fs decreased by 11 through 23%, depending on the slope state (Figure 7). The slope could accommodate the loss of the glacier support by the falling of blocks 1 and 2 (Figure 7). This scenario is based on the observed rock falls before 1995 on the 2002 rock avalanche slope. The hypothetical rock falls of blocks 1 and 2 would cause a further decrease in the slope stability by 2 through 10%.
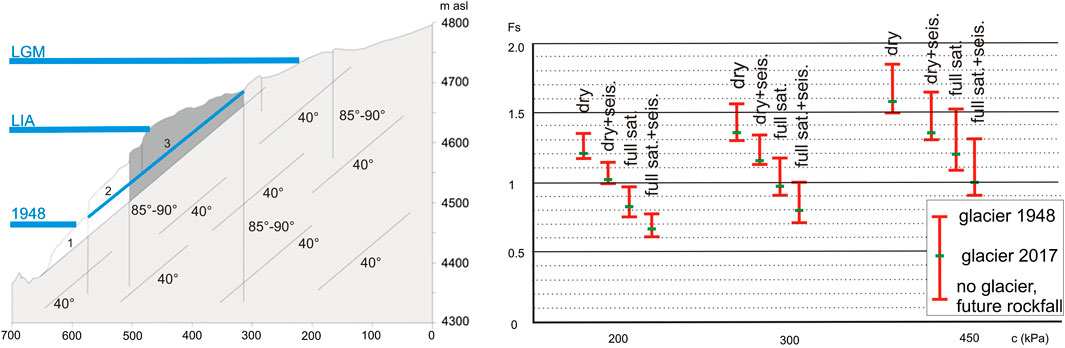
FIGURE 7. Engineering geological model of the slope profile A-2017 (for location see Figure 3) showing glacier height (thick blue line, left of the image) for different glaciation stages with corresponding, structurally constrained sliding plane (solid blue line) for the 1948 glacier height. It represents the most stable scenario “glacier 1948,” which factor of safety is shown in the right part of the image for different values of cohesion. “Glacier 2017” scenario describes recent conditions (slope without glacier support and with recent topography–all three blocks remain in place). The least stable scenario (“no glacier, future rockfall”) is defined by absence of glacier support and further slope unloading by removal of rock blocks 1 and 2 where the stability of the dark gray bock 3 is calculated.
Stability of the Slope Below the Main Scarp of the 2002 Rock Avalanche
The second engineering geological slope model (Figure 8 and profile B-2017 in Figure 3A) evaluates the recent stability of the 2002 rock avalanche. It is formed by reworked landslide material resting on a gentle slope below its main NW scarp, which turns into a very steep rock slope with its toe covered mainly by rock avalanche accumulation. This loose material was characterized by the critical angle of internal friction (φcr = 34°–37°) without considering cohesion (Supplementary Material S1). The Fs value decreases below the threshold only when the least stable conditions are considered a combination of full slope water saturation with seismic shaking. When considering the cohesionless sliding plane constrained by 40° dipping fractures detaching the edge of the steep slope, its Fs value is well below the threshold even under dry conditions (Fs = 0.88; Supplementary Material S1). Even with cohesion of 200 kPa, its stability is slightly lower than that of the loose material in the rock avalanche depletion area (Figure 8). This may point toward possible retrogressive failures, which may destabilize larger rock volumes below the main rock avalanche scarp. These calculations also suggest that the slope and material of the 2002 rock avalanche within its NW source area are more stable than the adjacent rock slope to the immediate W of the rock avalanche limit (profile A-2017 in Figure 3A).
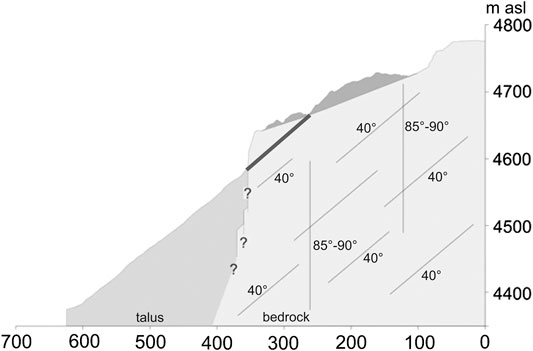
FIGURE 8. Engineering geological model derived from the recent morphology of a profile running across the main NW scarp of the 2002 rock avalanche (profile B-2017 in Figure 3). Thick gray line represents structurally constrained sliding plane.
The calculations based on the above-described input data and recent topography provided constraints for the assessment of the historical slope stability using the pre-2002 failure topography derived from the hDEM (Figure 9). The calculations tested three hypothetical slip surfaces of the initial state of the rock avalanche. Two planar sliding planes were estimated using the post-failure topography (cf. crown and toe of the source area) and documented structural conditions (the solid gray and hatched areas on Figure 9). Nevertheless, we suggest that the most probable scenario of the failure initiation is a partial rock slide along the discontinuous slip surface determined by the steeply dipping open tension crack with no strength and 40° dipping fractures (the yellow area in Figure 9). Movement of such a rock block would be followed by failure of the rest of the slope leaving in place the highly fractured and loosened mixture of rock and soil material, which recently covers the depletion part of the rock avalanche.
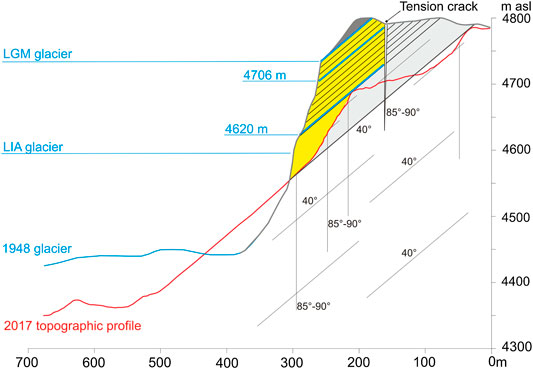
FIGURE 9. Engineering geological model used for stability assessment of the slope before the 2002 rock avalanche running across the main NW scarp (profile 1948 in Figure 3). Gray and hatched areas represent assumed sliding masses of the 2002 rock avalanche constrained by post-failure morphology and structural conditions. The yellow area is the suggested initial rock block failure followed by the collapse of the rest of the slope forming the recent topography shown in red. Thick blue lines represent suggested sliding planes used for slope stability calculations under different glaciation scenarios.
Factors of safety calculated for all of the suggested 2002 failure slip surfaces were all slightly lower (for a comparison see Supplementary Material S1) than the Fs values obtained for the rock slope to the immediate W of the 2002 rock avalanche (profile A-2017 in Figure 3A). The partial rock slide (yellow area in Figure 9) had by far the worst slope stability, where even for the dry slope with no seismic shaking the Fs value was well below the threshold (0.96 even with cohesion of 450 kPa for a friction angle of 37°), which reduced to 0.43 under the worst case conditions, (e.g. full slope saturation and seismic shaking with cohesion of 200 kPa; Supplementary Material S1). We think that such low slope stability supports the suggested progressive failure during the 2002 rock avalanche event.
These calculations characterize the slope stability during the post-LIA glacier retreat when the considered slip surfaces daylight above the glacier lacking its support. Such conditions are documented at least since 1948, but we can expect them even several decades before that time (Figure 9). The effect of the LIA glacier advance on the slope stability was calculated by placing the glacier surface at an elevation of 4,620 m asl. The Fs value improved significantly under dry slope conditions and largely also for dry slope conditions combined with the effects of seismic shaking, while the slope stability under full saturation conditions remained well below the Fs threshold value in most cases (Supplementary Material S1). A further increase in the glacier level toward the LGM, (e.g. 4,706 m asl, Figure 9) improved the slope stability in all of the calculated scenarios with a value below the threshold only under the least favorable slope conditions, (e.g. full slope saturation and seismic shaking). The suggested LGM glacier extent at 4,740 m asl caused the slope to remain stable (minimum Fs = 1.95, Supplementary Material S1) even under the least favorable conditions, (e.g. full slope saturation, seismic shaking and cohesion of 200 kPa).
Stability of the Slope Below the SE Scarp Area of the 2002 Rock Avalanche
The SE part of the rock avalanche depletion area has a different morphology (Figure 10 and C-2017 in Figure 3) and is covered by highly fragmented and weathered landslide material (angular boulders with ochre sandy silty gravel soil). The structurally constrained slip surfaces dip more than the slope surface and, therefore, do not represent the most likely future sliding surface. Therefore, we suggest that the slip surfaces may develop in the loose landslide material up to a depth of approximately 20 m (Figure 10) where the critical angle of internal friction (φcr) was determined to be 41° for normal stresses (50–400 kPa). The Fs value of such a landslide is high above the threshold under dry conditions (1.24) but significantly decreases when half or the entire landslide material is saturated by water (to 0.90 and 0.59, respectively). This suggests possible significant annual stability fluctuations driven by material saturation during the rainy season. Calculations of the slope stability for the pre-2002 rock avalanche slope morphology confirm the results of the recent slope stability. The slope Fs value is above the threshold for dry slope scenarios even when considering the effects of seismic shaking, resulting in Fs = 1.02 for the combination of shear strength φ = 37 and c = 200 kPa. Full water saturation causes a decrease below the threshold only for the least cohesive material, (e.g. 200 kPa, Fs in the range of 0.85–0.91). A combination of seismic shaking and full material saturation significantly lowers the slope stability, with the maximum Fs value of 1.09 for the cohesion of 450 kPa and φ = 40° (Supplementary Table S1).
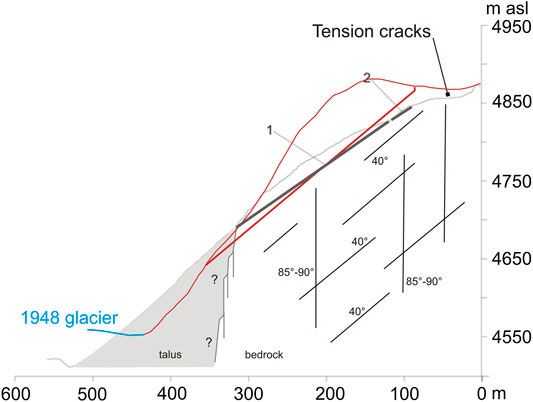
FIGURE 10. Engineering geological model derived from the recent morphology of a profile running across the SE scarp of the 2002 rock avalanche (profile C-2017 in Figure 3). Thick gray lines represent suggested sliding planes under recent topographic conditions, red lines represent the pre-2002 topography derived from the 1948 aerial photographs and the corresponding sliding plane following discontinuities in the rock massif.
The tension cracks documented 50 m above the scarp probably resulted from the stress relaxation caused by the 2002 rock avalanche failure or may represent deeper instability governed by creep along steep discontinuities.
Surface Movements Detected by InSAR After the 2002 Rock Avalanche
Analysis of the PSI ALOS-1PALSAR-1 data (2007–2011) describes surface movements 5–8 years after the event, showing clear deformations in the entire depletion zone of the 2002 rock avalanche with the highest mean annual velocities (up to 45 mm y−1) in its SE part (Figure 11). Movements of the slope above the SE scarp around the opened tension cracks were also detected, reaching an average annual velocity of approximately 12 mm (Figure 11). The later PSI analysis of the 2015–2017 Sentinel-1 data (13–15 years after the 2002 event) illustrates steady movement rates or deceleration with significantly high movement velocities, (e.g. 45 mm y−1) in the steeper, SE part of the depletion zone.
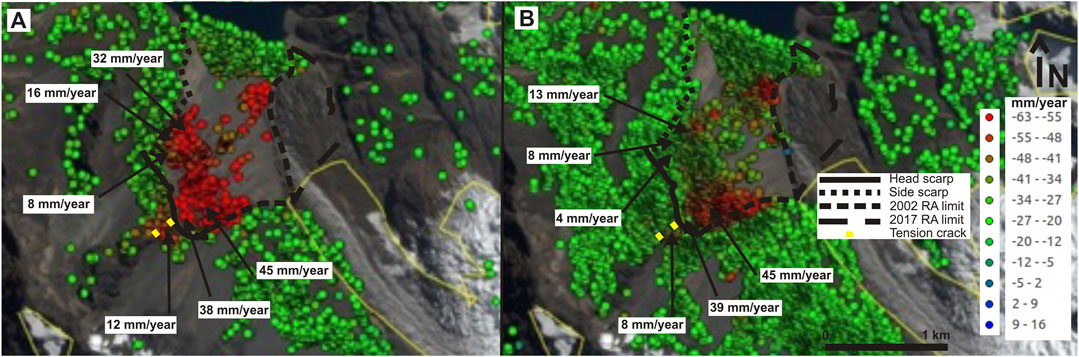
FIGURE 11. InSAR data from the 2002 rock avalanche area; A- ALOS-1 PALSAR-1 PSI from 2007 to 2011 (5 years); B- Sentinel-1 PSI from 2015 to 2017 (3 years). Annual mean velocities are described for selected PSI movement histories.
Surface movements between the landslide toe and the glacier tongue probably result from shallow, superficial sliding and erosion driven movements at the talus slope or are related to side moraine formation and development. The latter showed an average annual displacement of about 30 mm during the two observation periods, while the talus slope surface average annual velocities reached about half of these values.
The InSAR analysis detected only negligible movements of the fractured quartzite rock slope W of the rock avalanche (profile A-2017 in Figure 3A). During both observation periods, most of the points did not reach an average total displacement of 1 mm month−1; therefore, in many cases the observed movements were near the limit of the movement accuracy detection (cf. 3–4 mm y−1; Strozzi et al., 2018).
Discussion
The presented work gathered a variety of field data allowing us to describe the pre- and post-failure conditions and dynamics of the slope affected by the 2002 Safuna Alta rock avalanche. It is worth pointing out the social and cultural aspects of the performed work, which did not require any destructive environmental interventions and was performed in collaboration with local authorities and with respect to local land users, who have always been informed about our field visits and their purpose. This is an important aspect of research in complex social and natural environments subject to often conflicting interests of a number of actors, which is typical for the Cordillera Blanca (Carey et al., 2012; Muñoz et al., 2016) as well as other Peruvian mountain ranges (Klimeš et al., 2019).
Preparatory and Triggering Conditions of the Landslides at the Safuna Alta Lake
The available historical data allowed us to identify three landslides (two rockfalls that occurred before 1995 and between 1997–2000 and the 2002 rock avalanche) at the study area. However, due to the unknown exact dates of the rockfall events and missing site specific measurements, it is difficult to assess the factors responsible for their initiation. Therefore, we evaluated the available data to support various assumptions considering regional differences in climate patterns and the fact that it is often not possible to assign single triggering events to paraglacial rock failures, (e.g. McColl and Draebing, 2019 and references therein). We focused on the rockfall prior to 1995 and the 2002 avalanche.
An approximation of climatic conditions is given by the interpolated CRU data from which the precipitation shows a relationship with both landslide events. Annual precipitation values (Figure 12A) clearly show that 1993 and 1994 represented years with extreme precipitation and we may assume that the rockfall occurred during these two years. Both years were significantly wetter (211 and 167% respectively) than the long-term average of 1961–1990. The total as well as the December to April (cf. the top precipitation months) precipitations values was higher in 1993. Nevertheless, the two-year accumulation of precipitation (Figure 12B) suggests that the water content in the rock environment may have been higher during the 1994 rainy season. This observation agrees with the high frequency of precipitation related hazards, (e.g. debris flows, floods, landslides) recorded in the Ancash Department in the DesInventar database during the 1993–1994 rainy season (Vilímek et al., 2015). Also the visual interpretation of the Landsat images on the web viewer (USGS, 2021) identified fresh debris on the May 18, 1994 image, supporting our assumption that the rockfall occurred during the 1993–1994 rainy season.
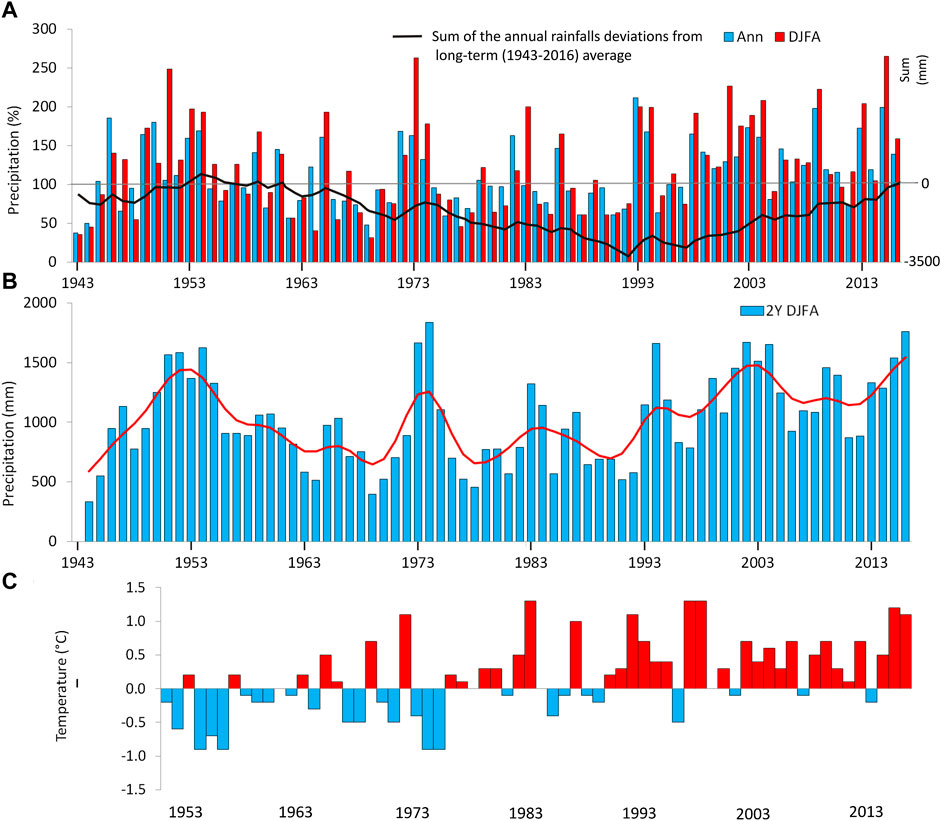
FIGURE 12. Analysis of precipitation and temperature data of the CRU 4.0.1. dataset (Harris et al., 2014) (A)–annual (Ann) and seasonal (DJFA–December, January, February, April) precipitations as an percentage of the long-term (1961–1990) average (B)–two year seasonal precipitation sums (2Y DJFA), red line–10 values Gaussian low-frequency filter (C)–annual average temperature deviations from the long term (1961–1990) average.
Less convincing and probably more complex is the relationship between precipitation and the 2002 rock avalanche. The annual rainfall values of 2001 and 2002 were not extreme, but the sum of these two years between December and April ranks among the highest (1,671 mm) during the observed period (Figure 12B) reaching 211% and 175% of the long-term average, respectively. A higher two-year rainfall value was only in 1974 (1,836 mm) while the values (1,565–1,667 mm) in 1951–1954, 1973, 1994 and 2004 were comparable. By comparing the sum of annual rainfall deviations from the long-term average (Figure 12A), we observe a long period with a decreasing trend in precipitation from 1957 to 1992 (−28 mm per decade, non-significant at the level of p = 0.05). Both slope failures occurred after a change in trend, during the years with increasing precipitation (+9.7 mm per decade, non-significant). Nevertheless, a statistically significant positive trend (+26 mm per decade) was observed for the entire period from 1943 to 2016 with contrasting seasonal trends. A small negative precipitation trend (−0.8 mm per decade) was observed for the austral winter (JJA), while a strong positive trend (+21 mm per decade) was identified for the austral summer (DJF). This precipitation development probably had only a minor positive affect on the Pucajirca glacier tongue, which advanced largely due to the insulation effect (and lasted until 2010, Figure 4D) of the rock avalanche accumulation as predicted by Hubbard et al. (2005).
Long term increase in temperature or extreme heat waves may affect the onset of slope instability in glaciated mountains (Huggel et al., 2013) especially when permafrost degradation is observed or expected (Carey et al., 2012). When evaluating the possible temperature effect on the triggering of the studied landslides, it is necessary to consider the particular temperature pattern of the tropical mountains with very low annual but very high diurnal temperature amplitudes (up to 40°C), which penetrate to shallow depths, (e.g. 5–15 cm; Yoshikawa et al., 2020). The CRU interpolated temperature values since 1990 (Figure 12C) show an increasing frequency of years with above average annual temperatures accompanied by a decreasing frequency of years with below average annual temperatures. They also indicate a statistically significant warming trend for all months and seasons with an annual temperature increase of 0.15°C per decade (1953–2016). The observed warming trend slowed down at the beginning of the 1990s, resembling the trend described by Schauwecker et al. (2014) who used re-analysis data from National Centers for Environmental Prediction and the National Center for Atmospheric Research and from the European Center for Medium-Range Weather Forecasts. The highest warming trend was identified for the colder austral winter months (JJA) and lowest for the austral summer (DJF) during the rainy season. Some works suggest that the warming may increase further especially at higher elevations during the coldest quarter of the year (JJA) by the end of the 21st century (Urrutia and Vuille, 2009), when we may also expect an elevation increase of the 0°C isotherm by 230–850 m, as predicted by various different climate scenarios (Schauwecker et al., 2017). Such a development may cause more events like rock avalanches from high glaciated and snow covered slopes, (e.g. 2010 rock-ice fall from 5,400 m asl on the Hualcán Mt; Schneider et al., 2014) where rising temperatures may enhance permafrost degradation and landslide occurrence, as observed in alpine environments around the world (Fischer et al., 2012; Huggel et al., 2012; Huggel et al., 2013). Nevertheless, many arguments suggest that the studied landslide between 4,350 and 4,800 m asl is not under permafrost conditions over the past decades. This might be related to the elevation of the 0°C isotherm, which was estimated to be between 4,900 and 5,000 m asl in the recent years (Haeberli et al., 2017; Schauwecker et al., 2017). Similarly, the global or continental-scale permafrost models assigned the study area to be on the fringes of the discontinuous presence of permafrost (Gruber, 2012; Saito et al., 2015). The recent climate also does not suggest convenient conditions for cryogenic rock fracturing, (e.g. ice volumetric expansion or segregation; Rode et al., 2016) as the highest water availability during the rainy season does not meet the lowest temperatures occurring during the dry austral winter months (cf. Yoshikawa et al., 2020). Moreover, cryogenic processes are usually only effective at shallow depths compared to the expected slip surfaces of the 2002 rock avalanche located between 50 m and 120 m. But another process was also described to exert the effects of surface temperatures on deep-seated rockslides in alpine environments. It has been shown that changes in the rock stress state and displacement at depths of tens of meters may result solely from the propagation of thermally induced near-surface thermos-elastic stresses assuming a 15°C annual temperature amplitude and deeply penetrating fractures (Gischig et al., 2011). However, the very low annual temperature amplitude at the study area probably rules out this temperature effect on the studied landslide. Therefore, it seems that temperature and its variations do not represent an important triggering factor for the 2002 rock avalanche or reactivation in the future.
On the other hand, we cannot entirely exclude favorable conditions for near-surface cryogenic rock fracturing during the recent past. This is due to the suggested significant upward shift of the 0°C isotherm over the last few decades (e.g. 30 m per decade between 1960 and 2010; Rabatel et al., 2013), the proximity of the Pucajirca glacier and cooler conditions toward the LIA, which may have allowed these processes within the elevation range of the studied slope.
A search of the USGS earthquake database revealed two events within the Peruvian territory (April 21 and 22, 2002) that occurred more than 500 km NW from the study site with Mw 5.9 and 4.5, respectively. Due to these characteristics, we doubt that they could have any effect on the stability of the studied slope. The PGA that affected the rock avalanche site during the May 2019 Loreto earthquake (0.035 g) had a very small effect on the slope stability, whose Fs value probably decreased in the order of 10–2, as suggested by the parametric calculations in Klimeš et al. (2016).
When considering the triggering of deep-seated rock failures like the discussed rock avalanche, it is important to note several reported cases of catastrophic collapses of deep-seated gravitational slope deformations, which could not be attributed to specific triggering events (Pánek and Klimeš, 2016). In such cases, the complex process of progressive failure and bedrock weakening (Terzaghi, 1962; Pánek and Klimeš, 2016) plays most likely crucial role in the degradation of slope stability below the threshold value leading to slope failure.
Glaciations and Slope Stability
We performed several slope stability calculations considering the stabilizing effect of the glacier during different glaciation stages on slope profiles with different geometrical relationships between topography (recent as well as historical) and pre-existing discontinuities. The results suggest that the stabilizing effect of glaciers is governed by the morpho-structural properties of the slope and may vary considerably across short distances. The Fs values of the A-2017 profile (Figure 3A) increased by up to 23% due to the stabilizing effect of the 1948 glacier (Figure 6), which on the other hand, had no positive effect on the slope stability of the pre-2002 rock avalanche slope (profile 1948 in Figure 3A; Figure 9) located just 150 m to the E. This is because the suggested slip surfaces in the latter case daylight above the 1948 glacier surface, which therefore had no effect on the stability. This confirms the findings of Holm et al. (2004) about complex post-LIA landslide occurrence patterns being dependent on structural and lithological constraints described on a regional scale.
The Pucajirca glacier remained roughly in the 1948 position at least until 1970 (Figure 1) and retreated to its almost recent position by 1995. Unfortunately, no further information is available to specify its retreat during this period. However, the two documented rock falls (before 1995 and between 1997 and 2000) may be related to changes in the slope stability due to the glacier retreat (resulting into the decrease of the Fs value by 11%–23%, Figure 7). Synchronous slope response to glacier downwasting manifested by annual landslide movements of several tens of centimeters per year has been documented by Glueer et al. (2020) at the Moosfluh rock slide in Switzerland. Although no measurements of possible slope movements related to the glacier retreat at the Safuna Alta landslide are available, we do not expect a similarly close slope response as in the case of the Moosfluh rock slide. This is because the slope stability at the Moosfluh rock slide is governed by continuous slip surfaces enabling toppling to be the major failure mechanism, while at the Safuna Alta area we expect the non-continuous slip surfaces to increase the resisting forces of the rock slope postponing the slope response to glacier retreat.
The performed limit equilibrium slope stability calculations do not provide information about the deterioration of the strength properties of the involved rocks and discontinuities, (e.g. coalescence of rock bridges). Nevertheless, the available observations of the environmental conditions indicate a repeated occurrence of events, which are known to deteriorate the rock slope strength bringing the slope stability closer to failure. These are repeated thermo-hydro-mechanical cycles (Glueer et al., 2020) caused by periods with extreme precipitation, (e.g. above average two-year sums in 1951–1954, 1973–1974, 1994) and earthquake occurrences. For example, the 1970 earthquake affected the study area by higher horizontal seismic acceleration (kh ≈ 0.15) than the one considered in our slope stability calculations (kh = 0.1), which proved its capability to reduce the slope stability (cf. Lacroix et al., 2015). Despite the higher shaking intensity and thousands of landslides triggered in the surroundings of the Safuna Lakes (Plafker et al., 1971), the 1970 earthquake did not trigger any landslides at the study site. Nevertheless, there is clear evidence that the earthquake significantly affected the Safuna Alta Lake dam permeability (Llibourty et al., 1977b) and, therefore, we suggest it may have also deteriorated the rock strength of the surrounding slopes. This could contribute to the triggering of the 2002 rock avalanche 32 years later by precipitation. The importance of the progressive deterioration of the rock slope strength for the stability of the studied area is further illustrated by the fact that the LIA maximum glacier height during the 17th and 19th centuries had only a minor positive stabilizing effect on the slope (Figure 9). Therefore the slope was for centuries exposed to the stability deteriorating paraglacial conditions, which likely occurred during the majority of this time period.
The 2002 Rock Avalanche Failure and Post-failure Movement Dynamics
After evaluating the slope stability calculations and the pre- and post-2002 failure topographies, we suggest that the 2002 rock avalanche initiated in its NW part, formed by a steep and least stable rock wall (Figure 9). The stability calculations for this profile (profile 1948 in Figure 3A) in all scenarios obtained lower Fs values than the other two profiles representing the pre-failure slope conditions (profiles A-2017, C-2017 in Figure 3A). Its failure resulted in stress redistribution within the slope and failure of the more stable SE part (profile C-2017 in Figure 3A) of the rock avalanche. The post-event InSAR analysis revealed clear surface movements interpreted as re-adjustment of the loosened rock avalanche material below the main scarp in the NW. In accordance with the Fs calculations suggesting its relatively high stability, it showed no further movement during the later observation period. On the other hand, the higher movement velocities, which persisted longer in the SE part, may be attributed to shallow sliding caused by higher slope inclination and high sensitivity to water saturation. The surface movements may be related not only to the strong seasonal changes in water content but possibly also to frost action. Unfortunately, the available InSAR data do not provide clear support for this assumption due to either sparse image acquisitions (ALOS-1 PALSAR-1 from 2007–2011) or strong tropospheric seasonal signals (Dong et al., 2019), which biased the results of the Sentinel-1 data analyses performed in 2017. An updated PSI analysis with longer records of satellite images and the recent improvements in data analysis (Dong et al., 2019) may improve the quality of the results.
Future Landslide Hazard Assumptions
The stability of the slopes around the Safuna Alta Lake is very important as possible future slope failure may cause a displacement wave in the lake that has the potential to trigger a lake outburst flood. Due to the characteristics of the dam, (e.g. a large freeboard of 80 m, an artificial outlet tunnel), a major landslide impact, at least comparable with the 2002 rock avalanche, is the only process that has the potential to generate a wave large enough to overtop or critically affect the moraine dam. Such an outburst event, in turn, could pose a major risk of damage to the infrastructure located downstream, which includes the Quitarcsa hydropower plant, several villages, and the major Cañon del Pato hydropower plant (250 MW power output) located on the Santa River. As the potential landslide is the trigger of a processes chain that eventually could result in a LOF, this assessment of the landslide hazard is an integral part of the LOF susceptibility of the Safuna Alta Lake. To do so, we updated the susceptibility assessment of the pre-2002 event susceptibility conditions for the lake, presented in Emmer and Vilímek (2014).
The slope stability calculations show that the least stable element is the shallow slip plane suggested for the SE part of the rock avalanche (C-2017 profile in Figure 3A). Its stability drops to very low values when fully saturated with water (Table 3), therefore we suggest that it has high relative probability of being reactivated, in particular during the rainy season (DJF) of the austral summer. At the same time, the mean annual velocities measured along the satellite line-of-sight of the surface deformations during the entire observation period exceeded 30 mm y−1, which was classified as medium intensity class. However, we suggest that its possible failure would most likely mobilize only a relatively small amount of material, which would need to move more than 400 m along the narrow glacier valley before entering the lake. Nevertheless, the opened tension cracks 50 m above the 2002 rock avalanche scarp with identified ongoing superficial movements (Figure 11) suggest that mobilization of considerably larger landslide volumes cannot be completely ruled out. Thus we recommend periodical controls or ongoing monitoring of the potential expansion of the tension cracks, (e.g. using the InSAR analysis).
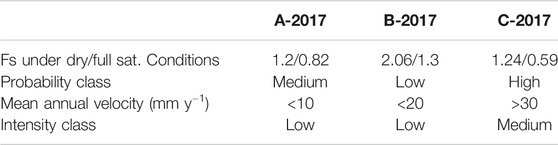
TABLE 3. Definition of the landslide probability and intensity classes for selected topographic profiles (see Figure 3) used for the Safuna Alta landslide hazard assessment (following the approach in Raetzo et al., 2002 under recent conditions; sat. - saturation).
The slope below the major scarp of the 2002 rock avalanche (B-2017 profile in Figure 3A) most likely represents a low hazard since the calculated Fs values are above the threshold even for fully saturated material and the mean annual velocities are close, but still mostly below the threshold of the low/medium intensity class (20 mm y−1, Table 3).
The stability of the rock slope directly above the lake (A-2017 profile in Figure 3A) drops below the threshold under fully saturated conditions, but the drop in the Fs is not as dramatic as in the case of the SE part of the landslide (C-2017 profile in Figure 3A). Therefore, we suggest it is less likely to produce a future failure and we assigned it with medium probability class. Nevertheless, on a long-term time scale, its failure should be expected especially considering future climate scenarios suggesting warming and, therefore, melting of the snow and ice cover higher on the slope above the rock avalanche scarp. This possible additional water input may either contribute to deterioration of the rock quality or saturate the slope, shifting its stability closer to the threshold value. Since failure of this slope could mobilize large rock volumes triggering considerable impact waves, we recommend to monitor this site with technologies allowing the detection of incipient rock slope movements, (e.g. InSAR). In addition, periodical re-evaluation of the conditions possibly affecting the slope stability (e.g. partial rock slides/falls at the slope toe, changes in hydrological conditions, e.g. Klimeš et al., 2016) would significantly contribute to future landslide hazard mitigation.
A limitation of the performed landslide hazard assessment is the uncertainty about the presence/absence and the state of the permafrost within the studied slope or higher above the rock avalanche scarp. Based on the available information, the presence of permafrost within the 2002 rock avalanche area is not probable (see chapter 5.1). On the other hand, it likely occurs higher up on the slope, near the ridge tops (exceeding 5,000 m asl), where historical information (see chapter 4.2) has confirmed the initiation of small rockslides above the 2002 rock avalanche site. Possible permafrost degradation in this region in the near future may result in more voluminous landslides with a high potential to rapidly enter the lake and trigger hazardous impact waves. Field monitoring of air, soil or rock temperatures, (e.g. Yoshikawa et al., 2020) is desirable to fill-in this knowledge gap. Any drilling works related with the monitoring should be carefully explained and discussed with local inhabitants to respect their cultural and religious attitudes toward the glaciated mountains and to avoid possible conflicts.
The studied landslide represents the possible first step in process chain of LOF initiation. We used an approach specifically designed for the Cordillera Blanca by Emmer and Vilímek (2014) to assess susceptibility of the Safuna Alta Lake to produce a LOF. It combines decision tree and calculations using seventeen characteristics derived from remotely sensed data and topographic maps to describe the potential for LOF initiation through five scenarios. We considered the susceptibility for a LOF as a result of dam overtopping or breach due to a large displacement wave, triggered by a major mass movement into the lake. Our recent calculations, reflect the actual site conditions, suggest subtle increase of the susceptibility to dam overtopping (from 0.589 (Emmer and Vilímek, 2014) to 0.672 (this study)) due to an increased maximum slope of the moraine slope facing the lake. The slope was steepened by the 2002 impact wave erosion (Hubbard et al., 2005). Increase was detected also for the susceptibility value for the dam breach (from 0.261 (Emmer and Vilímek, 2014) to 0.320 (this study)) caused by larger lake volume used for the update calculations. The pre-2002 event lake volume was derived from empirical formula based on lake surface area, while we used results of the 2017 bathymetric measurements. Both of these susceptibility values are still well below the suggested thresholds, (e.g. 0.9 for dam overtopping and 0.5 for dam breach, Emmer and Vilímek, 2014) to assign the lake as susceptible to produce LOFs. These susceptibility assessment results are challenged by the 2002 LOF event. We agree with the explanation in Emmer and Vilímek (2014) that a rock avalanche is an exceptional event, which is very difficult to predict within the scope of generally applicable and reproducible method they formulated. Although the updated assessment still suggests that the Safuna Alta Lakes is not susceptible to produce a LOF, the increased values of the susceptibility indexes provide strong argument to continue watching for evidences of possible worsening of the moraine and the lake conditions, (e.g. internal dam erosion–piping, lake volume changes).
Conclusion
The study presents the results of rock slope stability calculations combining recent field and topographic data with a reliable historical digital elevation model and morphologically constrained glaciation history since the Last Glacial Maximum. These data were combined with the available historical information about landslide occurrences and recently ascertained InSAR surface movement histories to describe the initiation conditions, dynamics and recent stability of the slope affected by the 2002 Safuna Alta rock avalanche. The results suggest that the slope stability is controlled by pre-existing discontinuities (cf. regional and local lithological and tectonic development) forming non-continuous sliding surfaces and topography resulting from repeated glaciations. The importance of the glacier support for the slope stability depends on the considered time scales. On a millennial time scale, the presence of the glacier is decisive for the slope stability, demonstrated by the very high factor of safety (above 1.95) of the pre-2002 rock avalanche slope during the LGM. Nevertheless, when considering decadal or centennial time scales, the effects of external factors, (e.g. repeated thermo-hydro-mechanical cycles by extreme precipitation or earthquake shaking) override the importance of glaciation.
A combination of standard geological, (e.g. preparation of engineering geological slope models), morphological, (e.g. DEM construction) and engineering, (e.g. slope stability calculations using limit equilibrium methods) methods with remotely acquired InSAR surface movement information, has allowed the complex and reliable description of the slope stability and dynamics. This in turn may be used for reliable site specific hazard assessment, applicable not only for scientific purposes but also for practical solutions to the safety of the site, which is the primary interest of the local as well as national governments. For this purpose, combination of remotely sensed monitoring method with sufficient frequency of revisiting, (e.g. InSAR) with periodical field re-evaluation of the conditions lowering the slope or moraine dam stability, (e.g. partial rock slides/falls at the slope toe, changes in hydrological conditions, permafrost degradation) are recommended as basic requirements for reliable and up to date landslide hazard mitigation.
Data Availability Statement
The raw data supporting the conclusion of this article will be made available by the authors, without undue reservation.
Author Contributions
JK—field works, article concept, writting; JN—field work, rock mass characterization, slope stability modeling; ACR—field work, glaciology; JB—2017 DEM preparation, field work; PZ—climatic data analysis; TZ—InSAR analysis and interpretation; HS—seismology; HF—writting, data collection; MR—petrology; PŠ, JM—climatic data analysis; JJ—historical DEM preparation.
Funding
JK participation on this research was supported by the long-term conceptual development research organization (RVO: 67985891) project. The co-authors PZ, PŠ, and JM were supported by the Ministry of Education, Youth and Sports of the Czech Republic for SustES–Adaptation strategies for sustainable ecosystem services and food security under adverse environmental conditions project, ref. CZ.02.1.01/0.0/0.0/16_019/0000797. HF, TS, and JK acknowledge funding by the European Space Agency (ESA), in the framework of the Alcantara No. 5 pilot study «InSAR for landslide hazard assessment in Peru» (Contract-No. 4000117655/16/F/MOS). JN was supported by the Strategic Research Plan of the Czech Geological Survey (DRKVO/ČGS 2018-2022, topic 5).
Conflict of Interest
The authors declare that the research was conducted in the absence of any commercial or financial relationships that could be construed as a potential conflict of interest.
Supplementary Material
The Supplementary Material for this article can be found online at: https://www.frontiersin.org/articles/10.3389/feart.2021.607277/full#supplementary-material.
References
Allen, S. K., Rastner, P., Arora, M., Huggel, C., and Stoffel, M. (2015). Lake outburst and debris flow disaster at Kedarnath, June 2013: hydrometeorological triggering and topographic predisposition. Landslides 13, 1479–1491. doi:10.1007/s10346-015-0584-3
Audéou, S. (2017). High mountain hazards in Cordillera Blanca, Peru: investigations at Safuna lakes. University Savoie – Mont Blanc, Chambérs. [dissertation].
Barton, N. (1973). Review of a new shear-strength criterion for rock joints. Eng. Geology 7, 287–332. doi:10.1016/0013-7952(73)90013-6
Bishop, A. W. (1955). The use of the slip circle in the stability analysis of slopes. Géotechnique 5, 7–17. doi:10.1680/geot.1955.5.1.7
Bueechi, E., Klimeš, J., Frey, H., Huggel, C., Strozzi, T., and Cochachin, A. (2019). Regional-scale landslide susceptibility modelling in the Cordillera Blanca, Peru-a comparison of different approaches. Landslides 16, 395–407. doi:10.1007/s10346-018-1090-1
Burns, P., and Nolin, A. (2014). Using atmospherically-corrected Landsat imagery to measure glacier area change in the Cordillera Blanca, Peru from 1987 to 2010. Remote Sensing Environ. 140, 165–178. doi:10.1016/j.rse.2013.08.026
Bury, J. T., Mark, B. G., McKenzie, J. M., French, A., Baraer, M., Huh, K. I., et al. (2011). Glacier recession and human vulnerability in the Yanamarey watershed of the Cordillera Blanca, Peru. Climatic Change 105, 179–206. doi:10.1007/s10584-010-9870-1
Byers, A. C., Rounce, D. R., Shugar, D. H., Lala, J. M., Byers, E. A., and Regmi, D. (2019). A rockfall-induced glacial lake outburst flood, Upper Barun Valley, Nepal. Landslides 16, 533–549. doi:10.1007/s10346-018-1079-9
Carey, M., Huggel, C., Bury, J., Portocarrero, C., and Haeberli, W. (2012). An integrated socio-environmental framework for glacier hazard management and climate change adaptation: lessons from Lake 513, Cordillera Blanca, Peru. Climatic Change 112, 733–767. doi:10.1007/s10584-011-0249-8
Coe, J. A., Bessette-Kirton, E. K., and Geertsema, M. (2017). Increasing rock-avalanche size and mobility in glacier bay national park and preserve, Alaska detected from 1984 to 2016 Landsat imagery. Landslides 15, 393–407. doi:10.1007/s10346-017-0879-7
Deline, P., Gruber, S., Delaloye, R., Fischer, L., Geertsema, M., Giardino, M., et al. (2015). “Ice loss and slope stability in high-mountain regions,” in Snow and ice-related hazards, risks, and disasters. Editors J. Shroder, W. hHeberli, and C. Whiteman (Amsterdam): Elsevier), 521–561.
Deverchère, J., Dorbath, C., and Dorbath, L. (1989). Extension related to a high topography: results from a microearthquake survey in the Andes of Peru and tectonic implications. Geophys. J. Int. 98, 281–292. doi:10.1111/j.1365-246x.1989.tb03352.x
Dong, J., Zhang, L., Liao, M., and Gong, J. (2019). Improved correction of seasonal tropospheric delay in InSAR observations for landslide deformation monitoring. Remote Sensing Environ. 233, 111370. doi:10.1016/j.rse.2019.111370
Dussaillant, I., Berthier, E., Brun, F., Masiokas, M., Hugonnet, R., Favier, V., et al. (2019). Two decades of glacier mass loss along the Andes. Natur Geosci. doi:10.1038/s41561-019-0432-5
Emmer, A., Klimeš, J., Hölbling, D., Abad, L., Draebing, D., Skalák, P., et al. (2020). Distinct types of landslides in moraines associated with the post-LIA glacier thinning: observations from the Kinzl Glacier, Huascarán, Peru. Sci. Total Environ. 739, 139997. doi:10.1016/j.scitotenv.2020.139997
Emmer, A. (2017). Geomorphologically effective floods from moraine-dammed lakes in the Cordillera Blanca, Peru. Quat. Sci. Rev. 177, 220–234. doi:10.1016/j.quascirev.2017.10.028
Emmer, A., Klimeš, J., Mergili, M., Vilímek, V., and Cochachin, A. (2016). 882 lakes of the Cordillera Blanca: an inventory, classification, evolution and assessment of susceptibility to outburst floods. Catena 147, 269–279. doi:10.1016/j.catena.2016.07.032
Emmer, A., Vilímek, V., Klimeš, J., and Cochachin, A. (2014). “Glacier retreat, lakes develoment and associated natural hazards in Cordillera Blanca, Peru,” in Landslides in cold regions in the context of climate change, environmental science and engineering. Editor W. Shanet al. (Springer), 231–252. doi:10.1007/978-3-319-00867-7_17
Emmer, A., and Vilímek, V. (2014). New method for assessing the susceptibility of glacial lakes to outburst floods in the Cordillera Blanca, Peru. Hydrol. Earth Syst. Sci. 18, 3461–3479. doi:10.5194/hess-18-3461-2014
Evans, S. G., Bishop, N. F., Fidel Smoll, L., Valderrama Murillo, P., Delaney, K. B., and Oliver-Smith, A. (2009). A re-examination of the mechanism and human impact of catastrophic mass flows originating on Nevado Huascarán, Cordillera Blanca, Peru in 1962 and 1970. Eng. Geology 108, 96–118. doi:10.1016/j.enggeo.2009.06.020
Fischer, L., Purves, R. S., Huggel, C., Noetzli, J., and Haeberli, W. (2012). On the influence of topographic, geological and cryospheric factors on rock avalanches and rockfalls in high-mountain areas. Nat. Hazards Earth Syst. Sci. 12, 241–254. doi:10.5194/nhess-12-241-2012
Frey, H., Huggel, C., Chisolm, R. E., Baer, P., McArdell, B., Cochachin, A., et al. (2018). Multi-source glacial lake outburst flood hazard assessment and mapping for huaraz, Cordillera Blanca, Peru. Front. Earth Sci. 6, 210. doi:10.3389/feart.2018.00210
Frey, H., Huggel, C., Cochachin, A., Strozzi, T., and Caduff, R. (2017). Integrating EO information for cascading landslide and flood hazard monitoring and early warning, Cordillera Blanca, Peru. Final Rep., 26.
Georges, C. (2004). 20th-Century glacier fluctuations in the tropical Cordillera Blanca, perú. Arctic, Antarctic, Alpine Res. 36, 100–107. doi:10.1657/1523-0430(2004)036[0100:tgfitt]2.0.co;2
Gischig, V., Preisig, G., and Eberhardt, E. (2016). Numerical investigation of seismically induced rock mass fatigue as a mechanism contributing to the progressive failure of deep-seated landslides. Rock Mech. Rock Eng. 49, 2457–2478. doi:10.1007/s00603-015-0821-z
Gischig, V. S., Moore, J. R., Evans, K. F., Amann, F., and Loew, S. (2011). Thermomechanical forcing of deep rock slope deformation: 1. Conceptual study of a simplified slope. J. Geophys Res. 116, F04010. doi:10.1029/2011JF002006
Glueer, F., Loew, S., and Manconi, A. (2020). Paraglacial history and structure of the Moosfluh landslide (1850-2016), Switzerland. Geomorphology 355, 106677. doi:10.1016/j.geomorph.2019.02.021
Grämiger, L. M., Moore, J. R., Gischig, V. S., Ivy-Ochs, S., and Loew, S. (2017). Beyond debuttressing: mechanics of paraglacial rock slope damage during repeat glacial cycles. J. Geophys. Res. Earth Surf. 122, 1004–1036. doi:10.1002/2016jf003967
Gruber, S. (2012). Derivation and analysis of a high-resolution estimate of global permafrost zonation. The Cryosphere 6, 221–233. doi:10.5194/tc-6-221-2012
Haeberli, W., Schaub, Y., and Huggel, C. (2017). Increasing risks related to landslides from degrading permafrost into new lakes in de-glaciating mountain ranges. Geomorphology 293, 405–417. doi:10.1016/j.geomorph.2016.02.009
Haeberli, W., Buetler, M., Huggel, C., Friedli, T. L., Schaub, Y., and Schleiss, A. J. (2016). New lakes in deglaciating high-mountain regions—opportunities and risks. Climatic Change 139, 201. doi:10.1007/s10584-016-1771-5
Harris, I., Jones, P. D., Osborn, T. J., and Lister, D. H. (2014). Updated high-resolution grids of monthly climatic observations—the CRU TS3.10 Dataset. Int. J. Climatol. 34, 623–642. doi:10.1002/joc.3711
Hofflinger, A., Somos-Valenzuela, M. A., and Vallejos-Romero, A. (2019). Response time to flood events using a social vulnerability index (ReTSVI). Nat. Hazards Earth Syst. Sci. 19, 251–267. doi:10.5194/nhess-19-251-2019
Holm, K., Bovis, M., and Jakob, M. (2004). The landslide response of alpine basins to post-Little Ice Age glacial thinning and retreat in southwestern British Columbia. Geomorphology 57, 201–216. doi:10.1016/s0169-555x(03)00103-x
Hubbard, B., Heald, A., Reynolds, J. M., Quincey, D., Richardson, S. D., Luyo, M. Z., et al. (2005). Impact of a rock avalanche on a moraine-dammed proglacial lake: laguna Safuna Alta, Cordillera Blanca, Peru. Earth Surf. Process. Landforms 30, 1251–1264. doi:10.1002/esp.1198
Hugenholtz, C. H., Moorman, B. J., Barlow, J., and Wainstein, P. A. (2008). Large-scale moraine deformation at the athabasca glacier, jasper national park, alberta, Canada. Landslides 5, 251–260. doi:10.1007/s10346-008-0116-5
Huggel, C., Salzmann, N, and Simon, A. (2013). “High-mountain slope failures and recent and future warm extreme events”, in: eds. B. McGuire and M. A. Maslin, Climate forcing of geological hazards, (ChichesterWiley-Blackwell), 192–222.
Huggel, C., Clague, J. J., and Korup, O. (2012). Is climate change responsible for changing landslide activity in high mountains?. Earth Surf. Process. Landforms 37, 77–91. doi:10.1002/esp.2223
Huggel, C., Zgraggen-Oswald, S., Haeberli, W., Kääb, A., Polkvoj, A., Galushkin, I., et al. (2005). The 2002 rock/ice avalanche at Kolka/Karmadon, Russian Caucasus: assessment of extraordinary avalanche formation and mobility, and application of QuickBird satellite imagery. Nat. Hazards Earth Syst. Sci. 5, 173–187. doi:10.5194/nhess-5-173-2005
Idris, I. M. (1985). “Earthquake ground motions,” in EERI Course on Strong ground motion—seismic analysis, Design and code issues (Pasadena, California. April 10th 1987.
Iribarren Anacona, P., Mackintosh, A., and Norton, K. P. (2015). Hazardous processes and events from glacier and permafrost areas: lessons from the Chilean and Argentinean Andes. Earth Surf. Process. Landforms 40, 2–21. doi:10.1002/esp.3524
Iturrizaga, L. (2014). Glacial and glacially conditioned lake types in the Cordillera Blanca, Peru. Prog. Phys. Geogr. Earth Environ. 38, 602–636. doi:10.1177/0309133314546344
Jibson, R. W. (2012). “Models of triggering of landslides during earthquakes”, in: eds. J. J. Clague, and D. Stead, (Cambridge University Press, Cambridge), 196–206.
Jibson, R. W., Harp, E. L., Schulz, W., and Keefer, D. K. (2004). Landslides triggered by the 2002 denali fault, Alaska, earthquake and the inferred nature of the strong shaking. Earthquake Spectra 20, 669–691. doi:10.1193/1.1778173
Juřicová, A., and Fratianni, S. (2018). Climate change and its relation to the fluctuation in glacier mass balance in the Cordillera Blanca, Peru: a review. AUC Geograp 53, 106–118. doi:10.14712/23361980.2018.10
Kampher, T. S. (2009). Landslides triggered by the 1946 Ancash Earthquake (Peru) and geologic controls on the mechanisms of initial rock slope failure. University of Waterloo, Ontario. [dissertation].
Kasser, G., Juen, I., Georges, C., Gómez, J., and Tamayo, W. (2003). The impact of glaciers on the runoff and the reconstruction of mass balance history from hydrological data in the tropical Cordillera Blanca, Peru. J. Hydrol. 282, 130–144. doi:10.1016/s0022-1694(03)00259-2
Kasser, G. (1999). A review of the modern fluctuations of tropical glaciers. Glob. Planet. Chan 22, 93–103. doi:10.1016/s0921-8181(99)00028-4
Kasser, G., Ames, A., and Zamora, M. (1990). Glacier fluctuations and climate in the Cordillera Blanca, Peru. Ann. Glac 14, 136–140. doi:10.3189/s0260305500008430
Klimeš, J., Rosario, A. M., Vargas, R., Raška, P., Vicuňa, L., and Jurt, C. (2019). Community participation in landslide risk reduction: a case history from Central Andes, Peru. Landslides 16, 1763–1777. doi:10.1007/s10346-019-01203-w
Klimeš, J., Novotný, J., Novotná, I., Jordán de Urries, B., Vilímek, V., Emmer, A., et al. (2016). Landslides in moraines as triggers of glacial lake outburst floods: example of the Palcacocha Lake (Cordillera Blanca, Peru). Landslides 13, 1461–1477. doi:10.1007/s10346-016-0724-4
Klimeš, J., Benešová, M., Vilímek, V., Bouška, P., and Rapre, A. C. (2014). The reconstruction of a glacial lake outburst flood using HEC-RAS and its significance for future hazard assessments: an example from Lake 513 in the Cordillera Blanca, Peru. Nat. Haz 71, 1617–1638. doi:10.1007/s11069-013-0968-4
Klimeš, J., and Vilímek, V. (2011). A catastrophic landslide near Rampac Grande in the Cordillera Negra, northern Peru. Landslides 8, 309–320. doi:10.1007/s10346-010-0249-1
Kos, A., Amann, F., Strozzi, T., Delaloye, R., von Ruette, J., and Springman, S. (2016). Contemporary glacier retreat triggers a rapid landslide response, Great Aletsch Glacier, Switzerland. Geophys. Res. Lett. 43, 466. doi:10.1002/2016GL071708
Lacroix, P., Berthier, E., and Maquerhua, E. T. (2015). Earthquake-driven acceleration of slow-moving landslides in the Colca valley, Peru, detected from Pléiades images. Remote Sensing Environ. 165, 148–158. doi:10.1016/j.rse.2015.05.010
Llibourty, L., Morales, A. B., Pautre, A., and Schneider, B. (1977a). Glaciological problems set by the control of dangerous lakes in Cordillera Blanca, Peru. I. Historical failures of morainic dams, Their causes and prevention. J. Glacio 18, 239–254. doi:10.3189/S002214300002133X
Llibourty, L., Morales, A. B., Pautre, A., and Schneider, B. (1977b). Glaciological problems set by the control of dangerous lakes in Cordillera Blanca, Peru. I. Historical failures of morainic dams, their causes and prevention. J. Glacio 18, 275–290. doi:10.3189/S002214300002133X
Margirier, A., Audin, L., Robert, X., Herman, F., Ganne, J., and Schwartz, S. (2016). Time and mode of exhumation of the Cordillera Blanca batholith (Peruvian Andes). J. Geophys. Res. Solid Earth 121, 6235–6249. doi:10.1002/2016jb013055
Marinos, P., and Hoek, E. (2000). “GSI: a geologically friendly tool for rock mass strength estimation,” in Proceedings of the GeoEng2000 at the international conference on geotechnical and geological engineering (Lancaster: Technomic Publishers).
McColl, S. T., and Draebing, D. (2019). “Rock slope instability in the proglacial zone: state of the art”, in: eds. T. Heckmann, and D. Morche (Springer, Cham)
McColl, S. T. (2012). Paraglacial rock-slope stability. Geomorphology 153-154, 1–16. doi:10.1016/j.geomorph.2012.02.015
Megili, M., Pudasaini, S. P., Emmer, A., Fischer, J.-T., Cochacin, A., and Frey, H. (2020). Reconstruction of the 1941 GLOF process chain at lake palcacocha (Cordillera Blanca, Peru). Hydrol. Earth Syst. Sci. 24, 93–114. doi:10.5194/hess-24-93-2020
Mergili, M., Emmer, A., Juřicová, A., Cochachin, A., Fischer, J. T., Huggel, C., et al. (2018). How well can we simulate complex hydro-geomorphic process chains? The 2012 multi-lake outburst flood in the Santa Cruz Valley (Cordillera Blanca, Perú). Earth Surf. Process Landf 43, 1373–1389. doi:10.1002/esp.4318
Miranda, E. (2019). Lagunas perú may 26, 2019 earthquake virtual assessment structural team (VAST) report. doi:10.17603/ds2-cbff-4878
Muñoz, A. R., Gonzales, C., Price, K., Rosario, A., Huggel, C., Frey, H., et al. (2016). “Managing glacier related risks disaster in the Chucchún catchment, Cordillera Blanca, Peru,” in Climate change adaptation strategies—an upstream-downstream perspective. Editors N. Salzmann, C. Huggel, S. Nussbaumer, and G. Ziervogel (Cham: Springer), 59–78. doi:10.1007/978-3-319-40773-9_4
Novotný, J., and Klimeš, J. (2014). Grain size distribution of soils within the Cordillera Blanca, Peru: an indicator of basic mechanical properties for slope stability evaluation. J. Mt. Sci. 11, 563–577. doi:10.1007/s11629-013-2836-9
Pánek, T., and Klimeš, J. (2016). Temporal behavior of deep-seated gravitational slope deformations: a review. Earth-Science Rev. 156, 14–38. doi:10.1016/j.earscirev.2016.02.007
Parry, S., Baynes, F., and Novotný, J. (2018). “Conceptual engineering geological models,” in IAEG/AEG annual meeting proceedings. Editors A. Shakoor, and K. Kato (San Francisco, CaliforniaSan Francisco: Springer). doi:10.1007/978-3-319-93142-5
Plafker, G., Ericksen, G. E., and Concha, J. F. (1971). Geological aspects of the May 31, 1970, Peru´ earthquake. Bull. Seismol Soc. Am. 61, 543–578.
Rabatel, A., Francou, B., Soruco, A., Gomez, J., Cáceres, B., Ceballos, J. L., et al. (2013). Current state of glaciers in the tropical Andes: a multi-century perspective on glacier evolution and climate change. The Cryosphere 7, 81–102. doi:10.5194/tc-7-81-2013
Raetzo, H., Lateltin, O., Bollinger, D., and Tripet, J. P. (2002). Hazard assessment in Switzerland—codes of practice for mass movements. Bull. Eng. Geol. Environ. 61, 263–268. doi:10.1007/s10064-002-0163-4
Rode, M., Schnepfleitner, H., and Sass, O. (2016). Simulation of moisture content in alpine rockwalls during freeze-thaw events. Earth Surf. Process. Landforms 41, 1937–1950. doi:10.1002/esp.3961
Saito, K., Trombotto Liaudat, D., Yoshikawa, K., Mori, J., Sone, T., Marchenko, S., et al. (2015). Late Quaternary permafrost distributions downscaled for South America: examinations of GCM-based maps with observations. Permafrost Periglac. Process 27, 43–55. doi:10.1002/ppp.1863
Sarma, S. K. (1975). Seismic stability of earth dams and embankments. Géotechnique 25, 743–761. doi:10.1680/geot.1975.25.4.743
Schuster, R.L., and Krizek, R.J. (1978). Landslides—Analysis and Control. Transportation Research Board, Special Report 176, Washington D.C.
Schaub, Y., Haeberli, W., Huggel, C., Künzler, M., and Bründl, M. (2013). “Landslides and new lakes in deglaciating areas: a risk management framework,” in Landslide science and practice. Editors C. Margottini, P. Canuti, and K. Sassa (Berlin HeidelbergSpringer), 7. doi:10.1007/978-3-642-31313-4_5
Schauwecker, S., Rohrer, M., Huggel, C., Endries, J., Montoya, N., Neukom, R., et al. (2017). The freezing level in the tropical Andes, Peru: an indicator for present and future glacier extents. J. Geophys. Res. Atmos. 122, 5172. doi:10.1002/2016JD025943
Schauwecker, S., Rohrer, M., Acuña, D., Cochachin, A., Dávila, L., Frey, H., et al. (2014). Climate trends and glacier retreat in the Cordillera Blanca, Peru, revisited. Glob. Planet. Change 119, 85–97. doi:10.1016/j.gloplacha.2014.05.005
Schneider, D., Huggel, C., Cochachin, A., Guillén, S., and García, J. (2014). Mapping hazards from glacier lake outburst floods based on modelling of process cascades at Lake 513, Carhuaz, Peru. Adv. Geosci. 35, 145–155. doi:10.5194/adgeo-35-145-2014
Simeoni, L., Ronchetti, F., Costa, C., Joris, P., and Corsini, A. (2020). Redundancy and coherence of multi-method displacement monitoring data as key issues for the analysis of extremely slow landslides (Isarco valley, Eastern Alps, Italy). Eng. Geology. 267, 105504. doi:10.1016/j.enggeo.2020.105504
Strozzi, T., Klimeš, J., Frey, H., Caduff, R., Huggel, C., Wegmüller, U., et al. (2018). Satellite SAR interferometry for the improved assessment of the state of activity of landslides: a case study from the Cordilleras of Peru. Remote Sensing Environ. 217, 111–125. doi:10.1016/j.rse.2018.08.014
Štěpánek, P., Zahradníček, P., and Huth, R. (2011). Interpolation techniques used for data quality control and calculation of technical series: an example of Central European daily time series. Idöjárás 115, 87–98.
Tavera, H. (2014). Evaluación del peligro asociado a los sismos y efectos secundarios en Perú. Lima: Instituto Geofísico del Perú.
Terzaghi, K. (1962). Stability of steep slopes on hard unweathered rock. Géotechnique 12, 251–270. doi:10.1680/geot.1962.12.4.251
Thompson, L. G., Mosley-Thompson, E., and Henderson, K. A. (2000). Ice-core palaeoclimate records in tropical south America since the last glacial maximum. J. Quat. Sci. 15, 377–394. doi:10.1002/1099-1417(200005)15:4<377::aid-jqs542>3.0.co;2-l
USGS (2021). LandLook https://landlook.usgs.gov/landlook/viewer.html (accessed 2 3, 2021).
USGS (2020a). Earthquake hazard program https://earthquake.usgs.gov/earthquakes/eventpage/us60003sc0/executive (accessed 5 9, 2020).
USGS (2020b). Earthquake hazard program https://earthquake.usgs.gov/earthquakes/eventpage/iscgem796163/shakemap/pga (accessed 5 9, 2020).
Veettil, B. K. (2018). Glacier mapping in the Cordillera Blanca, Peru, tropical Andes, using sentinel-2 and Landsat data. Singapore J. Trop. Geogr. 39, 351–363. doi:10.1111/sjtg.12247
Vilímek, V., Klimeš, J., and Červená, L. (2015). glacier-related landforms and glacial lakes in Huascarán national park, Peru. J. Maps 12, 193–202. doi:10.1080/17445647.2014.1000985
Vilímek, V., Hanzlík, J., Sládek, I., Šandov, M., and Santillán, N. (2012). “The share of landslides in the occurrence of natural hazards and the significance of el Niño in the Cordillera Blanca and Cordillera Negra Mountains, Peru,” in Landslides: global risk preparedness. Editors K. Sassa, B. Rouhban, S. Briceno, M. McSeveny, and B. He (Springer), 133–148. doi:10.1007/978-3-642-22087-6_9
Westoby, M. J., Glasser, N. F., Brasington, J., Hambrey, M. J., Quincey, D. J., and Reynolds, J. M. (2014). Modelling outburst floods from moraine-dammed glacial lakes. Earth-Science Rev. 134, 137–159. doi:10.1016/j.earscirev.2014.03.009
Westoby, M. J., Brasington, J., Glasser, N. F., Hambrey, M. J., and Reynolds, J. M. (2012). 'Structure-from-Motion' photogrammetry: a low-cost, effective tool for geoscience applications. Geomorphology 179, 300–314. doi:10.1016/j.geomorph.2012.08.021
Wilson, J., Reyes, L., and Garayar, J. (1995). Geologia de los cuadrangulos de Pallasca, Tayabamba, Corongo, Pomabamba, Carhuaz y Huary. Lima: INGEMET.
Yoshikawa, K., Úbeda, J., Masías, P., Pari, W., Apaza, F., Vasquez, P., et al. (2020). Current thermal state of permafrost in the southern Peruvian Andes and potential impact from El Niño–Southern Oscillation (ENSO). Permafrost Periglac Process 2020, 1–12. doi:10.1002/ppp.2064
Keywords: glacier retreat, slope stability, factor of safety, Peru, Cordillera Blanca, InSAR, rock mass characterization
Citation: Klimeš J, Novotný J, Rapre AC, Balek J, Zahradníček P, Strozzi T, Sana H, Frey H, René M, Štěpánek P, Meitner J and Junghardt J (2021) Paraglacial Rock Slope Stability Under Changing Environmental Conditions, Safuna Lakes, Cordillera Blanca Peru. Front. Earth Sci. 9:607277. doi: 10.3389/feart.2021.607277
Received: 16 September 2020; Accepted: 17 February 2021;
Published: 29 April 2021.
Edited by:
Joanna Faure Walker, University College London, United KingdomReviewed by:
Joern Lauterjung, Helmholtz Center Potsdam, GermanyXuanmei Fan, Chengdu University of Technology, China
Copyright © 2021 Klimeš, Novotný, Rapre, Balek, Zahradníček, Strozzi, Sana, Frey, René, Štěpánek, Meitner and Junghardt. This is an open-access article distributed under the terms of the Creative Commons Attribution License (CC BY). The use, distribution or reproduction in other forums is permitted, provided the original author(s) and the copyright owner(s) are credited and that the original publication in this journal is cited, in accordance with accepted academic practice. No use, distribution or reproduction is permitted which does not comply with these terms.
*Correspondence: Jan Klimeš, klimes@irsm.cas.cz