An Inside Perspective on Magma Intrusion: Quantifying 3D Displacement and Strain in Laboratory Experiments by Dynamic X-Ray Computed Tomography
 Sam Poppe1*
  Eoghan P. Holohan2
  Olivier Galland3
  Nico Buls4
  Gert Van Gompel4
  Benyameen Keelson4
  Pierre-Yves Tournigand1
  Joost Brancart5
  Dave Hollis6 Alex Nila6
  Matthieu Kervyn1
- 1Department of Geography, Vrije Universiteit Brussel, Brussels, Belgium
- 2UCD School of Earth Sciences, University College Dublin, Dublin, Ireland
- 3Physics of Geological Processes, The Njord Center, University of Oslo, Oslo, Norway
- 4Department of Radiology, Universitair Ziekenhuis Brussel (UZ Brussel), Vrije Universiteit Brussel, Brussels, Belgium
- 5Physical Chemistry and Polymer Science (FYSC), Vrije Universiteit Brussel, Brussels, Belgium
- 6LaVision UK Ltd., Oxford, United Kingdom
Magma intrusions grow to their final geometries by deforming the Earth's crust internally and by displacing the Earth's surface. Interpreting the related displacements in terms of intrusion geometry is key to forecasting a volcanic eruption. While scaled laboratory models enable us to study the relationships between surface displacement and intrusion geometry, past approaches entailed limitations regarding imaging of the laboratory model interior or simplicity of the simulated crustal rheology. Here we apply cutting-edge medical wide beam X-ray Computed Tomography (CT) to quantify in 4D the deformation induced in laboratory models by an intrusion of a magma analog (golden syrup) into a rheologically-complex granular host rock analog (sand and plaster). We extract the surface deformation and we quantify the strain field of the entire experimental volume in 3D over time by using Digital Volume Correlation (DVC). By varying the strength and height of the host material, and intrusion velocity, we observe how intrusions of contrasting geometries grow, and induce contrasting strain field characteristics and surface deformation in 4D. The novel application of CT and DVC reveals that distributed strain accommodation and mixed-mode (opening and shear) fracturing dominates in low-cohesion material overburden, and leads to the growth of thick cryptodomes or cup-shaped intrusions. More localized strain accommodation and opening-mode fracturing dominates in high-cohesion material overburden, and leads to the growth of cone sheets or thin dikes. The results demonstrate how the combination of CT and DVC can greatly enhance the utility of optically non-transparent crustal rock analogs in obtaining insights into shallow crustal deformation processes. This unprecedented perspective on the spatio-temporal interaction of intrusion growth coupled with host material deformation provides a conceptual framework that can be tested by field observations at eroded volcanic systems and by the ever increasing spatial and temporal resolution of geodetic data at active volcanoes.
Keypoints
- Cutting-edge dynamic wide beam X-ray Computed Tomography and Digital Volume Correlation allows an inside view on the temporal behavior of analog magma intrusion in granular host material in laboratory experiments.
- Intrusion-induced 3D displacement and strain can be quantified over time.
- Thick cryptodomes form with distributed strain and mixed-mode fracturing in weak host materials.
- Thin dikes form with localized strain and opening-mode fracturing in strong host materials.
- A continuum of cone sheet geometries occurs in between these end-members.
Introduction
Magma intrusion induces crustal deformation, which in turn results in surface displacements, in changes in the local gravimetric field and in earthquake swarms, all of which can be monitored with geodetic and geophysical techniques (Brenguier et al., 2016; Fernández et al., 2017 and references therein; Figure 1A). Because direct observations of the intrusion emplacement are impractical, analytical, and numerical models are used to invert surface geodetic and/or geophysical monitoring data in order to constrain intrusion geometry and volume (Calais et al., 2008; Wauthier et al., 2012; Pinel et al., 2014; Sigmundsson et al., 2014; Fernández et al., 2017; Poland et al., 2017; Ebmeier et al., 2018). The most widely-used inverse geodetic models are limited by the simplifications and boundary conditions that are implemented to make mathematical solutions possible. For instance, they assume simple elastic or visco-elastic crustal deformation, and they represent intrusions as infinitesimal point pressure sources, finite pressurized spheroids or rectangular dislocation planes (Mogi, 1958; Okada, 1985; Yang et al., 1988; Figure 1C). In principle, model complexity can be increased by allowing for multiple sources (or segments) and by combining different source geometries (e.g., Battaglia et al., 2013; Sigmundsson et al., 2018).
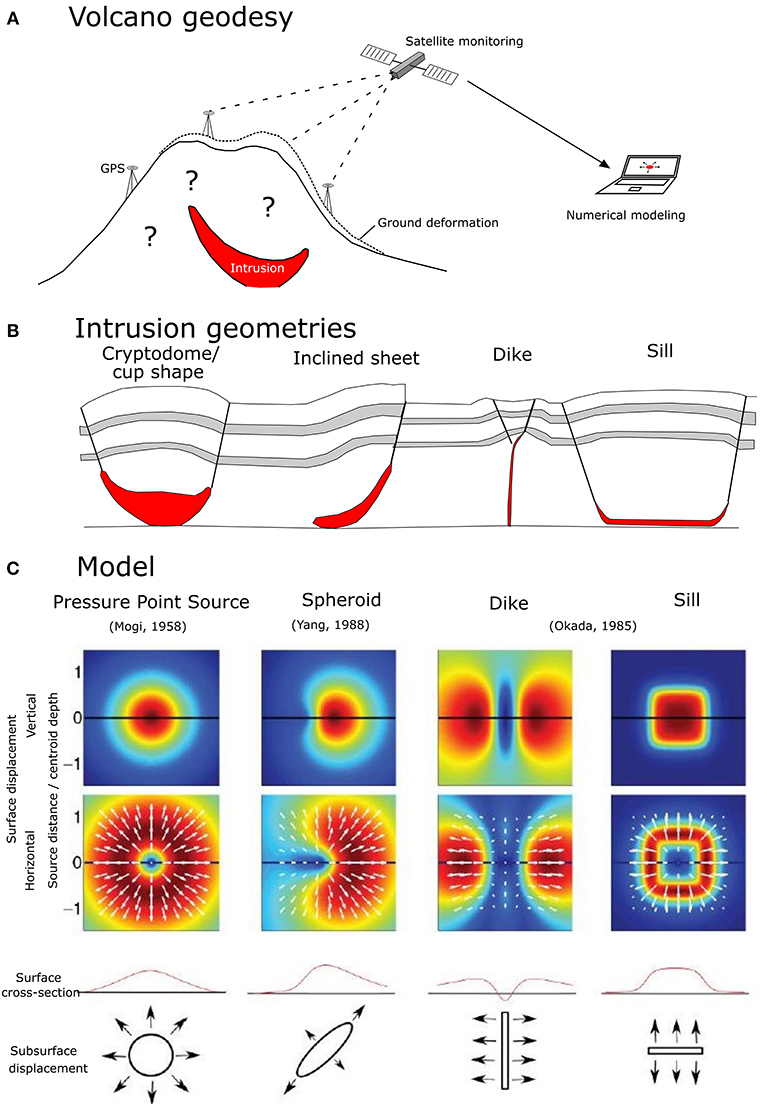
Figure 1. (A) Subsurface geometrical growth of a magma intrusion can only be derived indirectly through numerical modeling of observations of seismicity or geodetic monitoring of the induced ground deformation using satellite monitoring (GPS, InSAR) or photogrammetry; (B) Geometries of now-chilled magma intrusions as observed at natural outcrops vary widely in geometry, ranging from thick cryptodomes and cup shapes over inclined sheets and cone sheets to thin vertical (i.e., dikes) and horizontal (i.e., sills) sheet intrusions (adapted from Schmiedel et al., 2017); (C) Geodetic models invert measured ground deformation to obtain best-fit magmatic deformation sources (i.e., intrusions) using a range of simplified geometries, ranging from Mogi point-sources to rectangular Okada sources (adapted from Sigmundsson et al., 2018).
Observations of natural outcrops of frozen and exhumed magmatic intrusions, however, have revealed a great variability and complexity of intrusion geometry. In terms of their shape, intrusions vary from thick stocks, cryptodomes, laccoliths, fingers, and cup shapes to thinner cone sheets, inclined sheets, layer-parallel sills and layer-perpendicular dikes (e.g., Gudmundsson, 2011; Bistacchi et al., 2012; Burchardt et al., 2013; Tibaldi, 2015; Galland et al., 2018; Magee et al., 2018; Figure 1B). Natural magma intrusion may also comprise complex combinations of the above-mentioned forms. Limitations of such field observations are that they represent a final static and commonly incomplete account of the intrusion processes, and they usually lack any link with the surface. Nonetheless, some aspects of these intrusion geometries, such as sharp tips on sheet intrusions, are consistent with Linear Elastic Fracturing Mechanics (LEFM) theory of their formation as planar, opening-mode hydraulic fractures containing low- to medium-viscosity magma propagating within an elastically deforming host rock (e.g., Pollard et al., 1983; Dahm, 2000b; Muirhead et al., 2012; Rivalta et al., 2015). Other aspects of some sheet intrusion geometries and their field relationships, such as folds and reverse faults around blunt, irregularly-shaped intrusion tips, are alternatively interpreted as formed by “viscous indentation” of magma within plastically deforming host-rock (e.g., Mathieu et al., 2008; Abdelmalak et al., 2012; Delcamp et al., 2014; Spacapan et al., 2017; Bertelsen et al., 2018; Haug et al., 2018).
Given the natural variability of intrusion geometry, the physical meaning of simple but widely-used numerical pressure source geometries and linear elastic host-rock rheologies remains subject to vivid scientific debate (Grosfils et al., 2013; Rivalta et al., 2015; Townsend et al., 2017; Haug et al., 2018). For instance, such simple elastic analytical and numerical models commonly associate sill-like intrusions with dome-shaped ground deformation, while they link vertical dikes with ground deformation patterns that comprise two bulges either side of a central trough —i.e., “bulges-and-trough”—and that are correspondingly M-shaped in cross-section, with the M centered above the dike's upper tip (e.g., Mastin and Pollard, 1988; Lundgren et al., 2013; Sigmundsson et al., 2014, 2018). On the other hand, some non-elastic experimental models have linked both sill-like intrusions and vertical dikes with dome-shaped ground deformation patterns (Abdelmalak et al., 2012; Guldstrand et al., 2017).
Scaled laboratory experiments are complementary to field observations and numerical models, in that they can simulate under controlled conditions the geometric development of magma intrusions within materials of complex rheology (Hubbert, 1937; Barenblatt, 2003; Merle, 2015; Galland et al., 2018). To investigate the range of geometries observed in nature, past studies have involved various magma analogs (silicon PDMS, golden syrup, water, vegetaline oil) injected into either granular materials or transparent pig-skin gelatin (e.g., Donnadieu et al., 2001; Galland et al., 2014; Schmiedel et al., 2017; Kavanagh et al., 2018). These laboratory models have shown how intrusion geometry relates to a range of physical parameters, such as host rock strength and rheology, host rock anisotropy, overburden depth, magma injection velocity, and magma viscosity.
For experiments with opaque granular materials, magma is injected either against a transparent vertical sidewall in a “half-box” (e.g., Mathieu et al., 2008; Le Corvec and Walter, 2009; Abdelmalak et al., 2012) or “blindly” into the middle of the sand box (e.g., Mathieu et al., 2008; Delcamp et al., 2012; Galland et al., 2014). In the former case, the intrusion's growth and host material displacement are quantified in 2D along the sidewall, but undesirable friction occurs between the granular material and the vertical sidewall exactly at the plane of observation, with an unknown effect on the quantified data (Le Corvec and Walter, 2009; Abdelmalak et al., 2012). In the latter case, the laboratory model surface displacement is quantified in 3D, but the host material's internal structural evolution and the intrusion's geometric development are not observed. In both cases, the final 3D geometries of the intrusion and host material structure are observed only by excavation at the end. This is why Rivalta et al. (2015) concluded that moving modeling into 3D plus time would be a most important step to improving our insight into magma propagation through the crust.
X-ray Computed Tomography (CT) provides a solution to observe the interior of laboratory models with granular host material (Mees et al., 2003; Kervyn et al., 2010; Cnudde and Boone, 2013). While high-resolution micro-CT scanners only allow imaging of the final model geometry (Kervyn et al., 2010; Poppe et al., 2015), medical scanners can acquire a time-series of 3D CT images at any desirable time interval, but at the cost of lower spatial resolutions (Schreurs et al., 2003). This technique has been used to image structural geometries in sandbox models simulating tectonic compression (Adam et al., 2013) or extension (Holland et al., 2011; Zwaan et al., 2018), or viscous magma intrusion in a sand-plaster cone (Rincón et al., 2018). Standard CT scanners have narrow X-ray detectors and only allow for “helical scanning” by moving the model box through the X-ray gantry while experimental deformation has to be arrested (Schreurs et al., 2003). The recent development of Digital Volume Correlation (DVC) techniques enables one to quantify displacement and strain in 4D throughout the entire laboratory model volume (Adam et al., 2013; Zwaan et al., 2018).
We here present a novel application of medical wide beam CT to dynamically image the propagation of analog magma intrusions of distinct geometries in laboratory models. For each intrusion geometry, the displacement and strain of the granular host material is quantified in 4D by using DVC on the CT time series, while the surface deformation is extracted as well. We demonstrate that cutting-edge medical wide beam CT makes in-situ dynamic scanning of fluid propagation possible through non-transparent material from a stationary position, and holds great potential to study the spatio-temporal behavior of deformation caused by igneous emplacement in the Earth's upper crust.
Methodology
Model Materials and Protocol
The model materials are golden syrup and a mixture of silica sand and gypsum powder, analogs to magma and crustal host rock, respectively. Golden syrup (Tate and Lyle, UK) is a Newtonian fluid with a temperature-dependent density and viscosity (Table 1; Appendix A; Beckett et al., 2011). The ambient air temperature in the laboratory varied between 22 and 26°C, and was used to calculate syrup viscosities for each experiment (Appendix A). The silica sand was MAM1ST-300 of industrial purity from Sibelco (Mol, Belgium) and the gypsum powder was Goldband building plaster (Knauf). The mechanical behavior of silica sand as a Mohr-Coulomb material is well-constrained (Lohrmann et al., 2003; Panien et al., 2006). Mixing sand and plaster at different ratios creates a range of frictional-plastic granular materials with a more complex rheology that simulates a range of rock strengths; we used sand:plaster ratios of 90:10, 80:20, 65:35, and 50:50 wt%. Values of cohesion and angle of internal friction were obtained by using a combination of tensile tests and direct shear tests (cf. Abdelmalak et al., 2016) on samples that were poured and compacted manually to obtain the same bulk densities as those obtained in the model box. Direct shear test results were corrected for the silo effect (Mourgues and Cobbold, 2003). We ensured that humidity did not affect the strength of the granular materials by oven-drying overnight; ambient air humidity in the lab and CT room remained below 20% at all times.
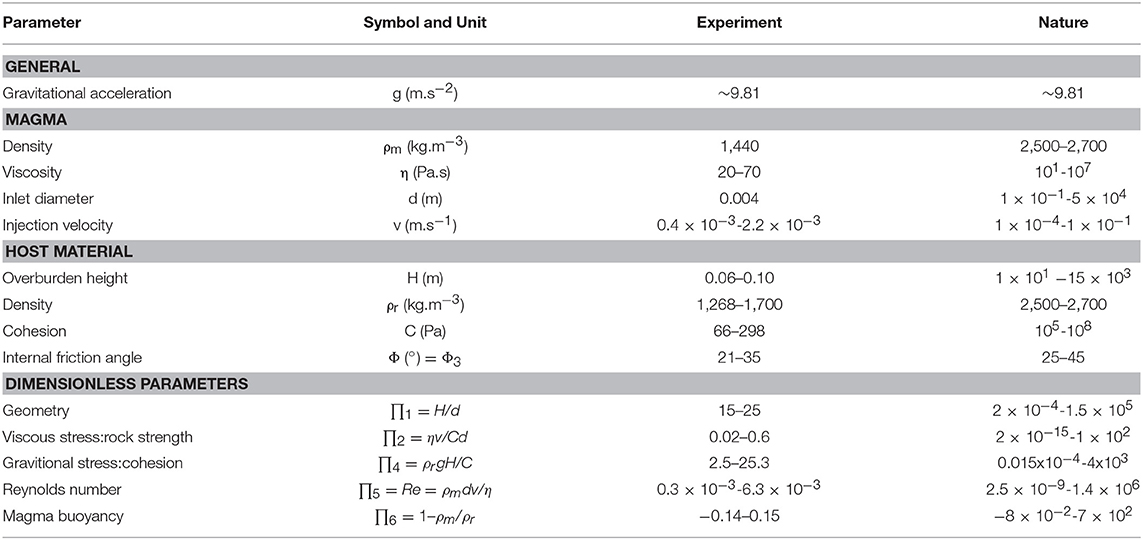
Table 1. Scaling parameters and dimensionless equations used to compare the experiments to nature; natural values come from Schultz (1996), Galland et al. (2014), and Merle (2015).
For each experiment, a weighed mass of granular material was deposited in a plexiglas box (20 cm wide, 20 cm long, 16 cm high) by pouring to preserve homogeneous mixing of the sand with the fine-grained plaster. The material was then covered and shaken mechanically with a pneumatic vibrator (OT25, Olivibra, Italy) to compact down to 76–83% of its pre-compacted height to control density and hence mechanical strength. Shaking was limited to ~10 s to avoid segregation of the coarse-size sand and fine-size plaster grains. Golden syrup was placed in a syringe and allowed to settle to remove air bubbles. The syringe was then placed on a syringe pump and connected through a flexible tube with the model box. The outlet of the tube with 4 mm internal diameter sat 2 cm above the base of the box within the granular material to avoid syrup percolating along the plexiglass-sand boundary. The experiment was started by injecting syrup into the sand at a constant pump discharge ranging between 20 and 100 ml hr−1 for different experiments. This is equivalent to flow velocities at the outlet of 0.4 × 10⁻³-2.2 × 10⁻³ m s−1. The pump—and the experiment—was stopped when syrup was seen to break through the model surface. The experiment box was then frozen overnight, after which the solidified intrusion was excavated to confirm its geometry. Figure 2 illustrates the experimental set-up.
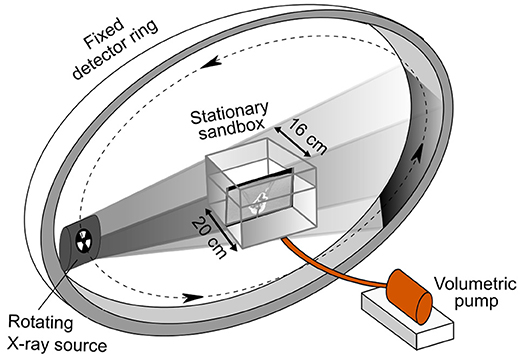
Figure 2. Experimental set-up at the medical wide beam X-ray Computed Tomography scanner (GE Healthcare) of the UZ Brussel hospital, Belgium. The experimental box containing the compacted granular analog is in a fixed position—in the location of the “patient”—and is connected by a flexible tube to a computer-controlled constant-rate volumetric syringe pump containing the magma analog golden syrup. During syrup injection, a 3D CT image is obtained every 20 s over an acquisition time of 1 s by rotating an X-ray source within a fixed 16 cm wide X-ray detector ring.
Model Scaling
Our laboratory models were scaled to obtain geometric, kinematic, and dynamic similarity with nature by using six dimensionless ∏-numbers (Table 1), similar to the dimensional analysis proposed by Galland et al. (2014). The length scaling of our experiments is 10−5 so 1 cm equals 1–2 km in nature. Our experiments thus simulate intrusion into the upper crust. Two dimensionless numbers are useful to explain the formation of contrasting intrusion geometries, and these are used to classify our experiments further on. The first is a geometric parameter scaling the intrusion depth to its source dimensions:
where H is the overburden height above the analog magma inlet and d is the diameter of that inlet. The second parameter scales the viscosity of the magma to the strength of the analog host material:
Where η is the analog magma viscosity, v is the analog magma intrusion velocity at the inlet and C is the host material's cohesion. The other four parameters scale host material strength, lithostatic stress, analog magma flow regime and buoyancy (Table 1).
In contrast to natural rocks, it is currently unclear how elastic properties could be quantified in granular analogs (Lohrmann et al., 2003; Panien et al., 2006; Ritter et al., 2016; Galland et al., 2018). In terms of cohesion and angle of internal friction, however, the low-strength granular mixtures (90:10 wt% sand-plaster) represent unconsolidated to weakly consolidated sediments, breccias or tuffs; medium-strength granular mixtures (80:20 and 65:35 wt% sand-plaster) represent weakly consolidated or heavily fractured sediments and rocks, such as shale; and high-strength granular mixtures (50:50 wt% sand-plaster) represent competent and consolidated rocks, such as limestone or crystalline rock (Mathieu et al., 2008; Abdelmalak et al., 2016; Schmiedel et al., 2017; Galland et al., 2018). Whereas regional stress fields, topographic loads, and pre-existing structures are known to affect magma intrusion emplacement (Acocella and Neri, 2009; Sigmundsson et al., 2014; Koehn et al., 2019), our laboratory models assume the simple boundary conditions of zero far-field stresses and a low relief topography, and they assume magma intrusion into pristine host rock unaffected by fracturing, faulting or magma intrusion. Note that the natural values of scaling parameters are largely uncertain, which leads to the broad ranges in the values of dimensionless parameters listed in Table 1, a recurrent issue when scaling laboratory models (e.g., Barenblatt, 2003; Merle, 2015; Galland et al., 2018).
Wide Beam X-Ray Computed Tomography
In 12 selected experiments (Table 2), syrup intrusion into the granular volume was recorded by a 3D X-ray CT image time-series. CT experiments were conducted at the UZ Brussel on a medical wide beam CT scanner (Revolution CT, GE Healthcare), centered in the CT gantry along the x-, y-, and z-axis, respectively (Figure 2). To obtain sufficient image contrast, we calibrated the average X-ray value of the sand-plaster mixtures and golden syrup prior to the intrusion experiments (Appendix B). In addition, three pre-experiment 3D CT images were acquired of each experiment with the aim of assessing image noise and DVC precision.
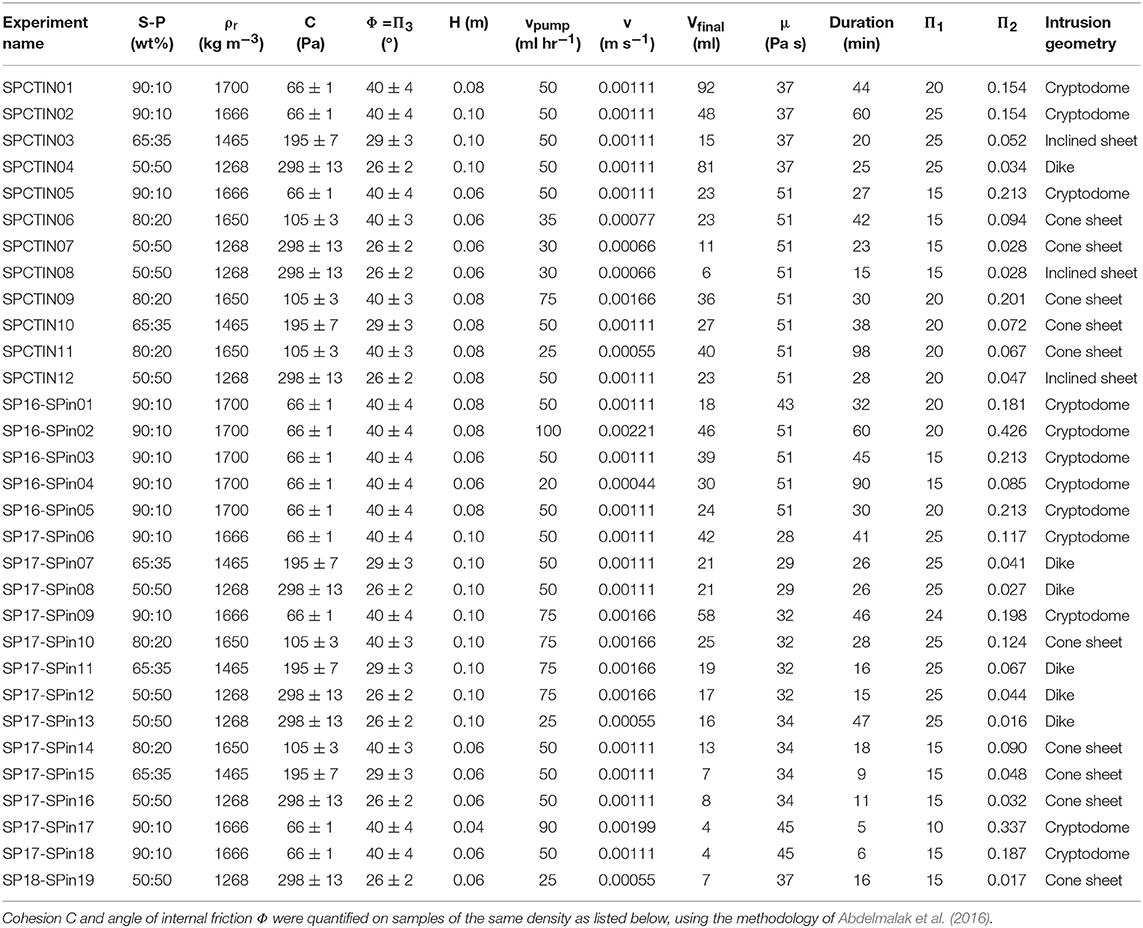
Table 2. Set-up parameters and outcome of analog models of golden syrup intrusion in granular materials run in the UZ Brussel hospital CT scanner and in the laboratory; see Table 1 for abbreviations.
Dynamic CT acquisition and syrup injection were started simultaneously. Dynamic CT images were acquired in a single rotation with the following settings: X-ray tube voltage 120 kV, tube current 150 mA, rotation time 1 s, interval between two successive 3D images 19 s. Voxels are 3D pixels with horizontal (x, z) and vertical (y) dimensions and are anisotropic in clinical CT. Slice distance in z-direction is 0.625 mm and is a fixed attribute to the scanner, the voxel size in in-slice xy-directions is 0.391 mm (SPCTIN06) to 0.504 mm (SPCTIN02;−04) and depends on the selected scan field-of-view. The reconstructed 3D volume of X-ray values represents the X-ray attenuation in each voxel, expressed in Hounsfield units (HU), a measure relative to water, and defined such that the X-ray value of water is 0 HU. The intrusion bodies were rendered from the 3D CT images for each time step using seed growth segmentation in the 3D Slicer image processing software (www.slicer.org; Fedorov et al., 2012).
Digital Volume Correlation
We used the Digital Volume Correlation (DVC) Strainmaster module of the commercial DaVis software (LaVision Ltd., UK) to calculate the displacement vector fields in the time series of each experiment. We first resampled the original anisotropic (x = y ≠ z) CT volumes to produce isotropic voxel dimensions (x = y = z) as required by the DVC algorithm. This preprocessing was implemented in C++ and Python code based on the open-source Insight segmentation and registration toolkit (ITK; Yoo et al., 2002). The images were resampled to yield isotropic voxels by super-sampling along the inter-slices resolution (z). The in-plane resolution (x,y) was chosen as the desired value of isotropic resolution and passed on as an argument to the code for the resampling step. The resampling process required a transform to map point coordinates and an interpolator to compute intensity values for the new resampled image. We used an identity transform in order to maintain the physical extent of the sampled image and a nearest neighborhood interpolator. The resampled images were then converted to unsigned byte format, with values in the range [0, 255] to allow compatibility with the DVC software.
The Strainmaster DVC module characterizes image texture in a small sub-volume in the first CT volume, and it then searches the best-fit sub-volume in the subsequent CT volume by using a direct correlation algorithm. In contrast, Adam et al. (2013) previously used a Fast Fourier Transform algorithm. Strainmaster DVC then calculates the length and orientation of the 3D vector V that describes the differential displacement that occurs during the time increment [u(x),v(y),w(z)] (Figure 3). This process is repeated for each sub-volume to construct an incremental 3D displacement field. DaVis then calculates the differential strain tensor Eij = δVi = δj (with i ϵ {x, y, z} and j {x, y, z}), as well as the incremental shear strain components (εxy, εxz, εyz), maximum 3D shear strain (εx-εz) and incremental rotational shear strain around the horizontal z-axis (rot-z = εyx-εxy). The differential spatio-temporal variation of material transport and volumetric deformation is thus described; Lagrangian summation of the incremental displacement fields then allows calculation of the cumulative—i.e., total—displacement and finite strain field throughout the experiment volume (Figure 3).
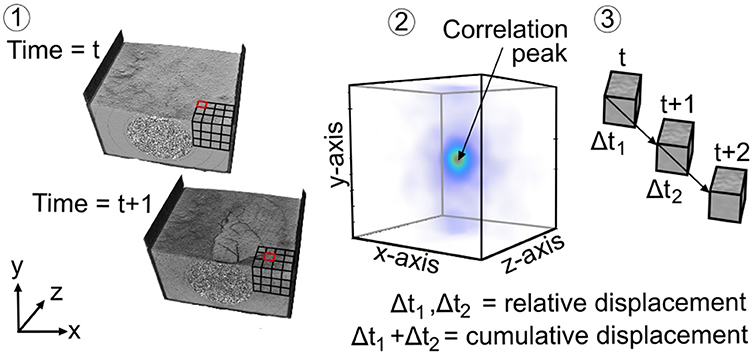
Figure 3. The quantification of model deformation using Digital Volume Correlation (DVC) occurs in three steps. In step 1 voxel data of a time series of CT scans of a deforming experiment are subdivided in subvolumes consisting of a predefined number of voxels. In step 2 a pattern correlation peak is determined through a direct 3D correlation function that does not require tracking individual particles. In step 3 differential vector fields are calculated for each consecutive time step; the differential vector fields can be optionally summed up to obtain the cumulative displacement.
By repeating calculation runs four times at progressively decreasing sub-volume, binning and peak search sizes, the final correlation result can be optimized. The two last calculation runs were repeated twice each. A sub-volume size of 32 × 32 × 32 voxels and a sub-volume overlap of 75% in the last of four DVC runs resulted in a spatial resolution of the displacement vector field of 4.032 mm, where each vector represents the displacement of a 16.128 × 16.128 × 16.128 mm sub-volume. Displacements of equal vector length and orientation that occur over the entire imaged volume (i.e., “rigid body movements”) were subtracted from the 3D displacement vectors for each sub-volume to remove artifacts due to potential small movements of the entire experimental box during CT imaging.
The DVC algorithm in theory achieves a sub-voxel precision of 0.05–0.1 pixel of displacement, which depends on the sub-volume size, image quality and image texture (Adam et al., 2013 and references therein). In the three pre-experiment CT images acquired before syrup injection, any displacement calculated by DaVis between the second and third CT images and the first one theoretically represent background noise (Figure 4A). For the three experiments discussed below, the median value and standard deviation of such background noise was on average 0.10 ± 0.05 mm for displacement vector length and on average 0.075 ± 0.060 for maximum shear strain. Figures 4B–D demonstrates that in experiment SPCTIN02 the median values of displacement vector length, 3D volumetric strain and maximum shear strain measured in the pre-experiment images are below one voxel size, or 20–30% of the values measured in the syn-experiment time-series.
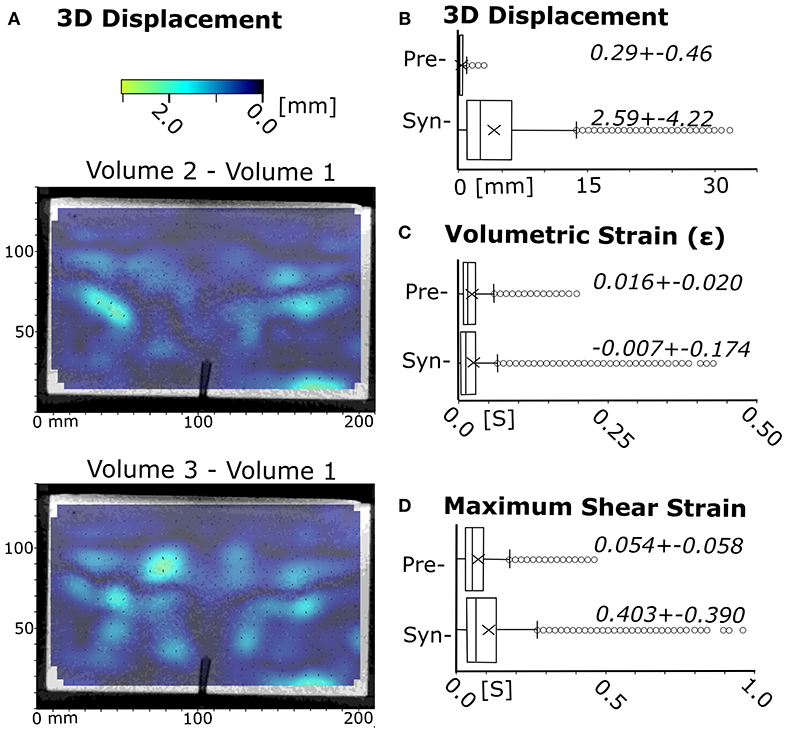
Figure 4. Assessment of Digital Volume Correlation precision in experiment SPCTIN02. (A) x-z vertical cross-sections through 3D displacement fields calculated between, respectively the second and third CT image and the first one acquired prior to golden syrup injection, i.e., a pre-experimental state; (B–D) Median and standard deviations of 3D displacement vector lengths, volumetric strain and maximum shear strain in pre-experiment CT images and the last differential syn-experiment timestep, n = 47,400 voxels.
Surface Data
We extracted the model surface from the resampled, isotropic CT volume at each time increment in an elevation map by using a dedicated MATLAB® script. Each slice image (in PNG format) was converted into a binary image by using a threshold gray value that separated image pixels representing the granular pile from pixels representing the box or the surrounding air. The elevation of the threshold gray value was then progressively recorded in a raster matrix for each slice. This process was repeated for each incremental CT volume to produce a time series of surface elevation.
Results
Intrusion Growth
We performed 19 experiments at Vrije Universiteit Brussel to control experimental reproducibility. A further 12 experiments were monitored with dynamic wide beam X-ray Computed Tomography (CT). Between experiments, we varied the granular material strength (cohesion C, angle of internal friction Φ), material height (H), and the syrup injection discharge (v) (Table 2). ∏2 thus exerted the greatest influence on the results. Intrusion geometries differed dominantly across the different strengths of the granular host material. The Supplementary Material contains videos documenting the development of the intrusions and overburden deformation in the three experiments discussed below.
In low-strength materials (90:10; high ∏2), intrusions initially form a spherical, radially expanding intrusion (Figure 5A; Movie 1). Such a geometry is here called a cryptodome. A cm-thick dense percolation layer in which the syrup fills the sand pore space is observed on the CT imagery as a volume with high gray values (i.e., white) wrapped around the lighter syrup that is imaged with lower gray values (i.e., dark gray; Figure 5A). The percolation aureole is 1–5 mm thick in the low strength materials, but is negligible in the higher strength materials (see below). As the intrusion expands, the overburden is uplifted and an inverted-cone-shaped ring fracture forms. The intrusion becomes asymmetric in its top half, developing one or more cusps that expand into the overburden fracture (Figure 5C). One of the cusps then develops into a finger or a thick leaf-shaped curved sheet that propagates toward the surface along the overburden ring fracture (Figure 5D). Percolation of syrup into the granular material is much less developed around the rapidly propagating finger or thick sheet compared to the slowly inflating body of the intrusion. At the surface, the uplift of the overburden results in an initially symmetric bell-shaped uplift, bound by the intersection of the outer ring fracture with the surface (Figure 5C). The center of the doming surface develops shallow polygonal opening-mode fractures over time, and a steep edge forms at the dome boundary as material is thrusted upwards and slumps outwards (Figures 5D,E). The uplift becomes progressively asymmetric, and propagation of the finger eventually intersects the model surface in the area of maximum uplift leading to eruption (Figure 5E).
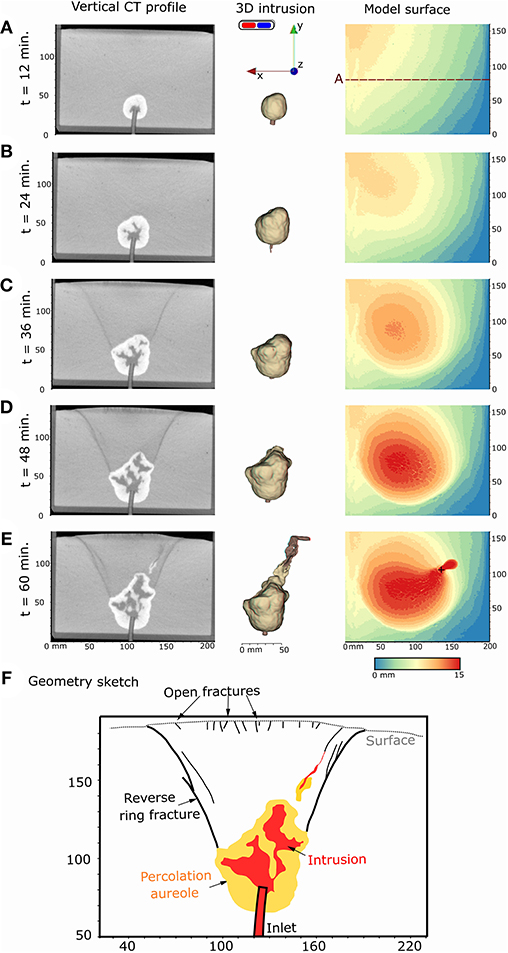
Figure 5. (A–E) Temporal evolution of a cryptodome intrusion in a 90:10 wt% sand:plaster mixture (SPCTIN02 in Table 2); (Left column) vertical x-y slice of reconstructed CT volumes through the model center; Central column: 3D anaglyphs of the intrusion geometry, including both syrup (red), and the percolation aureole (yellow), rendered from CT images, to be viewed with blue-red 3D glasses; (Right column) Model surface elevation extracted from resampled CT images, the black cross marks where syrup broke through the surface (i.e., eruption); (F) Structural sketch of the final intrusion and induced deformation structures in the overburden through the central x-y slice in (E) (t = 60 min).
In medium-strength materials (65:35; intermediate ∏2), intrusions initially form an oblate, ellipsoidal intrusion that expands laterally, associated with a mm-thick percolation aureole of syrup into the sand (Figure 6A; Movie 2). The overburden is bent upwards and fails along a steep through-going ring fracture that is shaped as an inverted cone, similar to low-strength materials (Figure 6B). A thin sheet intrusion then propagates upwards into that ring fracture (Figure 6C). Such conical intrusion shapes are here called cone sheets. The propagation velocity may be faster in one section of the cone-shaped part of the intrusion compared to other sections, in such case leading to asymmetrical geometries. The basal part of the intrusion around the inlet then continues to inflate as the cone-shaped part propagates (Figures 6D–E). At the surface, opening-mode fractures form directly above the inlet and propagate from the surface downward as the overburden above the intrusion is uplifted (Figure 6A). With continued uplift, extension of the dome surface creates additional opening-mode fractures arranged in a polygonal pattern defined by intersecting radial and subconcentric fracture trends. The syrup finally breaks through the surface via one of the opening-mode surface fractures that lies on the flank of the surface dome (Figure 6E).
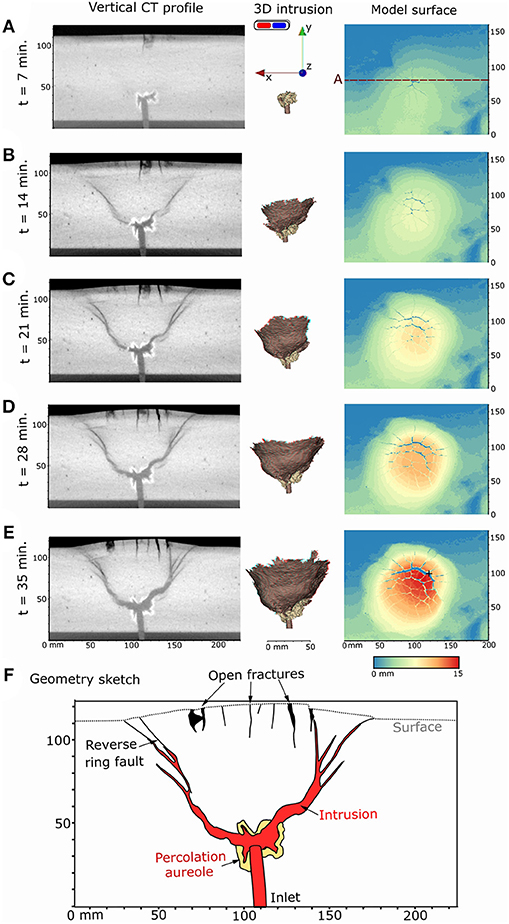
Figure 6. (A–E) Temporal evolution of a cone sheet intrusion in a 80:20 wt% sand:plaster mixture (SPCTIN06 in Table 2); (Left column) vertical x-y slice of reconstructed CT volumes through the model center; (Central column) 3D anaglyphs of the intrusion rendered from CT images, to be viewed with blue-red 3D glasses; (Right column) Model surface elevation extracted from resampled CT images, the black cross marks where syrup broke through the surface (i.e., eruption); (F) Structural sketch of the final intrusion and induced deformation structures in the overburden through the central x-y slice in (E) (t = 35 min).
In high-strength materials (50:50; low ∏2), intrusions initially open a triple-branched, star-shaped set of opening-mode fractures in plan-view, with the three branches oriented randomly relative to the box (Figure 7A; Movie 3). The angles between these branches range from a symmetric ~120 to up to ~180° for the widest angle. Syrup then propagates vertically through one or two dominant branches, and creates a thin, leaf-shaped vertical sheet intrusion, here called a dike (Figure 7B). The second and third branch—or only the third one if two branches are dominant—remain underdeveloped at the base of the dominant branch and have a penny shape with a vertical or inclined orientation. At 3–5 cm depth below the model surface, the intrusion deviates from its vertical path and forms an inclined tip, or splits into a V-shaped geometry that fills steeply inclined open fractures (Figure 7C). Some of the final intrusion geometries resemble an incomplete cone sheet but in fact are a combination of two en-echelon vertical dike segments under a minor (<10°) strike angle (Figure 7D). Surface deformation is much less developed compared to low- or medium-strength host materials because the intruded volume is lower (Table 2). Initially, a set of opening-mode fractures that are markedly deeper than in medium-strength materials forms at the surface above the dike tip (Figure 7B). The surface is then uplifted asymmetrically in a trapdoor-like fashion along some of the formed fractures (Figure 7C). Syrup eventually erupts from the open fracture bounding the area of trapdoor uplift and the final intrusion geometry is a complex of vertical or steeply inclined planar segments (Figure 7D).
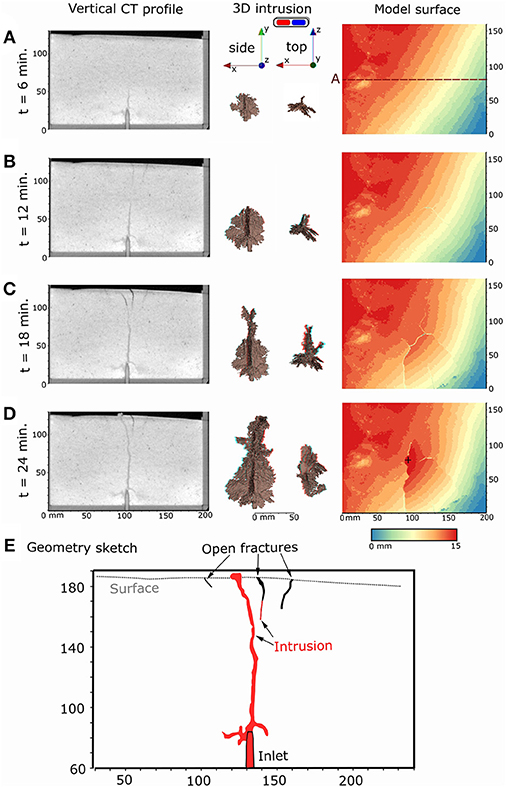
Figure 7. (A–D) Temporal evolution of a dike intrusion in a 50:50 wt% sand:plaster mixture (SPCTIN04 in Table 2): (Left column) vertical x-y slice of reconstructed CT volumes through the model center; (Central column) 3D anaglyphs of the intrusion seen from its side (left) and its top (right) rendered from CT images, to be viewed with blue-red 3D glasses; (Right column) Model surface elevation extracted from resampled CT images, the black cross marks where syrup broke through the surface (i.e., eruption); (E) Structural sketch of the final intrusion and induced deformation structures in the overburden through the central x-y slice in (D) (t = 24 min).
At lower host material overburden heights (H), intrusions in all three material strengths initially expand laterally more than vertically compared to those in higher overburden heights. In low- and medium-strength materials, the intrusions then inflate vertically in a later stage. In low-strength overburden this results in a thick intrusion geometry with a concave upward roof, here called a cup shape. The basal diameter of cone sheet intrusions in medium-strength materials with lower overburden height and lower injection velocity (v) is smaller compared to the experiments with a higher overburden and a higher injection velocity (Table 2). In high-strength materials, the lowest segments of dike intrusions are vertical in high material heights and their upper segments are steeply inclined (>8 cm), but only inclined sheets or cone sheets form in low material heights (<6 cm). While two experiments presented here were run under a minor slope (<4%; Figures 5, 7), experiments under a flat topography produced the same results as those described above.
The geometrical outcomes of the full range of experiments carried out at different ∏1 and ∏2 numbers are reproducible, and they confirm the finding of Galland et al. (2014) that a continuum of geometries forms with varying host material strength, fluid injection depth and injection velocity (Table 2, Figure 8). At low ∏1 and high ∏2 numbers (dominantly controlled by low host material strength), thick cryptodomes and cup shapes form. At high ∏1 and low ∏2 numbers (dominantly controlled by high host material strength), triple-branched star-shaped rifts form that develop into thin vertical dikes or steep inclined sheets. At intermediate dimensionless parameter values, a continuum of cone sheet geometries results with a range of basal diameters and inclined sheet angles.
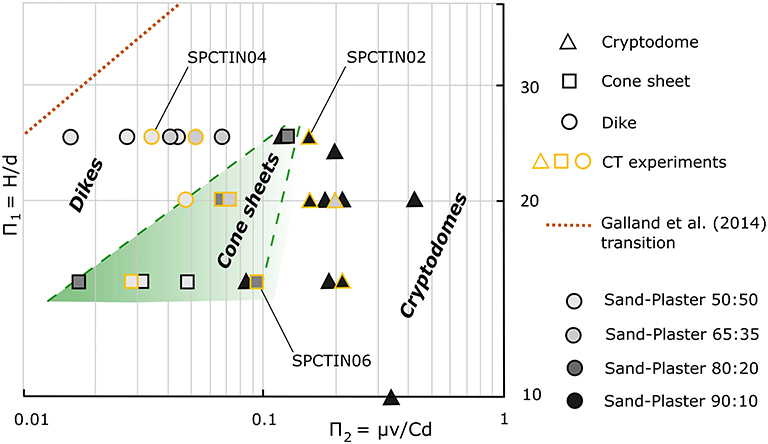
Figure 8. Experimental outcome of intrusion geometries expressed relative to their dimensionless parameter values. Symbol shapes mark intrusion geometries; color-coding marks sand:plaster ratios as an indicator of granular host material strength; yellow symbol edges mark CT experiments. The cone sheet to dike transition is offset to lower ∏2 and higher ∏1 values compared to that experimentally determined by Galland et al. (2014) (red dashed line).
3D Displacement and Strain
The evolution of the incremental 3D displacement vector field and the derived incremental strains in the experiments indicates that each intrusion's development can be divided into three to four phases (Figures 9–11). For the parameters held constant in the experiments, the nature of these phases depends on the strength of the granular host material.
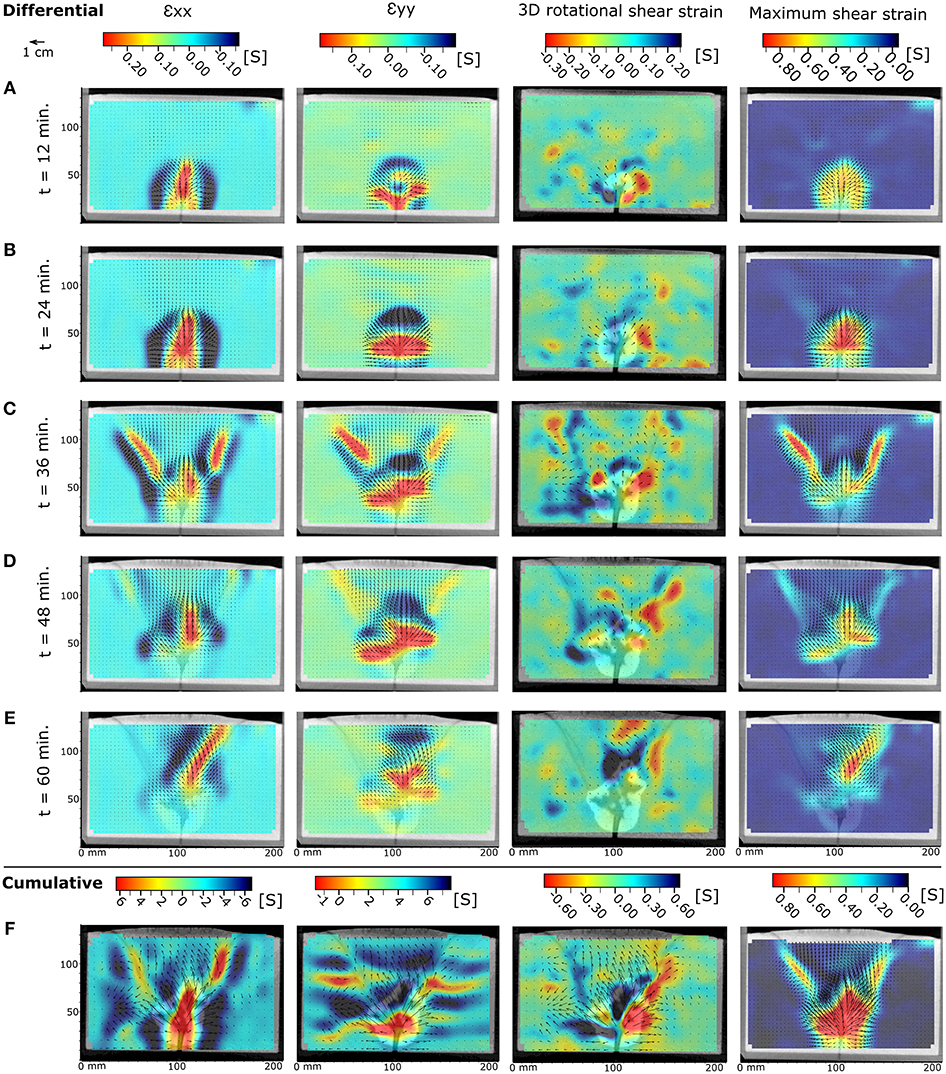
Figure 9. DVC results for differential (A–E) and cumulative (F) host material deformation induced by a cryptodome intrusion in a 90:10 wt% sand:plaster mixture (SPCTIN02 in Table 2)—arrows indicate magnitude and orientation of calculated displacement vectors: (Left column) Horizontal (longitudinal) strain, shortening is negative/blue; (Central left column) Vertical (axial) strain, shortening is negative/blue; (Central right column) Horizontal rotational shear strain around the z-axis, anticlockwise rotation is positive/blue; (Right column) Maximum shear strain.
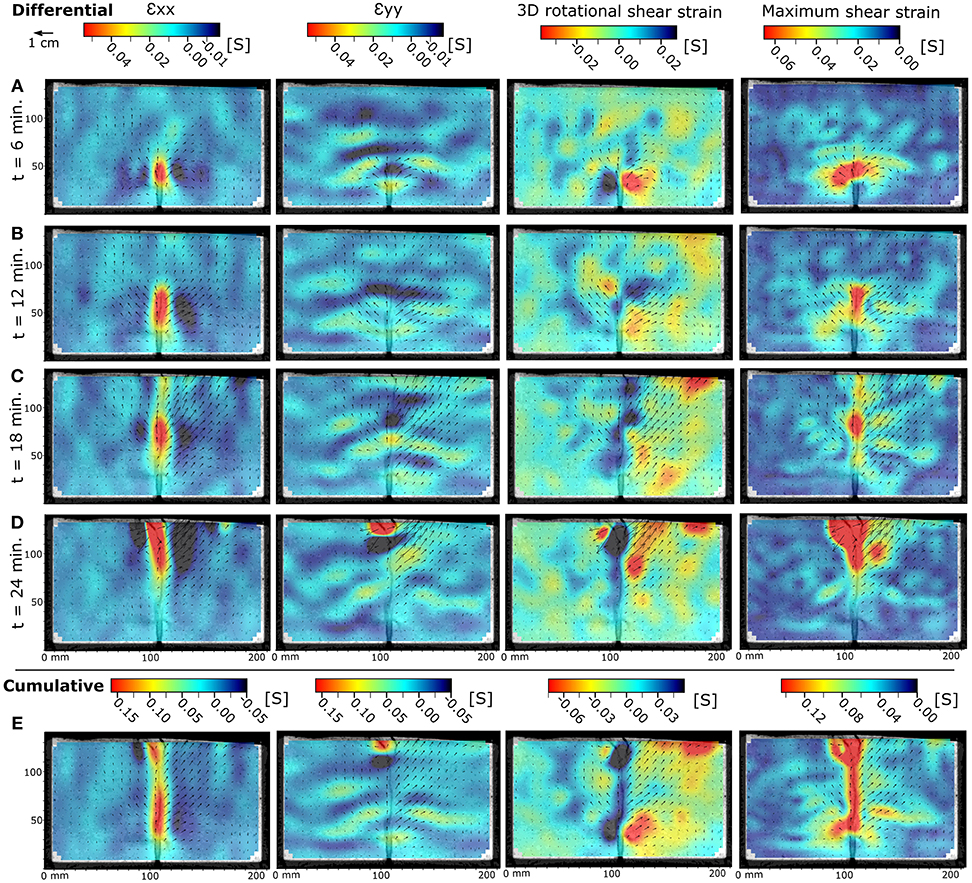
Figure 11. DVC results for differential (A–D) and cumulative (E) host material deformation induced by a dike intrusion in a 50:50 wt% sand: plaster mixture (SPCTIN04 in Table 2)—arrows indicate magnitude and orientation of calculated displacement vectors: (Left column) Horizontal (longitudinal) strain, shortening is negative/blue; (Central left column) Vertical (axial) strain, shortening is negative/blue; (Central right column) Horizontal rotational shear strain around the z-axis, anticlockwise rotation is positive/blue; (Right column) Maximum shear strain.
In low-strength materials (90:10; Figure 9), a radially outward displacement field develops around the syrup inlet at syrup injection onset (Figure 9A). The longitudinal strain data show that expansion of the intrusion is mostly accommodated by a concentric zone of contraction (compaction) within the surrounding granular host material (Figures 9A,B). The maximum shear strain within this zone concentrates close to the inlet and decreases radially outward. In a second phase, the overburden is displaced upward, and displacement vectors diverge away from the newly-developed ring fracture under opposite angles, indicating mixed-mode failure in which opening-mode is dominant and shear displacement is subordinate (Figure 9C). Incremental shear strain values are now highest within the narrow, axisymmetric, inverted cone shape of the ring fracture, which shows expansion along it and contraction in the host material. The contraction in the host material is concentrated in the footwall of the conical fracture; the central hanging-wall block delimited by the ring fracture displays relatively low strains. In a third stage, displacement along the ring fracture begins to die out, the intrusion inflates further, and the regions of maximum displacement and strain refocus around the intrusion top (Figure 9D). In a final stage, strain concentrates in a zone along the roof top of the cryptodome, from which an inclined secondary mixed-mode fracture propagates toward the surface and is intruded by a syrup finger or a thick, leaf-shaped sheet (Figure 9E). Overburden uplift becomes asymmetric with the highest displacements located within the hanging wall of the intruding finger and orientated at a high angle to it. Maximum shear strain occurs in the volume immediately around the ascending finger, from which golden syrup erupts (Figure 9E). Contractional strains are now greatest in the uplifting hanging-wall of the finger fracture, different from the development of the ring fracture.
In medium-strength materials (65:35; Figure 10), a radially outward displacement field develops around the inlet at intrusion onset as well (Figure 10A). Overburden contraction and uplift propagate rapidly toward the surface and cause the opening of a surface fracture above the inlet (Figure 10A). In a second phase the largest strains measured throughout the experiment concentrate along a through-going cone-shaped ring fracture (Figure 10B). The displacement vector field shows both opening and shear components along the ring fracture as the central overburden block is moved upwards and outward along it. This fracture then rapidly fills with syrup from the inlet toward the surface, accompanied by minor displacements (Figure 10C). Again the ring fracture shows mainly expansion along it as it develops (i.e., extensional strain in x and y directions—Figures 10A,B), while the host material surrounding the fracture shows mainly contraction focused in the fracture's foot-wall. Secondary fractures that open at the model surface arise from continued horizontal extension within the uplifted central block (Figures 10B,C); these are underlain by a subtle zone of vertical contraction arising as the upward and outward moving central block is stretched and thinned. In a third phase, the basal sill-like section of the intrusion then continues to inflate and vertical uplift of the central overburden block dominates (Figure 10D). Secondary conical fractures splay from the upper sections of the ring fracture. The splays again form through a mixed-mode combination of opening-mode and shear displacement, and result in the flower-shaped intrusion geometry consisting of concentric rings (Figure 6E). Strains within the central block and in the host material around the ring fracture are smaller than in earlier stages; they are distributed through the central block, and they mainly comprise a vertical shortening in response to the vertical opening of the underlying sill. In a last phase, shear and extensional strain localize along a vertical splay from the ring fracture that connects to one of the opening-mode surface fractures, which eventually becomes the eruptive fissure (Figure 10E).
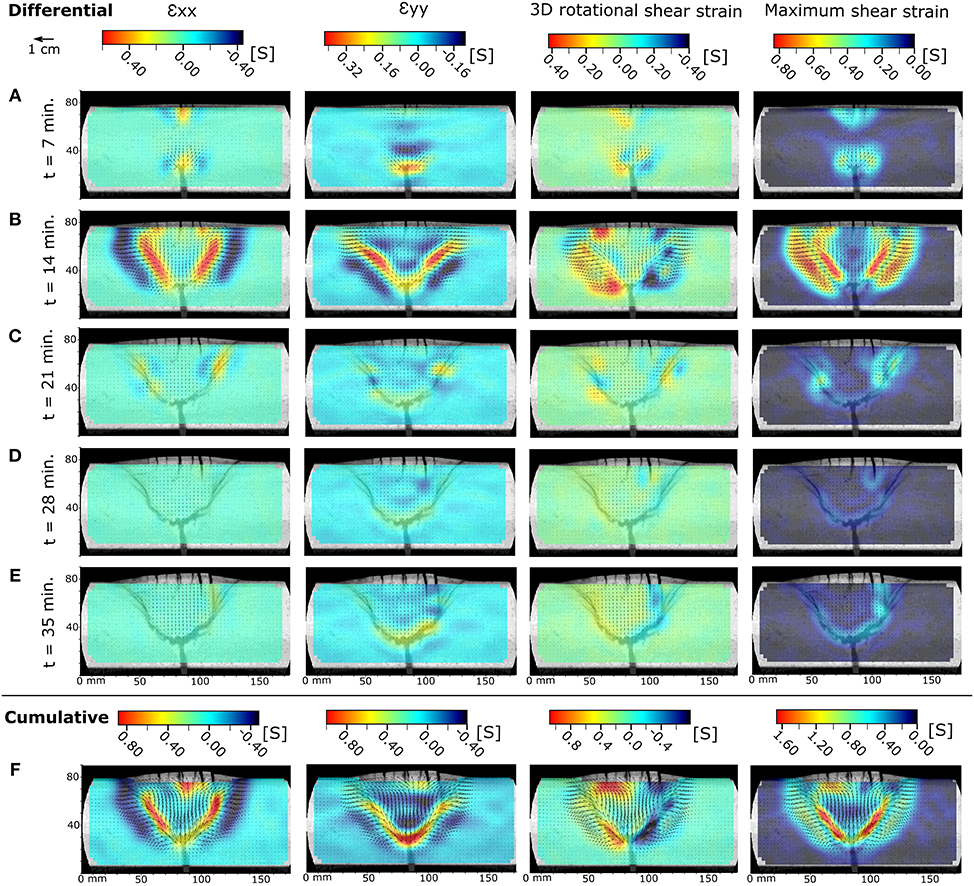
Figure 10. DVC results for differential (A–E) and cumulative (F) host material deformation induced by a cone sheet intrusion in a 80:20 wt% sand:plaster mixture (SPCTIN06 in Table 2)—arrows indicate magnitude and orientation of calculated displacement vectors: (Left column) Horizontal (longitudinal) strain, shortening is negative/blue; (Central left column) Vertical (axial) strain, shortening is negative/blue; (Central right column) Horizontal rotational shear strain around the z-axis, anticlockwise rotation is positive/blue; (Right column) Maximum shear strain.
In high-strength materials (50:50; Figure 11), intrusion onset is characterized also by radially outward displacement (Figure 11A), but unlike in low-strength materials (Figure 9A), no material is displaced vertically downward and compressed at the intrusion's base. In this first phase, the dike itself shows dominantly horizontal extension, which is accommodated by horizontal contraction in the host material at the dike walls and by vertical contraction above the dike tip. In a second phase (Figure 11B), upward propagation of the dike is characterized by an inverted cone shape volume that is linked to the dike base and in which displacements are upward and outward from the dike, indicating a dominantly opening-mode fracture. The patterns of host material contraction are similar to before (Figure 11A), but maximum shear strain values are highest in a bulb-shaped volume around the rising dike tip (Figure 11B). The largely horizontal displacement on the dike's side walls produces a downward-propagating, opening-mode fracture at the surface above the intrusion tip, which is seen as a zone of relatively low horizontal extension near the model surface. In a third phase (Figure 11C), the intrusion now interacts more with the surface as it links with the downward-propagating opening-mode fracture. The cone-shaped volume of host material uplift becomes strongly asymmetric: one of the two sides of the fluid-filled fracture is displaced upward and outward more than the other. The model surface is uplifted in an asymmetric or trapdoor-like fashion. The zones of highest displacement are now located in the host material around the upper half of the dike. The zones of maximum horizontal extension, vertical contraction and shear strain around the dike tip migrate upward accordingly. As they do so, areas that were under vertical contraction ahead of the dike tip now undergo vertical extension and horizontal contraction as they become the dike walls (Figure 11C). In a final phase (Figure 11D), the dike reaches the surface, and the patterns of displacement and strain migrate further upward to become focused in the shallowest part of the overburden.
The cumulative strain patterns for the three experiments further differ. In low-strength materials, most of the cumulative strain is distributed within and around the cryptodome intrusion close to the inlet (Figure 9F), while in medium- (Figure 10F) and high-strength (Figure 11E) materials most of the cumulative strain is localized along the entire length of the thin, fluid-filled sheet fracture and the immediately surrounding host material.
Discussion
CT Image Quality and DVC Precision
Medical CT imaging allows us to visualize the interior of optically opaque granular material. Our results show that medical wide beam X-ray CT provides novel advantages over standard CT scanners for gaining unique insights into the mechanisms of subsurface magma propagation as modeled in laboratory experiments. The short detectors of standard CT scanners (4–8 cm) require minute-long helical scanning, during which the model deformation has to be paused. This can be done with tectonic laboratory models which involve externally forced deformation (Schreurs et al., 2003; Adam et al., 2013; Zwaan et al., 2018), but it is impracticable once analog magma intrusion has initiated. That is why Poppe et al. (2015) used radiographs, rather than 3D CT scans, to monitor their laboratory model development. Wide beam CT detectors (16 cm) allow syn-experiment dynamic scanning of the stationary model box and the acquisition of time-series of 3D CT images with a much higher signal:noise ratio compared to helical imaging at standard CT-scanners. The slow rotation speeds (26 s for one 3D image) and large voxel sizes (1 mm) used by Rincón et al. (2018) make imaging complex intrusion geometries and overburden faulting patterns difficult and DVC application impossible. Image noise was sufficiently low in our case and, in contrast to the existing analog CT studies (Adam et al., 2013; Zwaan et al., 2018), imaging several times at each time step and stacking CT images to improve image texture proved unnecessary. Instead, the sufficiently small voxel sizes and the high frequency of image acquisition (1 s) at our wide beam CT set-up enabled a complete 4D (3D + time) view of the growth of analog intrusions and the development of deformation structures induced in the granular host material.
Panien et al. (2006) showed that sufficient grayscale contrast between different materials in CT images is obtained when their X-ray value differs by at least 100 HU. This criterion is obtained in our experiments, because golden syrup has a low X-ray attenuation of ~300 HU and the denser sand-plaster mixtures range between 500 and 800 HU (Appendix B). The overlap of X-ray attenuation for individual grains of different chemical composition, the air-filled intergranular pores and the syrup is large, however. Additionally, the coarse imaging resolution means that voxels commonly represent a mixed volume of grains, pore space and/or fluid. This results in difficulties for the seed growth segmentation algorithm to discriminate thin parts of the golden syrup intrusions from the surrounding sand-plaster material. Manual attribution of such voxels to one or the other reduces this problem, but is time-consuming. Segmentation is much more straightforward in low-strength material, where the dense percolation aureole of syrup into the granular material provides sharp X-ray value gradients that easily allow segmenting the intrusion volume. The ability to visualize the 3D geometry of syrup intrusions in high detail at any time step during the intrusion process is a unique feature of the presented laboratory method, and a clear advantage for comparison to geophysical monitoring data in nature.
A model box width of 20 cm was found to be the upper limit to acquire images of a satisfactorily high signal:noise ratio, because of the high density of sand and plaster (noise index = 14). Mourgues and Cobbold (2003) found that when the ratio of the overburden height to the container width is higher than ~0.53 in pure sand, a silo effect is detectable and vertical overburden load is counteracted at least partially by friction at the box side walls. At 8 cm material height, no detectable syn-experiment surface elevation change (SPCTIN06; Figure 6) and no interior 3D displacement or strain occurs near the box edges (Figure 10). At 12 cm material height, very minor cumulative 3D displacements and strains can be detected in the model interior at the box edges, but these are much smaller compared to the values that characterize the intrusion process (SPCTIN02, Figure 9 & SPCTIN04, Figure 11). This effect is notable specifically for the cumulative rotational shear strain in the high-strength example (Figure 11E). These are absent however in the incremental time steps, suggesting that edge effects are negligible when looking at short time increments of deformation, but might play a minor role in the general emplacement behavior of an entire syrup intrusion event at roof aspect ratios above ~0.6.
The precision of displacement vectors calculated with modern DVC algorithms is typically claimed to be 0.05–0.1 voxel size (Li and Morgan, 2009; Pannier et al., 2010). Taking the upper bound to account for image quality, image texture and subvolume size, the vector length precision in our experiments should to be in the order of 0.050 mm. We found median pre-experiment displacements of ~0.10 ± 0.05 mm, even ~0.29 ± 0.46 in the example in Figure 4B, where in practice no displacement occurs. The precision of the displacement vector length results is thus probably rather in the order of half to one voxel sizes, but robustly represents realistic 3D displacement fields that occur in the laboratory models. By comparison, structure-from-motion photogrammetry reaches precisions of 0.05 mm on a 40 × 40 cm surface (Galland et al., 2016). The precision obtained with CT proves nevertheless high enough to study incremental deformation in 3D throughout the entire model volume, as opposed to what was possible before in typical laboratory model set-ups.
Contributions of CT: Intrusion Development and Magma Propagation
A variety of parameters has been proposed to control the wide range of magma intrusion geometries. Material properties include the density and viscosity of the magma, as well as the density, strength and mechanical heterogeneity and anisotropy of the host rock. Important geometric parameters include intrusion depth and surface topography, while dynamic parameters of the intrusion process include the magmatic pressure evolution and propagation velocity (cfr. Kavanagh et al., 2018). Host rock strength has been a particular point of interest for analog modeling studies (Mathieu et al., 2008; Abdelmalak et al., 2016; Guldstrand et al., 2017), but has also been shown to be a controlling factor in numerical models (e.g., Grosfils et al., 2013; Gerbault et al., 2018). With a varying ratio of sand to plaster and with other parameters held constant, our experiments confirm that thick cryptodome intrusions form in low-strength, loose or weakly consolidated sediments, while thin dikes form in high-strength materials such as limestones and other well-consolidated rocks (cfr. Mathieu et al., 2008) (Figure 8). In between these two end-members lies a range of hybrid cone sheets. A cone sheet to dike regime transition line in our experiments has a slope similar to that of Galland et al. (2014), although shifted laterally in ∏1 vs. ∏2 space. This discrepancy may arise from differences in experimental materials and from uncertainties regarding their properties, as well as the fact that the dimensionless parameter values explored in this study are slightly higher than those explored by Galland et al. (2014). Our values still lie well within natural ranges of occurrence of dikes and cone sheets (Table 1).
While standard laboratory monitoring techniques only enable access to the final 3D intrusion geometry, the dynamic CT imagery accesses the 3D geometrical development of the analog intrusions. Our experiments hence provide new insights into how the contrasting cryptodome, cone sheet and dike geometries develop in the subsurface. Regardless of the host rock strength, the initiation phase of all intrusions is associated with an axisymmetric displacement field, with displacements directed radially outwards from the initiation point. Such an initial displacement field is similar to that derived from the point pressure source widely used in geodetic inversion models (Mogi, 1958). In low-strength material, a spherical intrusion develops from this displacement field due to distributed strain accommodation in the host material. In high-strength material, intrusion occurs into a set of opening-mode fractures reflecting highly localized strain accommodation.
A thick syrup percolation aureole forms around cryptodome intrusions in the low-strength material (Figure 5). Such percolation is much reduced or absent around fingers that propagate rapidly from the slowly inflating main intrusion body (Figure 5E). Limited percolation occurs around the syrup inlet in the medium- to high-strength material (Figure 6). This difference between low-strength and medium- and high-strength material may result from high permeability or a decreased threshold of capillary entry pressure in low-strength materials. While our sand-plaster mixtures overall simulate “dry-rock conditions”—i.e., no pore fluid pressure -, the percolation aureole itself is effectively a zone of elevated pore pressure with a probably unrealistically sharp boundary delimiting the presence/absence of pore fluids. Laboratory rock mechanics experiments show that lithostatic pore fluid pressures decrease a rock's effective strength (Jaeger et al., 2007). Consequently, reservoir rupture is favored at lower magma overpressure in elastic models that take into account lithostatic pore fluid pressure (Gudmundsson, 2012), while much higher magma overpressures are needed to fail a reservoir's wall in dry-rock elastic models (Grosfils et al., 2013). Exploration of such effects is not possible in our sand-box models however. Measurements of the strength of mixtures of sand and liquids has shown that the cohesion of such a mixture increases with respect to the dry material due to the liquid's surface tension (van Mechelen, 2004) up to a saturation point, after which the granular material is expected to lose its strength and becomes liquefied. We therefore expect that the percolating syrup increases the strength (i.e., cohesion) of the sand-plaster mixtures in our models initially, and may assist inflation of the intrusions before increased syrup overpressures can lead to cryptodome wall rupture and initiation of the finger and leaf-shaped intrusions. This assistance in the low-strength host material should be a small effect, however, because thick intrusion geometries similar to the ones in our experiments develop as well in laboratory models that used other analog materials in which percolation is very limited (Galland et al., 2006, 2014; Mathieu et al., 2008; Abdelmalak et al., 2012; Schmiedel et al., 2017; Guldstrand et al., 2018).
In a second phase, strain localization is seen to migrate into the overburden above the intrusion, but its nature varies with host material strength. In low-strength material, displacement of the overburden occurs mainly as uplift as strain localizes within a conical ring fault that propagates from the lateral edges of the cryptodome toward the surface (Figures 5, 9; Supplementary Material). This process is well-known both in laboratory and numerical models (Marti et al., 1994; Gudmundsson, 2007; Gerbault et al., 2018). In medium-strength material, the intrusion propagates laterally in a horizontal disk shape, until it reaches a critical diameter (Haug et al., 2018) and a conical mixed-mode ring fracture with a dominant opening-mode component nucleates in the overburden (Figures 6, 10). The observed opening-mode dominance is remarkable, because shear failure is predicted to dominate ring fault initiation in numerical models (Gerbault et al., 2018) and laboratory models using silica flour (Abdelmalak et al., 2012; Guldstrand et al., 2018). In high-strength material, displacement of the overburden is directed both upward and outward with strain localized around and ahead of the propagating dike tip and along the dike walls (Figures 7, 11). Surface deformation in this second phase is dome-shaped in low- and medium-strength materials, making it hard to distinguish a cryptodome from a cone sheet intrusion based on surface deformation alone (Figures 5C, 6C). In high-strength materials the surface deformation is a subdued broad arch (Figure 7). The first opening-mode fractures that open at the model surface in medium-strength overburden are positioned above the flat-lying center of cone sheets. The intrusions that propagate from cryptodomes in low-strength host material or the sill-like center of intrusions in medium-strength host material are always steeply inclined and oriented circumferentially with respect to the main intrusion body. Both observations are in agreement with predictions from “dry-rock” elastic models (Grosfils et al., 2013), but are in conflict with predictions of interpreted radial dike initiation at the lateral edges of a magma reservoir in elastic models that include lithostatic pore pressure (Gudmundsson, 2012). More detailed DVC analysis of shorter time increments in those critical locations in the overburden should be a focus of future work to explain these contradictions.
In a third phase, incremental displacement and strain fields in the host material tend to become markedly asymmetric, reflecting asymmetric, or tilted intrusion geometries at depth. In low-strength material, the strain localizes above the center of the intrusion, such that slip on the ring fault around the intrusion largely ceases. In medium-strength material, displacement concentrates along the ring fault. It accommodates the upward propagation of analog magma along its entire circumference to form a symmetric cone sheet, or only along a portion of the ring fault to form an inclined, leaf-shaped sheet, similar to findings of Schmiedel et al. (2017). In high-strength material, the strain and displacements are focused on the upper part of the ascending dike. Strain and displacements associated with the lower part of the dike become reduced, although the vertical longitudinal strains in the dike wall switch from dike-parallel contraction prior to the arrival of the dike tip at a particular level to dike-parallel extension after the tip has passed that level. Such a switch in strain regime may be evidenced by cross-cutting small-scale structures (fractures) in outcrop.
In a fourth and last phase, incremental strain and displacements are associated with the conduit bringing the analog magma to the surface. In low- or medium-strength material, this conduit is a thick finger, leaf or cone sheet that grows from the top of the intrusion, often asymmetrically into only a portion of the conical ring fault. Markedly, fingers or sheet tips often intrude into secondary faults or fractures (Haug et al., 2017, 2018); this highlights the preference of an intrusion to choose the path of least resistance (Figures 5, 6). Examples of intrusions of magma fingers and dikes into faults and fractures are prevalent in nature, e.g., in the shallow plumbing system of the Lemptégy scoria cone in France, which corresponds to low-strength material (Mathieu et al., 2008; Delcamp et al., 2014). High-resolution seismicity recorded during the Bardarbunga 2014 dike intrusion on Iceland revealed a clear preference of the magma to propagate into pre-existing fractures created in the high-strength host rock by the extensional tectonic regime (Sigmundsson et al., 2014; Ágústsdóttir et al., 2016; Ruch et al., 2016).
In the cone sheet and dike examples (Figures 6, 7, 10, 11), the presence of high material strength means that, as the tip of the fluid-filled fracture propagates upwards, there is a level within the overburden from where it becomes subject to the influence of the free surface, an effect well-document in elasticity-based numerical models (e.g., Dahm, 2000a; Sigmundsson et al., 2014; Maccaferri et al., 2015; Rivalta et al., 2015). This is evidenced by V- and cup-shaped upper intrusion parts, as well as inclined upper parts of dikes, developed in our analog magma intrusions and seen in previous experiments with granular materials (Mathieu et al., 2008; Abdelmalak et al., 2012). The depth of initiation of such dip angle transitions and splays most likely corresponds to the material-dependent transition of shallow opening-mode-dominated behavior to deeper mixed-mode or shear-dominated behavior (Jaeger et al., 2007; Mourgues et al., 2011; Abdelmalak et al., 2016). This effect is the most notable in the development of the eventual eruptive fissures in the cone sheet and dike examples, that propagate as an opening-mode fracture downwards from the surface, and connect to the syrup-filled fractures at depth that are either mixed-mode (opening and shear) as in the fingers and cone sheets or opening-mode as in the dikes (Figures 10, 11).
In the cryptodome example, shear strain is focused around the finger or leaf and the surface uplift concentrates directly above it, toward the eventual break-out point at surface. The evolution from symmetric to asymmetric surface deformation (Guldstrand et al., 2017, 2018) is thus a consequence of the evolution of intrusion-induced displacements and strain from an initially symmetric and wide distribution around the injection point to a narrowly focused volume around an off-shoot finger or leaf-shaped sheet. The strong asymmetry of strain and displacement in the dike model reflects the inclination or V-shaped bifurcation of the upper-most section of the dike (Figure 6D). The asymmetry seen in displacement fields produced by model finger and dike intrusions is seen also at Fernandina, and is similarly inferred to be the result of a late-stage tilted geometry of the uppermost section of the dikes beneath the eruption sites (Bagnardi et al., 2013; Chestler and Grosfils, 2013).
The overall doming uplift pattern of surface displacement associated with dikes in our models is like that obtained in previous experiments of pressurized fluid injection into granular materials (e.g., Abdelmalak et al., 2012; Guldstrand et al., 2017). Such a simple doming pattern differs from the dike-related bulges-and-trough displacement pattern commonly observed in regional tectonic settings and on many volcanic edifices (e.g., Lundgren et al., 2013; Sigmundsson et al., 2014). The classic bulges-and-trough displacement profile is reproduced in experiments of pressurized fluid injection in gelatin (Kavanagh et al., 2018) and in experiments of a widening rigid body at fixed depth in granular materials (Mastin and Pollard, 1988; Trippanera et al., 2015). Our experimental results differ from those of the latter two works in particular in that the dike-perpendicular widening occurs within an overall upward-and-outward displacement field, and so a net central subsidence above the dike tip is not seen (Figure 11). Nonetheless, similar dome-like displacement patterns lacking a central subsidence area have been recorded geodetically above suspected dikes in some volcanic edifices (Peltier et al., 2017). Our experimental dikes may therefore be analogous to certain instances of shallow-level dike emplacement in volcanic edifices, although further investigation is needed to test this hypothesis.
Overall, the quantified displacement vectors and derived strains demonstrate how in low-strength materials the emplacement of thick cryptodome intrusions is accommodated largely by distributed, perhaps brittle-ductile or even ductile, strains in the host-material around the intrusion. Such mechanism is probably most similar to the local emplacement of magma at the basin scale in low-strength crustal rocks, such as shales (Pollard et al., 1975; Schofield et al., 2012; Spacapan et al., 2017). The ∏2 scaling parameter suggests that the same mechanism might dominate when higher-viscosity magma intrudes, but we did not test that. In high-strength granular materials, opening-mode fractures develop as strain is more localized and possibly more brittle. Overall the experiments indicate that a transition exists in emplacement mechanism from mixed-mode viscous indentation at low strength to a deformation mode approaching classic hydraulic fracturing at high strength. The 4D imaging and displacement quantification of magma intrusion experiments by using CT and DVC thus confirms that numerical inverse modeling of surface deformation data ideally should take into account the strength and complex rheology of crustal rock as well as the associated mechanisms of magma intrusion and host rock deformation evidenced in our laboratory models and numerical models applied to e.g., Darwin Volcano, Galapagos (Manconi et al., 2007), Long Valley, U.S.A. (Long and Grosfils, 2009) or Piton de La Fournaise, La Réunion Island (Holohan et al., 2017).
Conclusions
This study reports on the novel combination of state-of-the-art wide beam X-ray Computed Tomography (CT) and Digital Volume Correlation (DVC) to dynamically image in 4D (3D + time) the geometrical development of analog magma intrusions (golden syrup) and quantify the induced displacements and strain in its granular host material (sand and plaster).
The power of the method was evidenced through a systematic series of experiments that demonstrates how the strength of a granular host material affects the 3D geometrical development of analog magma intrusions. Thick cryptodome intrusions with finger- and leaf-shaped protrusions form in low-strength material. Transitional thinner cone sheets form in medium-strength materials. Thin vertical sheet intrusions—i.e., dikes—form from triple-branched star-shaped opening-mode fractures in high-strength materials of sufficient overburden height.
The CT imaging enabled documentation of how in low-strength material strain is initially distributed above growing cryptodomes, and of how it eventually localizes on mixed-mode fractures that bound an inverted cone-shaped region of overburden uplift. In medium-strength material, those overburden fractures form through more dominantly opening-mode mechanisms. In high-strength material, formation of opening-mode vertical fractures dominates, and is accompanied by the localization and progressive upward migration of strain and displacement around the propagating intrusion tip. While numerical and laboratory models of magma intrusion in a linearly elastic medium previously simulated only tensile opening of hydraulic fractures, our experiments demonstrate how magma intruding in a material with complex rheology can induce both opening-mode fluid-filled fractures and the development of mixed-mode (opening plus shear) fractures in complex 3D deformation patterns.
Overall, this study establishes the combination of dynamic wide beam CT and DVC as useful techniques to acquire new insights into a complexly-evolving process of coupled fluid-solid deformation from laboratory experiments. Remote sensing techniques and analytical and numerical geodetic inversion models used in volcano monitoring are now increasingly providing a dynamic view of surface deformation induced by magma intrusion over time. Comparing such data from nature to laboratory models of magma intrusion in granular materials as imaged with the state-of-the-art techniques used here has the potential to generate new insights into the time-dependent, 3D geometrical development of magmatic intrusions and the associated deformation in the upper part of the Earth's crust.
Data Availability
The datasets generated for this study are available on request to the corresponding author.
Author Contributions
SP led this work as part of his Ph.D. project supervised by MK. OG, EH, and MK contributed to the experimental design, interpretation of the results and revision of the text. NB and GV contributed to the experimental design, X-ray value quantification and CT scanning. BK wrote the CT volume resampling code and accompanying methodology. P-YT and SP wrote the MATLAB® (The Mathworks, Inc.,) script for extracting surface deformation from CT scans. DH and AN provided the DaVis software license and support with DVC calculations, precision assessment and interpretation. JB measured viscosities of golden syrup and wrote the accompanying Appendix section.
Funding
SP is funded by an Aspirant Ph.D. fellowship from the FWO-Flanders, Belgium and the Belgian foundation VOCATIO. NB, GV, and BK are supported by an academic interdisciplinary Research Project grant from the Vrije Universiteit Brussel, Belgium (Grant IRP10 KARMA-4D). LaVision Ltd., provided a monthly academic discount license and technical support for using the Strainmaster DVC module of their DaVis software.
Conflict of Interest Statement
DH and AN were both employed by company LaVision UK Ltd.
The remaining authors declare that the research was conducted in the absence of any commercial or financial relationships that could be construed as a potential conflict of interest.
Acknowledgments
The UZ Brussel Radiology Department and Prof. Dr. Johan de Mey are thanked for making their medical CT facilities available at no cost. The FYSC group and Prof. Dr. Guy Van Assche are thanked for making their rheometers available at no cost. Luc Deriemaeker (VUB) is thanked for building the model boxes and setting up the syringe pump. M. Philippon is thanked for editorial handling. Reviewer E. Grosfils and reviewer considerably helped in improving this manuscript. J. Adam, M. Boone, A. Delcamp, P. Grosse, F. Guldstrand, E. Mae-Paguican, S. Poppe, T. Schmiedel, G. Schreurs, J. van Stappen, and F. Zwaan are thanked for valuable discussions.
Supplementary Material
The Supplementary Material for this article can be found online at: https://www.frontiersin.org/articles/10.3389/feart.2019.00062/full#supplementary-material
Movie S1. Time-lapse movie of X-ray CT images of golden syrup cryptodome intrusion experiment SPCTIN02 in a 90 wt% sand-10 wt% plaster mixture, acquired at UZ Brussels, Belgium; Upper left: 3D model surface rendering; Upper right: saggital (N-S) vertical cross-section; Bottom left: 3D syrup intrusion rendering; Bottom right: axial (E-W) vertical cross-section.
Movie S2. Time-lapse movie of X-ray CT images of golden syrup cone sheet intrusion experiment SPCTIN06 in a 80 wt% sand-20 wt% plaster mixture, acquired at UZ Brussels, Belgium; Upper left: plan-view model surface rendering; Upper right: saggital (N-S) vertical cross-section; Bottom left: 3D model surface rendering; Bottom right: axial (E-W) vertical cross-section.
Movie S3. Time-lapse movie of X-ray CT images of golden syrup dike intrusion experiment SPCTIN04 in a 50 wt% sand-50 wt% plaster mixture, acquired at UZ Brussels, Belgium; Upper left: plan-view model surface rendering; Upper right: saggital (N-S) vertical cross-section; Bottom left: 3D model surface rendering; Bottom right: axial (E-W) vertical cross-section.
Appendix A. Golden Syrup Viscosity.
Appendix B. Material X-ray Attenuation.
References
Abdelmalak, M. M., Bulois, C., Mourgues, R., Galland, O., Legland, J. B., and Gruber, C. (2016). Description of new dry granular materials of variable cohesion and friction coefficient: implications for laboratory modeling of the brittle crust. Tectonophysics 684, 39–51. doi: 10.1016/j.tecto.2016.03.003
Abdelmalak, M. M., Mourgues, R., Galland, O., and Bureau, D. (2012). Fracture mode analysis and related surface deformation during dyke intrusion: results from 2D experimental modelling. Earth Planetar. Sci. Lett. 359–360, 93–105. doi: 10.1016/j.epsl.2012.10.008
Acocella, V., and Neri, M. (2009). Dike propagation in volcanic edifices: overview and possible developments. Tectonophysics 471, 67–77. doi: 10.1016/j.tecto.2008.10.002
Adam, J., Klinkmüller, M., Schreurs, G., and Wieneke, B. (2013). Quantitative 3D strain analysis in analogue experiments simulating tectonic deformation: integration of X-ray computed tomography and digital volume correlation techniques. J. Struct. Geol. 55, 127–149. doi: 10.1016/j.jsg.2013.07.011
Ágústsdóttir, T., Woods, J., Greenfield, T., Green, R. G., White, R. S., Winder, T., et al. (2016). Strike-Slip Faulting during the 2014 Bároarbunga-Holuhraun Dike Intrusion, Central Iceland. Geophys. Res. Lett. 43, 1495–1503. doi: 10.1002/2015GL067423
Bagnardi,M., Amelung, F., and Poland, M. P. (2013). A new model for the growth of basaltic shields based on deformation of Fernandina Volcano, Galápagos Islands. Earth Planetary Sci. Lett. 377–378, 358–366. doi: 10.1016/j.epsl.2013.07.016
Barenblatt, G. I. (2003). Scaling. Cambridge: Cambridge University Press. doi: 10.1017/CBO9780511814921
Battaglia, M., Cervelli, P. F., and Murray, J. R. (2013). Modeling crustal deformation near active faults and volcanic centers-a catalog of deformation models. US Geolog. Survey Techniq. Methods Book 13:96. doi: 10.3133/tm13B1
Beckett, F. M., Mader, H. M., Phillips, J. C., Rust, A. C., and Witham, F. (2011). An experimental study of low-reynolds-number exchange flow of two newtonian fluids in a vertical pipe. J. Fluid Mech. 682, 652–670. doi: 10.1017/jfm.2011.264
Bertelsen, H. S., Rogers, B. D., Galland, O., Dumazer, G., and Abbana Bennani, A. (2018). Laboratory modeling of coeval brittle and ductile deformation during magma emplacement into viscoelastic rocks. Front. Earth Sci. 6:199. doi: 10.3389/feart.2018.00199
Bistacchi, A., Tibaldi, A., Pasquarè, F. A., and Rust, D. (2012). The association of cone-sheets and radial dykes: data from the isle of skye (UK), numerical modelling, and implications for shallow magma chambers. Earth Planetary Sci. Lett. 339–340, 46–56. doi: 10.1016/j.epsl.2012.05.020
Brenguier, F. P., Kowalski, N., Ackerley, N., Nakata, P., Boué, M., Campillo, M., et al. (2016). Toward 4D noise-based seismic probing of volcanoes: perspectives from a large- n experiment on piton de la fournaise volcano. Seismol. Res. Lett. 87, 15–25. doi: 10.1785/0220150173
Burchardt, S., Troll, V. R., Mathieu, L., Emeleus, H. C., and Donaldson, C. H. (2013). Ardnamurchan 3D cone-sheet architecture explained by a single elongate magma chamber. Scient. Rep. 3, 1–7. doi: 10.1038/srep02891
Calais, E., d'Oreye, N., Albaric, J., Deschamps, A., Delvaux, D., Déverchère, J., et al. (2008). Strain accommodation by slow slip and dyking in a youthful continental rift, East Africa. Nature 456, 783–787. doi: 10.1038/nature07478
Chestler, S. R., and Grosfils, E. B. (2013). Using numerical modeling to explore the origin of intrusion patterns on fernandina volcano, Galapagos Islands, Ecuador. Geophys. Res. Lett. 40, 4565–4569. doi: 10.1002/grl.50833
Cnudde, V., and Boone, M. N. (2013). High-resolution X-ray computed tomography in geosciences: a review of the current technology and applications. Earth-Sci. Rev. 123, 1–17. doi: 10.1016/j.earscirev.2013.04.003
Dahm, T. (2000a). Numerical simulations of the propagation path and the arrest of sluid-filled fracture in the earth. Geophys. J. Int. 141, 623–638. doi: 10.1046/j.1365-246x.2000.00102.x
Dahm, T. (2000b). On the shape and velocity of fluid- filled fractures in the earth. Geophys. J. Int. 142, 181–192. doi: 10.1046/j.1365-246x.2000.00148.x
Delcamp, A., van Wyk de Vries, B., James, M. R., Gailler, L. S., and Lebas, E. (2012). Relationships between volcano gravitational spreading and magma intrusion. Bull. Volcanol. 74, 743–765. doi: 10.1007/s00445-011-0558-9
Delcamp, A., van Wyk de Vries, B., Petit, S., and Kervyn, M. (2014). Endogenous and exogenous growth of the monogenetic lemptégy volcano, Chaîne Des Puys, France. Geosphere 10, 998–1019. doi: 10.1130/GES01007.1
Donnadieu, F., Merle, O., and Besson, J. C. (2001). Volcanic edifice stability during cryptodome intrusion. Bull. Volcanol. 63, 61–72. doi: 10.1007/s004450000122
Ebmeier, S. K., Andrews, B. J., Araya, M. C., Arnold, D. W. D., Biggs, J., Cooper, C., et al. (2018). Synthesis of global satellite observations of magmatic and volcanic deformation: implications for volcano monitoring and the lateral extent of magmatic domains. J. Appl. Volcanol. 7, 1–26. doi: 10.1186/s13617-018-0071-3
Fedorov, A., Beichel, R., Kalpathy-Cramer, J., Finet, J., Fillion-Robin, J. C., Pujol, S., et al. (2012). 3D slicer as an image computing platform for the quantitative imaging network. Magnet. Resonan. Imaging 30, 1323–1341. doi: 10.1016/j.mri.2012.05.001
Fernández, J., Pepe, A., Poland, M. P., and Sigmundsson, F. (2017). Volcano geodesy: recent developments and future challenges. J. Volcanol. Geother. Res. 344, 1–12. doi: 10.1016/j.jvolgeores.2017.08.006
Galland, O., Bertelsen, H. S., Guldstrand, F., Girod, L., Johannessen, R. F., Bjugger, F., et al. (2016). Application of open-source photogrammetric software micmac for monitoring surface deformation in laboratory models. J. Geophys. Research-Solid Earth 2, 1–21. doi: 10.1002/2015JB012564
Galland, O., Burchardt, S., Hallot, E., Mourgues, R., and Bulois, C. (2014). Dynamics of dikes versus cone sheets in volcanic systems. J. Geophys. Res. 119, 6178–6192. doi: 10.1002/2014JB011059
Galland, O., Cobbold, P. R., Hallot, E., de Bremond d'Ars, J., and Delavaud, G. (2006). Use of vegetable oil and silica powder for scale modelling of magmatic intrusion in a deforming brittle crust. Earth Planetary Sci. Lett. 243, 786–804. doi: 10.1016/j.epsl.2006.01.014
Galland, O., Holohan, E. P., van Wyk de Vries, B., and Burchardt, S. (2018). “Laboratory modelling of volcano plumbing systems: a review,” in Physical Geology of Shallow Magmatic Systems - Dykes, Sills and Laccoliths, eds C. Breitkreuz and S. Rocchi (Heidelberg: Springer), 147–214. doi: 10.1007/11157_2015_9
Gerbault, M., Hassani, R., Lizama, C. N., and Souche, A. (2018). Three-dimensional failure patterns around an inflating magmatic chamber. Geochem. Geophys. Geosyst. 19, 749–771. doi: 10.1002/2017GC007174
Grosfils, E. B., McGovern, P. J., Gregg, P. M., Galgana, G. A., Hurwitz, D. M., Long, S. M., et al. (2013). Elastic models of magma reservoir mechanics: a key tool for investigating planetary volcanism. Geolog. Soc. London Special Publ. 401, 239–267. doi: 10.1144/SP401.2
Gudmundsson, A. (2007). Conceptual and numerical models of ring-fault formation. J. Volcanol. Geoth. Res. 164, 142–160. doi: 10.1016/j.jvolgeores.2007.04.018
Gudmundsson, A. (2011). Deflection of dykes into sills at discontinuities and magma-chamber formation. Tectonophysics 500, 50–64. doi: 10.1016/j.tecto.2009.10.015
Gudmundsson, A. (2012). Magma chambers: formation, local stresses, excess pressures, and compartments. J. Volcanol. Geother. Res. 237–238, 19–41. doi: 10.1016/j.jvolgeores.2012.05.015
Guldstrand, F., Burchardt, S., Hallot, E., and Galland, O. (2017). Dynamics of surface deformation induced by dikes and cone sheets in a cohesive coulomb brittle crust. J. Geophys. Res. 122, 8511–8524. doi: 10.1002/2017JB014346
Guldstrand, F., Galland, O., Hallot, E., and Burchardt, S. (2018). Experimental constraints on forecasting the location of volcanic eruptions from pre-eruptive surface deformation. Front. Earth Sci. 6, 1–9. doi: 10.3389/feart.2018.00007
Haug, Ø. T., Galland, O., Souloumiac, P., Souche, A., Guldstrand, F., and Schmiedel, T. (2017). Inelastic damage as a mechanical precursor for the emplacement of saucer-shaped intrusions. Geology 45, 1099–1102. doi: 10.1130/G39361.1
Haug, Ø. T., Galland, O., Souloumiac, P., Souche, A., Guldstrand, F., Schmiedel, T., et al. (2018). Shear versus tensile failure mechanisms induced by sill intrusions - implications for emplacement of conical and saucer-shaped intrusions. J. Geophys. Res. 123, 1–20. doi: 10.1002/2017JB015196
Holland, M., van Gent, H., Bazalgette, L., Yassir, N., Hoogerduijn Strating, E. H., and Urai, J. L. (2011). Evolution of dilatant fracture networks in a normal fault - evidence from 4D model experiments. Earth Planetary Sci. Lett. 304, 399–406. doi: 10.1016/j.epsl.2011.02.017
Holohan, E. P., Sudhaus, H., Walter, T. R., Schöpfer, M. P. J., and Walsh, J. J. (2017). Effects of host-rock fracturing on elastic-deformation source models of volcano deflation. Scient. Rep. 7:10970. doi: 10.1038/s41598-017-10009-6
Hubbert, M. K. (1937). Theory of scale models as applied to the study of geologic structures. GSA Bull. 48, 1459–1520. doi: 10.1130/GSAB-48-1459
Jaeger, J. C., Cook, N. G. W., and Zimmerman, R. W. (2007). Fundamentals of Rock Mechanics. Oxford: Blackwell Publishing, 475.
Kavanagh, J. L., Engwell, S., and Martin, S. (2018). A review of analogue and numerical modelling in volcanology. Solid Earth 9, 531–571. doi: 10.5194/se-2017-40
Kervyn, M., Boone, M. N., van Wyk de Vries, B., Lebas, E., Cnudde, V., Fontijn, K., et al. (2010). 3D imaging of volcano gravitational deformation by computerized X-ray micro-tomography. Geosphere 6, 482–498. doi: 10.1130/GES00564.1
Koehn, D., Steiner, A., and Aanyu, K. (2019). Modelling of extension and dyking-induced collapse faults and fissures in rifts. J. Struct. Geol. 118, 21–31. doi: 10.1016/j.jsg.2018.09.017
Le Corvec, N., and Walter, T. R. (2009). Volcano spreading and fault interaction influenced by rift zone intrusions: insights from analogue experiments analyzed with digital image correlation technique. J. Volcanol. Geother. Res. 183, 170–182. doi: 10.1016/j.jvolgeores.2009.02.006
Li, L., and Morgan, E. F. (2009). Accuracy and precision of digital volume correlation in quantifying displacements and strains in trabecular bone. J. Biomech. 40, 3516–3520. doi: 10.1016/j.jbiomech.2007.04.019
Lohrmann, J., Kukowski, N., Adam, J., and Oncken, O. (2003). The impact of analogue material properties on the geometry, kinematics, and dynamics of convergent sand wedges. J. Struct. Geol. 25, 1691–1711. doi: 10.1016/S0191-8141(03)00005-1
Long, S. M., and Grosfils, E. B. (2009). Modeling the effect of layered volcanic material on magma reservoir failure and associated deformation, with application to Long Valley Caldera, California. J. Volcanol. Geother. Res. 186, 349–360. doi: 10.1016/j.jvolgeores.2009.05.021
Lundgren, P., Poland, M., Miklius, A., Orr, T., Yun, S. H., Fielding, E., et al. (2013). Evolution of dike opening during the march 2011 kamoamoa fissure eruption, Kilauea Volcano, Hawai'i. J. Geophys. Res. 118, 897–914. doi: 10.1002/jgrb.50108
Maccaferri, F., Rivalta, E., Passarelli, L., and Aoki, Y. (2015). On the mechanisms governing dike arrest: insight from the 2000 miyakejima dike injection. Earth Planetary Sci. Lett. 1, 1–11. doi: 10.1016/j.epsl.2015.11.024
Magee, C., Stevenson, C. T. E., Ebmeier, S. K., Keir, D., Hammond, J. O. S., Gottsmann, J. H., et al. (2018). Magma plumbing systems: a geophysical perspective. J. Petrol. 59, 1–35. doi: 10.1093/petrology/egy064
Manconi, A., Walter, T. R., and Amelung, F. (2007). Effects of mechanical layering on volcano deformation. Geophys. J. Int. 170, 952–958. doi: 10.1111/j.1365-246X.2007.03449.x
Marti, J., Ablay, G. J., Redshaw, L. T., and Sparks, R. S. J. (1994). Experimental study of collapse calderas. J. Geol. Soc. 151, 919–929. doi: 10.1144/gsjgs.151.6.0919
Mastin, L. G., and Pollard, D. D. (1988). Surface deformation and shallow dike intrusion processes at inyo craters, Long Valley, California. J. Geophys. Res. 93, 13221–13235. doi: 10.1029/JB093iB11p13221
Mathieu, L., van Wyk de Vries, B., Holohan, E. P., and Troll, V. R. (2008). Dykes, cups, saucers and sills: analogue experiments on magma intrusion into brittle rocks. Earth Planetary Sci. Lett. 271, 1–13. doi: 10.1016/j.epsl.2008.02.020
Mees, F., Swennen, R., Van Geet, M., and Jacobs, P. (2003). Applications of X-Ray Computed Tomography in the Geosciences. London: Geological Society of London Special Publications. 7.
Merle, O. (2015). The scaling of experiments on volcanic systems. Front. Earth Sci. 3, 1–15. doi: 10.3389/feart.2015.00026
Mogi, K. (1958). Relations between the eruptions of various volcanoes and the deformations of the ground surfaces around them. Earthq. Res. Inst. 36, 99–134.
Mourgues, R., and Cobbold, P. R. (2003). Some tectonic consequences of fluid overpressures and seepage forces as demonstrated by sandbox modelling. Tectonophysics 376, 75–97. doi: 10.1016/S0040-1951(03)00348-2
Mourgues, R., Gressier, J. B., Bodet, L., Bureau, D., and Gay, A. (2011). ‘Basin Scale’ versus ‘Localized’ pore pressure/stress coupling - implications for trap integrity evaluation. Marine Petrol. Geol. 28, 1111–1121. doi: 10.1016/j.marpetgeo.2010.08.007
Muirhead, J. D., Airoldi, G., Rowland, J. V., and White, J. D. L. (2012). Interconnected sills and inclined sheet intrusions control shallow magma transport in the ferrar large igneous province, Antarctica. Bull. Geol. Soc. Am. 124, 162–180. doi: 10.1130/B30455.1
Okada, Y. (1985). Surface deformation due to shear and tensile faults in a half space. Bull. Seismol. Soc. Am. 75, 1135–1154.
Panien, M., Schreurs, G., and Pfiffner, A. (2006). Mechanical behaviour of granular materials used in analogue modelling: insights from grain characterisation, ring-shear tests and analogue experiments. J. Struct. Geol. 28, 1710–1724. doi: 10.1016/j.jsg.2006.05.004
Pannier, Y., Lenoir, N., and Bornert, M. (2010). Discrete volumetric digital image correlation for the investigation of granular type media at microscale: accuracy assessment. EPJ Web Conferences 6:35003. doi: 10.1051/epjconf/20100635003
Peltier, A., Froger, J. L., Villeneuve, N., and Catry, T. (2017). Assessing the reliability and consistency of InSAR and GNSS data for retrieving 3D-displacement rapid changes, the example of the 2015 piton de la fournaise eruptions. J. Volcanol. Geother. Res. 344:106–120. doi: 10.1016/j.jvolgeores.2017.03.027
Pinel, V., Poland, M. P., and Hooper, A. (2014). Volcanology: lessons learned from synthetic aperture radar imagery. J. Volcanol. Geother. Res. 289, 81–113. doi: 10.1016/j.jvolgeores.2014.10.010
Poland, M. P., Peltier, A., Bonforte, A., and Puglisi, G. (2017). The spectrum of persistent volcanic flank instability: a review and proposed framework based on kilauea, Piton de La Fournaise, and Etna. J. Volcanol. Geother. Res. 339, 63–80. doi: 10.1016/j.jvolgeores.2017.05.004
Pollard, D. D., Delaney, P. T., Duffield, W. A., Endo, E. T., and Okamura, A. T. (1983). Surface deformation in volcanic rift zones. Tectonophysics 94, 541–584. doi: 10.1016/0040-1951(83)90034-3
Pollard, D. D., Otto, H. M., and Dockstader, D. R. (1975). The form and growth of fingered sheet intrusions. GSA Bull. 86, 351–363. doi: 10.1130/0016-7606(1975)86<351:TFAGOF>2.0.CO;2
Poppe, S., Holohan, E. P., Pauwels, E., Cnudde, V., and Kervyn, M. (2015). Sinkholes, pit craters, and small calderas: analog models of depletion-induced collapse analyzed by computed X-ray microtomography. Bull. Geol. Soc. Am. 127, 281–96. doi: 10.1130/B30989.1
Rincón, M., Márquez, A., Herrera, R., Alonso-Torres, A., Granja-Bruña, J. L., and van Wyk de Vries, B. (2018). Contrasting catastrophic eruptions predicted by different intrusion and collapse scenarios. Scient. Rep. 8:6178. doi: 10.1038/s41598-018-24623-5
Ritter, M. C., Leever, K., Rosenau, M., and Oncken, O. (2016). Scaling the sandbox—mechanical (dis) similarities of granular materials and brittle rock. J. Geophys. Res. 121, 6863–6879. doi: 10.1002/2016JB012915
Rivalta, E., Taisne, B., Bunger, A. P., and Katz, R. F. (2015). A review of mechanical models of dike propagation: schools of thought, results and future directions. Tectonophysics 638, 1–42. doi: 10.1016/j.tecto.2014.10.003
Ruch, J., Wang, T., Xu, W., Hensch, M., and Jónsson, S. (2016). Oblique rift opening revealed by reoccurring magma injection in central iceland. Nat. Comm. 7:12352. doi: 10.1038/ncomms12352
Schmiedel, T., Galland, O., and Breitkreuz, C. (2017). Dynamics of sill and laccolith emplacement in the brittle crust: role of host rock strength and deformation mode. J. Geophys. Res. 122, 8860–8871. doi: 10.1002/2017JB014468
Schofield, N. J., Brown, D. J., Magee, C., and Stevenson, C. T. (2012). Sill morphology and comparison of brittle and non-brittle emplacement mechanisms. J. Geol. Soc. 169, 127–141. doi: 10.1144/0016-76492011-078
Schreurs, G., Hanni, R., Panien, M., and Vock, P. (2003). Analysis of analogue models by helical X-ray computed tomography. Geol. Soc. 215, 213–223. doi: 10.1144/GSL.SP.2003.215.01.20
Schultz, R. A. (1996). Relative scale and the strength and deformability of rock masses. J. Struct. Geol. 18, 1139–1149. doi: 10.1016/0191-8141(96)00045-4
Sigmundsson, F., Hooper, A., Hreinsdóttir, S., Vogfjörd, K. S., Ófeigsson, B. G., Heimisson, E. R., et al. (2014). Segmented lateral dyke growth in a rifting event at Bárðarbunga volcanic system, iceland. Nature 517, 119–195. doi: 10.1038/nature14111
Sigmundsson, F., Parks, M., Pedersen, R., Jónsdóttir, K., Ófeigsson, B. G., Grapenthin, R., et al. (2018). Magma movements in volcanic plumbing systems and their associated ground deformation and seismic patterns. Volcan. Igneous Plumbing Syst. 285–322. doi: 10.1016/B978-0-12-809749-6.00011-X
Spacapan, J. B., Galland, O., Leanza, H. A., and Planke, S. (2017). Igneous sill and finger emplacement mechanism in shale-dominated formations: a field study at cuesta del chihuido, Neuquén Basin, Argentina. J. Geol. Soc. 174, 422–433. doi: 10.1144/jgs2016-056
Tibaldi, A. (2015). Structure of volcano plumbing systems: a review of multi-parametric effects. J. Volcanol. Geother. Res. 298, 85–135. doi: 10.1016/j.jvolgeores.2015.03.023
Townsend, M. R., Pollard, D. D., and Smith, R. P. (2017). Mechanical models for dikes: a third school of thought. Tectonophysics. 703, 98–118. doi: 10.1016/j.tecto.2017.03.008
Trippanera, D., Ruch, J., Acocella, V., and Rivalta, E. (2015). Experiments of dike-induced deformation: insights on the long-term evolution of divergent plate boundaries. J. Geophys. Res. B 120, 6913–6942. doi: 10.1002/2014JB011850
van Mechelen, J. L. M. (2004). Strength of moist sand controlled by surface tension for tectonic analogue modelling. Tectonophysics 384, 275–284. doi: 10.1016/j.tecto.2004.04.003
Wauthier, C., Cayol, V., Kervyn, F., and D'Oreye, N. (2012). Magma sources involved in the 2002 nyiragongo eruption, as inferred from an InSAR analysis. J. Geophys. Res. 117, 1–20. doi: 10.1029/2011JB008257
Yang, X. M., Davis, P. M., and Dieterich, J. H. (1988). Deformation from inflation of a dipping finite prolate spheroid in an elastic half- space as a model for volcanic stressing. J. Geophys. Res. Solid Earth 93, 4249–4257.
Yoo, T. S., Ackerman, M. J., Lorensen, W. E., Schroeder, W., Chalana, V., Aylward, S., et al. (2002). Engineering and algorithm design for an image processing api: a technical report on ITK–the insight toolkit. Studies Health Technol. Informat. 85, 586–592.
Zwaan, F., Schreurs, G., and Adam, J. (2018). Effects of sedimentation on rift segment evolution and rift interaction in orthogonal and oblique extensional settings: insights from analogue models analysed with 4D X-ray computed tomography and digital volume correlation techniques. Global Planetary Change 171, 110–133. doi: 10.1016/j.gloplacha.2017.11.002
Keywords: magma intrusion, surface deformation, analog, laboratory modeling, X-ray computed tomography, digital volume correlation
Citation: Poppe S, Holohan EP, Galland O, Buls N, Van Gompel G, Keelson B, Tournigand P-Y, Brancart J, Hollis D, Nila A and Kervyn M (2019) An Inside Perspective on Magma Intrusion: Quantifying 3D Displacement and Strain in Laboratory Experiments by Dynamic X-Ray Computed Tomography. Front. Earth Sci. 7:62. doi: 10.3389/feart.2019.00062
Received: 12 October 2018; Accepted: 13 March 2019;
Published: 04 April 2019.
Edited by:
Mélody Philippon, UMR5243 Géosciences Montpellier, FranceReviewed by:
Alessandro Tibaldi, University of Milano-Bicocca, ItalyEric B. Grosfils, Pomona College, United States
Copyright © 2019 Poppe, Holohan, Galland, Buls, Van Gompel, Keelson, Tournigand, Brancart, Hollis, Nila and Kervyn. This is an open-access article distributed under the terms of the Creative Commons Attribution License (CC BY). The use, distribution or reproduction in other forums is permitted, provided the original author(s) and the copyright owner(s) are credited and that the original publication in this journal is cited, in accordance with accepted academic practice. No use, distribution or reproduction is permitted which does not comply with these terms.
*Correspondence: Sam Poppe, sam.poppe@vub.be; sam35poppe@gmail.com