360 Intrusions in a Miniature Volcano: Birth, Growth, and Evolution of an Analog Edifice
 Allan Derrien
 Benoit Taisne
- 1Observatoire Volcanologique du Piton de la Fournaise, Institut de Physique du Globe de Paris, Paris, France
- 2Earth Observatory of Singapore, Nanyang Technological University, Singapore, Singapore
- 3Asian School of the Environment, Nanyang Technological University, Singapore, Singapore
Most volcanoes throughout the world have been monitored with geophysical data (seismology and geodesy) for no more than three decades, a relatively short time compared to their overall life. The consequence is that we lack a long observation of volcanic growth and behavior to get a more complete picture of the interaction between edifice stress state and magma transfer. Here we present the birth and evolution of a 83 x 83 cm analog model, where we reproduce for the first time volcanic growth over 360 successive intrusions (15 mL every half hour, at a rate of 3 mL/min) in an analog elasticity-dominated material (pigskin gelatine). By observing the development of this model volcano, we hope to provide insights to the study of long-term volcanic activity. In particular, we are interested in stress accumulation/release cycles and their role in the triggering of distant eruptions. Our model volcano started as a flat topography and ended 3.82 cm in height at the summit. It displayed cyclic eruptive patterns with alternating phases of eruptive and purely intrusive behavior. Alike to many intraplate volcanoes in nature, main dyke swarms produced in the experiment were disposed in a three-branched radial pattern centered above the injection source (“volcanic rift zones”). They were accompanied by two radial sill networks, at source depth and edifice base. Long-term radial compressive stress building during dyke swarming was likely compensated by radial compressive stress release during sill emplacement. Near-surface stresses, deduced from the main orientation eruptive fissures and “dry” fractures, became more localized as the volcano grew. At the end of the experiment, the shallow stress field was interpreted as generally extensional radial at the summit, extensional tangential on the flanks, and compressive radial in distal areas. This experiment showcases the potential of studying long-term stress permutations in volcanic edifices in the understanding of their morphology and successive activity phases.
Introduction
Shield oceanic island volcanoes, such as Kilauea, Piton de la Fournaise or Pico de Fogo, often form far from active tectonics boundaries. Contrary to subduction zone stratovolcanoes, which generally exhibit steep active cones, shield volcanoes are sub-circular, gentle-sloped piles of layered rock. On a such edifices, the eye of an occasional visitor can be confused by the seemingly random distribution of vents, fissure, and craters. A tourist walking on, for instance, Pico de Fogo or Piton de la Fournaise is often surprised to see cones apparently randomly scattered away from the summit. Such a view is far from the iconic idea that one might have from a single vent volcano.
Eruptive cones and fissures are born during eruptive phases, when magma transits from certain depths in the volcano plumbing system to the surface. The upper part of the volcano, where these final transfers happen, is named the distribution system (Figure 1). It literally distributes the magma supply from shallow storage zones (roughly between 0 and 10 km below the surface; e.g., Michon et al., 2015; Greenfield et al., 2016; Le Corvec and McGovern, 2018) to the surface, both spatially (as evidenced by the wide geographical repartition of eruption markers on most shield volcanoes) and temporally (because it can modulate magma input from continuous supply to discrete eruptions). Depending on the volcano, the source of magma for this final transfer can vary greatly. For instance, it can display a well-developed reservoir with a complex geometry as Kilauea (e.g., Ryan, 1988; Zhai and Shirzaei, 2016), include a single main chamber as Piton de la Fournaise (e.g., Michon et al., 2015, 2016), or have no identified voluminous shallow reservoir as Pico de Fogo (e.g., Mata et al., 2017) (Figure 1). In this ultimate phase of the volcanic fluids journey to the surface, magma usually propagates through the intrusion of dykes or sills into the host rock, if no open conduit is available.
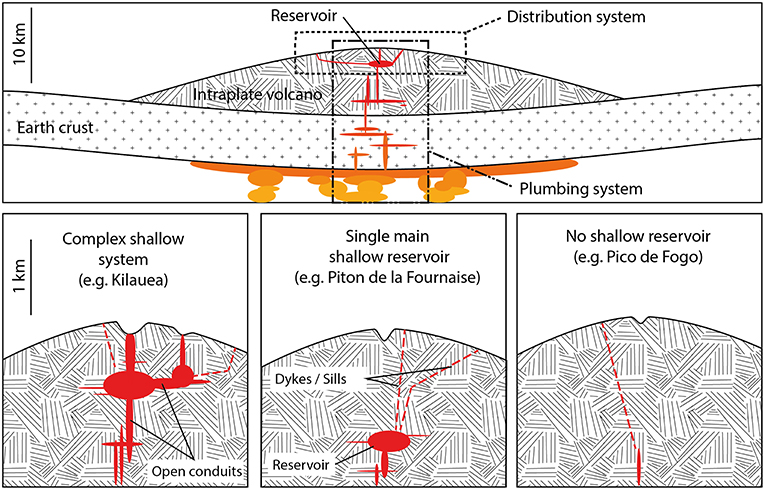
Figure 1. Illustration of typical intraplate shield volcanoes plumbing and distribution systems. The “distribution system” refers to the shallowest part of the host rock, inside which dyke, sills, and open conduits enable the final transfer of magma from shallow reservoirs (or not if not applicable, e.g., Pico de Fogo) to the surface.
Previous studies have shown that the four main parameters (aside from buoyancy) controlling magma propagation in the host rock of the distribution system are (1) structural heterogeneities (such as faulting or layering) (e.g., Gudmundsson, 2002; Kavanagh et al., 2006), (2) local or regional stress field (e.g., Paquet et al., 2007; Sigmundsson et al., 2015), (3) gravitational loading (e.g., Hyndman and Alt, 1987; Dieterich, 1988; Walter and Troll, 2003; Münn et al., 2006; Roman and Jaupart, 2014; Maccaferri et al., 2017), and (4) plumbing system pressure on host rock (e.g., Carracedo, 1994; Gudmundsson, 2012; Tibaldi, 2015). Our study aims to observe how the distribution system (in which magma transits from shallow depths to surface or subsurface) evolves in a “neutral” context, with no extensive/compressive/shear constrain. From this, we aim to get insights on what drives the long-term geometry of distribution systems, in the case of volcanoes that are far from active tectonics boundaries (e.g., intraplate oceanic islands).
It is difficult to answer this question by observing volcanoes in nature. Precious insights can be gained from observing extinct magmatic systems exhumed by erosion, but these are limited when it comes to interpreting dynamic behavior (e.g., Keating et al., 2008; Gudmundsson, 2012; Marsh, 2015). On living, active volcanoes, intervals between intrusive events are at least a few months (e.g., Roult et al., 2012, for the case of Piton de la Fournaise, one of the most active volcanoes on Earth) and volcanoes take a long time to grow, making dynamic observations of active distribution systems short in comparison of their life. In 2018, we have at most 30 years of exploitable geophysical data (earthquakes records, GNSS displacements, InSAR maps, degassing monitoring) for magma transfer imaging at depth at the most well-documented volcanoes of the world. Some of them are 300,000 years old. If volcanoes had a lifespan of one day, we would only have direct access to the last 9 s of their active life, the rest being inferred from geological studies. By creating models that replicate some of nature's volcanoes features, we have a chance to observe, record and analyze a greater amount of successive intrusive events.
Here we present one analog model of the development of a volcanic edifice through the use of gelatine as both host rock and magma. In this experiment, liquid gelatine (simulating magma) was injected at the bottom of a solid gelatine (simulating host rock) tank, at repeated intervals. We analyzed the surface evolution and distribution of eruptive vents, and showed various periods of dyke and sill swarming. This model highlighted the importance of volcanoes distribution system in various phases of their development, and in their long-term morphology.
Materials and Methods
Material Choice and Preparation
Crustal analog materials for dyke and sill emplacement and magma transfer inside the crust have been intensively studied in the past two decades, leading to a good knowledge of how to set up a volcano replica in laboratories. Different materials are able to model specific behaviors of volcanic edifices, especially the way they deform, compress or fail under magma injections (e.g., Abdelmalak et al., 2016). Crustal hosts rocks (inside which magma propagates from shallow sources to surface) most often display a complex elasto-plastic behavior at a volcano's scale (Galland et al., 2015). Rheology (rock response to constraints) can be dominated by one end or the other (elastic or plastic), depending on the rock type and scale of observation. Laboratory materials usually enable to model one or the other end (plasticity-dominated media, or on the contrary, elasticity-dominated host rocks) (Figure 2).

Figure 2. Analog materials used for modeling magma transfer and its interaction with the range of elasto-plastic crustal host rocks.
For instance, at the “weak,” or plastic, end of the elasto-plastic scale of crustal analogs, granular materials such as dry or wet sand, flour, diverse metallic powders or a mix of these were used to mimic the properties of large-scale natural objects (tens to hundreds of kilometers wide, where plasticity is the dominant characteristic) and understand better their behavior (e.g., Caldera collapse and dyke propagation, Roche et al., 2001; Kervyn et al., 2009; Delcamp et al., 2012 or magma emplacement in tectonic extension, Bonini et al., 2001; Corti et al., 2001), or model complex dynamics of magma propagation (e.g., Guldstrand et al., 2017). At the “strong” end of the elasto-plastic scale, gels such as water-gelatine mix, agar and acryl gels were used to model smaller scale objects (tens of meters to a few kilometers wide) or well consolidated mediums (e.g., for dyke nucleation and propagation, McLeod and Tait, 1999; Kavanagh et al., 2006; Taisne and Tait, 2009; Taisne et al., 2011; Le Corvec et al., 2013, interactions between two dykes, Ito and Martel, 2002, or the effect of various dyke properties on propagation, Chanceaux and Menand, 2014). Note that this list is non-exhaustive, and that the reader is referred to review articles such as or Galland et al. (2015); Kavanagh et al. (2018) for more encompassing writings about volcano analog modeling.
Compared with other studies, though, ours has one supplementary challenge: we need to use the same material for analog host rock and magma alike. Indeed, since successive injections are made, all dykes, sills, and laccoliths that possibly intrude are becoming part of the host rock for the next injection, so they need to be similar. Previous studies have shown that 2 to 5 wt% pigskin gelatine is a suitable analog for crustal rock intruded by dykes or sills, according to scaling laws (Kavanagh et al., 2013). We thus chose, after some testing, to use pigskin gelatine (food grad, bloom 250, at 4.5 wt% in de-ionized water, with some bleach to prevent bacterial growth). In its liquid state (at temperatures above 29°C), it behaves almost like water with a slightly higher density and viscosity (around 1 g/cm3 and 0.01 m2/s at 20°C), making it a good Newtonian fluid for analog magma modeling. Once solidified (at cool temperatures around 5–20°C), it is a transparent, birefringent “strong” gel with a young's modulus of 5–9 kPa (following measurements made on the same gelatine, Pansino and Taisne, 2018 at JGR: Solid Earth), which enables us to visualize intrusions inside the analog host rock and their related relative strain. The only downside is that the mechanical properties of pigskin gelatine change with cooling time (its Young's modulus increases exponentially and reaches a plateau (E∞) after several hours. E∞ is a linear function of gelatine concentration while the time to reach 90% of it (t0.9E∞) is controlled by the thickness of gelatine to be cooled and the room temperature (Kavanagh et al., 2013), so that “old” host rock (deposited in the beginning of the experiment) might be stronger than “fresh” one. However, with enough cooling time and sufficiently small injected volumes, this effect can be tempered.
Scaling and Boundary Effects
In this study, we consider typical oceanic islands volcanoes, located on top of hotspots and not affected by intense local tectonics (e.g., Kilauea, Piton de la Fournaise, Fernandina, Fogo). In order to provide a scaled model for the structural development of such volcanoes, we followed the classic similarity procedure described in e.g., Ramberg (1981). The shallow distribution system of these edifices is usually composed of a network of dykes and sills as well as small magma bodies between 0 and 3 km below the summit, while the upper part of the edifice is usually 10–30 km wide (e.g., Hildner et al., 2011; Bagnardi and Amelung, 2012; Michon et al., 2015). Since we had at our disposal a 83 × 83 cm tank (Figures 3A,B), the point of analog magma injection should be <8.3 cm below the summit. Thus, at the beginning of the experiment, the injector was placed 3 cm below the surface, leaving a 5.3 cm vertical growth margin). Bear in mind that scaling in this experiment followed similarity alone instead of, for instance, dimensionless ratios as proposed in Galland et al. (2015). The latest approach would have required a bigger number of experiments, which was not possible due to time constraints.

Figure 3. Photographs (A,C,D,E) and sketch (B) of the experimental setup in the cold room. An Arduino program (1) controls multiple-views cameras (2) to synchronously take regular photographs of the mini-volcano surface. Injections in an initial volume (3) are realized through a porous balloon on top of a heated chamber (4) which pressure and temperature are controlled (5, 6). Injections are controlled by a programmable peristaltic pump (7) that pushes liquid gelatine from the main reservoir (8) into the chamber. To ensure that gelatine stays liquid in the injection system, it is coupled with a hot water circuit (9).
It was also necessary to make sure that the box sides did not significantly affect the model physics, and in particular the stress state of the volume where the magma distribution system was developing (boundary effects). Previous studies have shown that analog edifice gravitational loading and stress adjustments can be affected if the sides of the box are too close to the distribution system (e.g., Corbi et al., 2016). We thus realized preliminary experiments using the same experimental setup. The typical deformation induced by a new intrusion did not reach further than 6 cm away from the dyke (as evidenced by changes on gelatine birefringence colors and surface deformation, see Supplementary Material). To prevent boundary effects from the side of the box on dyke propagation, we ended the experiment when the distribution system (composed of dykes and sills) was still a little more than 8 cm away from the box sides (for the farthest 5 intrusions), and even 13 cm for the rest of the intrusions. Corbi et al. (2016) also showed that a box at least twice the diameter of the “central cone” (as defined in their study) was enough to prevent boundary effects that significantly modify gravitational loading. In our case, the box is a 83 × 83 cm square. We stopped the experiment when the central cone was a little <20 cm in diameter. Finally, note that boundary effects from the bottom of the box might (in our experiment) have played a role for deep (around source depth) intrusions.
We wanted to give the miniature volcano a level of activity close to what can be observed at very active intraplate hotspots (e.g., Kilauea, Piton de la Fournaise). The ratio between activated/cooling times of the distribution system in the model (20%) was of the order of what is observed at e.g., Piton de la Fournaise in active phases. This was 11.6% on average over the 1950–2017 period, that includes long rest phases (e.g., Roult et al., 2012), and 20% on average over the 9 eruptions of the 2015–2017 cycles (e.g., Coppola et al., 2017). Following these considerations, we chose to activate injections during 5 min every 30 min (20% activated/cooling time ratio).
Because of this choice of scaling, we are investigating long-term structural growth processes that affect the shallowest part of plumbing systems, roughly from surface to 3 km deep under the summit, on highly-active oceanic islands volcanoes.
Experimental Setup
The experiment took place over the course of 2 weeks in a thermostated (15°C) environment. It was observed by an acquisition system composed of an Arduino (1. on Figure 3) controlling DSLR cameras (2.). We grew a miniature volcano in a 83*83*15 cm tank (3.), attached to a gelatine feeding system at its bottom center (4.). This feeding system included a thermostated (35°C) small chamber keeping the gelatine liquid [a heating coil enabled to run warm water inside the chamber without mixing with the analog material (Figures 3C,D)]. On top of the chamber we fitted a small elastic balloon (0.5 cm in diameter) that was pierced homogeneously with 20 holes (Figure 3E). Temperature (5.) and pressure (6.) in the feeding chamber were planned to be recorded (but due to technical problems only the temperature could be). We used a programmable peristaltic pump (7.) to inject precise volumes of liquid gelatine from a thermostated (35°C) reservoir (8.) into the model. The whole tube enabling the transfer of analog magma from the reservoir to the model was also kept at a constant temperature (35°C) with a warm water circuit (9.), to prevent the freezing of material during repose times. The original host rock analog material (see Material Choice and Preparation) was mixed with de-ionized water for 2 h at 75°C then poured into the tank until 3 cm thick (note that the photograph in Figure 3A suggests more than 3 cm, because it comes from an earlier similar experiment with the exact same setup), before observing a 48 h repose time at 15Â◦C for solidification.
Experimental Protocol
Once the original host rock analog had solidified (48 h after preparation), we launched the injection cycles. Every 30 min, the injection system (reservoir + pump + chamber) pushed 15 ml of liquid gelatine (at 35°C) inside the tank from the bottom, at a rate of 3 ml/min. Thus, each injection lasted for 5 min, during which analog magma slowly intruded the edifice, and often reached the surface, emplacing a small flow (injection #265 was displayed as an example photograph of the model while the experiment was running, on Figure 4). After each injection, the fluid cooled down quickly and solidified, simulating the emplacement of a dyke/sill/external flow and adding volume to the edifice. Gelatine in the reservoir was renewed daily, so that it remained freshly mixed. Four hundred and fifty eight injections (amongst which only the first 360 were selected for the study in the result analysis) were performed this way over the course of 10 days, without interruption or changes in the room temperature.
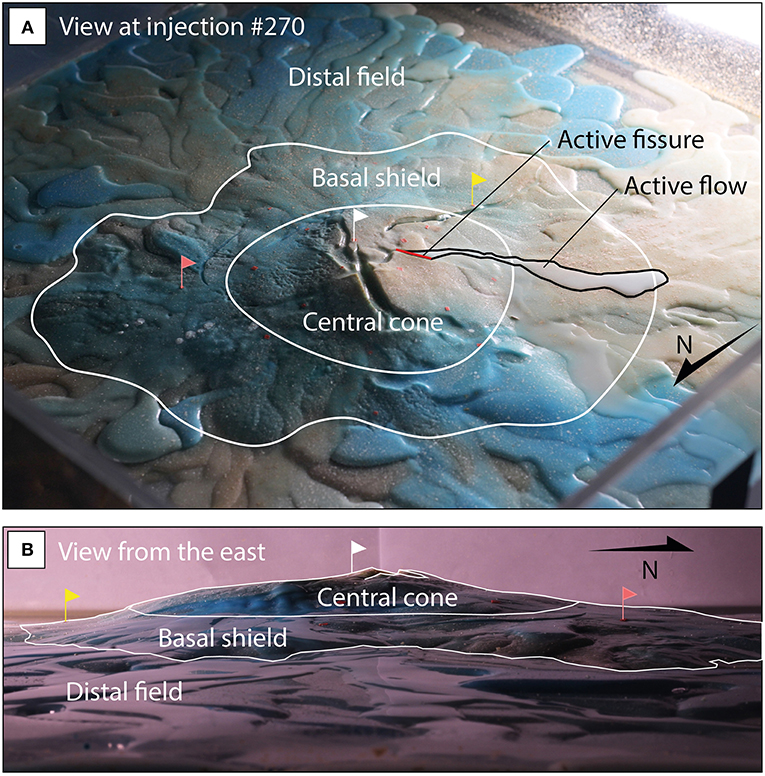
Figure 4. An example of the mini-volcano morphology at injection #323. Note the central cone surrounded by steep slopes, atop a basal shield displaying gentler elevation changes, and finally the distal deposit field where most of the flows are emplaced. The summit, rising 3.64 cm above starting level, is affected by significant type I surface fractures (radially, in perpendicular WNW-ESE and SSW-NNE directions, and tangentially especially south of the summit). (A) Oblique photo from the Northwest (B) side-view of the central cone from the East.
The temperatures of the room, of the injection tube, reservoir and chamber were verified by thermocouples. Pressure inside the injection chamber failed to be acquired continuously (technical issues). However, as the injection rate was very low (0.05 ml/s) compared to the chamber volume (0.8 l), variations in the chamber pressure are expected to remain low (around 0.006% per second). The growth of the miniature volcano was monitored by a network of 4 cameras. Three on top of the experiment (for stereo-photogrammetric purposes) and one on the side were synchronized and programmed to take 10 pictures, with an interval of 30 s, starting 1 s before each injection. Stereo-photographs were processed with Agisoft Photoscan Pro (v.1.2.3) (a reliable structure-from-motion software, e.g., Bolognesi et al., 2015; Derrien et al., 2015) to make Digital Elevation Models (DEMs). Occasionally, photographs of particular injections from the side through a polarized sheet (Supplementary Material) were taken to visualize dyke propagation and typical strain changes inside the analog crust.
The top-view images (5,184 x 3,456, 0.24 mm/pixel) acquired between each injection were used to create a short timelapse animation of the analog edifice growth (Supplementary Material). This set of pictures was used to map the location of eruptive fissures and intrusion tips (accuracy of 0.5 cm). In addition, the top view images could be processed to extract (X,Y) surface deformation using Digital Image Correlation (DIC) (Supplementary Material). The DIC code (Version 4) was adapted from a version developed by Dr. Elizabeth Jones (2013, 2014, 2015) based on previous developments by Christoph Eberl et al. (http://www.mathworks.com/matlabcentral/fileexchange/12413). and using the Matlab image processing toolbox. Note that texture has been added in form of micro-drops of paint sprayed on the model's surface so that displacements could be measured. Bear in mind that the use of DIC in this communication will purposely be limited only to showcase examples of what surface deformation measurements can be achieved. We wish to focus on presenting the long-term growth trends and not enter the detail of each intrusion characteristics.
The multiple-views dataset enabled to produce, for certain time steps, DEMs of the experiment surface using Agisoft's Photoscan (raw photographs and metadata available at NTU repository). Fifteen DEMs were produced at injections #0, #53, #87, #109, #141, #156, #178, #201, #219, #238, #264, #282, #327, #333 and #381 (see examples on Figures 5A–E). The surface difference between two successive DEMs was integrated to obtain volume changes. In particular, we differentiated endogenous volume changes (addition of material inside the edifice in dykes and sills) and exogenous volume changes (from external deposits). This was most of the time straightforward, as the two phenomenon did not affect the same areas (see examples on Figures 5F–I).
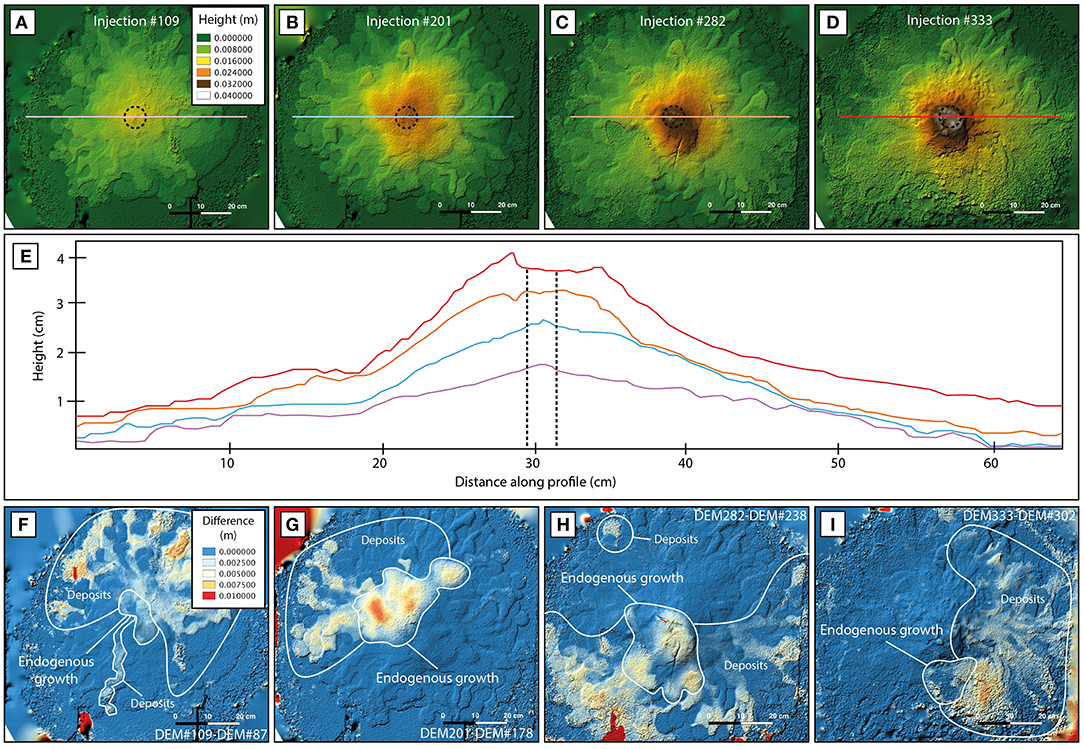
Figure 5. (A–D) DEMs of the experiment, extracted from the multiple-views photograph dataset. (E) related cross-sections and detail of the different morphological units present at the end of the experiment (summit, central cone, basal shield, distal field). (F–I) Examples of difference of DEMs and segregation of endogenous vs. exogenous growth areas.
In order to clarify the description and analysis of dyke/sill intrusions and surface fissure opening during the miniature edifice growth, we defined an arbitrary coordinate system based on the orientation of the central top photograph (N/S/E/W corresponding to Up/Down/Right/Left, respectively).
Results
History Summary
During the course of the experiment and throughout the growth of the model, different phases could be observed. Figure 6A and Table 1 summarize the successive intrusion phases described here. The first 141 injections (phase a.) intruded the solid through sub-vertical dykes mainly oriented N-S. Most reached the surface and opened fissures oriented WNW-ESE from which injected material extruded. We differentiated phases a.(1) and a.(2). During phase a.(1) (#0-46) all eruptions originated from the same fissure, while there were slight changes (>2 cm) during phase a.(2) (#47-141). Flows formed a rather flat field of 40–50 cm in diameter.
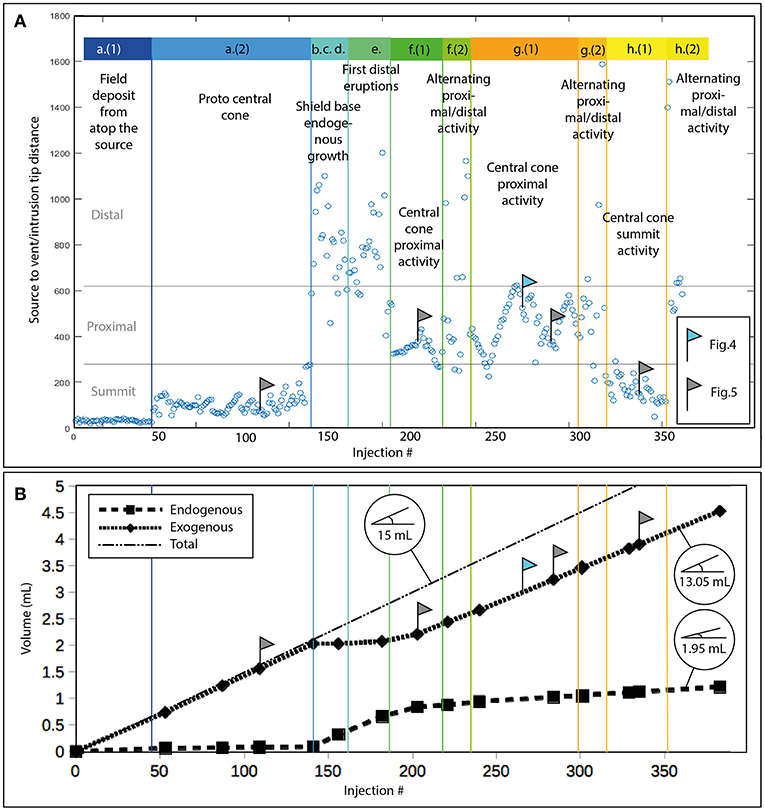
Figure 6. (A) Eruption's radial distance to source throughout the experiment (in pixels on the top image). Several phases can be observed. During phase a (1 and 2, dark blue), magma transited from source to surface through sub-vertical dykes and volcano growth is mostly exogenous. Horizontal compression builds at depth. During phases b–e (light blue), several sill swarms were emplaced, releasing or balancing part of the horizontal compression. During phases f–h, cycles of dyke/horizontal compression and sill/compression release/balancing occurred, resulting in alternating summit/proximal/distal activity. Dyke swarms shifted of around 120° azimuth between each phase. (B) Endogenous/exogenous cumulated volume of the model, from the integration of selected areas in the differences of DEMs. Bubbles indicate the average percentage of endogenous growth during phase a, phases b to d and during phase g and h, when a stabilization was observed.
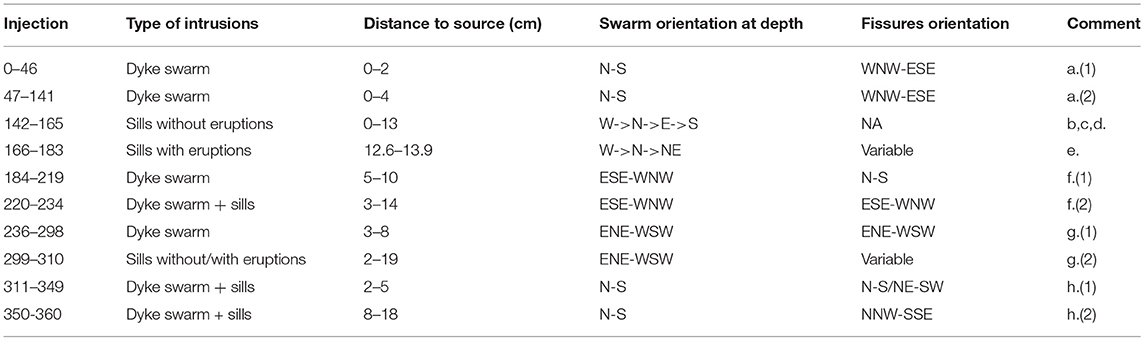
Table 1. Successive intrusion phases observed during the course of the experiment, associated with distance to source, swarms and fissures main orientations.
At injection #142, the intrusive behavior changed radically with a predominance of sub-horizontal sill intrusions, that did not end up with surface fissure opening and extrusion. Sills of this period started intruding to the W from the injection position, gradually and constantly rotating clockwise at each new intrusion. This ended at injection #166 with the opening of distal fissures, (first one at 13.9 cm W of the summit), after a complete rotation around the injection point. Distal eruption sites then migrated clockwise over 17 injections, gradually moving closer to the source (up to 12.6 cm NE of the summit).
After injection #184, dykes started to swarm to the ESE, with extrusions happening close to the summit (5–10 cm). Fissures opened mainly in the N-S direction, indicating a shift of orientation between intrusions at depth (oriented ESE-WNW) and close to the surface [phase f.(1)]. After this period, surface fissures appeared a little closer to the summit [phase f.(2), between #220 and #234], opening radially from the source (ESE-WNW, thus following better the orientation of dykes at depth), while alternating with sill emplacement both close to the source and in distal areas (up to 14 cm to the South). A steeper central cone, 10 to 12 cm in diameter, overlooked a region of lower slopes. Coevally to the emergence of this central structure, the summit surface started to crack in the ESE direction under the extension generated by successive intrusions. The overall edifice (including the farthest external flows) was at that time almost 70 cm in diameter.
Injection #235 marked the start of a new swarming period to the WSW, where fissures started opening radially (WSW-ENE) near the summit and gradually propagated down to the foot of the central cone until injection #298 (phase g.(1), example of injection #265 on Figure 4). Between #299 and #310 [period f.(2)], in a first time, 9 sills were emplaced at depth near the source, making the central cone grow internally. Then in a second time, two final distal sills (10–19 cm from the source) intruded to the Northeast, reaching the surface and producing small flows.
Finally, the last swarm emplaced 42 N-S sub-vertical dykes in a swarm oriented N-S, and 8 deep sills near and far from source that mostly did not reach the surface. Dyke intrusions were first followed by opening of eruptive fissures to the east and southeast of the summit, oriented N-S and NE-SW, respectively, close to the source [2–5 cm, period h.(1)]. Then finally after two distal sills to the south, 8 fissures oriented NNW-SSE opened at the base of the central cone to the southeast [8–18 cm from the source, period h.(2)].
We made 458 injections in total, but the study period was limited to the first 360 injections. Since it was observed that the model was vulnerable to bacterial growth and chemical changes inside the gelatine. After around 350 injections the miniature volcano started to display surface alteration in very limited areas. Parts of the surface (<3 mm thick) of the steepest slopes started to melt down and slowly flow downhill in specific locations. This meltdown slowly spread and began to be significant after injection #400, which is why we only used data before injection #360, to keep a safety margin about the reliability of model rheology. Cross-sections in the model after the end of the experiment confirmed that meltdown did not affect the model under 5 mm depth, pointing toward an air-related problem (bacteria growth or chemical reaction).
Morphology
In the tank, we could observe after phase f.(1), and until the end of the experiment, an edifice composed of three distinct parts. A cone-like structure displaying slopes of 20–30%, and 10–18 cm in diameter (growing in size throughout the experiment), rose at the center above the source. This central cone (Figure 4) was overlying, and surrounded by, a shield-like base, with slopes of 5–15%, 20–43 cm in diameter (growing in size throughout the experiment). Finally, around the basal shield, we could observe an almost flat field of distal flows, consisting of piled external flows 1–9 mm thick (Figure 4). At the end of the experiment, the summit was 3.82 cm high above the initial surface.
We integrated DEM differences at regular intervals over the areas of predominant endogenous growth (where volume increase was mostly due to emplacement of sills and, in a lesser amount, dykes: this was easy to distinguish because they mostly did not overlap with areas of external deposits) (Figures 5F–I). Thus, we followed the evolution of endogenous vs. exogenous growth (Figure 6B). There were three main periods: (1) During phases a.(1,2), the percentage of long-term endogenous growth varied between 4 and 7% of the injected volume. (2) Over phases b,c,d and e. this percentage increased to 92% on average. (3). Finally it tended to stabilize around 13% for the later phases (f,g,h, Figure 6B). Overall around 21% of the edifice has been grown from within and 79% from external deposits. Although these deposits made most of the volcanic edifice in the distal regions, the percentage of endogenous growth was greater closer to the summit (Figures 5F–I).
Distribution System Geometry
During each injection, the edifice inflated at first, the inflation becoming more and more noticeable as the dyke propagated toward the surface (Supplementary Material). Note that some injections did not reach the surface and froze as intrusions. After the opening of an eruptive fissure, the edifice started to deflate as a new flow progressed on the slopes. A remaining deformation was always observed after the end of the injection and freezing of material remaining in the dyke (Supplementary Material).
After the end of the experiment, we dissected the model following horizontal planes (at 0, −1, −2 cm). This revealed a surprisingly geometric plumbing system at depths between −3 and 0 cm, displaying 4 main sub-vertical dyke swarms [2xN-S (a. and h.), 1xESE-WNW (f.) and 1xWSW-ENE (g.)] and 4 main sub-horizontal sill swarms [elongated to the NE (b.), SE (c.), SSW (d.) and N (e.)] (Figure 7). Amongst the latest, only the N sills were located at shallow depth (between −1 and 0 cm) while the others were emplaced at more than 2 cm depth (Figure 8). Shallow sills lead in most cases to distal eruptions, while deep sills lead in most cases to pure intrusions. Surface fissures were often deflected by near-surface effects and not necessarily aligned with their respective feeding dykes at depth Table 1. Remarkably, fissures that opened on the sides of the grown central cone were for the majority oriented radially from the source.
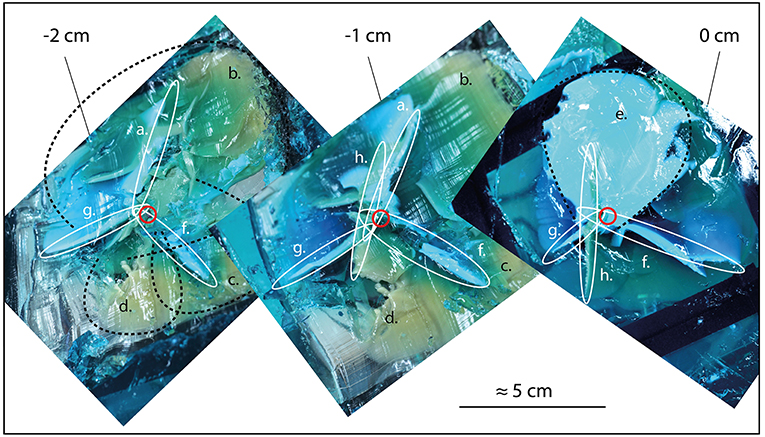
Figure 7. Photographs of dissected model, consisting of horizontal sections at depths of −2, −1, and 0 cm. The various dyke and sill swarms emplaced during phases a–h are drawn on top of the photographs.
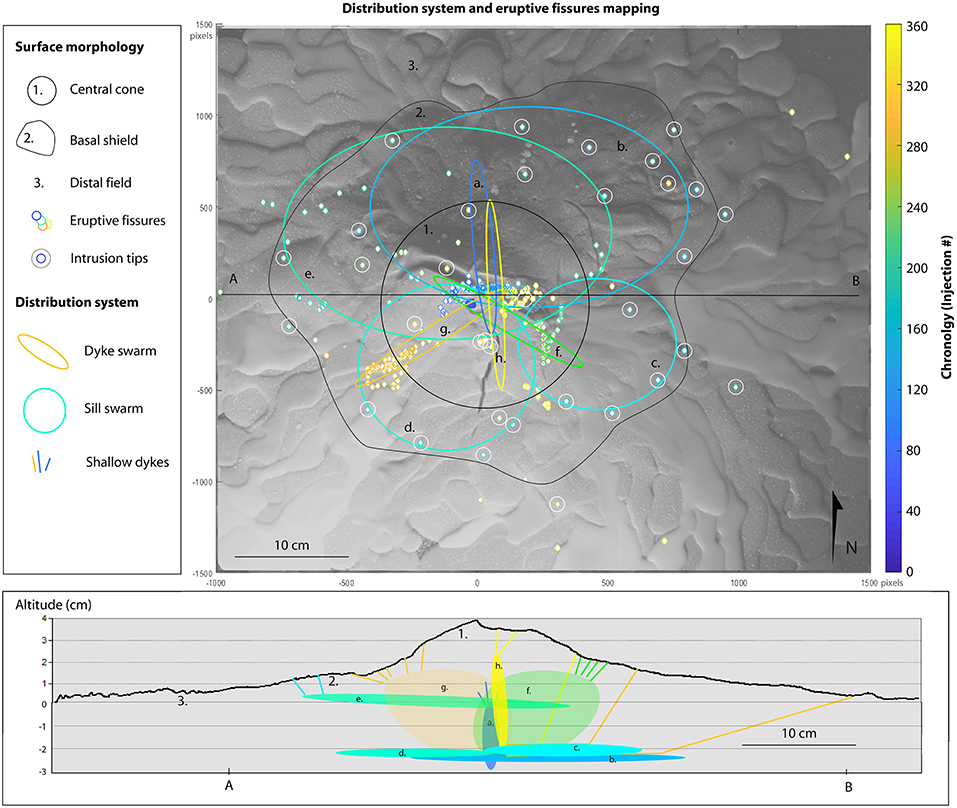
Figure 8. Distribution system geometry (after several cross-sections inside the final edifice, letters a–h representing the main swarms in chronological emplacement order) and extrusion mapping (after semi-automated processing of the top photographs series). Note the triple-branched sub-vertical dyke swarms system below the summit (a, f–h), surrounded by four main sill swarms at depth (b–e). One of them was emplaced closer to the surface (between 0.5 and 1 cm below surface) and lead to numerous distal eruptions.
The shallow magma distribution system naturally developed in a three-branched radial geometry (Figures 7, 8). In this experiment we could clearly define differentiated periods of activity separated from each other by transition points, where swarming shifted from one dominant orientation to another. For instance, this was well represented at injection #142 by the shift from a series of N-S sub-vertical dykes to a series of sub-horizontal sills. We observed 4 such transition points during the experiment, at #142, #184, #235, and #311, during which the main orientation of dyke/sill swarms shifted significantly. At each transition point the new swarm had either a 120° angle in azimuth with the previous one (in the case of sub-vertical dyke swarms) or a 90° angle in dip (in the case of dyke to sill, or sill to dyke, shift). The sub-vertical part of the distribution system (dykes) was key for the central cone growth (which is predominantly endogenous), while the horizontal part (sills) was mostly responsible for the basal shield construction.
The intrusive behavior could change slightly between the beginning and end of each swarm sequence. Intrusions at the beginning of new swarms tended to leave inside the edifice thicker dykes/sills than intrusions at the end of swarming periods (0.5 to 0.8 mm of surface opening at the beginning vs. 0.1–0.2 mm close to the end). Around the end of sub-vertical dyke swarm sequences, sills could be emplaced [phases f.(2), g.(2), and h.(2)].
Discussion
Processes Behind Swarm Directions and Transitions
In this section we will attempt to interpret our model surface and subsurface evolution, and in particular discuss the reasons behind the observed swarm transitions. We acknowledge that newly formed dykes may damage the host rock, and favor the opening of subsequent dykes in the same direction. However, we observed several transition points where swarming completely changed of direction, thus suggesting an effect overcoming the easiness to intrude damaged host rock.
We already know from previous studies that the stress state of elastic media is a strong influencer of dyke and sill propagation (e.g., Dahm, 2000; Watanabe et al., 2002; Paquet et al., 2007; Maccaferri et al., 2011; Kavanagh et al., 2013; Le Corvec et al., 2013; Roman and Jaupart, 2014). For instance, reservoir overpressure at Bardarbunga volcano (Iceland), generates a strong radial stress field favoring the propagation of dykes radially around the source, while further away regional stress field takes over and favors parallel dyke swarming (Paquet et al., 2007; Sigmundsson et al., 2015). On the other hand, if the regional stress field is weak, dyke propagation is likely to be influenced by volcano-related stress fields, as reservoir overpressure (for instance during the 2005 Sierra Negra eruption; Jónsson, 2009), cumulative edifice deformation under repeated intrusions, edifice gravitational loading (Hyndman and Alt, 1987; Kervyn et al., 2009; Roman and Jaupart, 2014) or unloading (e.g., Corbi et al., 2015; Maccaferri et al., 2017). In our case, we start with a neutral stress field affected only by an even (vertical) gravitational load. At the beginning of the experiment, there is no significant edifice load so when the reservoir (porous balloon) is pressurized by the peristaltic pump, a 3D radial stress field builds rapidly around it, favoring the propagation of dykes away from the source. Amongst these different directions, dykes preferentially migrate upwards at early stage, because of the even vertical load (Figure 9A). However, each new dyke emplacement applies a compressive horizontal stress to the host rock, and each new flow adds to the load of the edifice, modifying the gravity-induced stress field (#1 to #141). Eventually, horizontal compressive stress becomes sufficient to prevent dyke vertical propagation, and injected material starts to migrate horizontally in places where the most important horizontal compression has been applied (e.g., #142 to #183, Figure 9B). From there, we can propose the hypothesis that the host rock was significantly compressed horizontally at depth during the first 141 injections (phase a.), because this is where the first sills began to grow during phases (b, c, and d.). Notably, sills were emplaced in a clockwise pattern at depth after phase (a.) highlighting the fact that horizontal/vertical stress ratios were being gradually adjusted all around the core plumbing system between injections #142 and #165. After injection #165, the stress ratio allowed again vertical propagation of analog magma and ended the emplacement of deep sills (Figure 9C). Injections #166 to #183 produced shallow sills northwest, north and northeast of the summit (phase e.). This could have meant that there was at this point a shallow compressed zone in the N-S direction favoring the lateral propagation of shallow sills from 2 to 2.5 cm above the source. Indeed, injections #47 to #141 opened fissures oriented mainly WSW-ENE, thus compressing the shallow subsurface in the NNW-SSE direction (Figure 4). At injection #184, new sub-vertical swarming to the ESE (f.) started. It is possible that this new behavior was a consequence of the end of stress release to the N of the summit, with stress being still accumulated at shallow depths to the SSE from period (a.). Meanwhile, dyke swarming to the ESE at depth could have increased compression in the SSW direction. It was then consistent to find that the next dyke swarm (g.) was oriented WSW at depth. Finally, swarming returned to the initial N-S principal orientation after injection #310, possibly because remaining accumulated stress has eventually been released or compensated by injections #236 to #310. It seemed like swarms were shifting with a period of between 41 and 74 injections, in our case, with transition points getting closer in time as the volcano grew.
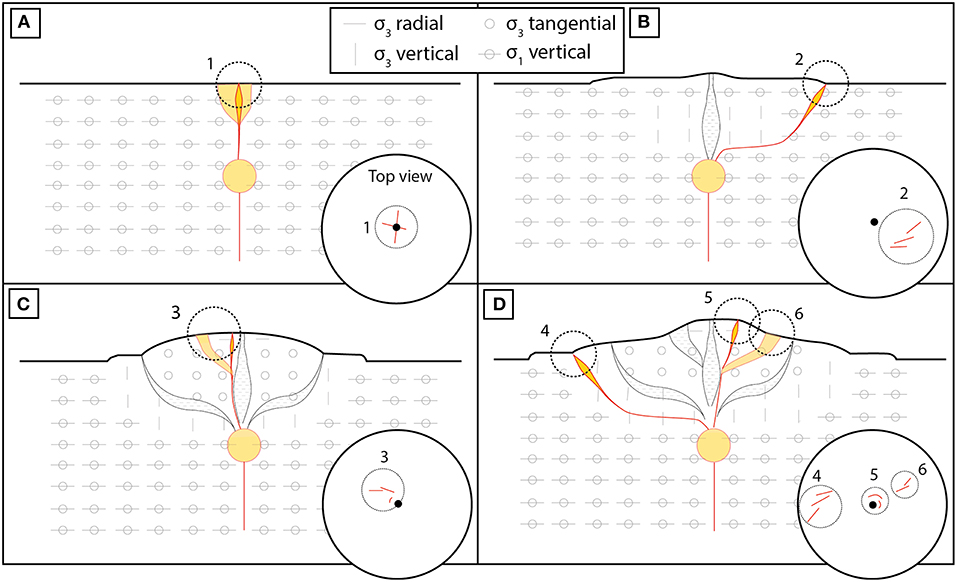
Figure 9. Simplified interpretation of stress state of the miniature volcano, where σ3 is the direction of least principal stress (“extension”) and σ1 is direction of main principal stress (“compression”). Fractures, eruptive fissures, dykes, and sills are more likely to propagate along planes perpendicular to σ3. (A) Early phases: the edifice load and cumulative intrusive stress do not significantly affect dyke propagation. Most dykes migrate vertically above the source (1). (B) Repeated intrusions have created a zone of horizontally compressed medium above source: dyke vertical migration is arrested in this zone and “magma” propagates laterally (sill, 2) until the compression state allows upward migration. The edifice load also favors opening of vents at the foot of the edifice in the near-surface. (C) Sill(s) have enabled the release of horizontal compression, allowing dyke vertical migration above source. Topography starts to become significant enough to divert dykes at near-surface depth, resulting in an increase of the proportion of lateral radial fissures (3). (D) The volcano enters a steady state phase, where distal (vertical σ3 at depth, 4) eruptions alternate with summit (radial σ3 near the surface, 5)/lateral (tangential σ3 near the surface, 6) eruptions, according to the compression state of the edifice. Lateral intrusions (6) are often diverted to the foot of the central cone by the topographic load. Note that this interpretation of the shallow distribution system is representative of the long-term and edifice-wide general stress trends, but varies locally and at small temporal scales.
Synthesis on Edifice Stress State, at Depth and Near the Surface
Following the previous section considerations and morphological observations, we can propose the following qualitative model of stress state in the experiment after it entered a stabilized phase (after phase f., Figure 9D):
1- The center of the experiment grew mainly from endogenous deposits above the source. Thus, the surface of the central cone and in particular the summit zone were under significant radial extension. On the summit zone (4–5 cm in diameter), we can infer that σ3 was oriented radially from the source, near the surface and at shallow depths (0–2 cm below the summit). This stress state could have favored the opening of circular eruptive fissures around the summit during summit eruptions (observed, but rare). It could also have opened a system of type I radial and tangential fractures (non-eruptive) at the surface, in a radial pattern centered above the source. Together these fractures accommodated the extensive radial deformation of the summit. Such tangential/radial eruptive fissures and surface extensional fractures are typical features around caldera rims. Their tangential shape is often attributed to topographic load in the case of calderas at for instance, Fernandina volcano (Galapagos, e.g., Chadwick and Dieterich, 1995).
2- The orientation of eruptive fissures shifted quickly from tangential near the summit “plateau” to mostly radial on the flanks. We interpret this shift as the effect of the stress field induced by topographic load of the central cone (e.g., Chadwick and Dieterich, 1995; Roman and Jaupart, 2014). According to this interpretation, on the flanks and at the base of the central cone σ3 became tangential at shallow depths (0–1.5 cm below surface), favoring the opening of radial eruptive fissures. In addition, topographic load favored eruptions at the base of the cone rather than in the middle of the flanks (e.g., Kervyn et al., 2009). Type I extensional (non-eruptive) radial fractures could also have accommodated the tangential extension above dyke swarms at depth that did not lead to eruptions (for instance to the south of the central cone). These features could probably have translated into radial grabens in more plasticity-dominated materials, and in real-world volcano morphology. This can be seen as similar to the “volcanic rift zones” observed on several volcanoes around the world (e.g., Etna, Piton de la Fournaise, Fogo, Marion Island), that are often disposed in a three-branched star pattern, concentrating most of the vents and accommodating most of the edifice extension.
3- At depths <1.5 cm below the surface, we infer that compressive horizontal stresses were dominant (due to successive sub-vertical dykes emplacement). Thus, at this depth σ3 was sometimes horizontal and sometimes vertical, depending on the ratio of horizontal compression vs. vertical compression. This ratio grew when sub-vertical dykes were emplaced, but diminished when sub-horizontal sills or external flows (topographic load) were emplaced. We can suggest that this is why most sills were emplaced at depths <-1.5 cm, as they accommodated the horizontal compressive stress that was built at depth (Figure 9D).
4- Distal zones were globally unaffected by significant stress state changes but could display small radial compression favoring the propagation of radial dykes or sills further away from the source, if the radial migration of the intrusion started deep enough to begin with. Exceptionally, some injections used the deep sill network to propagate radially at depth before starting to propagate upwards, reaching the surface sometimes 18–19 cm away from the source. The more the edifice grew and the more radial compressive stress was accumulated, the farther distal eruptions could happen.
Similarity With Volcanoes in Nature
The vent locations on the model surface tended to cluster in specific locations around the injection point. The density map further showed that vents on the slopes of the model volcano are generally aligned in two radial WSW and ESE directions (Figure 10A). Volcanoes in nature also display similar vent alignments, radially from the main reservoir and/or magma rising point. In numerous cases there is two or three “rift zones,” radiating from above the principal magma input point. They are often disposed at around 120° angles (Carracedo, 1996). This can for instance be observed on Mauna Kea post-shield edifice (Figure 10B), Marion island (Figure 10C), Tenerife (Figure 10D), Pico de Fogo (Figure 10E), and Piton de la Fournaise (Figure 10F). This common observation was originally explained by the building of horizontal extensional stresses above a rising plume under the Earth's crust. In an isotropic environment (i.e., not significantly affected by strong regional stress fields), the upward “push” of rising magma will create extension of the topping crust. This in turn will favor the opening of both radial and tangential dykes, that tend to swarm in a “least-effort” geometry, i.e., three directions (e.g., Carracedo, 1994). Depending on the volcano, more recent studies suggested that gravitational spreading controls the formation of triple-branched rift systems (i.e., El Hierro in Münn et al., 2006, in which spreading of volcanoes without forceful intrusions is reproduced).
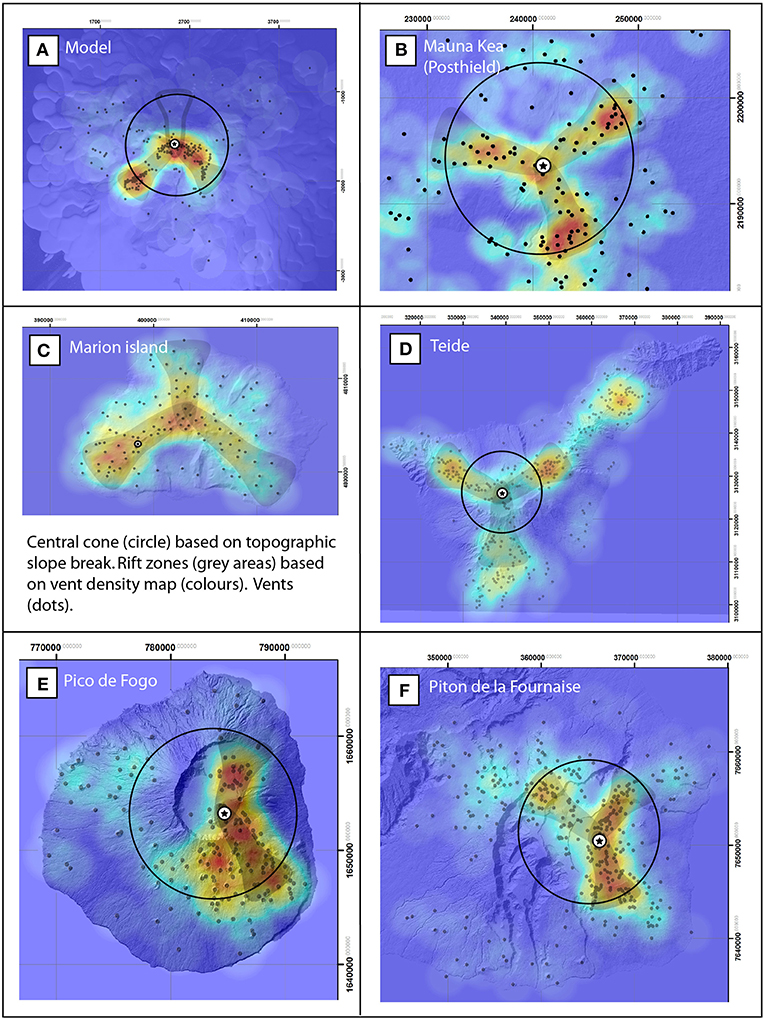
Figure 10. Comparison of model vent density map (A) with a selection of intraplate volcanoes, (B–F). Black circles represent the extent of central cones, based on slope break. Rift zone (grayed areas) are based on vent density (warm colors where vent density is higher). Where applicable, straight lines represent the direction of past active center displacement. Vents in the model (A) tend to open in two preferential “rift zones” (ESE and WSW). At these intraplate volcanoes, vents statistically gather in three “rift zones” more or less at 120° angle from each other. This is especially true for Mona Kea post-shield edifice (B), Marion island (C), and Teide (D). Pico de Fogo displays a different repartition with a NNE well-defined rift zone and a diffuse SSE one (E). Piton de la Fournaise shows three rift zones (NE, SSE, and WNW) but they are not really well disposed at 120° angle from each other.
In nature, flank collapses happen regularly (at geological time scales) as shown by significant scarps in their morphology (e.g., Piton de la Fournaise eastern flank, Pico de Fogo, Stromboli, El Teide…) and contribute to redirect shallow magma pathways by releasing accumulated internal stresses and modifying the topographic load (Maccaferri et al., 2017). Finally, regional stress fields can also influence the directional growth of rift zones (for instance in Iceland, e.g., Sigmundsson et al., 2015). These particularities have intentionally not been implemented in our model because the intention was to assess how repeated forceful intrusions alone affect the edifice morphology over time. We focus here on the long-term growth trends resulting from statistically more significant endogenous growth from the rift zones (sub-horizontal growth) and sill swarms (sub-vertical growth).
Although only two “rift zones” could be evidenced by looking at vent density distribution on the model volcano, post-experiment dissection of the edifice revealed a three-branched magma distribution system above the source (Figure 7). Such features can also be found on eroded volcanoes in nature, notably at Shiprock paleo-volcano (Delaney and Pollard, 1981). In the model, two of these dyke swarms were related to the ESE and WSW rifts zones defined from the vent density map, respectively (Figure 10A). Even though the subsurface clearly revealed that swarms a. and h. extended north and south of the summit on about the same length as the two other zones (i.e. 4–8 cm), they were related (in majority) to eruptions near the summit [phases (a.(1)), (a.(2)), and (h.(1)), Figures 6, 8]. This explained the lack of surface evidence of this rift zone (i.e., absence of N-S alignment of vents). Since we only grew one volcano in the laboratory, we are unsure if the three-branched star pattern of the model distribution system is a feature that would automatically be present in such experiments. It is possible that it might be the case, considering (1) the high amount of documented natural structures displaying three-branched volcanic rift zones and (2) the crust deformation models confirming that upward migration of magma under the crust is likely to produce such features. However, additional experiments would enable to be more assured on this particular point.
Finally, in the experiment, the long-term dyke/injected volume ratio stabilized at 13% (1.95/15 mL, Figure 6). The average of dyke/injected volume on 10 events on Piton de la Fournaise, for instance, is 12.3% (where the injected volume was equal to flow plus dyke volume, and dyke volumes were inferred from multiple ground deformation inversion studies, Fukushima et al., 2005; Peltier, 2007; Staudacher et al., 2009). Note that in both cases (model and Piton de la Fournaise) this percentage varies a lot depending on the source-vent distance, the duration of the eruption (in nature only), the emplacement or not of accompanying sills, the pre-eruptive inflation, etc. However, we found scaling surprisingly close in this case, suggesting that experiments such as the one presented in this communication might be of worth for real-world volcanoes studies.
Conclusion
This model was limited by the use of gelatine as a crustal analog: it proved hard, even with precautions learnt from earlier experiences, to maintain its stability and mechanical properties after 400 injections (8 days), and achieve longer observation periods. Additional experiments would also improve the reliability of the observations and conclusions drawn in this contribution, and enable to vary some of the parameters (repose time between injections, edifice size, gelatine temperature) and assess their importance in the geometry of the distribution system.
We could observe the initiation and evolution of the distribution system of volcanoes, without the constrain of a strong regional stress field induced by complex tectonic setting. All injections lead to intrusions inside the elastic host rock, most of which reached the surface and were followed by eruptions (i.e., intraplate oceanic islands volcanoes). After 360 injections the edifice had a flat-topped central cone surrounded by a low-elevation shield and a distal field of external deposits. We could identify several swarming phases lasting between 41 and 74 injections. Each phase emplaced a new swarm oriented at a 90° dip angle, or a 120° strike angle, from the previous one. We interpret this particularity as the release or compensation of stress accumulated by compression from previous phases.
The interaction between edifice growth and magma transfer lead to the building of a three-branched vertical distribution system (dyke swarms concentrated into volcanic rift zones). The consequent horizontal compressive stress field was probably accommodated by a network of sills at source and intermediate depths. A stable growth state achieved in the second half of the experiment suggested that long-term volume of the edifice would be composed at 13% by dykes and sills, which is rather close to what was inferred from ground deformation at e.g., Piton de la Fournaise (12.3%).
Assessing the different characteristics of the subsurface state of a given edifice (layering, mechanical properties, stress state due to activity) through drilling would probably help to build accurate models of successive injections inside active oceanic island volcanoes. Such models, in the future, could provide insights in the probabilities of opening of eruptive fissures in such or such sector of the volcano.
Data Availability
Data (cited as Derrien and Taisne, 2018) is available at: https://researchdata.ntu.edu.sg/dataverse/minivolc_experiment
Author Contributions
BT provided the necessary laboratory equipment and contacts. AD and BT carried out the pre-study experimental tests. AD carried out the experiment described in this contribution. AD provided the original text and figures of this contribution, with significant comments and improvements from BT.
Funding
This work comprises Earth Observatory of Singapore contribution no. 234 and Institut de Physique du Globe de Paris contribution no. 4014. This research is partly supported by the National Research Foundation Singapore and the Singapore Ministry of Education under the Research Centres of Excellence initiative. This research is partly supported by Ecole Normale Supérieure of Paris (France) specific PhD grant.
Conflict of Interest Statement
The authors declare that the research was conducted in the absence of any commercial or financial relationships that could be construed as a potential conflict of interest.
Acknowledgments
We thank the teams from the Earth Observatory of Singapore and the Observatoire Volcanologique du Piton de la Fournaise for their help and counsels throughout the study. In particular, we would like to acknowledge the contribution, as volcano sciences experts, of Aline Peltier and Nicolas Villeneuve during the whole study, the precious help and counsels of Stephen Pansino and Fabio Manta during the volcano model conception, and the comments and advice of Eleonora Rivalta that significantly improved the manuscript quality.
Supplementary Material
The Supplementary Material for this article can be found online at: https://www.frontiersin.org/articles/10.3389/feart.2019.00019/full#supplementary-material
Supplementary Video 1. Top-view timelapse of the experiment with one image per injection. The box is 83 × 83 cm.
Supplementary Figure 1. Example of before/after a typical intrusion, viewed from the side through the transparent gelatine. The model is placed between two polarizing sheet so that stress-related birefringence appears. The difference of images shows the spatial extent of the effect of the new intrusion on the elastic medium.
Supplementary Figure 2. Examples of (X,Y) surface deformation modulus after intrusions. Displacement values are computed automatically using the DIC code (Version 4) developed by Dr. Elizabeth Jones (2013, 2014, 2015) based on previous developments by Christoph Eberl et al. (http://www.mathworks.com/matlabcentral/fileexchange/12413) and using the Matlab image processing toolbox.
References
Abdelmalak, M. M., Bulois, C., Mourgues, R., Galland, O., Legland, J. B., and Gruber, C. (2016). Description of new dry granular materials of variable cohesion and friction coefficient: implications for laboratory modeling of the brittle crust. Tectonophysics 684, 39–51. doi: 10.1016/j.tecto.2016.03.003
Bagnardi, M., and Amelung, F. (2012). Space-geodetic evidence for multiple magma reservoirs and subvolcanic lateral intrusions at Fernandina Volcano, Galápagos Islands. J. Geophys. Res. Solid Earth 117. doi: 10.1029/2012JB009465
Bolognesi, M., Furini, A., Russo, V., Pellegrinelli, A., and Russo, P. (2015). Testing the low-cost RPAS potential in 3D cultural heritage reconstruction. Int. Arch. Photogramm. Remote Sens. Spat. Inf. Sci. XL-5/W4, 229–235. doi: 10.5194/isprsarchives-XL-5-W4-229-2015
Bonini, M., Sokoutis, D., Mulugeta, G., Boccaletti, M., Corti, G., Innocenti, F., et al. (2001). Dynamics of magma emplacement in centrifuge models of continental extension with implications for flank volcanism. Tectonics 20, 1053–1065. doi: 10.1029/2001TC900017
Carracedo, J. C. (1994). The Canary islands: an example of structural control on the growth of large oceanic-island volcanoes. J. Volcanol. Geotherm. Res. 60, 225–241. doi: 10.1016/0377-0273(94)90053-1
Carracedo, J. C. (1996). Morphological and structural evolution of the western Canary islands: hotspot-induced three-armed rifts or regional tectonic trends? J. Volcanol. Geotherm. Res. 72, 151–162. doi: 10.1016/0377-0273(95)00080-1
Chadwick, W. W. Jr., and Dieterich, J. H. (1995). Mechanical modeling of circumferential and radial dike intrusion on Galapagos volcanoes. J. Volcanol. Geotherm. Res. 66, 37–52. doi: 10.1016/0377-0273(94)00060-T
Chanceaux, L., and Menand, T. (2014). Solidification effects on sill formation: an experimental approach. Earth Planet. Sci. Lett. 403, 79–88. doi: 10.1016/j.epsl.2014.06.018
Coppola, D., Di Muro, A., Peltier, A., Villeneuve, N., Ferrazzini, V., Favalli, M., et al. (2017). Shallow system rejuvenation and magma discharge trends at Piton de la Fournaise volcano (La Réunion Island). Earth Planet. Sci. Lett. 463, 13–24. doi: 10.1016/j.epsl.2017.01.024
Corbi, F., Rivalta, E., Pinel, V., Maccaferri, F., and Acocella, V. (2016). Understanding the link between circumferential dikes and eruptive fissures around calderas based on numerical and analog models. Geophys. Res. Lett. 43, 6212–6219. doi: 10.1002/2016GL068721
Corbi, F., Rivalta, E., Pinel, V., Maccaferri, F., Bagnardi, M., and Acocella, V. (2015). How caldera collapse shapes the shallow emplacement and transfer of magma in active volcanoes. Earth Planet. Sci. Lett. 431, 287–293. doi: 10.1016/j.epsl.2015.09.028
Corti, G., Bonini, M., Innocenti, F., Manetti, P., and Mulugeta, G. (2001). Centrifuge models simulating magma emplacement during oblique rifting. J. Geodyn. 31, 557–576. doi: 10.1016/S0264-3707(01)00032-1
Dahm, T. (2000). Numerical simulations of the propagation path and the arrest of fluid-filled fractures in the Earth. Geophys. J. Int. 141, 623–638. doi: 10.1046/j.1365-246x.2000.00102.x
Delaney, P. T., and Pollard, D. D. (1981). Deformation of Host Rocks and Flow of Magma During Growth of Minette Dikes and Breccia-Bearing Intrusions Near Ship Rock, New Mexico (No. 1202). Washington, DC:USGPO.
Delcamp, A., de Vries, B. V. W., James, M. R., Gailler, L. S., and Lebas, E. (2012). Relationships between volcano gravitational spreading and magma intrusion. Bull. Volcanol. 74, 743–765. doi: 10.1007/s00445-011-0558-9
Derrien, A., and Taisne, B. (2018). Data repository for: 360 intrusions in a miniature volcano: birth, growth and evolution of an analog edifice.
Derrien, A., Villeneuve, N., Peltier, A., and Beauducel, F. (2015). Retrieving 65 years of volcano summit deformation from multitemporal structure from motion: the case of Piton de la Fournaise (La Réunion Island). Geophys. Res. Lett. 42, 6959–6966. doi: 10.1002/2015GL064820
Dieterich, J. H. (1988). Growth and persistence of Hawaiian volcanic rift zones. J. Geophys. Res. Solid Earth 93, 4258–4270. doi: 10.1029/JB093iB05p04258
Fukushima, Y., Cayol, V., and Durand, P. (2005). Finding realistic dike models from interferometric synthetic aperture radar data: the February 2000 eruption at Piton de la Fournaise. J. Geophys. Res. Solid Earth 110. doi: 10.1029/2004JB003268
Galland, O., Holohan, E., de Vries, B. V. W., and Burchardt, S. (2015). “Laboratory modelling of volcano plumbing systems: a review,” in Physical Geology of Shallow Magmatic Systems. Advances in Volcanology (An Official Book Series of the International Association of Volcanology and Chemistry of the Earth's Interior), eds C. Breitkreuz and S. Rocchi (Cham: Springer), 147–214. doi: 10.1007/11157_2015_9
Greenfield, T., White, R. S., and Roecker, S. (2016). The magmatic plumbing system of the Askja central volcano, Iceland, as imaged by seismic tomography. J. Geophys. Res. Solid Earth 121, 7211–7229. doi: 10.1002/2016JB013163
Gudmundsson, A. (2002). Emplacement and arrest of sheets and dykes in central volcanoes. J. Volcanol. Geotherm. Res. 116, 279–298. doi: 10.1016/S0377-0273(02)00226-3
Gudmundsson, A. (2012). Magma chambers: formation, local stresses, excess pressures, and compartments. J. Volcanol. Geotherm. Res. 237, 19–41. doi: 10.1016/j.jvolgeores.2012.05.015
Guldstrand, F., Burchardt, S., Hallot, E., and Galland, O. (2017). Dynamics of surface deformation induced by dikes and cone sheets in a cohesive Coulomb brittle crust. J. Geophys. Res. Solid Earth 122, 8511–8524. doi: 10.1002/2017JB014346
Hildner, E., Klügel, A., and Hauff, F. (2011). Magma storage and ascent during the 1995 eruption of Fogo, Cape Verde Archipelago. Contrib. Mineral. Petrol. 162:751. doi: 10.1007/s00410-011-0623-6
Hyndman, D. W., and Alt, D. (1987). Radial dikes, laccoliths, and gelatin models. J. Geol. 95, 763–774. doi: 10.1086/629176
Ito, G., and Martel, S. J. (2002). Focusing of magma in the upper mantle through dike interaction. J. Geophys. Res. Solid Earth 107, ECV 6-1–ECV 6-17. doi: 10.1029/2001JB000251
Jónsson, S. (2009). Stress interaction between magma accumulation and trapdoor faulting on Sierra Negra volcano, Galápagos. Tectonophysics 471, 36–44. doi: 10.1016/j.tecto.2008.08.005
Kavanagh, J. L., Engwell, S. T., and Martin, S. (2018). A review of analogue and numerical modelling in volcanology. Solid Earth 9, 531–571.
Kavanagh, J. L., Menand, T., and Daniels, K. A. (2013). Gelatine as a crustal analogue: determining elastic properties for modelling magmatic intrusions. Tectonophysics 582, 101–111. doi: 10.1016/j.tecto.2012.09.032
Kavanagh, J. L., Menand, T., and Sparks, R. S. J. (2006). An experimental investigation of sill formation and propagation in layered elastic media. Earth Planet. Sci. Lett. 245, 799–813. doi: 10.1016/j.epsl.2006.03.025
Keating, G. N., Valentine, G. A., Krier, D. J., and Perry, F. V. (2008). Shallow plumbing systems for small-volume basaltic volcanoes. Bull. Volcanol. 70, 563–582. doi: 10.1007/s00445-007-0154-1
Kervyn, M., Ernst, G. G. J., van Wyk de Vries, B., Mathieu, L., and Jacobs, P. (2009). Volcano load control on dyke propagation and vent distribution: insights from analogue modelling. J. Geophys. Res. Solid Earth 114. doi: 10.1029/2008JB005653
Le Corvec, N., and McGovern, P. J. (2018). The effect of ocean loading on the growth of basaltic ocean island volcanoes and their magmatic plumbing system. Front. Earth Sci. 6:119. doi: 10.3389/feart.2018.00119
Le Corvec, N., Spörli, K. B., Rowland, J., and Lindsay, J. (2013). Spatial distribution and alignments of volcanic centers: clues to the formation of monogenetic volcanic fields. Earth Sci. Rev. 124, 96–114. doi: 10.1016/j.earscirev.2013.05.005
Maccaferri, F., Bonafede, M., and Rivalta, E. (2011). A quantitative study of the mechanisms governing dike propagation, dike arrest and sill formation. J. Volcanol. Geotherm. Res. 208, 39–50. doi: 10.1016/j.jvolgeores.2011.09.001
Maccaferri, F., Richter, N., and Walter, T. R. (2017). The effect of giant lateral collapses on magma pathways and the location of volcanism. Nat. Commun. 8:1097. doi: 10.1038/s41467-017-01256-2
Marsh, B. D. (2015). “Magma chambers,” in The Encyclopedia of Volcanoes, 2nd Edn. ed H. Sigurdsson (Elsevier) 185–201.
Mata, J., Martins, S., Mattielli, N., Madeira, J., Faria, B., Ramalho, R. S., et al. (2017). The 2014–15 eruption and the short-term geochemical evolution of the Fogo volcano (Cape Verde): evidence for small-scale mantle heterogeneity. Lithos 288, 91–107. doi: 10.1016/j.lithos.2017.07.001
McLeod, P., and Tait, S. (1999). The growth of dykes from magma chambers. J. Volcanol. Geotherm. Res. 92, 231–245. doi: 10.1016/S0377-0273(99)00053-0
Michon, L., Ferrazzini, V., and Di Muro, A. (2016). “Magma paths at Piton de la Fournaise volcano,” in Active Volcanoes of the Southwest Indian Ocean, eds B. Patrick, L. Jean-François, D. M. Andrea, M. Laurent (Berlin; Heidelberg: Springer) 91–106. doi: 10.1007/978-3-642-31395-0_7
Michon, L., Ferrazzini, V., Di Muro, A., Villeneuve, N., and Famin, V. (2015). Rift zones and magma plumbing system of Piton de la Fournaise volcano: How do they differ from Hawaii and Etna? J. Volcanol. Geotherm. Res. 303, 112–129. doi: 10.1016/j.jvolgeores.2015.07.031
Münn, S., Walter, T. R., and Klügel, A. (2006). Gravitational spreading controls rift zones and flank instability on El Hierro, Canary Islands. Geol. Mag. 143, 257–268. doi: 10.1017/S0016756806002019
Pansino, S., and Taisne, B. (2018). How magmatic storage regions attract and repel propagating dikes. J. Geophys. Res. Solid Earth. doi: 10.1029/2018JB016311
Paquet, F., Dauteuil, O., Hallot, E., and Moreau, F. (2007). Tectonics and magma dynamics coupling in a dyke swarm of Iceland. J. Struct. Geol. 29, 1477–1493. doi: 10.1016/j.jsg.2007.06.001
Peltier, A. (2007). Monitoring, Modelling and Evolution of Magma Injection Processes at Piton de La Fournaise Volcano (Reunion island), From a Cross-Analysis of Deformation, Geochemical and Structural Data. Ph.D. thesis, Université de la Réunion, Réunion France.
Ramberg, H. (1981). Gravity, Deformation, and the Earth's Crust: in Theory, Experiments, and Geological Application. Academic press.
Roche, O., De Vries, B. V. W., and Druitt, T. H. (2001). Sub-surface structures and collapse mechanisms of summit pit craters. J. Volcanol. Geotherm. Res. 105, 1–18. doi: 10.1016/S0377-0273(00)00248-1
Roman, A., and Jaupart, C. (2014). The impact of a volcanic edifice on intrusive and eruptive activity. Earth Planet. Sci. Lett. 408, 1–8. doi: 10.1016/j.epsl.2014.09.016
Roult, G., Peltier, A., Taisne, B., Staudacher, T., Ferrazzini, V., and Di Muro, A. (2012). A new comprehensive classification of the Piton de la Fournaise activity spanning the 1985–2010 period. Search and analysis of short-term precursors from a broad-band seismological station. J. Volcanol. Geotherm. Res. 241, 78–104. doi: 10.1016/j.jvolgeores.2012.06.012
Ryan, M. P. (1988). The mechanics and three-dimensional internal structure of active magmatic systems: Kilauea Volcano, Hawaii. J. Geophys. Res. Solid Earth 93, 4213–4248. doi: 10.1029/JB093iB05p04213
Sigmundsson, F., Hooper, A., Hreinsdóttir, S., Vogfjörd, K. S., Ófeigsson, B. G., Heimisson, E. R., et al. (2015). Segmented lateral dyke growth in a rifting event at Bárð*arbunga volcanic system, Iceland. Nature 517, 191–195. doi: 10.1038/nature14111
Staudacher, T., Ferrazzini, V., Peltier, A., Kowalski, P., Boissier, P., Catherine, P., et al. (2009). The April 2007 eruption and the Dolomieu crater collapse, two major events at Piton de la Fournaise (La Réunion Island, Indian Ocean). J. Volcanol. Geotherm. Res. 184, 126–137. doi: 10.1016/j.jvolgeores.2008.11.005
Taisne, B., and Tait, S. (2009). Eruption versus intrusion? Arrest of propagation of constant volume, buoyant, liquid-filled cracks in an elastic, brittle host. J. Geophys. Res. Solid Earth 114. doi: 10.1029/2009JB006297
Taisne, B., Tait, S., and Jaupart, C. (2011). Conditions for the arrest of a vertical propagating dyke. Bull. Volcanol. 73, 191–204. doi: 10.1007/s00445-010-0440-1
Tibaldi, A. (2015). Structure of volcano plumbing systems: a review of multi-parametric effects. J. Volcanol. Geotherm. Res. 298, 85–135. doi: 10.1016/j.jvolgeores.2015.03.023
Walter, T. R., and Troll, V. R. (2003). Experiments on rift zone evolution in unstable volcanic edifices. J. Volcanol. Geotherm. Res. 127, 107–120. doi: 10.1016/S0377-0273(03)00181-1
Watanabe, T., Masuyama, T., Nagaoka, K., and Tahara, T. (2002). Analog experiments on magma-filled cracks. Earth Planets Space 54, 1247–1261. doi: 10.1186/BF03352453
Keywords: volcano, growth, edifice, stress state, magma transfer, analog, experiment, intrusions
Citation: Derrien A and Taisne B (2019) 360 Intrusions in a Miniature Volcano: Birth, Growth, and Evolution of an Analog Edifice. Front. Earth Sci. 7:19. doi: 10.3389/feart.2019.00019
Received: 25 October 2018; Accepted: 31 January 2019;
Published: 19 February 2019.
Edited by:
Yosuke Aoki, The University of Tokyo, JapanReviewed by:
Matthieu Kervyn, Vrije University Brussel, BelgiumAlessandro Bonaccorso, Istituto Nazionale di Geofisica e Vulcanologia (INGV), Italy
Frank Bo Buster Guldstrand, University of Oslo, Norway
Copyright © 2019 Derrien and Taisne. This is an open-access article distributed under the terms of the Creative Commons Attribution License (CC BY). The use, distribution or reproduction in other forums is permitted, provided the original author(s) and the copyright owner(s) are credited and that the original publication in this journal is cited, in accordance with accepted academic practice. No use, distribution or reproduction is permitted which does not comply with these terms.
*Correspondence: Allan Derrien, derrien@ipgp.fr