Low-Temperature Clay Mineral Dehydration Contributes to Porewater Dilution in Bering Sea Slope Subseafloor
 Akira Ijiri1,2*
  Naotaka Tomioka1
  Shigeyuki Wakaki1 Harue Masuda3 Katsumi Shozugawa4 Sunghan Kim5
  Boo-Keun Khim6 Masafumi Murayama7
  Motoyuki Matsuo4
  Fumio Inagaki1,2,8
- 1Kochi Institute for Core Sample Research, Japan Agency for Marine-Earth Science and Technology, Nankoku, Japan
- 2Research and Development Center for Submarine Resources, Japan Agency for Marine-Earth Science and Technology, Yokosuka, Japan
- 3Department of Biology and Geosciences, Osaka City University, Osaka, Japan
- 4Graduate School of Arts and Sciences, University of Tokyo, Tokyo, Japan
- 5Division of Polar Paleoenvironment, Korea Polar Research Institute, Incheon, South Korea
- 6Department of Oceanography, Pusan National University, Busan, South Korea
- 7Center for Advanced Marine Core Research, Kochi University, Nankoku, Japan
- 8Research and Development Center for Ocean Drilling Science, Japan Agency for Marine-Earth Science and Technology, Yokohama, Japan
Widespread diagenesis of clay minerals occurs in deeply buried marine sediments under high-temperature and high-pressure conditions. For example, the smectite-to-illite (S-I) transformation has been often observed in sediments at in situ temperatures above ~60°C. However, it remains largely unknown whether such diagenetic processes naturally occur in relatively shallow and low-temperature sediments and, if so, what the consequences are of any related chemical reactions to the geochemical characteristics in the deep biosphere. We evaluated the possibility of naturally occurring S-I transformation at temperatures below 40°C in continental slope sediments of the Bering Sea by examining porewater chemistry, clay mineralogy, and chemical composition of clay minerals measured to ~800 m beneath the seafloor (mbsf) in core samples acquired during Integrated Ocean Drilling Program Expedition 323. In porewater from these cores, chloride concentrations decreased with increasing depth from 560 mM near the seafloor to 500 mM at ~800 mbsf; δ18O increased from 0 to 1.5‰; and δD decreased from −1 to −9‰. These trends are consistent with the addition of water derived from S-I transformation. The discrete low Cl− spikes observed between ~200 and ~450 mbsf could be attributed to the dissociation of methane hydrate. X-ray diffraction analysis of the clay-size fraction (<2 μm) showed an increase of illite content in the I/S mixed layer with increasing depth to 150 mbsf. This increase may imply the occurrence of S-I transformation. The decrease of Fe3+/Fe2+ in the clay-size fraction with increasing depth strongly suggests microbial reduction of Fe(III) in clay minerals with burial, which also has the potential to promote the S-I transformation. Our results imply the significant ecological roles on the diagenesis of siliciclastic clay minerals underlying the high-productivity surface seawater at continental margins.
Introduction
The smectite-to-illite (S-I) transformation is a ubiquitous and important feature of post-sedimentary alteration processes. Smectite is primarily formed by alteration of volcaniclastic materials (Banfield et al., 1991). During burial diagenesis, smectite is transformed to the more stable clay mineral illite. This process releases silica, interlayer water, and cations associated with K fixation (e.g., Perry and Hower, 1972; Freed and Peacor, 1989; Huang et al., 1993), as indicated in the following reaction (Perry and Hower, 1972):
The release of silica and cations has been suggested as a source of silica or carbonate cements, affecting the porosity of associated sediment (e.g., Hower et al., 1976; Lynch et al., 1997). The release of water may induce high pore-fluid pressure, faulting, and migration of hydrocarbon gases (Bruce, 1984; Freed and Peacor, 1989; Brown et al., 2001). The S-I transformation is conventionally considered to be promoted at high temperature and high pressure conditions in deep burial sediments (Perry and Hower, 1970; Eberl and Hower, 1976; Hower et al., 1976; Freed and Peacor, 1989; Pytte and Reynolds, 1989). The optimal temperature range for this reaction is ca. 60–160°C. Therefore, the transformation proceeding through illite-smectite (I/S) mixed-layer intermediates, in which the percentage of illite layers increases with increasing temperature, has been used as a geothermometer to constrain estimates of a basin's history (e.g., Perry and Hower, 1970; Pytte and Reynolds, 1989; Huang et al., 1993). However, the S-I transformation is more complex than conventional thought and that chemical variables may also affect the rate of reaction (e.g., Inoue et al., 1988; Whitney and Northrop, 1988). For example, the transformation is dependent on precursor compositions as on the availability of K+ and Al3+ from other mineral phases (Kastner et al., 1991). The rate of transformation is also affected by the abundance of water in the system (Whitney, 1990). Reducing the water content retards the S-I transformation.
In addition to the physically and chemically driven clay mineral alteration, experimental studies have demonstrated that microbial reduction of Fe(III) in smectite promotes S-I transformation at temperatures below 40°C (Kim et al., 2004; Koo et al., 2016). Kim et al. (2004) inferred that this process occurs through a decrease of the positive charge in the octahedral sheet as a result of Fe(III) reduction accompanied by K fixation in the interlayers to balance the charge. Other experimental studies have shown that microbial activity promotes the S-I transformation (Zhang et al., 2007a,b), but the transformation at temperatures below 40°C has rarely been reported in natural sedimentary environments. Buatier et al. (1992) presented evidence based on transmission electron microscope (TEM) observations that some smectite is transformed at temperatures below 30°C associated with the décollement zone in the Barbados accretionary wedge, where the water/rock ratio is high and fluid circulation is very active. However, direct evidence is lacking for microbial promotion of S-I transformation in the natural environment.
In this context, it has been presumed that clay mineral dehydration has been promoted by microbial Fe(III) reduction in Bering Sea Slope sediments on the basis of porewater chemistry obtained during Integrated Ocean Drilling Program (IODP) Expedition 323 (Takahashi et al., 2011a; Pierre et al., 2016). In Bering Sea Slope sediments, the significant decreases of both porewater salinities and Cl− concentrations between ~150 and 300 mbsf have been attributed to the release of low-salinity crystal water from S-I transformation (Takahashi et al., 2011b). In addition, Fe-rich authigenic carbonates formed during later diagenesis and deeper burial from a 13C-enriched dissolved inorganic carbon pool related to methanogenesis have been observed (Pierre et al., 2016). The precipitation of Fe-rich carbonate requires not only dissolved inorganic carbon but also dissolved Fe2+ in porewater. Indeed, elevated dissolved Fe2+ concentrations in porewater with a concentration peak of around 100 mbsf have been observed (Takahashi et al., 2011b). Based on these observations, Pierre et al. (2016) hypothesized that the reduction of Fe(III) in clay minerals by methanogen promotes low-temperature S-I transformation and subsequently releases Fe2+ to porewater. However, the onboard porewater chemistry results are not evidence for either the release of crystal water as a result of S-I transformation or the reduction of Fe(III) in clay minerals, because there are other possible explanations for the decrease of salinity, such as the dissociation of methane hydrate (Takahashi et al., 2011b). In addition, supporting mineralogical and chemical data for low-temperature S-I transformation and reduction of Fe(III) in clay minerals are lacking.
In this study, we evaluated the hypothesis that microbial Fe(III) reduction in clay mineral, which can promote S-I transformation, and S-I transformation both occur at temperatures below 40°C in continental slope sediments of the Bering Sea down to ~800 mbsf by examining porewater chemistry, clay mineralogy, and chemical compositions of clay minerals.
Environmental Setting
The Bering Sea is a marginal sea of the North Pacific Ocean that is enclosed by the Alaska Peninsula to the east and northeast, the Aleutian Islands to the south, and the Russian mainland and the Kamchatka Peninsula to the west and northwest. Sediment core samples were obtained by the drilling vessel JOIDES Resolution at three sites during IODP Expedition 323 in July-September 2009: Site U1343 (water depth 1,952 m, core depth 745 mbsf) and Site U1344 (water depth 3,172 m, core depth 745 mbsf) on the northeastern Bering Sea Slope, and Site U1341 (water depth 2,177 m, core depth 600 mbsf) on Bowers Ridge, which extends ~300 km northward from the Aleutian Islands (Figure 1).
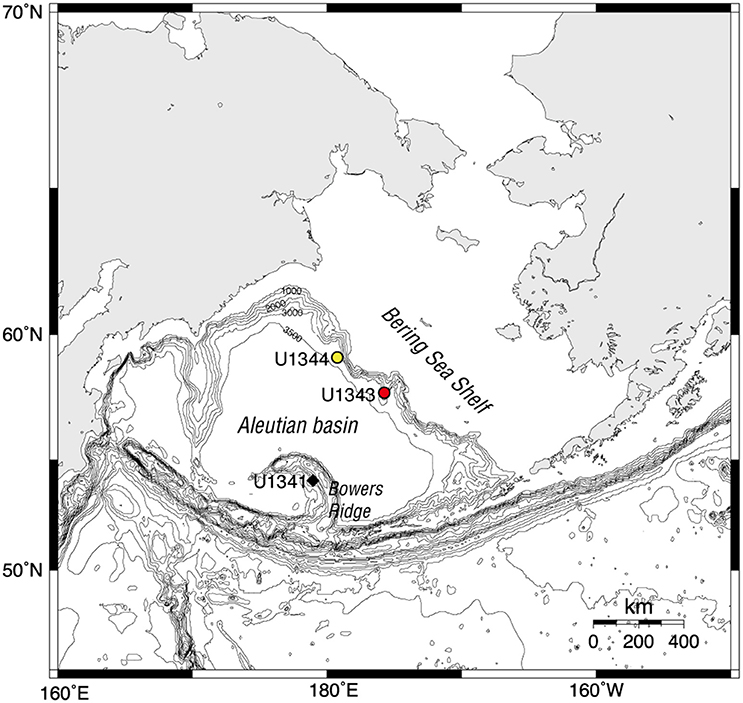
Figure 1. Location map of the Bering Sea showing IODP Sites U1341, U1343, and U1344. The bathymetry map was reproduced from Ijiri et al. (2012) with the permission of the copyright holder (Elsevier) (License number: 4272310281900).
The Bering Sea Slope is an area of extremely high primary production, where nutrients are probably transported from the euphotic zone by tidal mixing on the continental shelf and slope as well as by transverse circulation in the Bering Slope Current, including mesoscale eddies near the shelf edge (e.g., Springer et al., 1996). Siliciclastic material is the dominant component of the Bering Sea Slope sediments. The sedimentation rate is very high because the input of siliciclastic material from the continental shelf is large (21–58 cm ky−1 at Site U1343 and 29–50 cm ky−1 at Site U1344; see Takahashi et al., 2011a), and the burial rate of organic carbon is also high, providing favorable sedimentary habitats for organic-fueled microbial communities (Wehrmann et al., 2011; Kallmeyer et al., 2012). The geothermal gradients measured at depths down to 130–140 mbsf at Sites U1343 and U1344 are 49.0 and 53.3°C km−1, respectively (Takahashi et al., 2011b). If it can be assumed that these gradients are linear throughout the cored sediment columns, then the in situ temperatures in the cores should be generally below 40°C.
Site U1341, at Bowers Ridge, is in the open marine domain of the Bering Sea (Takahashi et al., 2011a). The sediments there are dominated by diatomic oozes and the sedimentation rate is ~12 cm ky−1 (Takahashi et al., 2011a). The geothermal gradient at Bowers Ridge, at 67.8°C km−1, is steeper than the gradient at the Bering Sea Slope sites. Given the high thermal gradient at Site 1341, the depth where S-I transformation occurs is the shallowest as Site 1341.
Materials and Methods
Analyses of Porewater Samples
Porewater samples were extracted on board after core recovery by using a stainless steel squeezer (Manheim and Sayles, 1974; Takahashi et al., 2011b). Concentrations of Cl− and K+ in the porewater samples were measured on board with an ion chromatograph, and dissolved Fe concentration was also measured on board by inductively coupled plasma optical emission spectroscopy (Takahashi et al., 2011b).
Oxygen isotopic compositions (δ18O) of porewater samples were analyzed at the Kochi Core Center (KCC) by using a mass spectrometer (GV IsoPrime, UK) with an automated CO2-H2O equilibration system (GV MultiPrep, UK). The standard deviation from repeated oxygen isotope analyses of the laboratory standard (Indian Ocean deep sea water) was <0.03‰. Results are presented here as per mil deviation from Vienna Standard Mean Ocean Water (VSMOW).
Hydrogen isotopic compositions (δD) of porewater samples were analyzed by laser absorption spectroscopy (LWIA-24-EP, Los Gatos Research Inc., USA) at KCC. The standard deviation from repeated hydrogen isotope analysis of the laboratory standard (Indian Ocean deep seawater) was <0.3‰.
Sediment Samples
Sediment aliquot samples for analyses of the mineral and chemical compositions of the clay-size fraction were collected at the KCC from core samples taken at Sites U1341, U1343, and U1344. The sampling interval was 50 m at depths shallower than 300 mbsf and 100 m at depths below 300 mbsf. The sediment comprises mainly two components, opaline diatom valves, and siliciclastic grains (mainly clay and fine silt size) (Aiello and Ravelo, 2012). The sediment from Site U1341 on the Bowers Ridge is mainly composed of the biogenic sediment. The terrigenous sources are a Kamchatkan-Aleutian and the Yukon River (Aiello and Ravelo, 2012). The Aleutian Ridge, a volcanic-plutonic arc, is the source for the majority of the abundant pyroclastic material.
The clay-size fraction (<2 μm) was separated by centrifuge at 1,500 rpm for 1 min. The size of the clay-size fraction in the bulk sediment was determined by weighing the dried bulk sediment sample and the separated clay-size fraction.
X-Ray Diffraction Analysis of the Clay-Size Fraction
We performed X-ray diffraction (XRD) analysis to determine the mineralogy of the clay-size fractions. Suspensions of clay were dropped onto glass slides and dried in an oven at 50°C to prepare oriented samples. XRD patterns of oriented samples were obtained with an X-ray diffractometer (Spectris PANalytical, X'pert PRO MPD) using CuKα radiation at 40 kV and 40 mA, with 1/2° divergence and anti-scattering slits, a 1/2° receiving slit, and a 0.021° s−1 scan rate at steps of 0.017° in 2θ. After this scanning, the samples were saturated with ethylene glycol (EG) vapor at 50°C for more than 5 h (referred to here as the EG state), and then the XRD scanning was repeated. For each sample, the saturation in EG vapor and XRD scanning were performed twice, that is, the same oriented sample was saturated with EG vapor again for 5 h and rescanned.
We calculated the proportions of illite and smectite crystallites in the illite/smectite (I/S) mixed-layer phases by employing the technique of Moore and Reynolds (1997), using the angular separation (Δ°2θ) between the composite illite-(001)/smectite-(002) reflection (at 2θ ≈ 10.5°) and the composite illite-(002)/smectite-(003) reflection (at 2θ ≈ 16°) to determine the I/S ratio. For the objective determination of the angle of the subtle peaks of the composite illite-(001)/smectite-(002) reflection and the composite illite-(002)/smectite-(003) reflection, we used the software package X'Pert HighScore (PANalytical B.V., Netherlands). First, we subtracted the baseline from the XRD spectrum, and then the angles of the peaks were automatically determined by the software. We used the average values for the angles determined from duplicate XRD scanning. The average errors in the interlayer smectite percentage when this method is used have been reported to be 2–8% (Hathon, 1992). We also used previously published XRD data for sample splits from Site U1343 (Kim et al., 2015) to calculate the illite content in the I/S mixed-layer phase. In total, we used data from 184 splits of sediment samples from Site U1343. These splits were retrieved at intervals of ~1.6 m at 0–145 mbsf and ~5 m at 330–745 mbsf. We used an age model for Site U1343 based on oxygen isotope stratigraphy of benthic foraminifers for the same site (Asahi et al., 2014; Kim et al., 2015) to classify the XRD data from Site U1343 into glacial or interglacial sediments.
The proportions of dominant clay minerals in the clay-size fraction were estimated semi-quantitatively following Biscaye (1965). We identified the small contribution of kaolinite(002) in the peak at 24–26° and decomposed this peak into elementary peaks of kaolinite(002) and chlorite(004) using Profile Fit Software (Philips PROFIT v.1.0) (Guo and Underwood, 2011). We then determined the relative compositions of kaolinite and chlorite.
Transmission Electron Microscope Observations
Two sediment samples in which high peak intensities of clay minerals were observed in the X-ray diffractograms for the Site U1343 core were subjected to TEM analysis: 28H-5w-70-71cm (267.7 mbsf) and 83X-6w-75-76cm (778.175 mbsf). The samples were embedded in LR White epoxy resin (hard grade) as described by Kim et al. (1995) and Uramoto et al. (2014). A previous problem in TEM investigation of I/S mixed-layer minerals was the collapse of expandable interlayers under high vacuum, making the discrimination of smectite and illite layers very difficult. Recent improvements in imaging and sample preparation techniques have addressed this problem by the permanent expansion of smectite interlayers using L.R. White resin (Kim et al., 1995). A portion was processed into an ultrathin foil measuring 10 × 5 μm and ~100 nm thick, using a Ga-ion beam after deposition of carbon protection layers in a focused ion beam apparatus (FIB, Hitachi SMI4050). The foil was mounted on a Cu grid and then studied using a TEM (JEOL JEM-ARM200F) operated at an accelerating voltage of 200 kV. Microtextures were investigated by the lattice fringe imaging technique. Chemical compositions of the mineral particles were obtained by an energy-dispersive X-ray spectrometer with a 100 mm2 silicon drift detector, using a beam spot size larger than 20 nm and an acquisition time shorter than 30 s to minimize selective elemental loss due to electron beam damage during measurement.
57Fe Mössbauer Spectroscopy of the Clay-Size Fraction
To identify the chemical states of iron in the clay-size fractions, we investigated 12 samples from Site U1343 and 6 samples from U1344 by 57Fe Mössbauer spectroscopy. Mössbauer spectra were measured with a Topologic Systems MFD-110D Mössbauer spectrometer at the University of Tokyo by using a 1.11 GBq 57Co/Rh source at room temperature. By comparing the Mössbauer parameters (isomer shift, quadrupole splitting, and internal magnetic field) to standard data, we identified Fe2+ and Fe3+ constituents and then calculated their relative abundances. Mössbauer spectra were calculated by a least-squares method with restrictions of intensity and half-width of peaks. All doublets were treated as symmetric.
Major and Trace Elements of the Clay-Size Fraction
The major-element concentrations of the clay-size fractions were analyzed by inductively coupled plasma mass spectrometry (ICP-MS). The clay-size fractions were decomposed by mixed HF-HNO3 acids, dried, and dissolved in 3 M HNO3. Samples were diluted and measured with the Agilent 7700 ICP-MS at the KCC using In as an internal standard.
Results
Porewater Chemistry
At both sites on the Bering Sea Slope (U1343 and U1344), the Cl− concentrations in porewater generally decreased with increasing depth from ~560 to 500 mM, although the values varied widely (Figures 2A,B). At Site U1343, the concentrations at depths shallower than 420 mbsf were scattered, and some negative excursions (discrete low Cl− spikes) were observed between 150 and 420 mbsf (Figure 2A). At Site U1344, concentrations were also scattered, with discrete low Cl− spikes around 270 and 360 mbsf (Figure 2B). At Site U1341 on Bowers Ridge, the Cl− concentration was nearly constant at ~550 mM (Figure 2C).
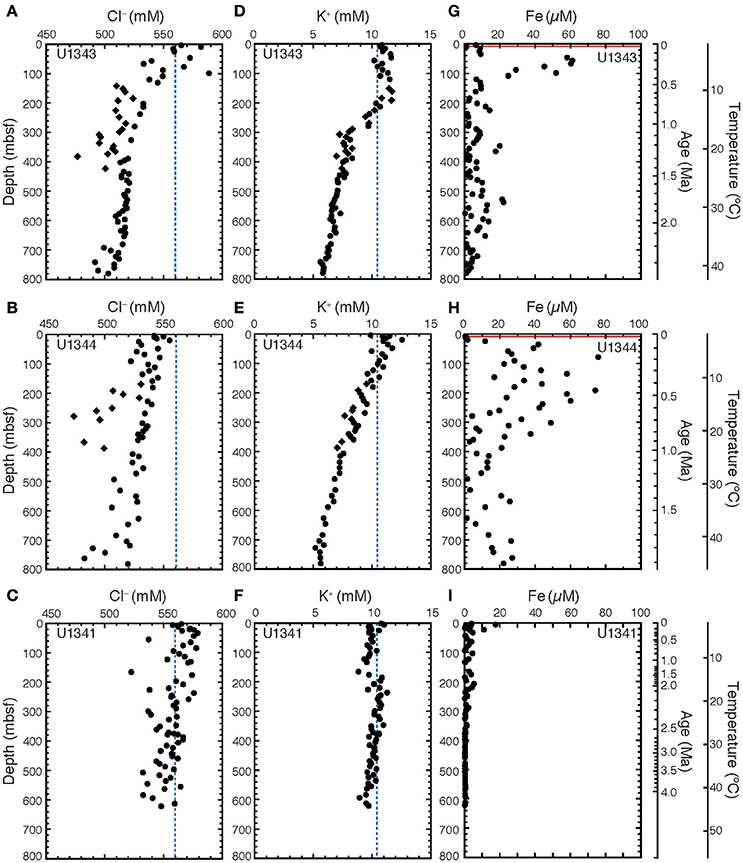
Figure 2. Chemical compositions of porewater at Sites U1341, U1343, and U1344. Vertical profiles of porewater of Cl− for (A) U1343, (B) U1344, and (C) U1341; of K+ for (D) U1343, (E) U1344, and (F) U1341; and of Fe for (G) U1343, (H) U1344, and (I) U1341. Diamonds show discrete low Cl− spikes between 150 and 420 mbsf at Sites U1343 and U1344. These data were reported in Takahashi et al. (2011b). The blue dashed lines in (A–F) show Cl− and K+ concentrations in seawater. The red lines in (G,H) show the depth of SMTZ (Wehrmann et al., 2011). The age model was based on Horikawa et al. (2015) for Site U1341, Asahi et al. (2014) for Site U1343, and Okazaki et al. (2016) and Takahashi et al. (2011b) for Site U1344. Temperature are estimated by extrapolating the geothermal gradients measured at depths down to 130–140 mbsf.
The K+ concentration in porewater at Site U1343 slightly increased from 10 mM near the sediment surface to 12 mM at 150 mbsf, then decreased to ~6 mM at greater depths (Figure 2D). The K+ concentration decreased with increasing depth at Site U1344, (Figure 2E), but no decrease was observed at Site U1341 (Figure 2F).
The dissolved Fe concentrations in porewater at Sites U1343 and U1344 were highly scattered, ranging from 0 to 80 μM (Figures 2G,H). At Site U1343, the Fe concentration reached a maximum of 60 μM at ~50 mbsf and was <25 μM below a depth of 100 mbsf (Figure 2G). At Site U1344, the Fe concentration reached a maximum of 80 μM at 100–200 mbsf and was <30 μM below 400 mbsf (Figure 2H). At Site U1341, the Fe concentration reached a maximum value of 17 μM at 4 mbsf and was <5 μM or not detected below 20 mbsf (Figure 2I).
The vertical profiles of δ18O and δD in porewater at all three sites showed peaks at around 30–50 mbsf (Figures 3A–F). At Site U1343, δ18O increased from +0.2 to +1.8‰ with increasing depth, whereas δD continued to decrease from −2to −10‰ with increasing depth below ~120 mbsf (Figures 3A,D). At Site U1344, δ18O increased from +0.2 to +1.4‰, whereas δD continued to decrease from −2 to −9‰ with increasing depth below ~140 mbsf (Figures 3B,E). At Sites U1343 and U1344, the δ18O and δD-values below 120–140 mbsf were strongly negatively correlated (Figures 3G,H). Their changes seemed to be proportional to the decrease in Cl− concentrations (Figures 2A,B) with increasing depth. More specifically, the plots of Cl− concentrations vs. δ18O and δD below 120–140 mbsf at Sites U1343 and U1344 show two trends.
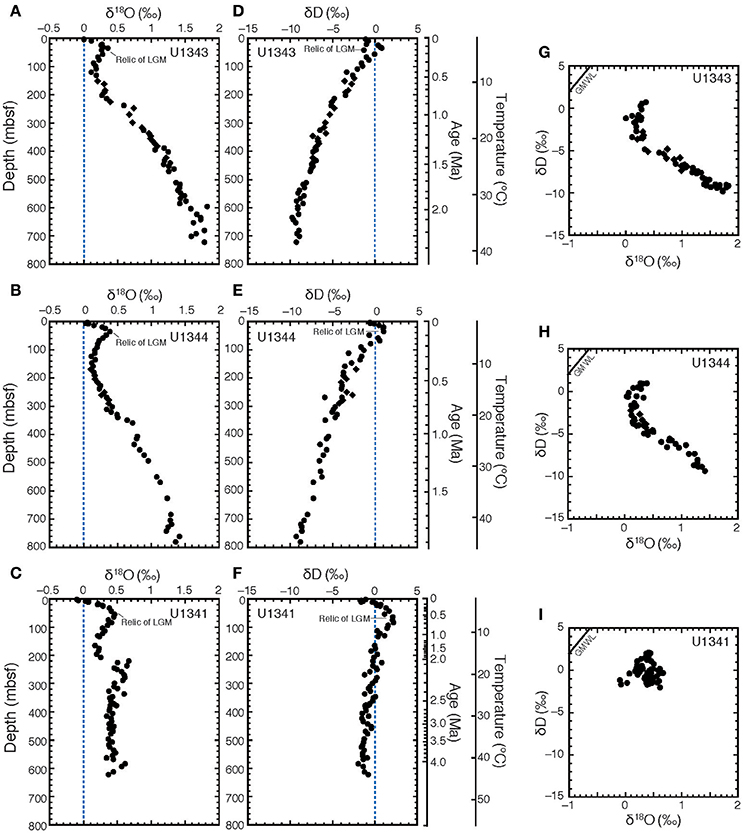
Figure 3. Stable oxygen and hydrogen isotopic compositions of porewater at Sites U1341, U1343, and U1344. Vertical profiles of porewater are shown of δ18O for (A) U1343, (B) U1344, and (C) U1341, and of δD for (D) U1343, (E) U1344, and (F) U1341. δ18O vs. δD for (G) Sites U1343, (H) U1344, and (I) U1343 are also shown. Diamonds show samples with discrete low Cl− spikes between 200 and 420 mbsf at Sites U1343 and U1344. The blue dashed lines in (A–F) show the value of standard mean ocean water (0‰ VSMOW). Black solid lines in (G–I) show global meteoric water line (GMWL).
The discrete low Cl− spikes observed between ~200 and ~450 mbsf at Sites U1343 and U1344 show 18O enrichment proportional to Cl− depletion with weak to moderate correlation, but very weak or no correlation between Cl− and δD (R2 < 0.1) (Figures 4A,B,D,E). At Site U1343, the discrete low Cl− spikes observed between 141 mbsf and 225 mbsf show no relationship with δ18O and δD, but the discrete low Cl− spikes between 247 and 423 mbsf show a weak correlation in that the enrichment of 18O is proportional to the depletion of Cl− (R2 = 0.31) (Figures 4A,D). At Site U1344, the discrete low Cl− spikes at around 270 and 360 mbsf show that enrichment of 18O is proportional to the depletion of Cl− with a moderate correlation (R2 = 0.55) (Figures 4B,E).
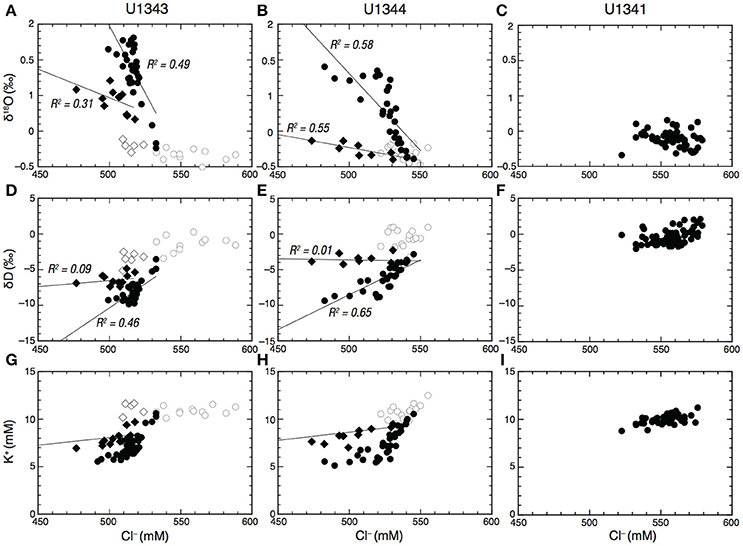
Figure 4. Cl− vs. δ18O (A–C), δD (D–F), and K+ (G–I) in porewater at Sites U1341, U1343, and U1344, respectively. Open circles in (A,B), (D,E), and (G,H) show samples shallower than 120–140 mbsf at Sites U1343 and U1344. Open diamonds in (A,B) show discrete low Cl− spikes shallower than 200 mbsf at U1343. Filled diamonds show discrete low Cl− spikes between 200 mbsf and 450 mbsf at Sites U1343 and U1344. Solid lines in (A,B,D,F) show regression lines. Solid lines in (G) and (H) show the expected dilution line of seawater by freshwater.
In contrast to the discrete low Cl− spikes, most data fall on the trend line that clearly shows 18O enrichment and D depletion in proportion to Cl− depletion. At Site U1343, most porewater data show a moderate correlation between 18O enrichment and the depletion of Cl− (R2 = 0.49) and between D depletion and depletion of Cl− (R2 = 0.46) (Figures 4A,D). At Site U1344, most data show a moderate correlation between 18O enrichment and the depletion of Cl− (R2 = 0.58) and a strong correlation between D depletion and depletion of Cl− (R2 = 0.65) (Figures 4B,E).
The δ18O values at Site U1341 ranged from 0 to +0.6‰. They increased from 0.2‰ at 200 mbsf to 0.6‰ around 270 mbsf, and were almost constant at 0.4‰ below 300 mbsf (Figure 3C). The δD-values from Site U1341 ranged from −0.5 to +3‰. Below the high-δD peak at 60 mbsf, δD-values slightly decreased with increasing depth from 0 to −1‰ (Figure 3F).
XRD Analysis of the Clay-Size Fraction
Figure 5 shows representative examples of X-ray diffractograms for clay-rich and clay-poor samples taken from Site U1343. The distribution of peaks indicates that the clay-size fraction contained smectite, illite, chlorite, and kaolinite. The peak at 2θ ≈ 9° that was unaffected by EG solvation represents illite (001). The shift of the peak from 6.4° 2θ to 5.5° 2θ by EG saturation indicates a mixture of discrete smectite and mixed-layer I/S. The subtle peak at 2θ ≈ 10.5° represents the composite illite-(001)/smectite-(002) reflection. A composite reflection of illite-(002)/smectite-(003) at 2θ ≈ 16° was detected in the clay-rich sample (Figure 5A; Figures S1, S2). Figure 6 shows vertical profiles of X-ray diffractograms from Sites U1341, U1343, and U1344. The X-ray diffractograms from Sites U1343 and U1344 are similar. The peak intensities of clay minerals were lower in the samples from Site U1341 than in the samples from Sites U1343 and U1344. Composite reflections of illite-(002)/smectite-(003) were detected in the clay-rich samples from the Bering Sea Slope, whereas only a subtle illite-(002)/smectite-(003) peak was observed in the clay-poor Bowers Ridge sample (Figures S1, S2).
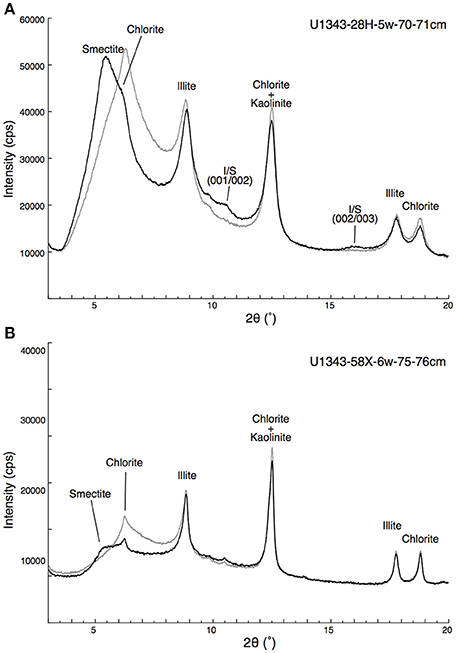
Figure 5. Representative X-ray diffractograms of the clay-size fraction at Site U1343. (A) Clay-rich sediment from U1343-28H-5w-70-71cm and (B) clay-poor sediment from U1343-58X-6w-75-76cm. Gray and black lines show results from air-dried and EG saturated samples, respectively.
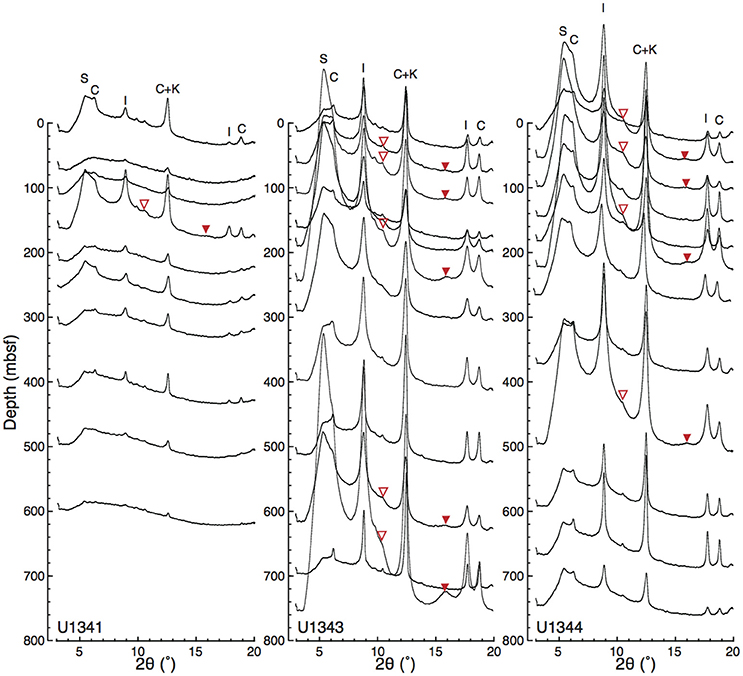
Figure 6. Vertical profiles of X-ray diffractograms from Sites U1341, U1343, and U1344. The base line of each diffractogram at its left edge (2θ = 3°) corresponds to sampling depth. Open and solid triangles indicate the detected composite reflections of illite-(001)/smectite-(002) and illite-(002)/smectite-(003), respectively. The enlarged views of the detected composite reflections are shown in Figures S1, S2.
The illite content in the I/S mixed layer was estimated from the angular separation (Δ°2θ) between the detected composite reflections of illite-(001)/smectite-(002) and illite-(002)/smectite-(003) (Figure 7; Tables S1, S2). At Site U1343, the inferred illite content in the I/S mixed-layer clay minerals was <6% at depths shallower than 144 mbsf, reached a maximum of 17% at 144 mbsf, and ranged from 5 to 14% with a wide scatter below 144 mbsf. The trend was similar at Site U1344; the content increased from 2% at 40.2 mbsf to 11% at 210.6 mbsf and then decreased to 8% at 485.3 mbsf. At Site U1341, the composite reflections of I/S were detected from only one sample at 164 mbsf, and the estimated illite content was 2% in the I/S mixed layer.
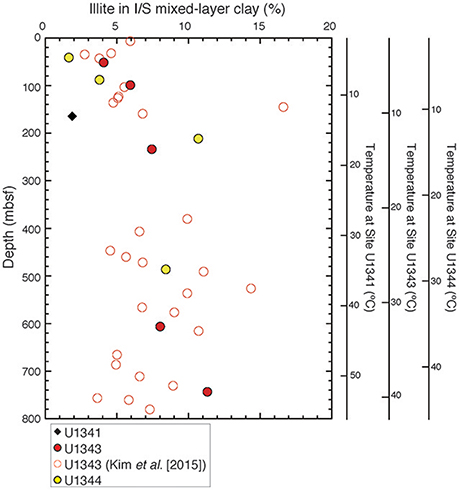
Figure 7. Vertical profile of illite content in the I/S mixed layer at Sites U1341, U1343, and U1344.
The clay-size fraction made up a larger proportion of each sample at Sites U1343 and U1344 (0.3–24 wt.%, 14 wt.% on average) than it did in the sediments of Site U1341 at Bowers Ridge (0.2–8.3 wt.%, 2.9 wt.% on average) (Figure 8A).
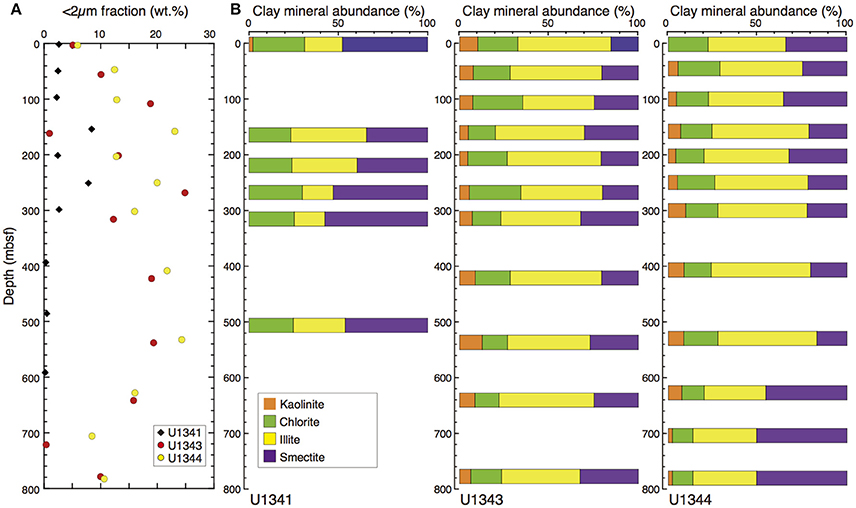
Figure 8. Clay-size fraction (<2 μm) and clay mineral composition at Sites U1341, U1343, and U1344. (A) Vertical profile of the clay-size fraction (<2 μm) in the bulk sediment. (B) Relative percentages of smectite, illite, chlorite, and kaolinite.
At Sites U1343 and U1344, the contents of smectite, illite, and chlorite + kaolinite in the clay-size fraction were 17–51, 31–53, and 13–33%, respectively (Figure 8B). At Site U1341, some X-ray diffractograms showed very low peak intensities of clay minerals and not all of the compositions could be estimated. The smectite contents were greater and illite contents were smaller than those at Sites U1343 and U1344.
TEM Observations
We identified particles of smectite, discrete illite, and chlorite in two samples from Site U1343 by TEM observation (Figures S3–S5). We also identified these clay minerals by XRD analysis (Figures 5, 6).
In the upper sample (28H-5w-70-71cm), we found one smectite particle 0.25 μm long containing a small portion of interlayered illite, as shown by a change in layer spacing from 1.3 nm (characteristic of smectite) to 1.0 nm, the (001) interlayer spacing of illite (e.g., Drits et al., 1997) (Figures 9a,b). Energy-dispersive X-ray analysis showed that these layers at the tip of the smectite particle had higher Al and K contents and lower Mg and Fe contents than the layers in the central part of the same particle, and the Mg/Si, Al/Si, K/Si, and Fe/Si X-ray intensity ratios likewise differed distinctly between the tip and the central part of the particle (Figure 9c).
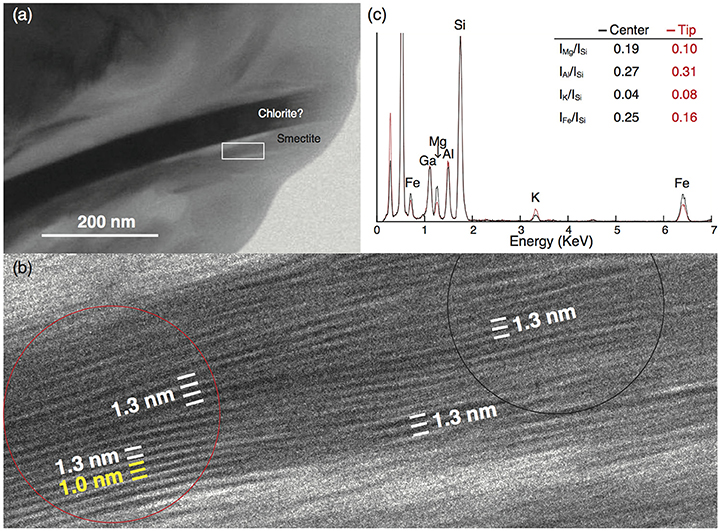
Figure 9. TEM micrograph of a smectite particle in sample 28H-5w-70-71cm (267.7 mbsf) from Site U1343. (a) Small smectite particles near a chlorite particle; the white rectangle outlines the area shown in (b). (b) High-resolution TEM lattice fringe image showing that smectite (interlayer spacing 1.3 nm) is partly transformed into illite (1.0 nm). Red and black circles outline the areas in the tip and central parts, respectively, that were analyzed by energy-dispersive X-ray spectroscopy (EDS). (c) EDS spectra of the tip (red line) and center (black line) of the smectite particle with the ratio of X-ray counts for each element. The intensities of Si peaks were matched to normalize the two spectrums. The Ga peak is an artifact of the Ga-ion beam used during the preparation of the ultrathin foil.
Fe3+/Fe2+ in the Clay-Size Fraction
Mössbauer spectroscopy showed that the samples from Sites U1343 and U1344 had similar vertical profiles of Fe3+ content in total Fe in the clay-size fraction, decreasing from ~70% near the sediment surface to ~60% at 300 mbsf and staying at 50–60% below 400 mbsf (Figure 10A). The Fe3+/Fe2+ ratios decreased from ~2.5 near the sediment surface to 1.5 at 30 mbsf and were lower than 1.5 below 400 mbsf (Figure 10B).
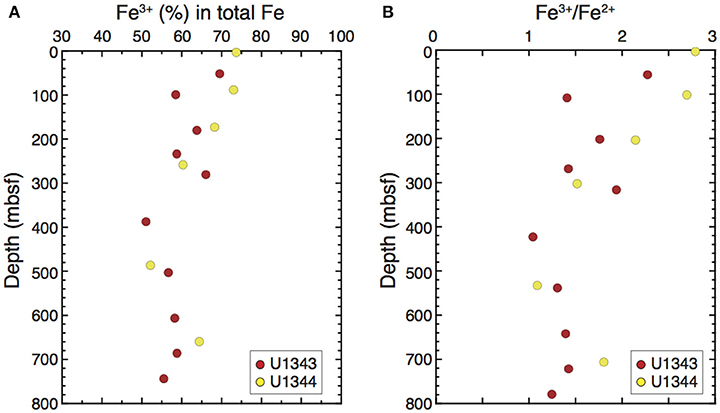
Figure 10. Vertical profile of the relative abundances of (A) Fe3+ in total Fe and (B) Fe3+/Fe2+ in the clay-size fraction at Sites U1343 and U1344 determined by 57Fe Mössbauer spectroscopy.
Major Elements in the Clay-Size Fraction
The major-element concentrations in the clay-size fraction were similar at Sites U1343 and U1344 (Figure S6, Table S1). The sample from Site U1341 had lower percentages of Mg, Al, K, Ca, and Fe than the samples from Sites U1343 and U1344. The chemical index of alteration (CIA) was calculated by molecular proportion:
(Nesbitt and Young, 1982) (Figure S7, Table S1). The index at Site U1341 ranged from 18 to 74. The indices at Sites U1343 and U1344 ranged from 61 to 76 (74 on average). The indices at Sites U1343 and U1344 were constant with depth.
Discussion
Clay Mineral Dehydration and Dissociation of Methane Hydrates Inferred by Porewater Chemistry
The vertical profiles of porewater chemistry in the Bering Sea Slope (Sites U1343 and U1344) display a decreased Cl− concentration with depth, a trend that was not observed at the Bowers Ridge site (U1341) (Figures 2A–C). The Cl− decrease suggests dilution of the original porewater with freshwater. Possible sources include water released by the dissociation of methane hydrate, freshwater derived from the dehydration of clay minerals (Takahashi et al., 2011b; Pierre et al., 2016), and opal diagenesis (Kastner et al., 1991).
The depletion of K+ with depth at Sites U1343 and U1344 may imply K+ uptake as interlayer K in newly formed illite during S-I transformation (Perry and Hower, 1972; Takahashi et al., 2011b). However, dilution with freshwater may also cause a decrease in K+ concentration. If dilution were the sole cause of the decrease in K+ concentration, then both K+ and Cl− would decrease in the same proportion. The plots of Cl− vs. K+ showed two trends: a decrease in K+ concentration consistent with freshwater dilution and a K+ concentration that was below the value expected from freshwater dilution (Figures 4G,H). The K+ concentrations corresponding to the discrete low Cl− spikes observed between 247 and 423 mbsf at Site U1343, and at around 270 and 360 mbsf at Site U1344 are consistent with freshwater dilution, suggesting that the discrete low Cl− spikes are caused by dilution without K+ uptake. In contrast, the other K+ concentrations, which are below the value expected from freshwater dilution (Figures 4G,H), suggest that K+ was taken up beyond the dilution factor. However, the uptake of K+ also occurs in other early diagenetic reactions, such as the exchange of K+ for other interlayer cations in smectite and weathered illite (Hover et al., 2002). Consequently, the depletions of Cl− and K+ in porewater are not definitive evidence of S-I transformation.
Oxygen and hydrogen isotopic compositions of porewater are important indicators of diagenetic processes and the origin of water. The vertical profiles of δ18O and δD in porewater at all three sites showed peaks at around 30–50 mbsf (Figures 2A,C). These peaks correspond to the relic of ambient bottom water at the time of the last glacial maximum. The changes in δ18O and δD of seawater caused by glaciation and deglaciation diffuse down from seafloor, and a large isotopic shift toward low values associated with the last deglaciation was mainly preserved after the attenuation. As a result, the vertical profile of porewater δ18O and δD shows an increase over the first 30–50 m below sea floor, followed by a decrease (Schrag and DePaolo, 1993).
There were two trends in the plots of Cl− concentrations vs. δ18O and δD below 120–140 mbsf at Sites U1343 and U1344. The discrete low Cl− spikes are associated with 18O-enrichment and no change of δD in proportion to Cl− depletion, whereas most of the other data show 18O-enrichment and D depletion in proportion to Cl− depletion (Figures 4A,B,D,E). These two trends strongly suggest that there are two freshwater components for the dilution.
The discrete low Cl− spikes suggest local dilution of the original porewater. The δ18O values of the freshwater component were estimated to be +5.0 ± 4.9‰ at Site U1343 and +2.1 ± 1.9‰ at Site U1344 (95% confidence interval) by extrapolating [Cl−] = 0 to the observed trend with 18O enrichment in proportion to the Cl− depletion of the discrete low Cl− spikes. These values are 2.5–5‰ higher than those of the base values (δ18O: ~0‰) at a Cl− of 530–540 mM. The recrystallization of biogenic opal is a possible source of freshwater in this case because opal diagenesis may enrich 18O but not affect D in porewater (Dählmann and De Lange, 2003). Another possible source of freshwater is the dissociation of methane hydrate, if in the sampling process the porewater was diluted by water released from methane hydrate that was enriched in 18O and D (Hesse and Harrison, 1981). The isotopic fractionation factors of oxygen and hydrogen in water between gas hydrate and liquid water were determined to be 1.0023–1.0032 and 1.014–1.022, respectively (Maekawa, 2004). The estimated end member (Cl− = 0 mM) δ18O values of freshwater for the discrete low Cl− spikes, which are 2.2–5‰ higher than the base values (Cl− ~530 mM, δ18O ~0‰ a), are similar to the previously reported oxygen isotopic fractionation. On the other hand, an unchanging δD combined with a decreasing Cl− is not consistent with the δD-value of hydrate water, which is 14–22‰ higher than the surrounding water. However, scattered Cl− values with negative excursions are characteristic of the dissociation of methane hydrate during core recovery and sampling (Ussler and Paull, 2001). Furthermore, regional studies have documented that, in the vicinity of Site U1343, the sequence acoustically displays a vertical series of bottom-simulating reflectors (BSRs). The shallowest reflector, at ~350 m, has been linked to the formation of interstitial methane gas hydrate, and a deeper one, at ~1 km, has been linked to the diagenetic transition of opal-A to opal-CT (Cooper et al., 1987; Takahashi et al., 2011b). At Site U1344, the posited hydrate BSR is acoustically weak, but the depth of the putative BSR is estimated to be ~450 mbsf (Takahashi et al., 2011b). It is therefore possible the discrete low Cl− spikes observed between ~200 mbsf and ~420 mbsf at Sites U1343 and U1344 can be attributed to the dissociation of methane hydrate during the core recovery. The maximum excursions of the discrete low Cl− spikes from the base values of vertical Cl− profiles are from ~520 to 495 mM (4.8%) at around 350 mbsf at Site U1343 (Figure 2A) and from ~530 to 473 mM (11%) at 278 mbsf at Site U1344 (Figure 2B), which indicates that the maximum contents of methane hydrate water in the porewater samples are only 4.8 and 11% at Sites U1343 and U1344, respectively. If the isotopic fractionation factor of hydrogen in water between gas hydrate and liquid water is 1.014–1.022 (Maekawa, 2004), then the δD-values at 350 mbsf at Site U1343 and 278 mbsf at Site U1344 showing the maximum excursion of low Cl− spikes should be 0.6–1.1 and 1.5–2.4‰ higher than the base value of the vertical δD profiles at Sites U1343 and Site U1344, respectively. These changes would be too small to be separately identified in a large δD variation.
In contrast to the data associated with the discrete low Cl− spikes, most data plotted on a trend showing 18O enrichment and D depletion in proportion to Cl− depletion, which clearly indicates that the porewater was originally diluted by a freshwater component other than methane hydrate water. The observed relations between δ18O and δD at the study sites (Figure 3) are far from the global meteoric water line (Craig, 1961) and make groundwater derived from land (meteoric water) a very unlikely source of the low-Cl− fluid. Opal diagenesis is also an unlikely source, because recrystallization of biogenic opal may enrich 18O but does not affect D in pore water (Dählmann and De Lange, 2003). In addition, shipboard XRD analysis did not reveal any evidence of silica diagenesis including transformation of Opal-A to Opal-CT, at Sites U1343 and U1344 (Takahashi et al., 2011b). The enrichment of 18O and depletion of D in proportion to Cl− depletion at Sites U1343 and U1344 indicate that the most plausible source of the freshwater is the dehydration reaction involving clay minerals, because smectite dewatering during the S-I transformation emits water enriched in 18O and depleted in D (Kastner et al., 1993; Dählmann and De Lange, 2003). If it is assumed that the isotopic compositions of porewater are determined by simple mixing with freshwater (Cl− = 0), the δ18O and δD-values of the freshwater component can be estimated by extrapolating [Cl−] = 0 to the observed porewater data; by doing so, the calculated values are +20.7 ± 7.5‰ and −78 ± 29‰, respectively, at Site U1343 and +12.1 ± 3.9‰ and −57 ± 15‰ at Site U1344 (95% confidence interval) (Figures 4, 11). The estimated end member (Cl− = 0) δ18O and δD-values of the freshwater component at Sites U1343 and U1344 agree fairly well with previously reported stable isotopic compositions of marine clay minerals, which range from +13 to +29‰ for δ18O and from −87 to −30‰ for δD (Savin and Epstein, 1970; Yeh, 1980; Suchecki and Land, 1983) (Figure 11). The strong negative correlation between δ18O and δD (Figures 3G–I) suggests that clay mineral dehydration is a dominant source of the freshwater and dilution by methane hydrate dissociation is a local phenomenon.
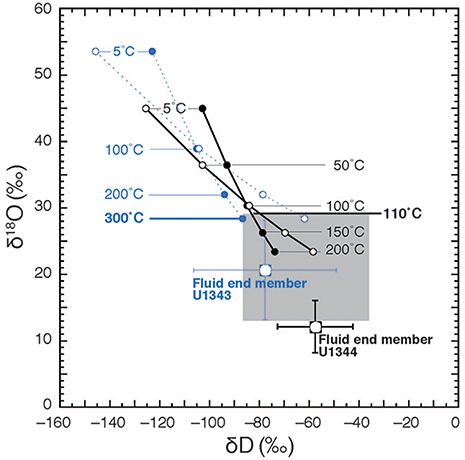
Figure 11. Calculation of theoretical temperatures of fluid formation assuming equilibrium fractionation between pore fluid and clay minerals after Hensen et al. (2004). Theoretical δ18O values of clays are calculated after Sheppard and Gilg (1996) at different temperatures on the basis of fluid end members of Sites U1343 and U1344 and are plotted vs. D-values calculated after Yeh (1980) (filled circles) and Capuano (1992) (open circles). The blue circles and dashed lines show the calculation for Site U1343, and the black ones show the calculation for Site U1344. The shaded area is the range of 18O vs. D-values previously reported for marine clay.
Hensen et al. (2004) estimated the temperatures of fluid formation derived from clay mineral dehydration at submarine mud volcanoes, under the assumption the isotopic equilibrium conditions between clay minerals and the surrounding pore water prevail (Sheppard and Gilg, 1996). We calculated the formation temperature of fluid following the method described in Hensen et al. (2004). Under the assumption that the freshwater is derived from clay dehydration and using the estimated end member (Cl− = 0) δ18O and δD-values of the freshwater as a starting point, we can estimate theoretical δ18O vs. δD-values for clay minerals to produce the estimated end member δ18O and δD-values of the freshwater component at different temperatures using previously reported equilibrium fractionation values of δ18O and δD between clay and water (for δ18O, Sheppard and Gilg, 1996; for δD, Yeh, 1980; Capuano, 1992) (Figure 11). The previously reported natural 18O vs. D variability of marine clay can be used to constrain the possible formation temperatures of fluid by comparing them to the theoretical δ18O vs. δD-values for clay minerals at different temperatures (Figure 11). In Figure 11, the shaded area shows the previously reported range of 18O vs. D-values (Savin and Epstein, 1970; Yeh, 1980; Suchecki and Land, 1983). Where the equilibrium fractionation lines intersect this shaded area, temperatures of 300°C for U1343 and 110°C for U1344 were observed as the lowest values. Because of the large confidence intervals of the estimated end member δ18O and δD-values for Site U1343, the estimates of formation temperature vary widely between 135°C and infinity. The estimate of the formation temperature for Site U1344 varies from 80 to 180°C. In both cases, the estimated formation temperature is too high for in situ formation of the freshwater component in the cored depths, where the temperature is lower than 40°C. We can calculate the formation temperature of fluid by the opposite approach (Figure 12). First, we calculated theoretical δ18O vs. δD-values for water equilibrated with natural 18O vs. D of marine clay at different temperatures using previously reported equilibrium fractionation values of δ18O and δD between clay and water (for δ18O, Sheppard and Gilg, 1996; for δD, Yeh, 1980; Capuano, 1992). The formation temperature can be estimated by the intersection between the theoretical δ18O vs. δD of water and the end member δ18O and δD-values of the freshwater component (Figure 12). The temperatures at the intersections for δ18O are 280°C for U1343 and 110°C for U1344. The temperatures at the intersections for δD are 170 and 300°C for U1343 and 90°C for U1344.
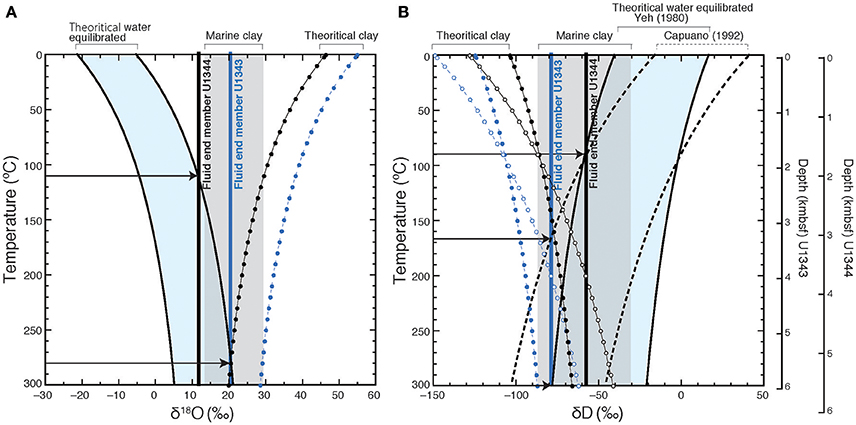
Figure 12. The theoretical δ18O (A) and δD (B) of water equilibrated with marine clay. Theoretical δ18O values of water (black solid curve) are calculated after Sheppard and Gilg (1996) at different temperatures on the basis of the previously reported δ18O values of marine clay (gray shaded), and those δD-values are calculated after Yeh (1980) (black solid curve) and Capuano (1992) (black dashed curve). The range of the theoretical δ18O and δD-values are light blue shaded. The blue circles and dashed lines show the theoretical isotopic compositions of clay equilibrated with fluid end member for Site U1343, and the black ones show those for Site U1344. Black arrows indicate the intersection between the end-member values and theoretical theoretical δ18O and δD-values of water.
There are, however, two possibilities for a higher formation temperature. One is that the δ18O and δD of water derived from clay mineral dehydration is not in equilibrium with those of the clay minerals; the other is that the fluid was derived from several kilometers below the seafloor, where the temperature is >120°C. If it is assumed that the thermal gradients at Sites U1343 and U1344 (49.0°C km−1 and 53.3°C km−1, respectively; Takahashi et al., 2011b) are linear throughout the cored sediment columns, then the estimated formation temperatures of 300°C at Site U1343 and 110°C at Site U1344 correspond to ~6 and 2 km below the seafloor, respectively.
Isotopic profiles showing 18O enrichment and D depletion in proportion to Cl− depletion have previously been reported only from active subduction zones and submarine mud volcanoes, settings in which deep-sourced fluids have migrated from several kilometers below the seafloor at temperatures above 60°C (e.g., Kastner et al., 1993; Dählmann and De Lange, 2003; Hensen et al., 2004). Given the passive continental margin setting of the Bering Sea Slope, advection of deep-sourced fluids is unlikely. Furthermore, the well-defined peaks in isotopic ratios in porewater at 30–50 mbsf, which represents relict bottom water from the last glacial maximum, suggest that upward advection is exceedingly slow at these sites (<0.1 mm y−1) (Schrag and DePaolo, 1993). Therefore, isotopic disequilibrium between freshwater derived from in situ clay mineral dehydration and clay minerals may be more likely at Sites U1343 and U1344.
Under the assumption that the trend showing 18O enrichment and D depletion in proportion to Cl− depletion was derived from in situ clay mineral dehydration such as S-I transformation, we can estimate the amount of newly formed illite during the S-I transformation from the dilution factor. The maximum depletion of Cl− was from ~530 mM at 130 mbsf to ~500 mM at the core bottom (5.7%) at Site U1343 (Figure 2A), and from ~545 mM at 140 mbsf to ~480 mM at 760 mbsf (12%) at Site U1344 (Figure 2B). At Site U1343, to produce the maximum depletion of porewater Cl− (5.7%) in sediment with a porosity of 55% (the average porosity below 130 mbsf at Site U1343, Figure S8, Takahashi et al., 2011b) requires the production of 0.031 g of water per cubic centimeter of sediment. Smectite in marine sediments has been found to bind 17.7–27 wt.% of water (Saffer and Tobin, 2011; Hüpers and Kopf, 2012), depending on environmental conditions. If the bound water value for smectite is assumed to be 20%, then it would take 0.16 g smectite/cm3 sediment to produce 0.031 g water/cm3 sediment; 0.16 g smectite/cm3 amounts to 13 wt.% smectite when dry bulk density is 1.2 g/cm3 (the average value below 130 mbsf at Site 1343, Takahashi et al., 2011b). In other words, 13 wt.% smectite would be transformed to illite under these conditions. Using the same calculation, we estimated 31 wt.% smectite to have been transformed to illite at Site U1344.
Clay Mineralogy on the Bering Sea Slope
The large proportion of clay-sized particles in the bulk sediment and the high peak intensities of clay minerals in the X-ray diffractograms at Sites U1343 and U1344, compared to those at Site U1341 (Figures 6, 8A), clearly reflect the contrast between the siliciclastic sediments of the Bering Sea Slope (siliciclastics) and the diatom ooze of Bowers Ridge (diatom ooze) (Takahashi et al., 2011a). The high Al contents in the clay-size fractions at Site U1343 and U1344 compared to the contents at Site U1341 (Figure S6), indicating a larger proportion of aluminosilicate in the Bering Sea Slope sediments than at the Bowers Ridge sediments, corroborate this finding. The CIA value of 74 on average at Sites U1343 and U1344 is consistent with the large proportion of clay minerals (Nesbitt and Young, 1982). The constant CIA value with depth suggests that the alteration with burial is too small to be detected. The relatively low CIA value at Site U1341 compared to those from Sites U1343 and U1344 is probably caused by low Al contents, indicating small abundance of aluminosilicate.
Our semi-quantitative estimate that the clay-size fraction in Bering Sea Slope sediment consists of 15–51% smectite, 35–56% illite, 11–29% chlorite, and 2–10% kaolinite (Figure 8B) is consistent with other published clay composition data. Kim et al. (2015) reported that the clay minerals deposited at Site U1343 originated mainly from the Aleutians Islands and that the provenance of clay minerals was not strongly affected by glacial-interglacial environment changes, but some clay mineral compositions during the glacial period after the Mid-Pleistocene Transition (MPT; 200–365 mbsf at Site U1343) showed low illite and relatively high smectite concentrations. They inferred that some sediment from the glacial shelf off Alaska or from glacial rivers in southwestern Alaska may have been transported to Site U1343 during the post-MPT glacial period (Kim et al., 2015). We concur that the clay minerals on the Bering Sea Slope are of mostly detrital origin.
It is difficult to separate the effects of diagenesis from the effects of changing detrital provenance in a clay-rich sediment composed of smectite, illite, and chlorite, even when the porewater chemistry indicates the occurrence of the S-I transformation. On the basis of observed decrease of Cl− in porewater, we estimated that 13 and 31 wt.% of smectite in the bulk sediment at Sites U1343 and U1344, respectively, was transformed to illite. However, the illite contents in the clay-size fraction (35–56%) as well as the estimated clay-size fraction in the bulk sediment ranges (5–25%) showed large variation. Furthermore, the estimated clay-size fraction in the bulk sediment, separated by centrifuge, may be underestimated because a centrifuge cannot separate all of the clay-size fraction from the sediment. Given that that the previously reported clay-size fraction (<4 μm) ranged from 5 to 48% (25% on average, Aiello and Ravelo, 2012), the maximum increase of 31 wt.% illite would be too small to detect among illite contents in the dry bulk sediments.
I/S Mixed Layer
The composite reflection of illite-(002)/smectite-(003) at 2θ ≈ 16° in the X-ray diffractograms (Figures 5, 6) documents the presence of the I/S mixed layer (Moore and Reynolds, 1997), which is an indicator of diagenetic S-I transformation (e.g., Hower et al., 1976; Pytte and Reynolds, 1989). The increase of illite content in the I/S mixed layer with increasing depth down to ~150 mbsf (Figure 7) may support our inference that I/S formed in situ at the Bering Sea Slope sites, at least at depths shallower than 150 mbsf. The relatively high illite contents below ~150 mbsf compared to those in shallower areas also imply the occurrence of S-I transformation in the deeper depths. However, most detrital smectite is not pure; rather, it is mixed-layer I/S. For example, in previously well-studied Gulf Coast sediments, the initial composition of the clay minerals showed roughly 15–20% illite in mixed-layer I/S clay before the start of illitization at around 1000 mbsf, where the temperature is 60°C (e.g., Hower et al., 1976; Freed and Peacor, 1989). The observed illite contents in the I/S mixed layer ranged from 2 to 17% in our samples, which is generally lower than previously reported values for the initial state before the start of S-I transformation. Therefore, the generally low content and the slight increase of illite contents in the I/S mixed layer observed at Sites U1343 and U1344 are insufficient evidences for in situ S-I transformation.
To study the structure of the I/S mixed layer, we examined two clay-mineral-rich samples from Site U1343 under the TEM. Although little S-I transformation was expected from the XRD analysis, we were able to identify one smectite particle 0.25 μm long containing interlayered illite (Figures 9a,b). Because the small smectite particle was very sensitive to electron beam irradiation, the lattice fringe readily disappeared as a result of amorphization during the TEM observation. We were unable to obtain electron diffraction spots from the I/S mixed layer because of its small amount in the smectite particles. A high-resolution TEM lattice fringe image of the small clay particle showed wavy smectite layers, a structure indicating a low degree of crystallinity that may reflect variability in the chemical composition. A change in interlayer spacing from 1.3 nm to 1.0 nm, identified as the (001) spacing of illite (e.g., Drits et al., 1997), was found within the smectite particle. Such a lateral change of basal spacing within a continuous layer is characteristic of layer-by-layer S-I transformation (Bauluz et al., 2000). Energy-dispersive X-ray analysis showed that these layers at the tip of the smectite particle had higher Al and K contents and lower Mg contents than the layers in the central part of the particle (Figure 9c). This finding is consistent with illite formation, in which Si and Mg are lost and Al and K are gained (Dong et al., 1997).
If the small smectite particle was authigenic smectite formed in the sediment, illite formation in the particle should be a good evidence of in situ S-I transformation. However, the authigenic smectite can be reliably identified only if the smectite grown on surfaces or in pore space of glass shards (Masuda et al., 1996). Although the wavy structure of lattice fringes may imply the crystallization occurred at low temperatures and relatively rapid (Masuda et al., 1996), the structure is not sufficient evidence of the in situ formation of smectite. Therefore, we cannot say whether the smectite was authigenic.
In summary, the illite contents in the I/S mixed layer determined by XRD as well as the structure of the I/S mixed layer observed by TEM do not provide definitive evidence for in situ S-I transformation. Further studies are needed to prove the S-I transformation based on clay mineralogy.
Fe(III) Reduction in Clay Minerals Below the Sulfate-Methane Transition Zone
At Sites U1343 and U1344, the release of Fe2+ through S-I transformation promoted by microbial Fe(III) reduction has previously been hypothesized on the basis of precipitation of Fe-rich authigenic carbonate minerals, and relatively high concentrations of dissolved Fe (Fe2+) in porewater (Takahashi et al., 2011b; Pierre et al., 2016). The dissolved Fe concentration reached a maximum of 60 μM at ~50 mbsf at Site 1343 and 80 μM at ~150 mbsf at Site U1344, and Fe concentrations remained appreciable (~10–20 μM) below these depths (Figures 2G,H). The decrease of Fe concentrations below ~50 mbsf and ~150 mbsf at Sites U1343 and U1344 could be attributed to the precipitation of Fe-rich authigenic carbonate (Pierre et al., 2016).
Interestingly, elevated dissolved Fe concentrations were observed below the sulfate methane transition zone (SMTZ) at around ~8 mbsf at Sites U1343 and U1344 (Wehrmann et al., 2011), where both methanogenesis and sulfate reduction in association with methane oxidation occurred. According to the classic reduction scheme in marine sediment based on theoretical calculations of energy yields, iron reduction has been thought to be limited to anoxic sediments above the SMTZ and only methanogenesis is thought to occur below the SMTZ (e.g., Berner, 1981; Emerson and Hedges, 2006). A more recent study, however, has indicated that microbial Fe reduction of iron minerals in the methanogenesis zone below the SMTZ and the release of Fe2+ into porewater are possible (Oni et al., 2015). Indeed, the dissolved Fe concentrations in porewater below the SMTZ at Sites U1343 and U1344 imply that dissimilatory iron reduction occurs below the SMTZ. Recent studies have suggested the novel process of anaerobic oxidation of methane coupled to reduction of Fe (oxyhydr) oxides also releases dissolved Fe (Fe2+) below SMTZs (e.g., Riedinger et al., 2014; Egger et al., 2017). In this case, Fe(III) in clay minerals would not be the major electron acceptor. In addition, the release of Fe2+ into porewater is not definitive evidence for microbial iron reduction because abiotic reactions of monosulfides with hydrogen ions also produce free Fe2+ (Wilkin and Barnes, 1996; Holmkvist et al., 2011).
In this context, our results from 57Fe Mössbauer spectroscopy of the clay-size fraction clearly show a decrease of Fe3+ content from 70% of the total Fe in the clay-size fraction near the seafloor to 50% at ~400 mbsf. This finding strongly suggests the reduction of Fe(III) in clay minerals occurs below the SMTZ. The decrease of Fe3+ with depth would not arise from a change in detrital provenance but instead would reflect burial diagenesis, because no corresponding change in clay mineralogy has been observed in the high-resolution record of clay composition at Site U1343 (Kim et al., 2015). In particular, the contents of chlorite, which may contain high concentrations of Fe2+ (Kalinenko, 2001), does not increase with depth (Figure 8B), suggesting no relationship between the change in detrital provenance and the vertical profiles of Fe2+ contents in the clay fraction. Note that the precipitation of Fe(III) hydroxide from dissolved Fe during core drying should not affect the results of the Mössbauer analysis, because the maximum dissolved Fe concentration in porewater was too small to affect the Fe in the clay fraction. The maximum dissolved Fe concentration was 80 μM at Site U1344, which amounts to 0.00014 wt.% in bulk sediments when the porosity is 35% and dry bulk density is 1.1 g/cm3 (the average values at Site 1343, Takahashi et al., 2011b). In contrast, the Fe content in the clay-size fraction at Sites U1343 and U1344 ranges from 3.5 to 8.4 wt.% and the clay-size fraction in bulk sediment ranges from 0.3 to 24 wt.% (Table S1), indicating that the minimum Fe content in the bulk sediment is 1.1 wt.%. Therefore, the precipitation of Fe(III) hydroxide during core sample drying should be negligible.
The extent of Fe(III) reduction in the clay-size fraction from the surface to ~400 mbsf at the Bering Sea Slope sites (29%) is a reasonable value for microbial Fe(III) reduction in clay because it lies within the range of structural Fe(III) reduction in clay minerals (8–46%) estimated in a culturing study (Kostka et al., 1999). We cannot identify which clay mineral contributed to the reduction of Fe(III) from the Mössbauer spectroscopic analysis of the bulk clay-size fraction. However, experimental results showing that the Fe(III) in chlorite and smectite is more susceptible to microbial reduction than the Fe(III) in illite (Bishop et al., 2011; Zhang et al., 2012) suggest that chlorite and smectite are the main sources. The predominance of smectite over chlorite in the clay-size fraction of Bering Sea Slope sediment implies that smectite accounts for the reduction of Fe(III).
Because both biotic and abiotic iron reduction in smectite has been presumed to be a general phenomenon that accompanies and contributes to S-I transformation (Eslinger et al., 1979; Kim et al., 2004), our results indicate that the potential ability of the clay mineral in Bering Sea Slope sediments to promote S-I transformation.
Implication for the S-I Transformation at Low Temperature Promoted by the Reduction of Fe(III) in Clay Mineral
Our porewater data strongly suggest the occurrence of the S-I transformation at temperatures below 40°C in sediment from the Bering Sea slope. Note that the observed depletion of Cl− (maximum 12%) from seawater value by clay mineral dehydration is smaller than the previously reported values (>20%) from active subduction zones and submarine mud volcanoes (e.g., Kastner et al., 1993; Dählmann and De Lange, 2003; Hensen et al., 2004). The slight depletion of Cl− indicates a little S-I transformation. Indeed, the only slight increase of the illite contents in the I/S mixed layer with depth down to ~150 mbsf was observed at Sites U1343 and U1344. So far, the high resolution data for δ18O and δD of porewater down to several 100 m below seafloor has been rarely reported. Even if the S-I transformation at low temperature occurred in various places, it would be difficult to be detected without the high resolution isotopic porewater data. On the other hand, the decrease of Fe3+/Fe2+ in the clay-size fraction with increasing depth strongly suggests microbial reduction of Fe(III) in clay minerals with burial. Although there is no direct evidence, we speculate that this microbial reduction of Fe(III) contributes the low-temperature S-I transformation in Bering Sea Slope sediment. In contrast, no signs of the S-I transformation were observed at Site U1341 on Bowers Ridge. The difference between Bering Sea Slope and Bowers Ridge sediments should reflect those of their sedimentary environments. The on-board geochemical data obtained during IODP Expedition 323 showed that the concentrations of microbial respiration products such as dissolved inorganic carbon (DIC), ammonium, and phosphate ions in porewater are an order of magnitude higher at Bering Sea Slope sites than at Bowers Ridge site (Takahashi et al., 2011a). This suggests that microbial activity reflects different sedimentation rates of photosynthetic products in the respective water columns (Kallmeyer et al., 2012). As a result, SMTZs at Sites U1343 and U1344 were observed in shallow depths around ~8 mbsf (Wehrmann et al., 2011), and sulfate is present at all depths at U1341 (Wehrmann et al., 2013). Under the available of sulfate which is a usual reducing agent (electron acceptors) in marine sediments, unusual electron acceptors such as Fe(III) in clay minerals may not be used for redox reaction. Thus, the reduction of Fe(III) in clay minerals may occur only below SMTZ underlying the high-productivity surface seawater. Our results imply the significant ecological roles on the diagenesis of siliciclastic clay minerals underlying the high-productivity surface seawater at continental margins.
Conclusions
1) We determined the origin of the freshwater components that dilute the original porewater by using δ18O and δD data. Plots of Cl− concentrations vs. δ18O and δD below 120–140 mbsf at Sites U1343 and U1344 indicate that the freshwater components have two origins. The simultaneous enrichment of 18O and depletion of D in proportion to the depletion of Cl− in porewater with increasing depth strongly suggests the occurrence of the S-I transformation at temperatures below 40°C in sediment from the Bering Sea slope. On the other hand, the discrete low Cl− spikes observed between ~200 mbsf and ~420 mbsf at Sites U1343 and U1344 could be attributed to the dissociation of methane hydrate.
2) We looked for evidence for in situ S-I transformation by using XRD analyses and TEM observations of the clay fraction. Although a smectite particle containing interlayered illite was observed, and the illite content in the I/S mixed layer increased with depth down to ~150 mbsf, implying in situ S-I transformation, this finding is not sufficiently strong evidence because of the difficulty of discriminating between authigenic and terrestrial I/S mixed layers.
3) We evaluated the possibility of a reduction of Fe(III) in clay minerals by 57Fe Mössbauer spectroscopy of the clay fraction. The decrease of Fe3+ content in total Fe with increasing depth in conjunction with elevated levels of dissolved Fe in porewater strongly suggest microbial reduction of Fe(III) in clay minerals below the SMTZ, which in turn could promote the S-I transformation.
In conclusion, our results suggest that the low-temperature S-I transformation is mediated by reduction of Fe(III) in clay mineral below SMTZ in the Bering Sea Slope sediment underlying the high-productivity surface seawater.
Author Contributions
AI: proposed the topic and conceived and designed the study; NT carried out the TEM analyses; SW analyzed the major elements in the clay-size fraction; HM helped in the interpretation of XRD analyses and TEM observations; KS and MoM carried out the 57Fe Mössbauer Spectroscopy; SK and B-KK carried out the XRD analyses; MaM helped with the oxygen isotope analysis of porewater; FI collaborated with AI to prepare the manuscript. All authors read and approved the final manuscript.
Funding
This work was supported in part by JSPS Grant-in-Aid for Scientific Research (17H01871 to AI) and by the Atmospheric See-At Technology Development Program (Grant No. KMIPA2015-0606 to B-KK).
Conflict of Interest Statement
The authors declare that the research was conducted in the absence of any commercial or financial relationships that could be construed as a potential conflict of interest.
Acknowledgments
This research used samples and data provided by the IODP. We acknowledge the great support of the IODP Expedition 323 shipboard scientists, technicians, and all crews and drillers on the JOIDES Resolution. The authors are grateful to A. Imajyo and O. Tadai for technical assistance. This is a contribution to the Deep Carbon Observatory (DCO).
Supplementary Material
The Supplementary Material for this article can be found online at: https://www.frontiersin.org/articles/10.3389/feart.2018.00036/full#supplementary-material
References
Aiello, I. W., and Ravelo, A. C. (2012). Evolution of marine sedimentation in the Bering Sea since the Pliocene. Geosphere 8, 1231–1253. doi: 10.1130/GES00710.1
Asahi, H., Kender, S., Ikehara, M., Sakamoto, T., Ravelo, A. C., Alvarez-Carikian, C., et al. (2014). Orbital-scale benthic foraminiferal oxygen isotope stratigraphy at the Bering Slope IODP Exp. 323 Site U1343. Deep-Sea Res. II 125–126, 66–83. doi: 10.1016/j.dsr2.2014.01.004
Banfield, J. E., Jones, B. E., and Veblen, D. R. (1991). An AEM-TEM study of weathering and diagenesis, Abert Lake, Oregon: I. Weathering reactions in the volcanics. Geochim. Cosmochim. Acta 55, 2781–2798. doi: 10.1016/0016-7037(91)90444-A
Bauluz, B., Peacor, D. R., and Lopez, J. M. G. (2000). Transmission electron microscopy study of illitization in pelites from the Iberian Range, Spain: layer-by-layer replacement? Clays Clay Miner. 48, 374–384. doi: 10.1346/CCMN.2000.0480308
Berner, R. A. (1981). A new geochemical classification of sedimentary environments. J. Sediment Petrol. 51, 359–365.
Biscaye, P. E. (1965). Mineralogy and sedimentation of recent deep-sea clay in the Atlantic Ocean and adjacent seas and oceans. Geol. Soc. Am. Bull. 76, 803–832. doi: 10.1130/0016-7606(1965)76[803:MASORD]2.0.CO;2
Bishop, M. E., Dong, H. L., Kukkadapu, R. K., and Edelmann, R. E. (2011). Microbial reduction of Fe(III) in multiple clay minerals by Shewanella putrefaciens and reactivity of bioreduced clay minerals toward Tc(VII) immobilization. Geochim. Cosmochim. Acta 75, 5229–5246. doi: 10.1016/j.gca.2011.06.034
Brown, K. M., Saffer, D. M., and Bekins, B. A. (2001). Smectite diagenesis, porewater freshening, and fluid flow at the toe of the Nankai wedge. Earth Planet. Sci. Lett. 194, 97–109. doi: 10.1016/S0012-821X(01)00546-5
Bruce, C. H. (1984). Smectite dehydration: its relation to structural development and hydrocarbon accumulation in northern Gulf of Mexico basin. AAPG Bull. 68, 673–683.
Buatier, M. D., Peacor, D. P., and O'Neil, J. R. (1992). Smectite-illite transition in Barbados accretionary wedge sediments: TEM and AEM evidence for dissolution/crystallization at low temperature. Clays Clay Miner. 40, 65–80. doi: 10.1346/CCMN.1992.0400108
Capuano, R. M. (1992). The temperature dependence of hydrogen isotope fractionation between clay minerals and water: evidence from a geopressured system. Geochim. Cosmochim. Acta 56, 2547–2554. doi: 10.1016/0016-7037(92)90208-Z
Cooper, A. K., Scholl, D. W., and Marlow, M. S. (1987). “Structural framework, sedimentary sequences, and hydrocarbon potential of the Aleutian and Bowers Basins, Bering Sea,” in Geology and Resource Potential of the Continental Margin of Western North America and Adjacent Ocean Basins—Beaufort Sea to Baja California, Vol. 6, eds D. W. Scholl, A. Grantz, and J. Vedder (Washington, DC: Earth Sci. Ser. Houston Circum-Pacific Council for Energy and Mineral Resources), 476–502.
Craig, H. (1961). Isotopic variations in meteoric waters. Science 133, 1702–1703. doi: 10.1126/science.133.3465.1702
Dählmann, A., and De Lange, G. J. (2003). Fluid-sediment interactions at eastern Mediterranean mud volcanoes: a stable isotope study from ODP Leg 160. Earth Planet. Sci. Lett. 212, 377–391. doi: 10.1016/S0012-821X(03)00227-9
Dong, H., Peacor, R. D., and Freed, R. L. (1997). Phase relations among smectite, R1 illite–smectite, and illite. Am. Mineral. 82, 379–391. doi: 10.2138/am-1997-3-416
Drits, V., Srodofi, J., and Eberl, D. D. (1997). XRD measurement of mean crystallite thickness of illite and illite/smectite: reappraisal of the Kubler index and the Scherrer equation. Clays Clay Miner. 45, 461–475. doi: 10.1346/CCMN.1997.0450315
Eberl, D., and Hower, J. (1976). Kinetics of illite formation. Geol. Soc. Am. Bull. 87, 1326–1330. doi: 10.1130/0016-7606(1976)87<1326:KOIF>2.0.CO;2
Egger, M., Hagens, M., Sapart, C. J., Dijkstra, N., van Helmond, N. A. G. M., Mogollón, J. M., et al. (2017). Iron oxide reduction in methane-rich deep Baltic Sea sediments. Geochim. Cosmochim. Acta 207, 256–276. doi: 10.1016/j.gca.2017.03.019
Emerson, S., and Hedges, J. (2006). “Sediment diagenesis and benthic flux,” in Treatise on Geochemistry: The Oceans and Marine Geochemistry, ed H. Elderfield (Oxford: Elsevier), 293–319.
Eslinger, E., Highsmith, P., Albers, D., and De Mayo, B. (1979). Role of iron reduction in the conversion of smectite to illite in bentonites in the Disturbed Belt, Montana. Clays Clay Miner. 27, 327–338. doi: 10.1346/CCMN.1979.0270503
Freed, R. L., and Peacor, D. R. (1989). Geopressured shale and sealing effect of the smectite to illite transition. Am. Assoc. Petrol. Geol. Bull. 73, 1223–1232.
Guo, J., and Underwood, M. B. (2011). “Data report: refined method for calculating percentages of kaolinite and chlorite from X-ray diffraction data, with application to the Nankai margin of southwest Japan,” in Proc. IODP, 314/315/316, eds M. Kinoshita, H. Tobin, J. Ashi, G. Kimura, S. Lallemant, E. J. Screaton, D. Curewitz, H. Masago, K.T. Moe, and the Expedition 314/315/316 Scientists (Washington, DC: Integrated Ocean Drilling Program Management International, Inc.). doi: 10.2204/iodp.proc.314315316.201.2011
Hathon, E. G. (1992). X-Ray Diffraction and Transmission Electron Microscopy Study of the Surface Charge on the Illite and Smectite Components of Illite/Smectite Mixed-Layer Clays. Ph.D. dissertion, Univ. of Missouri, Columbia.
Hensen, C., Wallman, K., Scmidt, M., Ranero, C. R., and Suess, E. (2004). Fluid expulsion related to mud extrusion off Costa Rica-A window to the subducting slab. Geology 32, 201–204. doi: 10.1130/G20119.1
Hesse, R., and Harrison, W. E. (1981). Gas hydrates (clathrates) causing pore-water freshening and oxygen isotope fractionation in deep-water sedimentary sections of terrigenous continental margins. Earth Planet. Sci. Lett. 55, 453–462. doi: 10.1016/0012-821X(81)90172-2
Holmkvist, L., Ferdelman, T. G., and Jørgensen, B. B. (2011). A cryptic sulfur cycle driven by iron in the methane zone of marine sediment (Aarhus Bay, Denmark). Geochim. Cosmochim. Acta 75, 3581–3599. doi: 10.1016/j.gca.2011.03.033
Horikawa, K., Martin, E. E., Basak, C., Onodera, J., Seki, O., Sakamoto, T., et al. (2015). Pliocene cooling enhanced by flow of low-salinity Bering Sea water to the Arctic Ocean. Nat. Commun. 6:7587 doi: 10.1038/ncomms8587
Hover, V. C., Walter, L. M., and Peacor, D. R. (2002). K uptake by modern estuarine sediments during early marine Diagenesis, Mississippi Delta Plain, Louisiana, U.S.A. J. Sediment. Res. 72, 775–792. doi: 10.1306/032502720775
Hower, J., Eslinger, E., Hower, M. E., and Perry, E. A. (1976). Mechanism of burial metamorphism of argillaceous sediment: 1. Mineralogical and chemical evidence. GSA Bull. 87, 725–737. doi: 10.1130/0016-7606(1976)87<725:MOBMOA>2.0.CO;2
Huang, W. L., Longo, J. M., and Pevear, D. V. (1993). An experimentally derived kinetic model for smectite-to-illite conversion and its use as a geothermometer. Clays Clay Miner. 41, 162–177. doi: 10.1346/CCMN.1993.0410205
Hüpers, A., and Kopf, A. J. (2012). Effect of smectite dehydration on pore water geochemistry in the shallow subduction zone: an experimental approach. Geochem. Geophys. Geosyst. 13:Q0AD26. doi: 10.1029/2012GC004212
Ijiri, A., Harada, N., Hirota, A., Tsunogai, U., Ogawa, N. O., Itaki, T., et al. (2012). Biogeochemical processes involving acetate in sub-seafloor sediments from the Bering Sea shelf break. Org. Geochem. 48, 47–55. doi: 10.1016/j.orggeochem.2012.04.004
Inoue, A., Velde, B., Meunier, A., and Touchard, G. (1988). Mechanism of illite formation during smectite-to-illite conversion in a hydrothermal system. Am. Mineral. 73, 1325–1334.
Kalinenko, V. V. (2001). Clay minerals in sediments of the Arctic Seas. Lithol. Miner. Resour. 36, 362–372. doi: 10.1023/A:1010414305264
Kallmeyer, J., Pockalny, R., Adhikari, R., Smith, D., and D'Hondt, S. (2012). Global distribution of microbial abundance and biomass in subseafloor sediment. Proc. Natl. Acad. Sci. U.S.A. 109, 16213–16216. doi: 10.1073/pnas.1203849109
Kastner, M., Elderfield, H., Jenkins, W. J., Gieskes, J. M., and Gamo, T. (1993). Geochemical and isotopic evidence for fluid flow in the western Nankai subduction zone, Japan. Proc. Ocean Drill. Program Sci. Results 131, 397–413.
Kastner, M., Elderfield, H., and Martin, J. B. (1991). Fluids in convergent margins–What do we know about their composition, origin, role in diagenesis and importance for oceanic chemical fluxes? Philos. Trans. R. Soc. London Ser. A Math. Phys. Sci. 335, 243–259. doi: 10.1098/rsta.1991.0045
Kim, J., Dong, H., Seabaugh, J., Newell, S. W., and Eberl, D. D. (2004). Role of microbes in the smectite-to-illite transformation. Science 303, 830–832. doi: 10.1126/science.1093245
Kim, J. W., Peacor, D. R., Tessier, D., and Elsass, E. (1995). A technique for maintaining texture and permanent expansion of smectite interlayers for TEM observations. Clays Clay Miner. 43, 51–57. doi: 10.1346/CCMN.1995.0430106
Kim, S., Khim, B.-K., and Cho, H. G. (2015). Clay mineral stratigraphy during the last 2.4 Ma at IODP Exp. 323 Site U 1343 in the Bering Sea. Mar. Geol. 359, 163–168. doi: 10.1016/j.margeo.2014.10.004
Koo, T. H., Lee, G., and Kim, J. W. (2016). Biogeochemical dissolution of nontronite by Shewanella oneidensis MR-1: Evidence of biotic illite formation. Appl. Clay Sci. 134, 13–18. doi: 10.1016/j.clay.2016.03.030.
Kostka, J. E., Wu, J., Nealson, K. H., and Stucki, J. W. (1999). The impact of structural Fe(III) reduction by bacteria on the surface chemistry of smectite clay minerals. Geochim. Cosmochim. Acta 63, 3705–3713. doi: 10.1016/S0016-7037(99)00199-4
Lynch, F. L., Mack, L. E., and Land, L. S. (1997). Burial diagenesis of illite/smectite in shales and the origins of authigenic quartz and secondary porosity in sandstones. Geochim. Cosmochim. Acta 66, 439–446. doi: 10.1016/S0016-7037(97)00066-5
Maekawa, T. (2004). Experimental study on isotopic fractionation in water during gas hydrate formation. Geochem. J. 138, 129–138. doi: 10.2343/geochemj.38.129
Manheim, F. T., and Sayles, F. L. (1974). “Composition and origin of interstitial waters of marine sediments, based on deep sea drill cores,” in Marine Chemistry, The Sea, Vol. 5. ed E. D. Goldberg (New York, NY: Wiley–Interscience), 527–568.
Masuda, H., O'Neil, J. R., Jiang, W.-T., and Peacor, D. R. (1996). Relation among interlayer composition of diagenetic smectite, mineral assemblages, I/S reaction rates, and fluid composition in silicic ash of the Nankai Trough. Clays Clay Miner. 44, 443–459.
Moore, D. M., and Reynolds, R. C. Jr. (1997). X-ray Diffraction and the Identification and Analysis of Clay Minerals, 2nd Edn. New York, NY: Oxford University Press.
Nesbitt, H. W., and Young, G. M. (1982). Early Proterozoic climates and plate motions inferred from major element chemistry of lutites. Nature 299, 715–717. doi: 10.1038/299715a0
Okazaki, Y., Ulincy, A. J., Alvarez Zarikian, C. A., and Asahi, H. (2016). “Data report: benthic foraminiferal stable isotope records at Site U1344, Integrated Ocean Drilling Program Expedition 323,” in Proceedings of the Integrated Ocean Drilling Program Vol. 323, eds K. Takahashi, A. C. Ravelo, C. A. Alvarez Zarikian, and the Expedition 323 Scientists (Tokyo: Integrated Ocean Drilling Program Management International, Inc.). doi: 10.2204/iodp.proc.323.203.2016
Oni, O., Miyatake, T., Kasten, S., Richter-Heitmann, T., Fischer, D., Wagenknecht, L., et al. (2015). Distinct microbial populations are tightly linked to the profile of dissolved iron in the methanic sediments of the Helgoland mud area. North Sea. Front. Microbiol. 6:365. doi: 10.3389/fmicb.2015.00365
Perry, E. A., and Hower, J. (1972). Late-stage dehydration in deeply buried pelitic sediments. AAPG Bull. 56, 2013–2021.
Perry, E., and Hower, J. (1970). Burial diagenesis in Gulf Coast pelitic sediments. Clays Clay Miner. 18, 167–177. doi: 10.1346/CCMN.1970.0180306
Pierre, C., Blanc-Valleron, M.-M., Caquineau, S., März, C., Ravelo, A. C., Takahashi, K., et al. (2016). Mineralogical, geochemical and isotopic characterization of authigenic carbonates from the methane-bearing sediments of the Bering Sea continental margin (IODP Expedition 323, Sites U1343–U1345). Deep-Sea Res. Pt. II 125–126, 133–144. doi: 10.1016/j.dsr2.2014.03.011
Pytte, A. M., and Reynolds, R. C. (1989). “The thermal transformation of smectite to illite,” in McCulloh Thermal History of Sedimentary Basins eds N. D. Naeser and T. H. McCulloh (Berlin: Springer-Verlag), 133–140.
Riedinger, N., Formolo, M. J., Lyons, T. W., Henkel, S., Beck, A., and Kasten, S. (2014). An inorganic geochemical argument for coupled anaerobic oxidation of methane and iron reduction in marine sediments. Geobiology 12, 172–181. doi: 10.1111/gbi.12077
Saffer, D. M., and Tobin, H. J. (2011). Hydrogeology and mechanics of subduction zone forearcs: fluid flow and pore pressure. Annu. Rev. Earth Planet. Sci. 39, 157–186. doi: 10.1146/annurev-earth-040610-133408
Savin, S. M., and Epstein, S. (1970). The oxygen and hydrogen isotope geochemistry of clay minerals. Geochim. Cosmochim. Acta 34, 25–42. doi: 10.1016/0016-7037(70)90149-3
Schrag, D. P., and DePaolo, D. J. (1993). Determination of δ18O of seawater in the deep ocean during the last glacial maximum. Paleoceanography 8, 1–6. doi: 10.1029/92PA02796
Sheppard, S. M. F., and Gilg, H. A. (1996). Stable isotope geochemistry of clay minerals. Clay Miner. 31, 1–24. doi: 10.1180/claymin.1996.031.1.01
Springer, A. M., McRoy, C. P., and Flint, M. V. (1996). The Bering Sea Green Belt: shelf-edge processes and ecosystem production. Fish Oceanogr. 5, 205–223. doi: 10.1111/j.1365-2419.1996.tb00118.x
Suchecki, R. K., and Land, L. S. (1983). Isotopic geochemistry of burial-metamorphosed volcanogenic sediments, great valley sequence, Northern California. Geochim. Cosmochim. Acta 47, 1487–1499. doi: 10.1016/0016-7037(83)90308-3
Takahashi, K., Ravelo, A. C., Zarikian, C. A., and the, IODP Expedition, 323 Scientists (2011a). IODP Expedition 323 Pliocene and Pleistocene paleoceanographic changes in the Bering Sea. Sci. Drill. 11, 4–13. doi: 10.5194/sd-11-4-2011
Takahashi, K., Ravelo, A. C., Zarikian, C. A., and the Expedition 323 Scientists. (2011b). Proceedings of the Integrated Ocean Drilling Program 323. Tokyo: Integrated Ocean Drilling Program Management International, Inc.
Uramoto, G., Morono, Y., Uematsu, K., and Inagaki, F. (2014). An improved sample preparation method for imaging microstructures of fine-grained marine sediment using microfocus X-ray computed tomography and scanning electron microscopy. Limnol. Oceanogr. Methods 12, 469–483. doi: 10.4319/lom.2014.12.469
Ussler, W. I. I. I., and Paull, C. K. (2001). “Ion exclusion associated with marine gas hydrate deposits,” in Natural Gas Hydrates: Occurrence, Distribution, and Detection, Vol. 24, Geophysical Monograph, eds C. K. Paull, and W. P. Dillon (New York, NY: Wiley), 41–51.
Wehrmann, L. M., Arndt, S., März, C., Ferdelman, T. G., and Brunner, B. (2013). The evolution of early diagenetic signals in Bering Sea subseafloor sediments in response to varying organic carbon deposition over the last 4.3 Ma. Geochim. Cosmochim. Acta 109, 175–196. doi: 10.1016/j.gca.2013.01.025
Wehrmann, L. M., Risgaard-Petersen, N., Schrum, H. N., Walsh, E. A., Huh, Y., Ikehara, M., et al. (2011). Coupled organic and inorganic carbon cycling in the deep subseafloor sediment of the northeastern Bering Sea Slope (IODP Exp. 323). Chem. Geol. 284, 251–261. doi: 10.1016/j.chemgeo.2011.03.002
Whitney, G. (1990). Role of water in the smectite-to-illite reaction. Clays Clay Miner. 38, 343–350. doi: 10.1346/CCMN.1990.0380402
Whitney, G., and Northrop, H. R. (1988). Experimental investigation of the smectite to illite reaction: dual reaction mechanisms and oxygen-isotope systematics. Am. Mineral. 73, 77–90.
Wilkin, R. T., and Barnes, H. L. (1996). Pyrite formation by reactions of iron monosulfides with dissolved inorganic and organic sulfur species. Geochim. Cosmochim. Acta 60, 4167–4179. doi: 10.1016/S0016-7037(97)81466-4
Yeh, H. W. (1980). D/H ratios and late-stage dehydration of shales during burial. Geochim. Cosmochim. Acta 44, 341–352. doi: 10.1016/0016-7037(80)90142-8
Zhang, G., Dong, H., Kim, J. W., and Eberl, D. D. (2007a). Microbial reduction of structural Fe3+ in nontronite by a thermophilic bacterium and its role in promoting the smectite to illite reaction. Am. Mineral. 92, 1411–1419. doi: 10.2138/am.2007.2498
Zhang, G., Kim, J. W., Dong, H., and Sommer, A. J. (2007b). Microbial effects in promoting the smectite to illite reaction: role of organic matter intercalated in the interlayer. Am. Mineral. 92, 1401–1410. doi: 10.2138/am.2007.2331
Keywords: smectite-to-illite transformation, porewater chemistry, clay mineralogy, iron reduction, Bering Sea Slope
Citation: Ijiri A, Tomioka N, Wakaki S, Masuda H, Shozugawa K, Kim S, Khim B-K, Murayama M, Matsuo M and Inagaki F (2018) Low-Temperature Clay Mineral Dehydration Contributes to Porewater Dilution in Bering Sea Slope Subseafloor. Front. Earth Sci. 6:36. doi: 10.3389/feart.2018.00036
Received: 12 January 2018; Accepted: 03 April 2018;
Published: 19 April 2018.
Edited by:
Timothy Ferdelman, Max Planck Institute for Marine Microbiology (MPG), GermanyReviewed by:
Christian März, University of Leeds, United KingdomIlya Bindeman, University of Oregon, United States
Copyright © 2018 Ijiri, Tomioka, Wakaki, Masuda, Shozugawa, Kim, Khim, Murayama, Matsuo and Inagaki. This is an open-access article distributed under the terms of the Creative Commons Attribution License (CC BY). The use, distribution or reproduction in other forums is permitted, provided the original author(s) and the copyright owner are credited and that the original publication in this journal is cited, in accordance with accepted academic practice. No use, distribution or reproduction is permitted which does not comply with these terms.
*Correspondence: Akira Ijiri, ijiri@jamstec.go.jp