Pond Dynamics and Supraglacial-Englacial Connectivity on Debris-Covered Lirung Glacier, Nepal
 Evan S. Miles1,2*
  Jakob Steiner3,4
  Ian Willis1
  Pascal Buri3
  Walter W. Immerzeel4
  Anna Chesnokova3,5
  Francesca Pellicciotti3,6
- 1Scott Polar Research Institute, University of Cambridge, Cambridge, United Kingdom
- 2School of Geography, University of Leeds, Leeds, United Kingdom
- 3Institute of Environmental Engineering (IfU), ETH-Zürich, Zürich, Switzerland
- 4Department of Geography, University of Utrecht, Utrecht, Netherlands
- 5Département de Génie de la Construction, École de Technologie Supérieure, Montreal, QC, Canada
- 6Department of Geography, University of Northumbria, Newcastle-upon-Tyne, United Kingdom
The hydrological systems of heavily-downwasted debris-covered glaciers differ from those of clean-ice glaciers due to the hummocky surface and debris mantle of such glaciers, leading to a relatively limited understanding of drainage pathways. Supraglacial ponds represent sinks within the discontinuous supraglacial drainage system, and occasionally drain englacially. To assess pond dynamics, we made pond water level measurements on Lirung Glacier, Nepal, during May and October of 2013 and 2014. Simultaneously, aerial, satellite, and terrestrial orthoimages and digital elevation models were obtained, providing snapshots of the ponds and their surroundings. We performed a DEM-based analysis of the glacier's closed surface catchments to identify surface drainage pathways and englacial drainage points, and compared this to field observations of surface and near-surface water flow. The total ponded area was higher in the pre-monsoon than post-monsoon, with individual ponds filling and draining seasonally associated with the surface exposure of englacial conduit segments. We recorded four pond drainage events, all of which occurred gradually (duration of weeks), observed diurnal fluctuations indicative of varying water supply and outflow discharge, and we documented instances of interaction between distant ponds. The DEM drainage analysis identified numerous sinks >3 m in depth across the glacier surface, few of which exhibited ponds (23%), while the field survey highlighted instances of surface water only explicable via englacial routes. Taken together, our observations provide evidence for widespread supraglacial-englacial connectivity of meltwater drainage paths. Results suggest that successive englacial conduit collapse events, themselves likely driven by supraglacial pond drainage, cause the glacier surface drainage system to evolve into a configuration following relict englacial conduit systems. Within this system, ponds form in depressions of reduced drainage efficiency and link the supraglacial and englacial drainage networks.
1. Introduction
Debris-covered glaciers make up a minority of mountain glaciers worldwide, but debris-covered areas can account for a considerable portion of total glacier area regionally (Sasaki et al., 2016). This is evident in High Mountain Asia, where inhabitants are strongly dependent on the hydrology of glacierized catchments for moderating seasonal and interannual variations in water availability (Bolch et al., 2012; Immerzeel and Bierkens, 2012; Ragettli et al., 2016b; Pritchard, 2017). While the hydrology of alpine glaciers and ice sheets has long been a focus of glaciological research (e.g., Fountain and Walder, 1998; Irvine-Fynn et al., 2011; Chu, 2014), the hydrological systems of debris-covered glaciers are less well researched, and differ from those of clean glaciers in several respects (Fyffe et al., 2015; Benn et al., 2017).
The porosity and thickness of the surface debris enables a saturated debris layer to develop (Reznichenko et al., 2010; Collier et al., 2014). Rapid downslope transport of surface water occurs in areas of steep relief, but the surface debris may lead to the formation of shallow groundwater lenses in low-slope areas. The debris mantle may mask surface channels, crevasses and moulins making it difficult to assess the role of the surface drainage system in recharging the englacial and subglacial systems (Hasnain et al., 2001; Pottakkal et al., 2014; Fyffe et al., 2015). The variable relief of heavily-downwasted debris-covered glaciers often leads to frequent intersection between the glacier surface and englacial conduits, whether active or disused (relict), resulting in discontinuous supraglacial and englacial hydrological networks, and exchange of surface and near-surface water across the glacier (Benn et al., 2012, 2017).
Incised supraglacial channels are common across the upper ablation zones of debris-covered glaciers, but the low gradient and dense undulations typical of the lower ablation zone greatly impede water flow, leading to ponding and water storage in closed surface depressions (e.g., Iwata et al., 1980; Sakai et al., 2000; Benn et al., 2001; Wessels et al., 2002; Watson et al., 2016; Benn et al., 2017). Such surface depressions are a common characteristic of hummocky debris-covered glaciers (Iwata et al., 1980; Benn et al., 2017), and can be inherited features from differential surface ablation, englacial conduit collapse, or prior ponding (Benn et al., 2001). The water level in these depressions can represent the hydrological base level (usually in thin ice near the glacier terminus), or can be perched above it on thicker ice, which impedes vertical drainage (Benn et al., 2012; Miles et al., 2016). Supraglacial ponds vary in size (from several meters to a few hundred metres across), shape, and suspended sediment concentration (e.g., Wessels et al., 2002; Takeuchi et al., 2012; Kraaijenbrink et al., 2016b; Watson et al., 2016; Miles et al., 2017b). They also vary in topographic setting, with many bordered by extensive ice cliffs (e.g., Sakai et al., 2000; Benn et al., 2001; Kraaijenbrink et al., 2016b). Perched ponds are known to fill and drain sporadically, suggesting variable inflows and outflows of water, and in many cases connections to the englacial system (Sakai et al., 2000; Benn et al., 2001; Gulley et al., 2009b; Benn et al., 2012; Takeuchi et al., 2012; Miles et al., 2016, 2017b; Rounce et al., 2017). Ponds drain superficially if the filling of surface depressions (hereafter flooding) leads to the development of a surface spillway which incises vertically (Raymond and Nolan, 2000), while englacial drainage mechanisms include exploitation of debris-filled crevasse traces or fractures, hydrofracturing, or connection with relict englacial conduits via basin expansion (Gulley et al., 2009b). These mechanisms create sudden, efficient englacial connections, leading to rapid drainage, which is then limited by the position of the connection (Benn et al., 2001, 2012; Mertes et al., 2016).
The geometry and evolution of individual supraglacial ponds has been assessed in select locations through repeat surveys (e.g., Benn et al., 2001; Röhl, 2008), leading to the development of a conceptual model of pond evolution incorporating the major mechanisms of pond-associated ablation, and representing the progression from individual perched ponds to the coalescence of base-level features (Mertes et al., 2016). At the glacier scale, perched ponds have been observed to undergo a seasonal cycle, with ponded area increasing due to meltwater supply during the pre-monsoon and monsoon before widespread drainage during the monsoon and post-monsoon, or freeze-over in the winter (Miles et al., 2017b). Seasonal filling and drainage of a pond suggests regular blockage and clearance of an englacial conduit leading from the pond (Benn et al., 2017; Miles et al., 2017b; Narama et al., 2017). Potential conduit blockage mechanisms include roof collapse, debris mobilization, seasonal freezing of sediments, or even creep closure (Gulley et al., 2009b; Benn et al., 2017).
Few water level records have documented pond drainage or filling for debris-covered glaciers, with inferences instead made from englacial conduit structure after pond drainage. To extend the current understanding of supraglacial pond seasonality and evolution, this study documents and interprets detailed observations of water level and surface area fluctuations at a set of ponds during 2013 and 2014. Our objectives are to:
1. Document seasonal changes in pond geometry by comparing high-resolution orthoimages and DEMs.
2. Analyse seasonal pond filling and/or drainage mechanisms by assessing water level fluctuations.
3. Locate likely zones of surface-subsurface connectivity across the glacier surface through a combined GIS and field-based analysis.
2. Study Site and Methods
2.1. Lirung Glacier
Perched ponds were studied during 2013 and 2014 at Lirung Glacier in the Langtang Valley of Nepal (Figure 1). Lirung Glacier is a small glacier (6.1 km2) descending from the southeast face of Langtang Lirung (7,234 m.a.s.l.), bordering the Tibet Autonomous Region of China. The debris-covered tongue of the glacier covers ~17% of the glacier's area and ranges from 4,000 to 4,350 m.a.s.l. The low elevation of Lirung Glacier's debris-covered tongue and the southerly aspect of its accumulation area have led to progressive downwasting over the past several decades, including the formation of a terminal lake in the 1990s, and retreat of the glacier's terminus (Ragettli et al., 2016a; Nuimura et al., 2017). The tongue is disconnected from the clean-ice portion of the glacier and is nearly stagnant, but experiences significant deposition of mass via ice and debris avalanches at its upper part (Ragettli et al., 2015, 2016a; Kraaijenbrink et al., 2016a; Nuimura et al., 2017). Local climate is controlled by the South Asian monsoon, with the majority of precipitation occurring concurrently with the warmest temperatures, from mid-June to September. This period also contains the highest daily maximum and minimum temperatures, and consequently the highest rates of ablation (Ragettli et al., 2015).
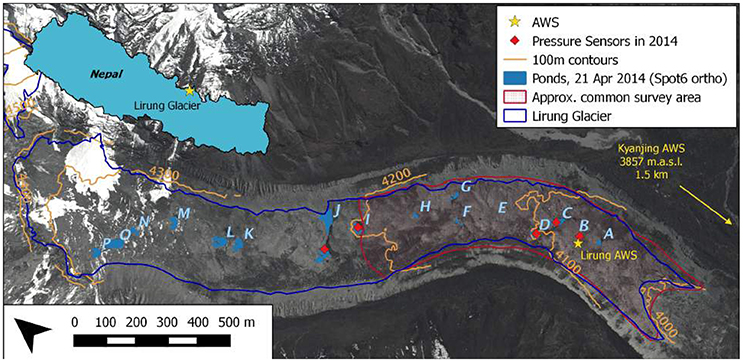
Figure 1. Observed ponds on Lirung Glacier, 2013 and 2014 shown against the 2014 SPOT6 orthophoto (backdrop). Pond location B contained a small pond in 2013, but no pond was observed in 2014. Location E had two small ponds in May 2014, but no pond was evident in the April SPOT6 orthophoto. The common survey area is the minimum area covered by all orthoimages; ponds I and J were also observed in most images.
2.2. Field Instrumentation
In May 2013, two ponds on Lirung Glacier (C and J; Figure 2) were instrumented with HOBO U20 Water Level Loggers (±1.2 kPa; ±0.44°C). The two loggers were downloaded and redeployed in October 2013 and May 2014, but changes in pond water level led to the exposure of the sensors, so only a subset of the period has water pressure data (Table 1). In May 2014, two additional ponds (D and I) were instrumented with identical sensors, and a Keller DCX-22 pressure transducer (±0.1% kPa; ±0.5°C) was installed in a dry depression (B) that had previously contained a pond. All sensors were downloaded and redeployed in October 2014, but the Gorkha earthquake in April 2015 prevented subsequent sensor recovery. While submerged, each of these sensors recorded pond-bottom water pressure (Plb) and temperature (Tlb). The observed pond-bottom pressure (Plb) was corrected for atmospheric pressure (P0) measured at the nearby Kyanjing AWS (Figure 1; Table 1) and adjusted to the pond elevation using the ideal gas law and ambient temperature, producing time-series of hydrostatic pressure. These data were then converted to at-sensor water depth based on the water density at the observed pond-bottom temperature.
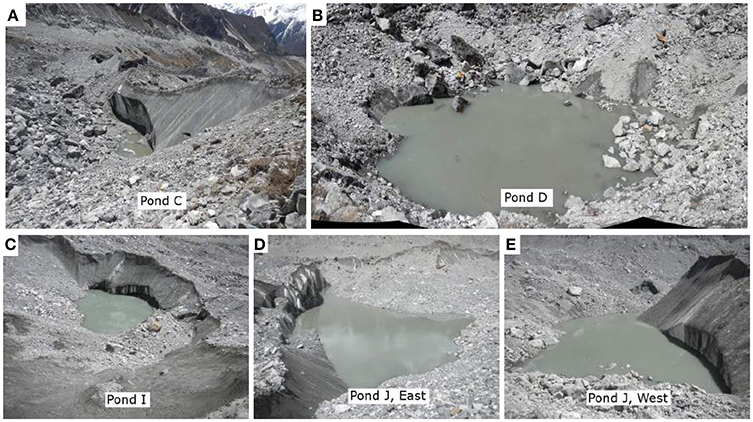
Figure 2. The four ponds studied in detail as they appeared in May 2014. Approximate photograph positions are indicated on Figures 5–8.
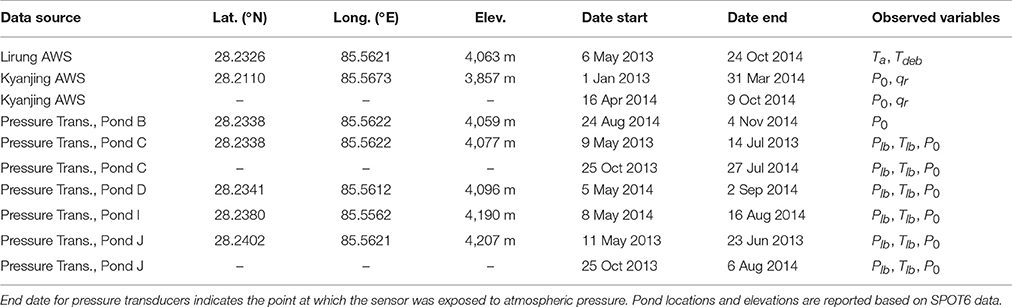
Table 1. Weather station and pressure transducer records for supraglacial ponds on Lirung Glacier.
Additionally from the Kyanjing AWS, we use the record of daily precipitation (qr). From an on-glacier AWS (Lirung AWS; Figure 1; Table 1), we also use records of air and debris surface temperature (Ta and Tdeb, respectively).
2.3. Orthoimages and DEMs
In addition to the in-situ observations of pond water level and temperature, results from aerial, satellite, and terrestrial remote sensing campaigns were used to provide repeat-observations of pond area. Ponds were manually digitized from the coregistered orthoimages; no position correction was made for glacier surface displacement, which was assessed at each pond.
During the study period, three surveys (May 2013, October 2013, May 2014) were conducted using an unmanned aerial vehicle (UAV). Imagery from these campaigns was processed using a Structure-from-Motion (SfM) process chain (Agisoft Photoscan Professional) to produce ultra-high-resolution orthomosaics and associated digital elevation models (Table 2; Immerzeel et al., 2014; Kraaijenbrink et al., 2016a). The error of the UAV DEMs is approximately 0.2 m horizontally and 0.5 m vertically as evaluated relative to off-glacier ground control points (GCPs) and tie-points (Kraaijenbrink et al., 2016a).
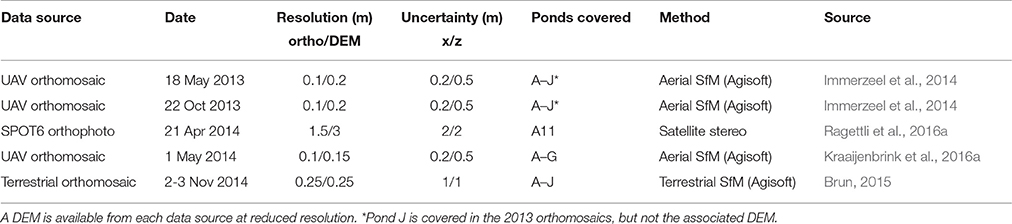
Table 2. Summary of Lirung Glacier orthoimages, 2013 and 2014, used as data sources for seasonal observations of pond area changes.
Additionally, a SPOT6 stereo image pair was acquired on 21 April 2014, slightly preceding the 2014 UAV flights (Table 2). The SPOT6 data were processed to produce a high resolution orthophoto and DEM (Ragettli et al., 2016a). After initial georeferencing with off-glacier GCPs, the DEM was coregistered and bias-corrected relative to the off-glacier topography of the May 2014 UAV data using an iterative aspect-based correction (Nuth and Kaab, 2011). Unlike the UAV data, the SPOT6 acquisition provides a complete coverage of the debris-covered tongue. However, its relatively coarser resolution does not represent the surface topography as well. A random sample of 1,000 off-glacier points had a mean absolute vertical error of 1.5 m and a mean absolute error of 8.7° in slope relative to the May 2014 UAV data.
Finally, in November 2014, 682 terrestrial photos were taken of the glacier tongue from its lateral moraines and from prominent positions on-glacier. These images were analysed with an SfM procedure similar to that of the UAV data, and processed with 21 on-glacier GCPs to derive an orthomosaic and DEM (Table 2; Brun, 2015; Brun et al., 2016). The resulting DEM was evaluated with 682 differential global positioning system (dGPS) points taken on prominent sections of the glacier; the mean absolute vertical error at these points was 0.5 m. However, the source photos and GCPs are not uniformly distributed, with the highest density near the study ponds, so we assume an uncertainty of 1 m for the whole dataset (Brun et al., 2016). The terrestrial survey area was slightly larger than for the UAV surveys, but did not include the uppermost portion of the tongue for safety considerations. Consequently, pond observations from orthoimages and DEMs were restricted to the lower elevations, other than in April 2014 (Figure 1; Table 2).
2.4. GIS Mapping of Surface Water Flow
To identify closed surface depressions and possible drainage paths, we investigated the April 2014 SPOT6 and May 2014 UAV-derived DEMs (Table 2). The SPOT6 DEM has full coverage for the glacier tongue, while the UAV DEM has much greater detail and accuracy for the common survey area. We determined flowpaths using the greatest downhill slope method (D8) as well as a triangular multiple flow direction method (MD∞; Seibert and Mcglynn, 2007), which partitions downslope flow based on the downslope gradient vector of the 3 × 3 neighborhood.
Each DEM was “flooded” to identify surface depressions without an outlet. Considering the thicknesses of debris observed at the study site (up to 3 m; Ragettli et al., 2015; McCarthy et al., 2017) and the likelihood for shallow groundwater flow (Collier et al., 2014), we defined sinks as only those closed surface depressions with a maximum depth greater than 3 m. We then determined the contributing catchment area for each sink using SAGA GIS, and determined drainage paths for local catchments from the unmodified DEM using the MD∞ and D8 algorithms. Finally, we flooded all sinks and calculated flowpaths using the MD∞ algorithm.
2.5. Field Mapping of Surface and Subsurface Water Flow
Each of the ponds was observed during field visits in May and October-November of 2013 and 2014, noting the pond and ice cliff geometry and documenting any pronounced changes. During 5-6 May 2014, a more comprehensive in-situ survey was conducted for the entire zone of the UAV surveys to evaluate the modeled surface drainage pathways. We documented and geotagged the following surface and shallow-subsurface signs of water flow:
1. Water visible at the glacier surface, and whether it was stagnant (ponded) or actively flowing.
2. Water flow audible, but not visible, beneath the debris layer.
3. Evidence of recent water presence, as indicated by wet, fine sediments.
4. Visible englacial conduit openings.
2.6. Data Synthesis
First, we assess seasonal changes in ponded area based on the orthoimages, analysing both the glacier as a whole and individual ponds. Integrating all data available for each site, we use the repeat DEMs and orthoimages along with survey results and water level records to detail the changes at ponds C, D, I, and J. We then attribute water level variations to pond-proximal processes, and interpret the overall changes at ponds in terms of filling, drainage, or isolation.
Second, we consider the drivers of observed changes at each pond using “back-of-the-envelope” calculations (Supplementary Material). We examine rises in water level alongside the precipitation and temperature records to determine if pond flooding is attributable to local sources of water, both for rapid variations and for seasonal events. We then compare observed water level declines with calculations of spillway incision rates and estimates of discharge through debris-filled conduits to assess the likelihood of these processes. We also calculate the required subaqueous ice cliff area for subaqueous melt to account for water level declines.
Finally, we combine the field survey results with the catchment analyses of the April 2014 DEM to consider the morphology of the drainage system and to identify englacial conduit formation mechanisms and inheritance across Lirung Glacier. We investigate the spatial association of surface sinks with observed surface ponds and streams, sub-debris streams, and englacial conduits, and consider the evidence for surface-subsurface connectivity across the hummocky debris-covered glacier.
3. Results
3.1. Pond Observations and Interpretation
3.1.1. Seasonal Pond Area Changes
The 2013 and 2014 orthomosaics revealed 16 ponded locations on Lirung Glacier (Figure 1, Table 3). Some ponds (e.g., B,E) were very small (10 s m2 in area) and evident in only a few images, while others (C,D,I) were more moderate in size (100 s m2) and persisted across all five orthoimages with minor fluctuations in size. Pond J, the largest pond with repeat observations, fluctuated dramatically in size season-to-season, between 7,290 and 450 m2 in 2013 (Table 3) due to its drainage in June (Figure 3). The largest observed area for this pond occurred in May 2013, but field observations suggest that the pond was much larger in May 2014, when it was not covered by the UAV orthoimage. This pond alone made up over one-quarter of total ponded area for Lirung Glacier in April 2014, the only occasion when the entire debris-covered tongue was observed. A major filling event was captured by the pressure transducer in April-June 2014 (Figure 4). Based on the April 2014 SPOT6 DEM and continunous pressure record, we estimate a ponded area of 8,250 m2 for the May 2014 UAV orthoimage date, with ponded area growing to an estimated 17,000 m2 before the logger stopped functioning.
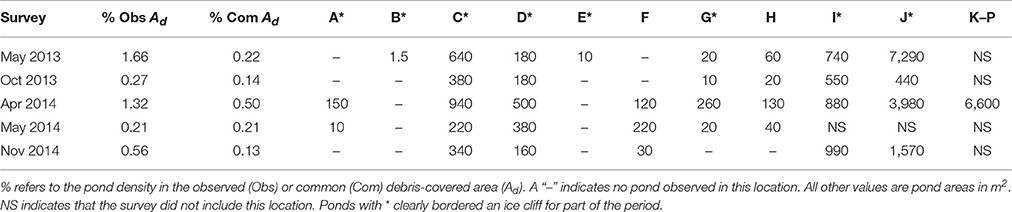
Table 3. Pond areal changes from orthoimages, 2013 and 2014.
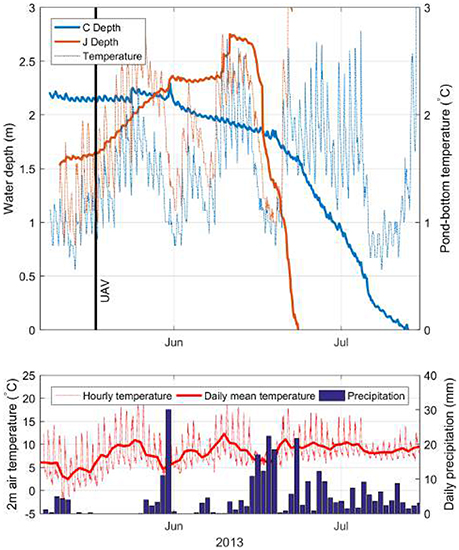
Figure 3. Records of pond water level (relative to pressure transducer elevation) and temperature for ponds C and J in 2013. Also shown are air temperature from an on-glacier sensor (Lirung AWS) and precipitation from an off-glacier tipping gauge (Kyanjing AWS), as well as the timing of the premonsoon orthoimage.
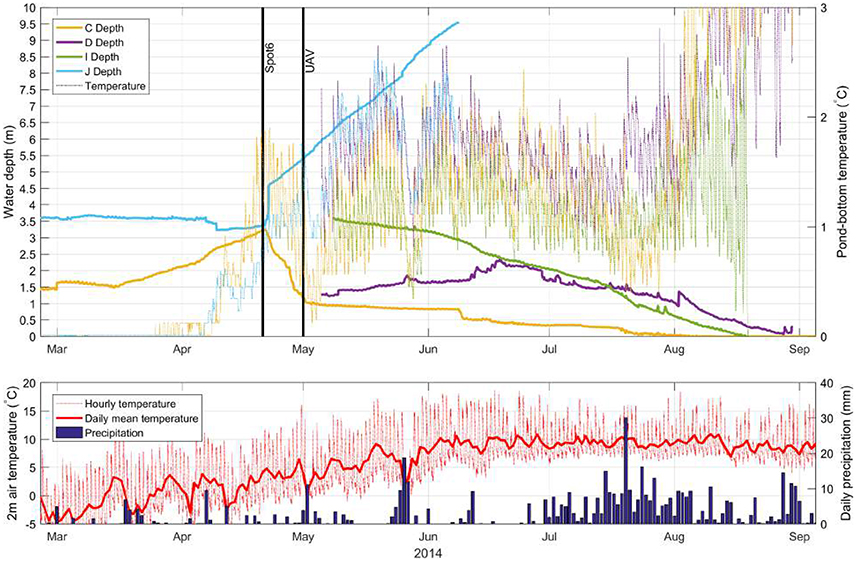
Figure 4. Records of pond water level (relative to pressure transducer elevation) and temperature for ponds C, D, I, and J in 2014. Also shown are air temperature from an on-glacier sensor (Lirung AWS) and precipitation from an off-glacier tipping gauge (Kyanjing AWS), as well as the timing of the premonsoon orthoimages.
In both 2013 and 2014, total pond cover was greater in the pre-monsoon than in the post-monsoon (Table 3). Over the lower tongue, ponds were typically smaller in area than across the upper portion of the glacier (Figure 1, Table 3). The common area of observation for all orthophotos encompasses ponds A-H, where a seasonal fluctuation is apparent, with ponds appearing by April (0.5% of the common area), partially draining by May (0.21–0.22%), then declining during the monsoon and post-monsoon to cover 0.13–0.14% of the common area (Table 3). Observed ponds show some shrinkage between April and May 2014 (except pond F), and additional area decrease between May and October/November in both years (except ponds C and I in 2014). Including ponds I and J, which were not observed in May 2014, the ponded area of Lirung Glacier declined from 1.66 to 0.27% of the UAV survey area in the period May-October 2013, and from 1.32 to 0.56% of the same area in the period April-November 2014.
3.1.2. Characteristics of Water Level Change
The water level records show several signals of varying duration: diurnal fluctuations, short pulses, erratic jumps or drops, and slow long-term rises or falls (Figures 3, 4). These changes in pond water level could be the expression of a variety of disturbances such as large or small debris slumps, calving and structural collapses above the water level, pond floor collapse, subaqueous melt, and variations in water storage due to a changing balance between water inputs (supply) and outputs (discharge). We have no direct observations of these processes during the monsoon, but their anticipated effect on pressure transducer observations is discussed in the Supplementary Material. Here we describe the various signals in the water level records and summarize the likely processes responsible based on the reasoning given in the Supplementary Material.
Diurnal variations occurred for all ponds, and were present in all seasons including winter. These variations were generally 0.02–0.07 m in magnitude. There is considerable variability in magnitude between ponds (Supplementary Material), and the magnitude varies sporadically within any pond (e.g., the magnitude for pond C is 0.05 m in March 2014, but 0.02 m in May 2014). Variations typically have an asymmetrical peak, but the peak timing varies within the day (typically 0900 or 1300 for pond C, 0400 or 1900 for pond D, 1300 for pond I, 1800 for pond J). Some diurnal signals have a sharp rise in water level, while others exhibit a sharper decline, and occasionally a double-peak variation occurs. We attribute these diurnal variations to fluctuations in the balance between water supply and discharge, as the volume change associated with water level rise and fall is too great to be attributed to ice-cliff backwasting, subaqueous melt, or debris supply (Supplementary Material), supporting the observations and interpretations of Horodyskyj (2017); Benn et al. (2017). This explanation also accounts for the unique hydrograph at each site.
Two types of rapid change are evident in the water level records. We observed short-term pulses in water level of 0.1–0.3 m, with a gradual rise to peak followed by water level decay over several days. These events are usually concurrent in several ponds (e.g., 31 May 2013 for ponds C and J, Figure 3). We attribute these signals to local catchment supply from precipitation events, with which they are closely associated. Very sudden (sub-hour) water level jumps or drops of 0.15–1.1 m occurred occasionally in several water level records (e.g., pond J on 22 April 2014, Figure 4). These events are not associated with precipitation or rises in temperature, and each event is restricted to an individual pond. We interpret these sudden changes as indicative of volumetric displacements due to large debris slumps (including boulder capture) or structural collapse due to calving or sub-floor voids (Supplementary Material).
Gradual rises in water level >1 m were observed in four records: ponds C and D in 2014, and pond J in 2013 and 2014 (Figures 3, 4). These rises all began in the premonsoon and lasted several weeks. Most had diurnal fluctuations superimposed over them, but pond J in 2014 shows daily steps up in water level, with minimal diurnal decline. Our analysis suggests these changes represent basin flooding due to water supply outpacing subaqueous melt and outflow discharge (Supplementary Material).
Slow, prolonged water level declines (meters of lowering over several weeks) were documented for ponds C and J in 2013 (Figure 3), and for ponds C, D, and I in 2014 (Figure 4). These declines were sometimes interrupted by abrupt rises or falls, as for pond D in 2014 (Figure 4). On other occasions, declines were very steady, as for ponds C and I in 2014 (Figure 4). A change in the slope of decline is evident in both water level records at pond C, indicating at least two processes contributing to the lowering. While basin expansion by subaqueous melt should manifest as a background signal of water level lowering due to the density difference between water and ice (Miles et al., 2016), the magnitude of daily volume change is often too great to be attributed to this mechanism (Supplementary Material). Consequently, we ascribe the gentle steady declines of ~1-2 cm d−1 to subaqueous melt, and steeper declines to net outflow via low-slope spillways or low-transmissivity porous-media (Supplementary Material).
3.1.3. Changes at Ponds, 2013
Here we provide a summary of the major changes that occurred at each pond and our interpretation of them (Table 4). The areal and structural changes for the four study ponds, as well as our interpretation of the ponds' behavior in 2013 and 2014, is documented comprehensively in the Supplementary Material.
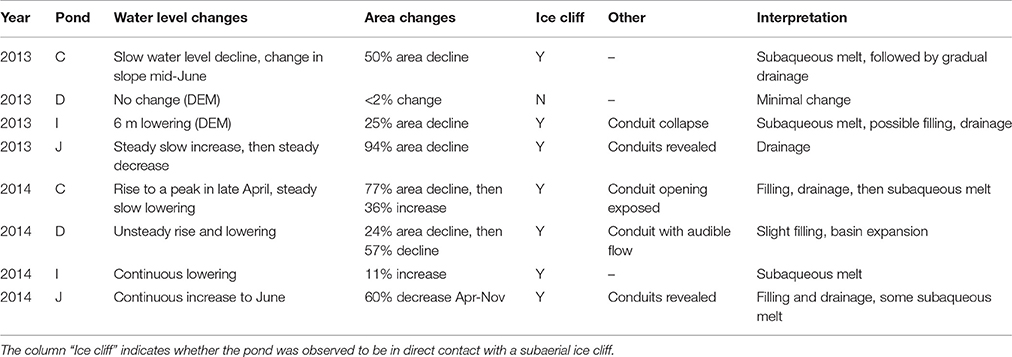
Table 4. Summary of observed pond changes and inferred behavior for 2013 and 2014.
Pond C was the most comprehensively observed pond on Lirung Glacier through instrumentation and field surveys (Figure 5), and was the focus of energy-balance modeling by Miles et al. (2016). This small pond (up to 640 m2, and therefore smaller than a Landsat pixel) was heavily shaded by a 20 m high ice cliff during all four field visits (Figure 2). The ice cliff presented an overhanging, scalloped face directly above the ice-water contact, which retained a similar geometry over the study period as the cliff backwasted (Figure 5b,c). In 2013, the pond decreased in surface area between the May and October orthoimages from 640 to 380 m2 (Figure 5a,d). This shrinkage was accompanied by a lateral translation of ~7 m in the direction of the ice-cliff backwasting (local glacier surface velocity is ~2 m a−1; Kraaijenbrink et al., 2016a), and a net water level lowering of 3.0 m (Figure 5b,c). Surface lowering of the nearby debris-covered areas over this period was 0.5–1.5 m (Immerzeel et al., 2014). Expansion of the depression was dominated by backwasting of the adjacent ice cliff (Figure 5b,c). The pressure transducer at pond C recorded a gradual water lowering of 2.32 m over 44 days (Figure 3), with occasional jumps or drops of up to 0.15 m. The water level record is characterized by diurnal fluctuations of 0.05 m with a peak at about 13:00. The diurnal energy storage fluctuations at this pond indicate slow drainage during this entire period (Miles et al., 2016), and two changes in the slope of water level decline are evident from the record (Figure 3). The first occurs when the pond temperature increases around 25 May and is consistent with increased subaqueous melt (outpacing any water inputs). The second transition leads to a faster rate of water level decline beginning 20 June and a significant decrease in ponded area by October 2013, and suggests an increase in drainage efficiency. Thus, in 2013 pond C shows water level lowering associated with subaqueous melt followed by slow drainage (Miles et al., 2016).
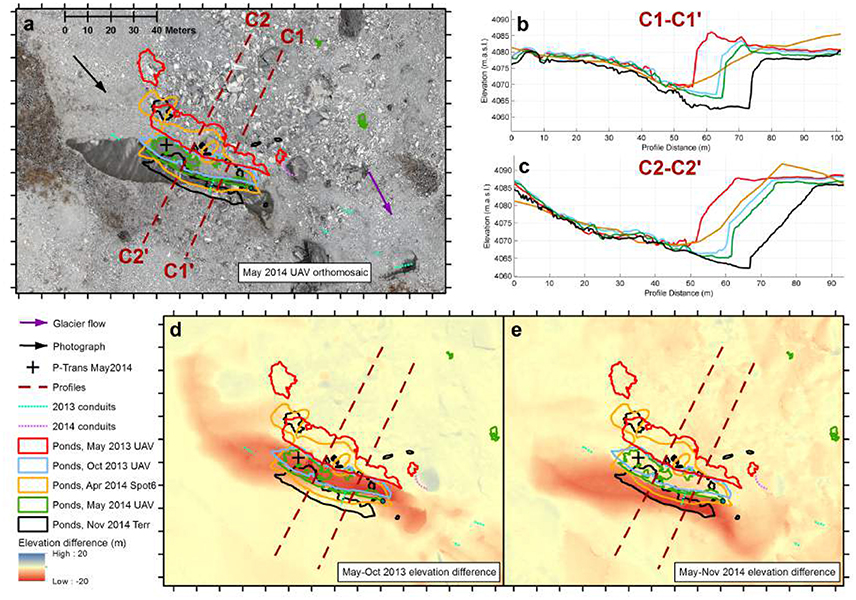
Figure 5. Summary of pond C depression change over 2013 and 2014. Pond outlines for the five orthomosaics are draped over the May 2014 UAV orthomosaic (a), also indicating profiles C1 and C2, conduit opening position in May 2014, and the perspective of the pond C photo in Figure 2. Profiles C1 (b) and C2 (c) are shown indicating the position of debris mounds deposited by ice-cliff backwasting. Monsoon surface elevation changes are shown for 2013 (d) and 2014 (e). Glacier surface velocity in this area is ~2 m a−1 (Kraaijenbrink et al., 2016a). The SPOT6 DEM does not represent the surface topography accurately relative to the SfM DEMs.
Pond D appeared to be a small, stagnant perched pond in 2013 and was surrounded by low-angle debris slopes; it was not investigated in detail (Figure 6). The 2013 orthoimages show only very slight differences in ponded area (Table 3) and outline (Figure 6a,d), with little indication of pond translation over the year. There was no change in pond elevation in 2013, and very slight expansion of the depression along its marginal debris slopes (Figure 6b–d). The few changes observed at pond D in 2013 suggest that the feature was entirely disconnected from the rest of the glacier's drainage network.
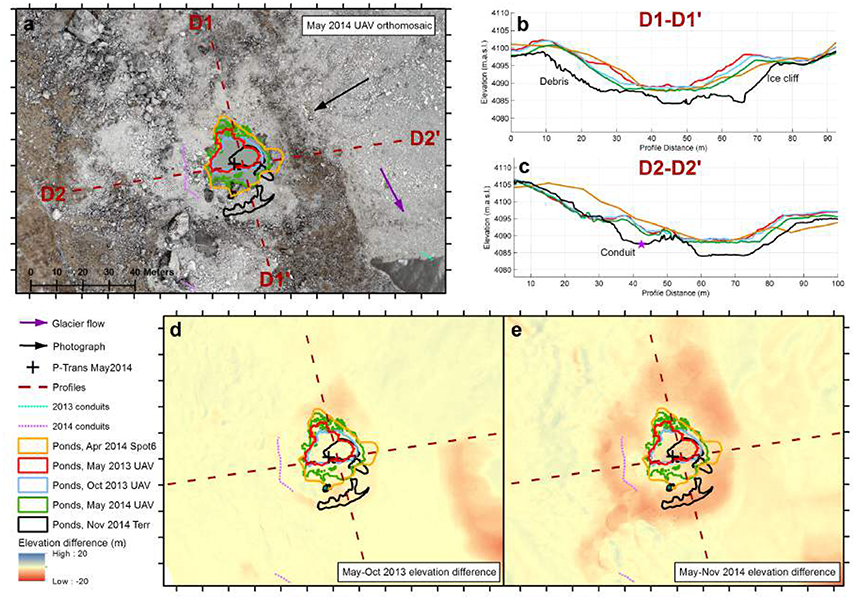
Figure 6. Summary of pond D depression change over 2013 and 2014. Pond outlines for the five orthomosaics are draped over the May 2014 UAV orthomosaic (a), also indicating profiles D1 and D2, conduit opening position in May 2014, and the perspective of the pond D photo in Figure 2. Profiles D1 (b) and D2 (c) are shown indicating the position of debris mounds deposited by ice-cliff backwasting. Monsoon surface elevation changes are shown for 2013 (d) and 2014 (e). Glacier surface velocity in this area is ~2 m a−1 (Brun et al., 2016; Kraaijenbrink et al., 2016a). The three water bodies in November 2014 had the same water level.
Pond I (Figure 7) was also not observed in detail in May 2013, but appeared in the UAV orthophoto as a pond of moderate size (740 m2, which would possibly be observable by Landsat) with an adjacent ice cliff with a fairly uniform slope angle, and no vertical or overhanging face (Figure 7a–c; Cliff 4 in Brun et al., 2016; Buri et al., 2016). The pond shrank slightly in area to 550 m2 by October 2013 (Figure 7), and the pond outline translated ~10.5 m to the east (local glacier surface velocity is ~3 m a−1 to the southeast). During this period, however, the water surface lowered ~8 m, revealing a 4 m vertical section at the base of the cliff (Figure 7b,c). The pond's depression expanded rapidly between May and October 2013, particularly to the west due primarily to ablation of the adjacent ice cliff (Brun et al., 2016). This new band of ice cliff had a relict englacial conduit at its base leading into pond I, occupying a zone between the May and October 2013 pond levels, and exhibited a parallel debris mound with apex near the prior slope (Figure 7b–d). As pond I and the exposed conduit segment were immediately down-glacier and at a slightly lower elevation than pond J (Figure 1), the conduit's exposure may have been associated with pond J's observed drainage in July 2013 (Figure 3). The opening of this conduit beneath pond I's water level likely established an efficient drainage path leading to its drainage.
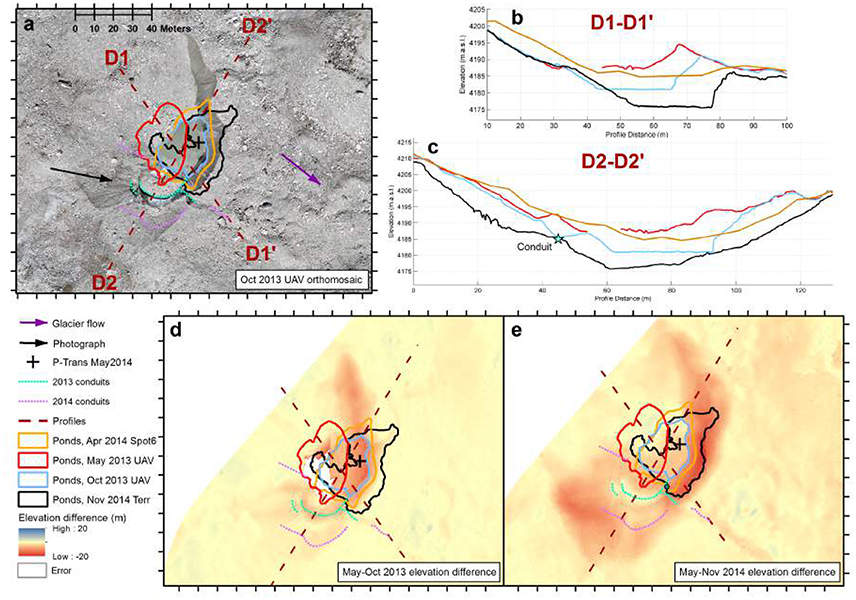
Figure 7. Summary of pond I depression change over 2013 and 2014. Pond outlines for the five orthomosaics are draped over the October 2013 UAV orthomosaic (a), also indicating profiles I1 and I2, conduit position in October 2013, and the perspective of the pond I photo in Figure 2. Profiles I1 (b) and I2 (c) are shown also indicating the conduit position. Surface elevation changes are shown for May—October 2013 (d) and for October 2013—October 2014 (e). The May 2014 UAV data did not encompass pond I. Glacier surface velocity in this area is ~3 m a−1 (Kraaijenbrink et al., 2016a).
Pond J was the largest pond-cliff system observed on Lirung Glacier during the study period, and exhibited major fluctuations in area (Figure 8). Brun et al. (2016) have described changes at the adjacent ice cliff (Cliff 5). The pond has two sections, which were initially divided in May 2013 by an ice dam. At this point the ponded area encompassed 7,290 m2 (equivalent to multiple Landsat pixels). By October 2013 the pond had reduced in area to 450 m2 and occupied two small depressions to the southwest; the eastern half had drained entirely. As recorded by a pressure transducer, pond J's water level rose 1.2 m over 28 days, with several jumps of up to 0.18 m, then lowered 2.8 m over 13 days (Figure 3), exposing the sensor. The complete drainage of the eastern half of pond J by October 2013 revealed a well-preserved englacial conduit floor at the base of the large ice cliff with false floors (similar to those described by Gulley and Benn, 2007; Benn et al., 2009) and multiple lateral thermo-erosional incisions at the outer margin of conduit meanders (Figure 9a). We interpret the sudden rises in water level on 9 and 10 June to represent instantaneous volume inputs (up to 1300 m2) most likely associated with boulder capture or calving. The gradual decline in water level (11-15 June) suggests that subaqueous melt was outpacing water inputs. An increase in drainage efficiency, likely via the observed conduit segments, on 15 June led to pond drainage for at least 13 days. This drainage would have led to downglacier surface subsidence, possibly associated with the exposure of the conduit at pond I.
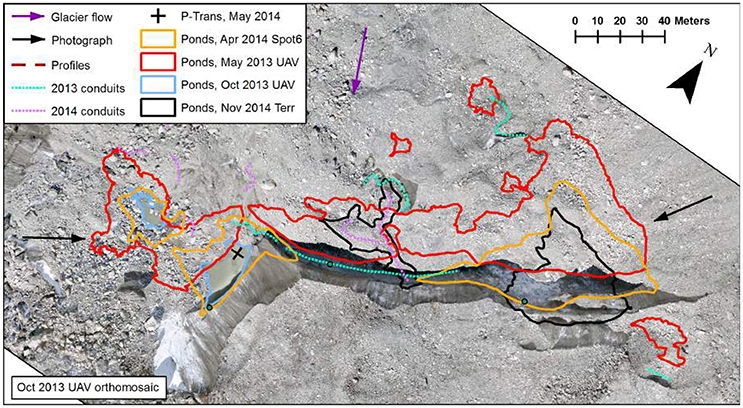
Figure 8. Pond J outlines for May and October 2013, and April and November 2014, also indicating approximate perspective of Pond J photographs shown in Figure 2, and identifying exposed segments of relict englacial conduits observed in October 2013 and 2014. Glacier surface velocity in this area is >4 m a−1 (Kraaijenbrink et al., 2016a), but the majority of outline shift is due to ice-cliff backwasting.
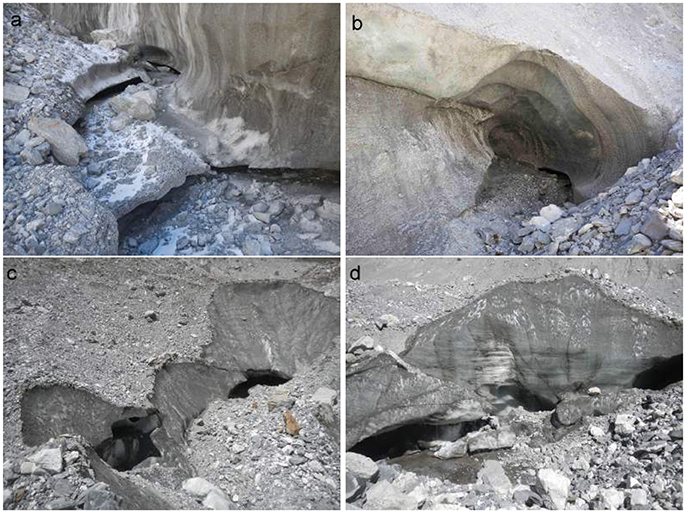
Figure 9. Examples of englacial conduits exposed near ponds: (a) the drainage of pond J exposed a complex of conduits at the ice cliff base in October 2013, (b) a phreatic conduit was exposed near former pond A in May 2014, (c) ice-cliff backwasting near pond I revealed conduit segments by May 2014, and (d) by October 2014, the drainage of the western portion of pond J revealed conduit segments which may have connected to the conduit in (a).
3.1.4. Changes at Ponds, 2014
By 21 April 2014, the area of pond C had increased to 950 m2, but the ponded area subsequently decreased to 220 m2 by 1 May 2014 (Figure 5). The ponded area then increased slightly to 340 m2 by November. Based on the DEMs, the pond showed net surface lowering of ~1 m between October 2013 and May 2014, and a further ~3.5 m by November 2014. The pressure record for pond C extended from October 2013, and captured a small jump in water depth (0.25 m, equivalent to a displacement of ~80 m3) on 1 March, followed by diurnal oscillations of ~0.05 m (Figure 4). Water level began to rise on 15 March, and rose by 1.77 m over 38 days to peak on 21 April, then lowered by 2.23 m over 10 days. After 1 May, water level gradually lowered (~0.2 m per month) for the remainder of the monsoon. During the field visit in May 2014, a small surface stream was observed meandering from the pond through debris to an englacial conduit opening (position indicated on Figure 5), a position that was beneath the ice surface in 2013. The reinitiation of strong diurnal fluctuations in March suggests resumed water inputs and outflow discharge (Benn et al., 2017; Horodyskyj, 2017), and the broad rise and fall in water level in April represents a significant net input of water to flood the local depression, followed by net outflow. The exposed conduit opening suggests there was a more efficient connection to the englacial drainage network than in the previous year, but its elevated position limited the pond's drainage. We therefore interpret the steady decline in water level after 1 May as indicating subaqueous melt.
Pond D had expanded to 500 m2 by April 2014 (Figure 6), and the pond had a similar area in May 2014. The orthoimages also indicated that several ice cliffs had formed around the pond. By November 2014, the pond had fragmented into four small water bodies at the same water level, covering a total area of 160 m2 (Figure 6a,e). The May 2014 DEM shows the pond water level ~1 m lower than in May and October of 2013, but the water level lowered a further ~5 m between May and November 2014 (Figure 6b,c). The pond's depression expanded on all sides during this period. In November, a single large ice cliff remained at the pond's southern margin and exhibited a distinct thermo-erosional notch at about the May 2014 water level, while the other sections of ice exposed in May 2014 were re-buried by debris. Flowing water could be heard in October and November 2014 beneath this cliff (position indicated on Figure 6a,c). The water level record over this period is erratic (Figure 4), with sharp drops or rises of up to 0.51 m and diurnal fluctuations of 0.07 m, but the general pattern is a broad rise (1.07 m over 44 days) and fall (2.25 m over 70 days). The unsteady water level rise indicates a net input of water until 15 June, and the subsequent decline indicates a change in the water balance producing net outflow and/or increased basin expansion. The audible flowing water and exposed conduit segment (both observed in November 2014) are evidence of connection to the englacial drainage system at that water level, and suggest that drainage played a role in the water level lowering.
In April 2014, pond I had a surface area of 880 m2. The pond was not within the UAV survey area for May 2014, but in November 2014 it had grown slightly to an area of 990 m2 (Figure 7). Between October 2013 and November 2014 pond I's water level lowered ~5 m (Figure 7b,c). During this period, the basin expanded due to ice-cliff backwasting at the pond's eastern margin (as in 2013) and to the southwest of the pond, associated with the ice cliff and conduit segment that first appeared in 2013 (Figure 7b,c,e). The exposed portion of this conduit had expanded, revealing additional openings through the debris and progressively exposing additional meanders (Figure 9c). The adjacent debris mound, a location of enhanced surface lowering in 2013, instead showed minimal surface lowering in 2014 (Figure 7d,e). The pond's water level steadily lowered for the entire period of water level record (103 days), a total decline of 3.58 m. We attribute the slow rate of water level lowering to subaqueous melt, rather than drainage. The pond lost connection to the 2013 efficient drainage path due to sustained water level lowering (15 m between May 2013 and October 2014), which had rendered the conduit opening inaccessible.
In April 2014 pond J had an area of 3,980 m2 and, as in 2013, encompassed both depressions and spanned nearly the complete width of the glacier tongue. By November 2014 the pond's area had declined to 1,570 m2, and occupied only the northeast depression (Figure 8). The pressure transducer at pond J recorded an increase in temperature beginning 6 April, then a sudden rise in water level (1.23 m) on 21 April. This was followed by a steady, uninterrupted rise of 4.9 m over the next 48 days. The high water level in May 2014 prevented access to the water level logger, which ran out of memory before the pond's drainage. Field surveys in October and November of 2014 observed new relict conduits exposed at the surface, as in October 2013, leading into the western pond depression from up-glacier (Figure 9d). The observed temperature increase in early April indicates the pond surface thawing. In mid-April, the sudden rise in water level corresponds to a displacement of at least 4,300 m3 (Supplementary Material), which likely represents a structural change in the pond's vicinity rather than debris or water inputs. This sudden change is precisely aligned with the maximum water level at pond C for 2014, in the afternoon of 21 April (Figure 4). Subsequently, the pond C water level dropped over ten days (estimated pond volume change of 1600 m3 based on the May 2014 DEM) before switching into a gradual decline, while pond J's volume increased by an estimated 6,000 m3 over the following day, and experienced a continuous water level increase until at least June (Figure 4). We interpret this behavior as a blockage in the drainage network linking ponds C and J on 21 April. Such a blockage (likely in the vicinity of pond J and associated with the large displacement on 21 April) not only initiated the backup of water in pond J, but also cut off the supply of water to pond C, allowing it to drain until its return to a local hydraulic level.
3.2. Surface Drainage Analyses
Considering catchments to be closed if they contain a sink more than 3 m below an outlet, we delineate 47 closed catchments in the SPOT6 DEM, while the lowest portion of the glacier surface drains unimpeded through five additional catchments (Figure 10). Closed catchments varied in size from 1,300 to 145,500 m2, with a median size of 10,600 m2. Within the 47 closed catchments, hydrological sinks often exceed 10 m depth below a surface outlet. All ponds observed in April and May 2014 coincided with surface sinks, but sinks occurred in many locations without any ponding identifiable from the orthomosaic imagery or from field surveys. Eleven of the closed catchments (23%) contained ponds visible in the April 2014 orthoimagery (Figure 10).
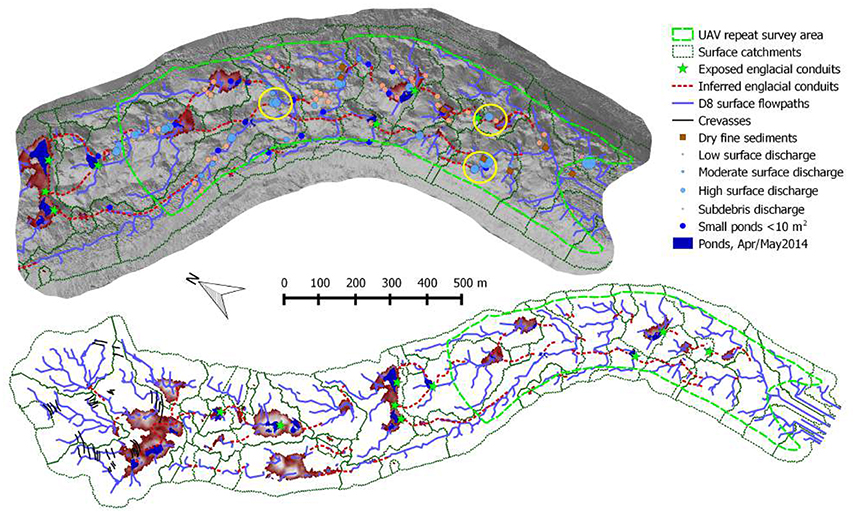
Figure 10. Results of the hydrological survey, including flow observations and indications of recent ponding, and hydrological sinks classified by catchment area as derived from the May 2014 UAV DEM, which has higher accuracy and detail for the common survey area. Yellow circles indicate positions with observed surface flow but minimal local catchment area. Also shown are inferred englacial pathways providing an outlet for the closed surface depressions. The background is the D8 flow direction derived from the November 2014 SfM DEM, which provides coverage for pond J.
The surface catchments are largest and sinks are deepest in the upper portion of the glacier, where ponds are also larger in surface area. Focusing on the May 2014 UAV survey area, where most of our observations were made, 23 closed catchments were identified (Figure 10). Seven of these contained ponds in the April and May 2014 orthoimages (30%), while five additional catchments contained ponds mapped in the May 2014 field survey (total of 12 ponds, 52%). All observed ice cliffs, excepting the glacier terminal cliff, directly bordered ponds in at least one image. Surface streams were identifiable in the field survey in eight of the 23 catchments, three of which contained ponds in the sinks. None of the surface streams had a well-defined incised channel; instead, they were flowing through or on top of the debris matrix. Sub-debris discharge was documented in seven of the 23 closed catchments, five of which contained ponds and two of which showed no ponded water.
Allowing all sinks to fill and spill over allows a possible surface drainage network to be delineated (Figure 11). By this method, the glacier surface routes water into two principal drainage pathways. The first (D1) captures all water inputs from the glacier headwall and runs down the center of the glacier linking the principal surface depressions and cliff/pond systems in a meandering pathway. The second system (D2) runs down the true right side of the glacier in a path parallel to the lateral moraine with few deviations before draining into D1.
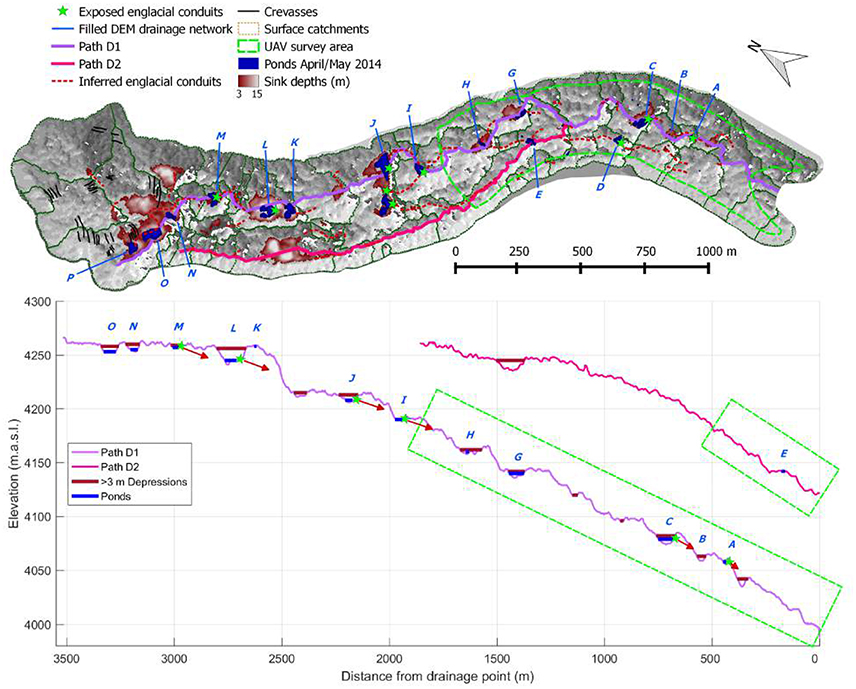
Figure 11. Location and elevation profiles (vertical exaggeration 5x) of the two principal drainage routes of Lirung Glacier, highlighting the sequential depressions and ponds linked by D1, compared to the relatively smooth profile of D2. Background for the map is the D8 flow direction, highlighting the moraine-marginal trough of D2.
3.3. Hydrological Field Survey
The field survey extended across roughly the same region surveyed by the UAV and terrestrial orthomosaics, an area of approximately 0.48 km2 (Figure 10). Within this area, ponded water was observed in 20 locations, eight of which were observable in the April 2014 SPOT6 imagery and the remainder were less than 10 m2 in area (too small to be identified with confidence in the imagery). Flowing water was observed visibly in 51 locations, mostly as small streams with a low discharge (32 locations), sometimes as small streams with moderate discharge (17 locations), and in two locations as large supraglacial streams near the terminus. None of these surface streams extended for more than a few metres before submerging beneath the debris; few remained audible for more than a few metres beyond submergence. In addition, flowing water was detected audibly beneath the surface in a further 36 locations. By comparison with the sound of the surface streams, we consider these to contain low or moderate discharge. Finally, in 3 locations, significant deposits of wet, fine sediments were observed within topographic depressions, suggestive of ponded water that had recently drained.
Relict englacial conduits were exposed at the glacier surface in several locations throughout the study period in varying states of preservation (Figure 9). Some presented a circular opening at the glacier surface with a complete roof; others presented an ice wall on one side with occasional ice arches spanning the channel. They were always located in close proximity to a supraglacial pond, whether filled or recently drained (Figure 10).
4. Discussion
4.1. Patterns and Implications of Pond Change
Rises in water level at ponds began in March-May, when warm air temperatures thaw ponds and lead to meltwater production across the glacier (Figures 3, 4). At this time, ponds are not likely to be connected to the englacial network in an efficient manner, so surface routing of this meltwater leads to depression flooding and associated area increase. Conversely, sharp water level declines clearly associated with drainage were documented in April (pond C, 2014), June (pond J, 2013), and later (pond J, 2014). Thus, we infer that pond seasonality is derived from the timing of mechanisms that decrease drainage efficiency vs. those that increase efficiency. Mechanisms that decrease englacial drainage efficiency could be progressive (conduit creep closure), seasonal (freezing of sediments or icy matrix in conduits in winter), or sudden (conduit collapse). However, the primary driver that increases drainage efficiency (water and heat supply) is strong during the premonsoon and monsoon, but negligible at other times. Consequently the englacial drainage system is likely to be most efficient after the monsoon, when conduits have been opened by peak meltwater supply and ponds have established efficient connections, leading to reduced perched pond area late in the year (Miles et al., 2017a; Narama et al., 2017). Englacial drainage efficiency seems to decline over winter, implying that conduit blockage events are common, or possibly that prior conduit openings are no longer accessible due to water level lowering. Englacial drainage conditions at the beginning of the premonsoon are likely to be at their least efficient when water supply increases. There are strong parallels between this pattern and the seasonal development of drainage networks for clean-ice glaciers, which also undergo a cycle of inefficient to efficient englacial and subglacial drainage from winter to summer (Nienow et al., 1998).
Over the monsoon, each pond experiences a net lateral translation and water-surface lowering, regardless of whether it drains or not (Figures 5–8). The lateral translation is in the direction of ice-cliff backwasting (rather than glacier flow), indicating that subaqueous melt occurs at least as quickly as the horizontally-projected ice cliff melt (Miles et al., 2016). During this period, subaqueous melt occurs at the vertical wall beneath the ice cliff, but could also occur at the newly-exposed pond floor. As the ponds observed in the postmonsoon occupy the area of monsoonal ice-cliff backwasting, this zone is initially debris-free, but experiences debris deposition as cliff backwasting mobilizes the superimposed debris. The subaqueous melt area may also penetrate beneath the ice cliff in the case of thermoerosional notches (observed at nearly all ponds, Supplementary Material; Röhl, 2008; Xin et al., 2011). This subaqueous melt translates the ponded area laterally and vertically, while the density difference between water and ice also lowers the pond water level as it melts. Observed gradual water lowering rates are of the right magnitude (~0.02 m d−1) to be accomplished by subaqueous ablation (Supplementary Material). This background signal is present despite relatively low pond temperatures (always <3°C), suggesting high subaqueous melt rates for ponds in contact with bare ice (e.g., Sakai et al., 2000; Benn et al., 2001; Röhl, 2008; Miles et al., 2016), propagating coupled cliff-pond ablation hotspots and promoting topographic variability.
The water supply to the ponds is a combination of local and distal sources. For some ponds, storage increases associated with pond flooding are of the correct order of magnitude to be explained by meltwater and precipitation from the local closed catchment (Supplementary Material). However, the magnitudes of diurnal decreases in water level are too great to be attributed to subaqueous melt alone. This, together with the falls in water level after precipitation events, indicates discharge from all ponds even as they fill (except pond J in 2014). Furthermore, a heat budget approach accounting for diurnal fluctuations in water temperature estimates higher inputs of water than can be supplied by the local catchment (Miles et al., 2016), suggesting an external supply. Finally, the concurrent initiation of drainage at pond C and flooding at pond J in 2014 is strong evidence that these two features lie on the same drainage path, further indicating distal supply of meltwater in this instance. Consequently, we consider it likely that many ponds receive water beyond the local catchment.
Pond drainage events occurred slowly in all three instances documented by the water level loggers, spanning several days or weeks (Figures 3, 4). This is in contrast to sudden drainage by hydrofracture that has been documented for clean-ice glaciers (e.g., Boon and Sharp, 2003; Das et al., 2008) and has been hypothesized for Himalayan debris-covered glacier systems (Gulley et al., 2009b; Benn et al., 2012). Instead, the observed ponds appear to drain through porous debris which inhibits and stabilizes discharge. The water likely drains into a preexisting network of debris-choked conduits whose low slope, typical of englacial conduits on Himalayan Glaciers (Gulley et al., 2009b), would explain why drainage does not lead to runaway conduit expansion.
4.2. Pond Persistence and Depression Reutilization
The orthoimage-based pond area observations (Table 3) enable us to calculate the persistence of individual ponds during the study period (i.e., the period over which a pond is continuously present, Miles et al., 2017b) by considering how many of the orthoimages they appeared in. All four pond systems observed in detail persisted through both monsoon seasons (persistence > 2 years), while the smaller ponds (<200 m2) on the lower glacier tongue (A, B, E, F, G, H) were only observed in one pre-monsoon season or the other. Other than size, common attributes of the persistent ponds are that they were adjacent to ice cliffs and the water level experienced an overall decline year to year. These attributes are closely linked, as a prolonged and continuous water level decline is an expression of subaqueous melt. Pond persistence is important because it enables such ponds to absorb excess energy and warm, leading to eventual subaqueous sub-debris ablation and surface subsidence (Mertes et al., 2016).
Persistence in this case does not mean that the ponds did not drain: ponds C and J experienced repeated filling and drainage in consecutive years, but only drained partially each time. It is notable that the depressions are reutilized in consecutive years, rather than the multi-year recurrence interval of ponds investigated by Miles et al. (2017b); Benn et al. (2017). It has been suggested that pond drainage by development of a new englacial conduit connection should produce a hydraulically-efficient drainage outlet (Gulley et al., 2009b; Benn et al., 2012). For such a drained basin to be refilled, a significant outflow impediment is needed, suggesting that mechanisms reducing pond drainage efficiency are important even over seasonal timescales. At Lirung Glacier, such mechanisms include englacial conduit structural collapse (as inferred at pond J, 2014) or debris deposition and freeze-on. It is unlikely that englacial conduit creep closure is responsible, as such conduits are typically shallow in depth (Gulley et al., 2009b). Sustained water level lowering due to subaqueous ablation provides another possible explanation, as it could render efficient outlets inaccessible. This occurred at pond I during the study period; after flooding and drainage in 2013, the efficient outlet (the englacial conduit network) was above the pond's water level. In 2014, the pond persisted and the water level continued to lower due to subaqueous melt, as the prior efficient drainage path was inaccessible.
4.3. Evidence of Supraglacial-Englacial Connectivity at Ponds
The current conceptual model for perched pond development suggests that ponds act as isolated features in an enclosed basin until they drain (e.g., Mertes et al., 2016). However, our observations of (1) surface depressions without ponding, (2) slow englacial drainage, (3) surface water flow in locations without a large source catchment, (4) a strong association of ponds and exposed relict englacial conduits, (5) water level interaction between distant ponds, and (6) diurnal variations in water level associated with outflow discharge, suggest that ponds are instead part of a coupled supraglacial and englacial drainage system. This evidence suggests that ponds are the expression of locally, temporarily reduced drainage efficiency in a network with widespread surface-subsurface water exchange. Here, we summarize these major pieces of evidence of supraglacial-englacial connectivity.
Surface depressions, such as those identified in this study, could be surface features inherited from differential surface ablation, englacial conduit collapse, or prior ponding (Benn et al., 2001), but must have an efficient englacial outlet to prevent ponding. Of catchments delineated by 3 m confining features, 77% had no ponded water, implying that englacial openings are common features. Other sinks on Lirung Glacier contain ponded water, but several meters below a confining feature. The larger, deeper depressions were more likely to contain ponded water (Figure 10). However, there is no association between catchment area and ponding; e.g., ponds at locations D, E, and I are contained within depressions with relatively small surface catchments (all < 3, 000 m2). These factors suggest connectivity between surface depressions, likely following the lines of greatest hydraulic gradient.
As previously discussed, the slow and repeated englacial drainage of ponds C and J provide important evidence that ponds act as an inefficient connection between the surface and englacial drainage networks. Specifically, for our instrumented ponds, we found no evidence of rapid drainage events (duration of minutes to days), which would be expected for development of a new connection to the englacial network (Gulley et al., 2009b). Instead, drainage was via inefficient conduits, which likely followed pre-existing englacial pathways that had undergone a seasonal reactivation.
Field observations of glacier surface hydrology were spatially intermittent, but were closely aligned to modeled drainage pathways (Figure 10). However, some observations of surface water flow did not align with modeled flowpaths or appear with a small catchment area (yellow circles in Figure 10). Furthermore, one of the two high-volume surface flows observed was not aligned with a major flowpath, but did lie adjacent to very fine sediments and to a very small pond in an isolated catchment. These observations suggest that this was a relict pond depression (Mertes et al., 2016), and likely part of a former larger stream-pond system. The visible surface flow was comparable to the discharge observed at the glacier's terminus. The lack of local supply and association with a relict pond provides further support for supraglacial-englacial water exchange, and for the dynamic nature of the system.
Relict englacial conduits were regularly observed at the glacier surface leading into pond depressions. Such conduits were exposed by pond water level lowering, ice-cliff backwasting, and roof collapse, supporting previous suggestions that perched ponds are conduit-collapse structures located along englacial drainage pathways (Sakai et al., 2000; Benn et al., 2001, 2012). The number and length of segments exposed over two ablation seasons in a relatively small area suggests a high density of conduits, accounting for considerable englacial void space.
Another piece of evidence already discussed is our observation of interaction between the water levels of ponds C and J in early 2014, which clearly indicates that these ponds were not isolated features. Specifically, these records suggest that background discharge from pond J was draining into pond C until a major structural change impeded this discharge, allowing pond C to drain.
Finally, analysis of diurnal and episodic fluctuations in pond water level provide further evidence of supraglacial-englacial connectivity. Diurnal fluctuations have been previously attributed to the timing of pond water supply and discharge (Benn et al., 2017; Horodyskyj, 2017). Our calculations support this interpretation, as the magnitude of daily lowering is too great to be attributed to subaqueous melt alone. When precipitation events lead to rises in water level, they are followed by declines, indicating discharge during this period. In other cases, however, precipitation does not lead to any change in water level, suggesting a spillway control on water level or runoff diversion.
4.4. Surface and Subsurface Drainage Networks on Lirung Glacier
On debris-covered glaciers, surface drainage pathways may be closely tied to englacial pathways through shared history and evolution (Gulley, 2009; Immerzeel et al., 2014; Benn et al., 2017). Extending an englacial conduit-collapse hypothesis through time for a glacier experiencing sustained surface lowering, surface depressions will largely follow relict englacial conduits (Kirkbride, 1993; Immerzeel et al., 2014). As the debris surface becomes hummocky with disconnected surface drainage basins (Benn et al., 2017), supraglacial flowpaths will converge to these relict englacial paths. In the case of Lirung, which has no terminus flow impediment to maintain an elevated hydraulic base level, the evolution of such depressions is expressed through the surface-subsurface exchange of water to link collapsed conduit depressions via relict segments. Thus, drainage routes can bypass the confining surface elements, defining a flowpath that follows former englacial pathways. Assuming englacial outlets for closed surface depressions, we infer the position of englacial conduits to connect these depressions to adjacent basins, also making use of the exposed conduit segments observed in the hydrological survey (Figure 11).
Based on the evidence of surface-subsurface connectivity at ponds and the convergence of supraglacial and englacial drainage networks, we can integrate our observations with conduit-formation mechanisms identified by other studies to generate a conceptual model of Lirung Glacier's combined surface and near-surface drainage network. The uppermost region of Lirung Glacier's tongue is now reconstituted from avalanched ice and inherits no internal permeability from the headwall. Water routed onto the surface here, or melted locally due to the thin debris, is likely intercepted by a series of crevasses (Figure 11), which open due to the complex stress regime of competing avalanche cones (Ragettli et al., 2015). These crevasses (photograph in Supplementary Material) provide permeability for the glacier; while open, the water they collect may hydrofracture to form an initial englacial drainage system, and when closed they provide secondary permeability for subsequent exploitation (Gulley et al., 2009b). Down-glacier of the crevassed region, the debris-mantled surface is characterized by large, deep depressions (Figure 11). With limited inherited englacial permeability, these depressions collect large quantities of water before draining, either englacially by exploiting the crevasse-related secondary permeability (Gulley et al., 2009b) or superficially by spilling over to incise a cut-and-closure channel (Gulley et al., 2009a). Modeling by Jarosch and Gudmundsson (2012) suggests that channel incision and roof closure can happen rapidly in time and space; this process may still be active in the upper parts of the glacier. Further downglacier, in our primary study area, ponds are generally confined by ice cliffs (Table 3). This area inherits internal permeability from the englacial conduits that have been advected downglacier. Glacier thinning has led to intersection of the glacier surface with englacial conduits, which then fragment the surface into closed drainage basins (Benn et al., 2017). Ponds form at these intersections as an intermittent expression of reduced drainage, capturing water routed into the local depression and absorbing atmospheric and radiative energy on a seasonal basis, which can be delivered englacially if drainage efficiency increases (Miles et al., 2016).
The two major flowpaths identified in Figure 11 have very different characteristics, highlighting the variable role of water supply and routing to modify this system. Flowpath D1 is characterized by a series of ponds deep within depressions intersecting the shallow englacial network and impeding water at the surface. Drainage for these ponds is predominantly englacial. This flowpath captures the majority of supraglacial and near-surface englacial discharge, leading to enhanced englacial ablation and promoting the formation of further depressions downglacier. Flowpath D2 is instead characterized by a single large depression upglacier and a very small pond downglacier, which, unlike the ponds along D1, is not located in a depression. Although it may once have collected surface melt and runoff from the western accumulation area, it is now cut off from that supply and has a much smaller catchment area than D1. This path may follow a relict conduit, but due to the lower water supply, little water is rerouted to the surface; the supraglacial and englacial systems are isolated, similar to the submarginal conduits inferred at Ngozumpa Glacier (Thompson et al., 2016). As noted by Benn et al. (2017), such relict conduits are sporadically reactivated due to the development of flow impediments. Thus, the pronounced changes and opening of an englacial conduit at pond D in 2014 may be the reactivation of part of D2's englacial conduit due to the drainage of pond J, and a secondary consequence of the interaction between ponds C and J.
5. Conclusions
Making use of field surveys, pressure transducer records and high-resolution orthoimages and DEMs, we have documented the dynamics of several supraglacial ponds at Lirung Glacier in 2013-2014. The data are synthesized to examine pond-proximal processes and the role of ponds in the supraglacial and englacial hydrological system. The primary conclusion of our analysis is that supraglacial ponds provide a continuous but inefficient interface between the supraglacial and englacial drainage networks for this thinning debris-covered glacier.
Total ponded area and the areas of individual ponds are higher in the pre-monsoon than post-monsoon, in agreement with other studies (Watson et al., 2016; Miles et al., 2017b; Narama et al., 2017). Melt-season increases in drainage efficiency lead to a gradual reduction in ponded area and produce the observed seasonality of pond cover. Within the general pattern of seasonal drainage, differences in pond-proximal processes and the balance of inflows and outflows lead to distinct patterns of filling, stability, and drainage for the four ponds that we have analysed in detail. In all cases, ponds drained englacially and relatively slowly. This, and the seasonal refilling of surface depressions observed at two ponds shows the importance of conduit blockage processes operating over seasonal timescales (Gulley et al., 2009b). Analysis of water level records shows that year-on-year water level lowering is common for ponds that persist multiple years, due to the combination of subaqueous ablation and partial drainage events. Episodic precipitation, debris capture, and structural changes interrupt the seasonal rise and fall of water level associated with flooding and drainage, but diurnal fluctuations and post-rainfall water level declines indicate continuous inefficient pond discharge, in agreement with Miles et al. (2016). Our analysis additionally indicates that ponds are partially fed by water from beyond the local catchment, suggesting an englacial transport route for both inflows and outflows.
An hypothesis of surface-subsurface connectivity across the glacier is further supported by our hydrological survey and DEM-based catchment and drainage network analysis. The field survey revealed discontinuous segments of surface and sub-debris discharge and also documented the exposure of relict englacial conduits adjacent to many ponds, while a DEM-based drainage analysis identified closed surface depressions across the glacier surface. Catchments for such depressions rarely exceed 10,000 m2 in area, but surface discharge and evidence of recent ponding were observed even in the very small catchments. Observed water flow generally aligned with the modeled flowpaths, but the exceptions highlight likely englacial transport pathways. Our documentation of the interaction between certain ponds in 2013 and 2014 provides further evidence of distal transport of water through a combined surface and englacial route. The close association of ponds and exposed relict englacial conduits further strengthens the hypothesis of conduit-collapse as a formation mechanism for surface depressions (Kirkbride, 1993; Sakai et al., 2000; Benn et al., 2012) and supports the notion that englacial conduits are the dominant drainage route for supraglacial ponds (Gulley et al., 2009b; Mertes et al., 2016). Such perched ponds can experience repeated seasonal filling and drainage, representing temporally-varying efficiency of discharge into conduits. For Lirung Glacier, such conduits may form by diverse mechanisms in the upper debris-covered tongue. This permeability is inherited and exploited downglacier as surface drainage pathways converge on englacial portals. Consequently, the ponds of Lirung Glacier act as the bottlenecks of a co-evolving supraglacial and englacial drainage network which exhibits widespread surface-subsurface exchange of water.
Author Contributions
EM designed the study, collected and processed most data, and wrote the paper. JS conducted data collection and processing, and contributed to the interpretation and manuscript writing. IW planned and conducted data collection and contributed to the interpretation and manuscript writing. PB conducted data collection and contributed to the interpretation and manuscript writing. WI provided UAV data and contributed to the manuscript writing. AC conducted data collection. FP coordinated the study and supported interpretation and manuscript writing.
Conflict of Interest Statement
The authors declare that the research was conducted in the absence of any commercial or financial relationships that could be construed as a potential conflict of interest.
The reviewer TH and handling Editor declared their shared affiliation, and the handling Editor states that the process nevertheless met the standards of a fair and objective review.
Acknowledgments
We are grateful to the Associate Editor Alun Hubbard and to three reviewers, whose constructive comments have greatly improved the manuscript. We would like to thank Tek Rai and his staff for logistical support in Nepal, as well as Babu Govindha Raj K, Joe Shea, Patrick Wagnon, Silvan Ragettli, Philip Kraaijenbrink, Martin Heynen, Simon Wicki, Lene Petersen, Allen Pope, Peter Hill, and Ibai Rico for field help and constructive discussions. The research was enabled by a strong collaboration with ICIMOD, including provision of the Kyanjing AWS barometric pressure data. E Miles was supported by PhD studentship funding from the Gates Cambridge Trust. Fieldwork was financially supported by the USAID (United States Agency for International Development), the High Mountain Glacier Watershed Programs Climber- Scientist Grant (CCRDCS0010), Swiss National Science Foundation project UNCOMUN (SNF 200021L146761), Trinity College and St. Catharine's College (Cambridge), the B.B. Roberts Fund and the Philip Lake and William Vaughn Lewis Fund. This work is part of the research programme VIDI with project number 016.161.308, which is (partly) financed by the Netherlands Organization for Scientific Research (NWO).
Supplementary Material
The Supplementary Material for this article can be found online at: https://www.frontiersin.org/article/10.3389/feart.2017.00069/full#supplementary-material
References
Benn, D., Bolch, T., Hands, K., Gulley, J., Luckman, A., Nicholson, L., et al. (2012). Response of debris-covered glaciers in the Mount Everest region to recent warming, and implications for outburst flood hazards. Earth Sci. Rev. 114, 156–174. doi: 10.1016/j.earscirev.2012.03.008
Benn, D., Gulley, J., Luckman, A., Adamek, A., and Glowacki, P. S. (2009). Englacial drainage systems formed by hydrologically driven crevasse propagation. J. Glaciol. 55, 513–523. doi: 10.3189/002214309788816669
Benn, D. I., Thompson, S., Gulley, J., Mertes, J., Luckman, A., and Nicholson, L. (2017). Structure and evolution of the drainage system of a Himalayan debris- covered glacier, and its relationship with patterns of mass loss. Cryosphere Discuss. 1–43. doi: 10.5194/tc-2017-29
Benn, D. I., Wiseman, S., and Hands, K. A. (2001). Growth and drainage of supraglacial lakes on debris-mantled Ngozumpa Glacier, Khumbu Himal, Nepal. J. Glaciol. 47, 626–638. doi: 10.3189/172756501781831729
Bolch, T., Kulkarni, A., Kaab, A., Huggel, C., Paul, F., Cogley, J. G., et al. (2012). The state and fate of himalayan glaciers. Science 306, 310–314. doi: 10.1126/science.1215828
Boon, S., and Sharp, M. (2003). The role of hydrologically-driven ice fracture in drainage system evolution on an Arctic glacier. Geophys. Res. Lett. 30, 3–6. doi: 10.1029/2003GL018034
Brun, F. (2015). Monitoring Supra-Glacial Ice-Cliffs Over Debris-Covered Glaciers Using High Resolution Ground Measurements. Master's thesis, Université Joseph Fourier, Grenoble, France
Brun, F., Buri, P., Miles, E. S., Wagnon, P., Steiner, J. F., Berthier, E., et al. (2016). Quantifying volume loss from ice cliffs on debris-covered glaciers using high resolution terrestrial and aerial photogrammetry. J. Glaciol. 62, 684–695. doi: 10.1017/jog.2016.54
Buri, P., Miles, E. S., Steiner, J. F., Immerzeel, W., Wagnon, P., Pellicciotti, F., et al. (2016). A physically-based 3D model of ice cliff evolution on a debris-covered glacier. J. Geophys. Res. Earth Surface 121, 2471–2493. doi: 10.1002/2016JF004039
Chu, V. W. (2014). Greenland ice sheet hydrology: a review. Progr. Physi. Geogr. 38, 19–54. doi: 10.1177/0309133313507075
Collier, E., Nicholson, L. I., Brock, B. W., Maussion, F., Essery, R., and Bush, A. B. G. (2014). Representing moisture fluxes and phase changes in glacier debris cover using a reservoir approach. Cryosphere 8, 1429–1444. doi: 10.5194/tc-8-1429-2014
Das, S. B., Joughin, I., Behn, M. D., Howat, I. M., King, M. A., Lizarralde, D., et al. (2008). Fracture propagation to the base of the greenland ice sheet during supraglacial Lake Drainage. Science 1, 778–781. doi: 10.1017/CBO9781107415324.004
Fountain, A. G. and Walder, J. S. (1998). Water flow through temperate glaciers. Rev. Geophys. 36:299. doi: 10.1029/97RG03579
Fyffe, C. L., Brock, B. W., Kirkbride, M. P., Mair, D. W. F., Arnold, N. S., Smiraglia, C., et al. (2015). An investigation of the influence of supraglacial debris on glacier-hydrology. Cryosphere Discuss. 9, 5373–5411. doi: 10.5194/tcd-9-5373-2015
Gulley, J. (2009). Structural control of englacial conduits in the temperate Matanuska Glacier, Alaska, USA. J. Glaciol. 55, 681–690. doi: 10.3189/002214309789470860
Gulley, J., and Benn, D. (2007). Structural control of englacial drainage systems in Himalayan debris-covered glaciers. J. Glaciol. 53, 399–412. doi: 10.3189/002214307783258378
Gulley, J. D., Benn, D. I., Müller, D., and Luckman, A. (2009a). A cut-and-closure origin for englacial conduits in uncrevassed regions of polythermal glaciers. J. Glaciol. 55, 66–80. doi: 10.3189/002214309788608930
Gulley, J. D., Benn, D. I., Screaton, E., and Martin, J. (2009b). Mechanisms of englacial conduit formation and their implications for subglacial recharge. Quater. Sci. Rev. 28, 1984–1999. doi: 10.1016/j.quascirev.2009.04.002
Hasnain, S. I., Jose, P. G., Ahmad, S., and Negi, D. C. (2001). Character of the subglacial drainage system in the ablation area of Dokriani glacier, India, as revealed by dye-tracer studies. J. Hydrol. 248, 216–223. doi: 10.1016/S0022-1694(01)00404-8
Horodyskyj, U. (2017). Thermal and physical investigations into lake deepening processes on Spillway Lake, Ngozumpa Glacier, Nepal. Water 9:362. doi: 10.3390/w9050362
Immerzeel, W., Kraaijenbrink, P., Shea, J., Shrestha, A., Pellicciotti, F., Bierkens, M., et al. (2014). High-resolution monitoring of Himalayan glacier dynamics using unmanned aerial vehicles. Remote Sens. Environ. 150, 93–103. doi: 10.1016/j.rse.2014.04.025
Immerzeel, W. W., and Bierkens, M. F. P. (2012). Asia's water balance. Nat. Geosci. 5, 841–842. doi: 10.1038/ngeo1643
Irvine-Fynn, T. D. L., Hodson, A. J., Moorman, B. J., Vatne, G., and Hubbard, A. L. (2011). Polythermal glacier hydrology: a review. Rev. Geophys. 49, 1–37. doi: 10.1029/2010RG000350
Iwata, S., Watanabe, O., and Fushimi, H. (1980). Surface morphology in the ablation area of the Khumbu glacier. J. Jpn. Soc. Snow Ice 41, 9–17.
Jarosch, A. H. and Gudmundsson, M. T. (2012). A numerical model for meltwater channel evolution in glaciers. Cryosphere 6, 493–503. doi: 10.5194/tc-6-493-2012
Kirkbride, M. P. (1993). The temporal significance of transitions from melting to calving termini at glaciers in the central Southern Alps of New Zealand. Holocene 3, 232–240. doi: 10.1177/095968369300300305
Kraaijenbrink, P., Meijer, S. W., Shea, J. M., Pellicciotti, F., Jong, S. M. D. E., and Immerzeel, W. W. (2016a). Seasonal surface velocities of a Himalayan glacier derived by automated correlation of unmanned aerial vehicle imagery. Ann. Glaciol. 57, 103–113. doi: 10.3189/2016AoG71A072
Kraaijenbrink, P. D. A., Shea, J. M., Pellicciotti, F., Jong, S. M. D., and Immerzeel, W. W. (2016b). Object-based analysis of unmanned aerial vehicle imagery to map and characterise surface features on a debris-covered glacier. Remote Sens. Environ. 186, 581–595. doi: 10.1016/j.rse.2016.09.013
McCarthy, M., Pritchard, H., Willis, I., and King, E. (2017). Ground-penetrating radar measurements of debris thickness on Lirung Glacier, Nepal. J. Glaciol. 63, 1–13. doi: 10.1017/jog.2017.18
Mertes, J. R., Thompson, S. S., Booth, A. D., Gulley, J. D., and Benn, D. I. (2016). A conceptual model of supra-glacial lake formation on debris-covered glaciers based on GPR facies analysis. Earth Surface Process. Landforms 42, 903–914. doi: 10.1002/esp.4068
Miles, E., Steiner, J., Brun, F., Buri, P., Pellicciotti, F., Rico, I., et al. (2017a). Micrometeorology and Surface Topography of Debris-Covered Lirung Glacier, Nepal, October-November 2014. Mendeley Data, Version 1. doi: 10.17632/m2g3mg4364.1
Miles, E. S., Pellicciotti, F., Willis, I. C., Steiner, J. F., Buri, P., and Arnold, N. S. (2016). Refined energy-balance modelling of a supraglacial pond, Langtang Khola, Nepal. Anna. Glaciol. 57, 29–40. doi: 10.3189/2016AoG71A421
Miles, E., Willis, I. C., Arnold, N. S., Steiner, J. F., and Pellicciotti, F. (2017b). Spatial, seasonal, and interannual variability of supraglacial ponds in the Langtang Valley of Nepal, 1999 to 2013. J. Glaciol. 63, 88–105. doi: 10.1017/jog.2016.120
Narama, C., Daiyrov, M., Tadono, T., Yamamoto, M., Kääb, A., Morita, R., et al. (2017). Seasonal drainage of supraglacial lakes on debris-covered glaciers in the Tien Shan Mountains, Central Asia. Geomorphology 286, 133–142. doi: 10.1016/j.geomorph.2017.03.002
Nienow, P., Sharp, M., and Willis, I. (1998). Seasonal changes in the morphology of the subglacial drainage system, Haut Glacier d'Arolla, Switzerland. Earth Surface Proces. Landf. 23, 825–843. doi: 10.1002/(SICI)(1096-(9837(199809)23:9<825::AID-ESP893>3.0.CO;2-2
Nuimura, T., Fujita, K., and Sakai, A. (2017). Downwasting of the debris-covered area of Lirung Glacier in Langtang Valley, Nepal Himalaya, from 1974 to 2010. Quater. Int. 1–9. doi: 10.1016/j.quaint.2017.06.066
Nuth, C. and Kaab, A. (2011). Co-registration and bias corrections of satellite elevation data sets for quantifying glacier thickness change. Cryosphere 5, 271–290. doi: 10.5194/tc-5-271-2011
Pottakkal, J. G., Ramanathan, A., Singh, V. B., Sharma, P., Azam, M. F., and Linda, A. (2014). Characterization of subglacial pathways draining two tributary meltwater streams through the lower ablation zone of Gangotri glacier system, Garhwal Himalaya, India. Curr. Sci. 107, 613–621
Pritchard, H. D. (2017). Asia's glaciers are a regionally important buffer against drought. Nature 545, 169–174. doi: 10.1038/nature22062
Ragettli, S., Bolch, T., and Pellicciotti, F. (2016a). Heterogeneous glacier thinning patterns over the last 40 years in Langtang Himal. Cryosphere 10, 2075–2097. doi: 10.5194/tc-2016-25
Ragettli, S., Immerzeel, W. W., and Pellicciotti, F. (2016b). Contrasting climate change impact on river flows from high-altitude catchments in the Himalayan and Andes Mountains. Proc. Natl. Acad. Sci. U.S.A. 113, 9222–9227. doi: 10.1073/pnas.1606526113
Ragettli, S., Pellicciotti, F., Immerzeel, W. W., Miles, E. S., Petersen, L., Heynen, M., et al. (2015). Unraveling the hydrology of a Himalayan catchment through integration of high resolution in situ data and remote sensing with an advanced simulation model. Adv. Water Resour. 78, 94–111. doi: 10.1016/j.advwatres.2015.01.013
Raymond, C. F. C., and Nolan, M. (2000). “Drainage of a glacial lake through an ice spillway,” in Debris-Covered Glaciers, Proceedings of a Workshop held at the University of Washington (Seattle, WA), 199–210. IAHS Publ. no. 264.
Reznichenko, N., Davies, T., Shulmeister, J., and McSaveney, M. (2010). Effects of debris on ice-surface melting rates: an experimental study. J. Glaciol. 56, 384–394. doi: 10.3189/002214310792447725
Röhl, K. (2008). Characteristics and evolution of supraglacial ponds on debris-covered Tasman Glacier, New Zealand. J. Glaciol. 54, 867–880. doi: 10.3189/002214308787779861
Rounce, D. R., Byers, A. C., Byers, E. A., and McKinney, D. C. (2017). Brief communications: observations of a glacier outburst flood from Lhotse Glacier, Everest Area, Nepal. Cryosphere 11, 443–449. doi: 10.5194/tc-11-443-2017
Sakai, A., Takeuchi, N., Fujita, K., and Nakawo, M. (2000). “Role of supraglacial ponds in the ablation process of a debris-covered glacier in the Nepal Himalayas,” in Debris-Covered Glaciers, Proceedings of a Workshop held at the University of Washington (Seattle, WA), 119–130. IAHS Publ. no. 264.
Sasaki, O., Noguchi, O., Zhang, Y., Hirabayashi, Y., and Kanae, S. (2016). A global high-resolution map of debris on glaciers derived from multi-temporal ASTER images. Cryosphere Discuss. 1–24. doi: 10.5194/tc-2016-222
Seibert, J., and Mcglynn, B. L. (2007). A new triangular multiple flow direction algorithm for computing upslope areas from gridded digital elevation models. Water Resour. Res. 43, 1–8. doi: 10.1029/2006WR005128
Takeuchi, N., Sakai, A., Shiro, K., Fujita, K., and Masayoshi, N. (2012). Variation in suspended sediment concentration of supraglacial Lakes on Debris-covered area of the lirung glacier in the Nepal Himalayas. Global Environ. Res. 16, 95–104.
Thompson, S., Benn, D. I., Mertes, J., and Luckman, A. (2016). Stagnation and mass loss on a Himalayan debris-covered glacier: processes, patterns and rates. J. Glaciol. 62, 467–485. doi: 10.1017/jog.2016.37
Watson, C., Quincey, D., Carrivick, J., and Smith, M. (2016). The dynamics of supraglacial ponds in the Everest region, central Himalaya. Glob. Planet. Change 142, 14–27. doi: 10.1016/j.gloplacha.2016.04.008
Wessels, R. L., Kargel, J. S., and Kieffer, H. H. (2002). ASTER measurement of supraglacial lakes in the Mount Everest region of the Himalaya. Anna. Glaciol. 34, 399–408. doi: 10.3189/172756402781817545
Keywords: surface ponds, high mountain asia, debris-covered glaciers, surface energy balance, glacier hydrology
Citation: Miles ES, Steiner J, Willis I, Buri P, Immerzeel WW, Chesnokova A and Pellicciotti F (2017) Pond Dynamics and Supraglacial-Englacial Connectivity on Debris-Covered Lirung Glacier, Nepal. Front. Earth Sci. 5:69. doi: 10.3389/feart.2017.00069
Received: 18 April 2017; Accepted: 17 August 2017;
Published: 21 September 2017.
Edited by:
Alun Hubbard, University of Tromsø, NorwayReviewed by:
Lindsey Isobel Nicholson, University of Innsbruck, AustriaChristine F. Dow, University of Waterloo, Canada
Tom Holt, Aberystwyth University, United Kingdom
Copyright © 2017 Miles, Steiner, Willis, Buri, Immerzeel, Chesnokova and Pellicciotti. This is an open-access article distributed under the terms of the Creative Commons Attribution License (CC BY). The use, distribution or reproduction in other forums is permitted, provided the original author(s) or licensor are credited and that the original publication in this journal is cited, in accordance with accepted academic practice. No use, distribution or reproduction is permitted which does not comply with these terms.
*Correspondence: Evan S. Miles, e.s.miles@leeds.ac.uk