Comparison of the RF-CL and CACS-CL models to estimate the pretest probability of obstructive coronary artery disease and predict prognosis in patients with stable chest pain and diabetes mellitus
 Tao Chen1,† Dujing Shao2,† Jia Zhao1,† Mingwen Xiu1 Yaoshuang Li2 Miao He1 Yahang Tan3,4 Yanchun An1 Xiangchen Zhang5 Jia Zhao2*
  Jia Zhou2*
- 1Department of Emergency, Hebei Petrochina Central Hospital, Langfang, Hebei, China
- 2Department of Cardiology, Tianjin Chest Hospital, Tianjin, China
- 3Department of Cardiology, Beijing Chaoyang Hospital, Capital Medical University, Beijing, China
- 4Heart Center and Beijing Key Laboratory of Hypertension, Beijing Chaoyang Hospital, Capital Medical University, Beijing, China
- 5Department of Radiology, Hebei Petrochina Central Hospital, Langfang, Hebei, China
Background: The most appropriate tool for estimating the pretest probability (PTP) of obstructive coronary artery disease (CAD) in patients with diabetes mellitus (DM) and stable chest pain (SCP) remains unknown. Therefore, we aimed to validate and compare two recent models, namely, the risk factor-weighted clinical likelihood (RF-CL) model and coronary artery calcium score (CACS)-weighted clinical likelihood (CACS-CL) model, in these patient populations.
Methods: A total of 1,245 symptomatic patients with DM, who underwent CACS and coronary computed tomographic angiography (CCTA) scan, were identified and followed up. PTP of obstructive CAD for each patient was estimated using the RF-CL model and CACS-CL model, respectively. Area under the receiver operating characteristic curve (AUC), net reclassification improvement (NRI), and integrated discrimination improvement (IDI) were used to assess the performance of models. The associations of major adverse cardiovascular events (MACE) with risk groups were evaluated using Cox proportional hazards regression.
Results: Compared with the RF-CL model, the CACS-CL model revealed a larger AUC (0.856 vs. 0.782, p = 0.0016), positive IDI (12%, p < 0.0001) and NRI (34%, p < 0.0001), stronger association to MACE (hazard ratio: 0.26 vs. 0.38) and less discrepancy between observed and predicted probabilities, resulting in a more effective risk assessment to optimize downstream clinical management.
Conclusion: Among patients with DM and SCP, the incorporation of CACS into the CACS-CL model resulted in a more accurate estimation for PTP and prediction of MACE. Utilizing the CACS-CL model, instead of the RF-CL model, might have greater potential to avoid unnecessary and omissive cardiovascular imaging testing with minimal cost.
Background
The number of patients with diabetes mellitus (DM) is expected to increase to 700 million by 2045 worldwide (1). The growing worldwide burden of impaired glucose metabolism coupled, with the high rates of coronary artery disease (CAD) morbidity and mortality among affected individuals, represents an important priority for patients and health systems (2, 3). Although DM was previously considered a CAD equivalent, the average cardiovascular risk in symptomatic individuals with DM varies significantly depending on other risk factors (4, 5). This heterogeneity in patients with stable chest pain (SCP) and DM poses a unique challenge for clinicians tasked with effective risk assessment and selection of appropriate cardiovascular imaging testing (CIT) from an ever-growing list of options, such as coronary computed tomographic angiography (CCTA).
In contrast to the “screen all” strategy, which was not supported by contemporary evidence (6, 7), the 2023 European Society of Cardiology (ESC) guidelines for the management of cardiovascular disease in patients with DM (2) proposed an estimation for pretest probability (PTP) of CAD based on the 2019 ESC guidelines on chronic coronary syndromes (CCS) (8). Our previous study based on data from the CCTA Improves Clinical Management of Stable Chest Pain (CICM-SCP) registry has demonstrated that the application of the risk factor-weighted clinical likelihood (RF-CL) model was associated with improved efficiency in identifying individuals who may derive maximum benefit from further CIT in patients with DM and SCP (9).
In addition to the RF-CL model, another coronary artery calcium score (CACS)-based model was also developed for the estimation of PTP, and several external validations in general SCP patients overwhelmingly supported the CACS-weighted clinical likelihood (CACS-CL) model (10–13). Notably, both the RF-CL and CACS-CL models were recommended by the newest guideline for the evaluation and diagnosis of SCP (14). However, to date, no comparative analysis has been conducted to systematically evaluate the RF-CL and CACS-CL models in DM patients with SCP, for whom the appropriate decision-making of CIT is important but difficult (1).
Thus, we aim to validate and compare the two proposed models in a CCTA-based cohort comprised of DM patients presenting with SCP and investigate whether the addition of CACS would improve the effectiveness of risk assessment to optimize downstream clinical management.
Methods
Study cohort
Briefly, the CICM-SCP registry is a prospective and ongoing cohort of patients who were referred to CCTA as first-line imaging testing for the assessment of SCP suspected of CCS (ClinicalTrials.gov Identifier: NCT04691037). Details about the registry have been previously described (11, 12, 15–18) and are further provided in the Supplementary Material. As illustrated in Figure 1, during a period of 36 months between August 2016 and August 2019, 12,584 patients with scans of both CACS and CCTA were initially enrolled, and 9,576 patients were screened for DM. The patients were considered as suffering from DM if one of the following was met: treatment with insulin or hypoglycemic medications, fasting blood glucose ≥7.0 mmol/L or a 2 h plasma glucose level on their oral glucose tolerance test ≥11.1 mmol/L, or a glycated hemoglobin value ≥6.5%. Finally, 1,245 patients with DM and SCP were included in the present analysis. The present study was conducted in accordance with the Declaration of Helsinki and approved by the ethics committees of local institutions.
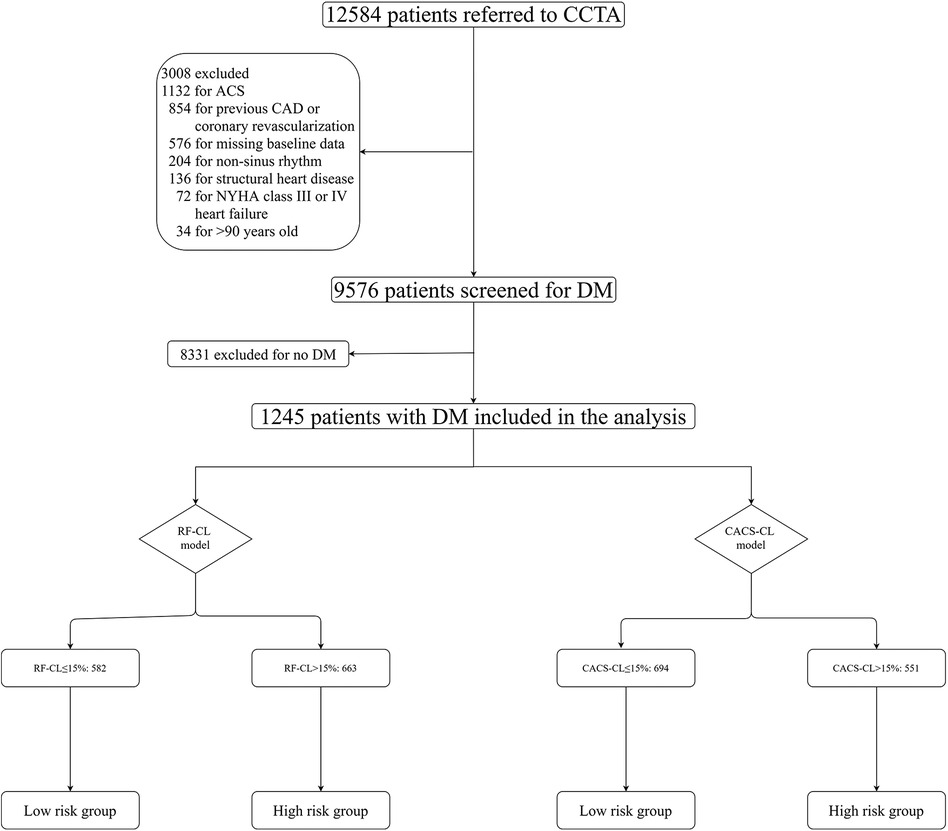
Figure 1. Flowchart. CCTA, coronary computed tomographic angiography; RF-CL, risk factor-weighted clinical likelihood; CACS-CL, coronary artery calcium score-weighted clinical likelihood; CAD, coronary artery disease; ACS, acute coronary syndrome.
Collection and definitions of baseline characteristics
Except for DM, baseline clinical data including age, sex, hypertension, hyperlipidemia, smoking, family history of CAD, and type of SCP were prospectively collected and defined as described previously in the CICM-SCP registry (11, 12, 15–18). The procedure and interpretation details of CACS and CCTA have been previously described (11, 15, 17). These details are also provided in the Supplementary Material. Obstructive CAD was defined as present if a patient had at least one lesion with ≥50% diameter stenosis or any unassessable segments because of severe calcification on CCTA.
PTP models
The RF-CL model (age, sex, type of SCP, DM, hypertension, hyperlipidemia, family history, and smoking) and CACS-CL model (age, sex, type of SCP, DM, hypertension, hyperlipidemia, family history, smoking, and CACS) were used to estimate the PTP of obstructive CAD as previously reported, and the R packages are available at https://github.com/CardioLab/cadptp/tree/master/R (10). According to the current guidelines (8, 14) and our previous works (11, 19), CIT should be deferred for a low-risk patient, and the impact of PTP on outcome was tested by classifying patients into different risk groups. The details of the risk groups are illustrated in Figure 1, and according to the RF-CL and CACS-CL models, patients with PTP ≤ 15% were divided into the low-risk group, and patients with PTP > 15% were divided into the high-risk group.
Follow-up and clinical outcomes
The details about the follow-up have been described previously in the CICM-SCP registry (11, 12, 15–18) and are also provided in the Supplementary Material. After CCTA, all patients were followed until March 2023. The primary endpoint was a major adverse cardiovascular event (MACE), which was defined as a composite of cardiac death and non-fatal myocardial infarction (MI). Cardiac death was defined as any death caused by cardiac disease or for which no other cause could be found. MI was defined as described in the Fourth Universal Definition of Myocardial Infarction (20). The secondary endpoint included ICA utilization and referral to revascularization. For a patient undergoing repeat invasive procedures, we mainly focused on the first utilization of invasive procedures (21–23).
Statistical analyses
All statistical analyses were performed by R (version 4.0.3; R Foundation for Statistical Computing) or MedCalc (version 15.2.2; MedCalc Software). Two-tailed p < 0.05 was considered statistically significant. The continuous variables were expressed as mean ± SD. Student’s t-test was used to compare normally distributed continuous data, and the Mann–Whitney U-test was used to compare non-normally distributed continuous data. The categorical variables were expressed as frequencies with percentages, and the differences in percentages were compared using the χ2 test or Fisher exact test as appropriate. The discrimination and calibration of the PTP models were assessed using the area under the receiver operating characteristic curve (AUC) and Hosmer–Lemeshow goodness-of-fit statistic (H–L χ2) according to the Transparent Reporting of a Multivariable Prediction Model for Individual Prognosis or Diagnosis (TRIPOD) statement (24). Net reclassification improvement (NRI) assessed in a reclassification table was used to determine how a PTP model-based risk assessment strategy reclassified patients into various risk groups compared with others (25). According to the reclassification table, the number needed to test was defined as the number of patients needed to be tested with the CACS-CL model to reclassify one patient from one risk group to another (26). Due to the absence of controls in the present study, the NNT was calculated as the inverse function of the difference between the correct and false reclassification rates. The Kaplan–Meier curves were generated for cumulative event-free estimates of survival from MACE and were compared by a log-rank test. The Cox proportional hazards regression models were used to calculate hazard ratios (HRs) and 95% confidence intervals (CIs), which assessed the association of risk groups to the time to the first concerned study endpoint (or censoring). For a more intuitive understanding of the clinical significance, HRs with 95% CIs were illustrated in forest plots.
Results
Baseline characteristics of patients
The baseline characteristics of the study population grouped by the presence of obstructive CAD are listed in Table 1. The study cohort consisted of 1,245 DM patients, of whom 44% (548/1,245) were found to have obstructive CAD on CCTA. According to the RF-CL and CACS-CL models, the average PTP was 23% and 17%, respectively. All baseline characteristics, including CACS, were significantly associated with the presence of obstructive CAD. As shown in Figure 1, of the 1,245 patients, 47% (582/1,245) and 56% (694/1,245) were assigned to the low-risk group according to the RF-CL and CACS-CL models, respectively. Table 2 shows the distribution of clinical characteristics by risk groups based on different models. There were statistically significant differences in most baseline characteristics between the two risk groups determined by the RF-CL and CACS-CL models, respectively.
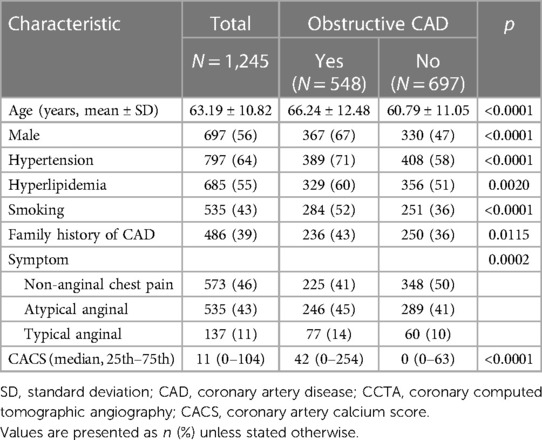
Table 1. Baseline characteristics by presence of obstructive CAD on CCTA.
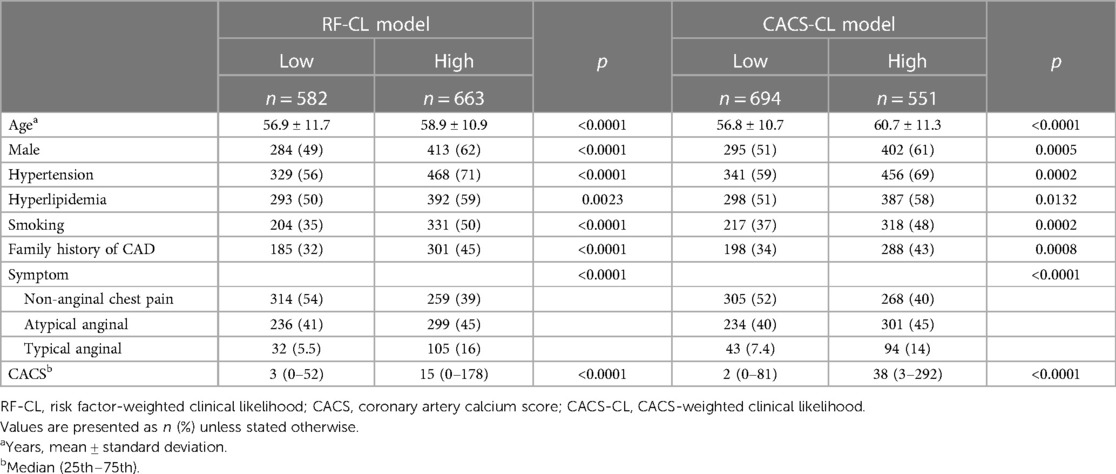
Table 2. Characteristics by risk groups based on different models.
Comparison of the RF-Cl and CACS-CL models
A comparison of discrimination for the RF-CL and CACS-CL models using AUC and IDI is presented in Table 3. The AUC for the CACS-CL model was significantly larger than that for the RF-CL model (0.856 vs. 0.782, p = 0.0016, Figure 2). Compared with the RF-CL model, the CACS-CL model demonstrated a positive IDI (12%, p < 0.0001). Figure 3 illustrates the comparison of predicted and observed probabilities of obstructive CAD by deciles of PTP. Graphically, the RF-CL model (left) underestimated the probability of obstructive CAD in patients with medium PTP, with predicted values lower than those observed but overestimated the probability of obstructive CAD in patients with high PTP, with predicted values higher than those observed. As a result, the calibration of the RF-CL model was poor (H–L χ2 = 138.52, p < 0.0001), but the CACS-CL model demonstrated less discordance (H–L χ2 = 36.90, p < 0.0001).
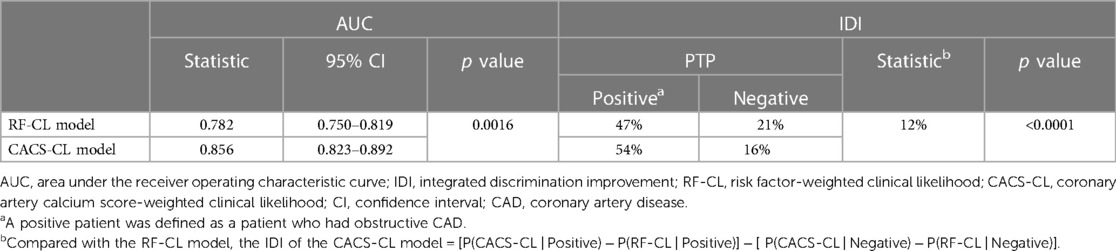
Table 3. Discriminations of the RF-CL and CACS-CL models.
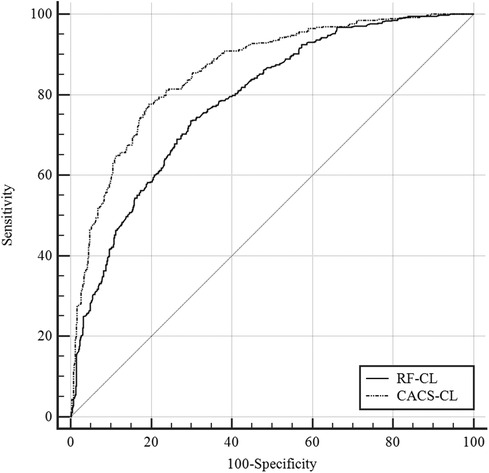
Figure 2. Comparison of the RF-CL and CACS-CL models by the receiver operating characteristic curves. RF-CL, risk factor-weighted clinical likelihood; CACS-CL, coronary artery calcium score-weighted clinical likelihood.
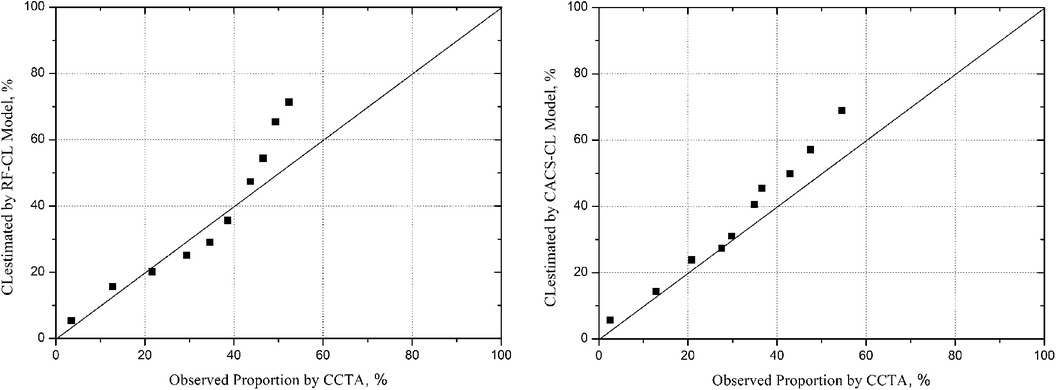
Figure 3. Model-specific PTP and observed probability by deciles of PTP. PTP, pretest probability; CCTA, coronary computed tomographic angiography; RF-CL, risk factor-weighted clinical likelihood; CACS-CL, coronary artery calcium score-weighted clinical likelihood.
Follow-up for study endpoints
The patients were followed up for a median of 59 (interquartile range, 50–68) months. During the follow-up, 98 (8%) patients were lost, and 127 (10%) patients experienced MACE: 34 patients died from cardiac cause, and 93 patients suffered from non-fatal MI. Figure 4 illustrates the Kaplan–Meier estimates of patients surviving free from MACE. The high-risk group according to the RF-CL and CACS-CL models had a significantly higher risk of MACE, respectively (p for log-rank test, <0.0001 for the RF-CL model and <0.0001 for the CACS-CL model), but as shown in Figure 5, the association of the CACS-CL model-determined risk groups (low vs. high) with MACE was stronger than that of the RF-CL model (HR for the RF-CL model, 0.38, 95% CI: 0.23–0.59; HR for the CACS-CL model, 0.26, 95% CI: 0.12–0.43). In addition, compared with the high-risk group, the low-risk group was associated with a statistically significant reduction in utilization of invasive procedures during follow-up, according to the RF-CL model (HR for ICA, 0.42, 95% CI: 0.29–0.61; HR for revascularization, 0.32, 95% CI: 0.19–0.54) and CACS-CL model (HR for ICA, 0.28, 95% CI: 0.15–0.36; HR for revascularization, 0.19, 95% CI: 0.08–0.33), respectively (Figure 5).
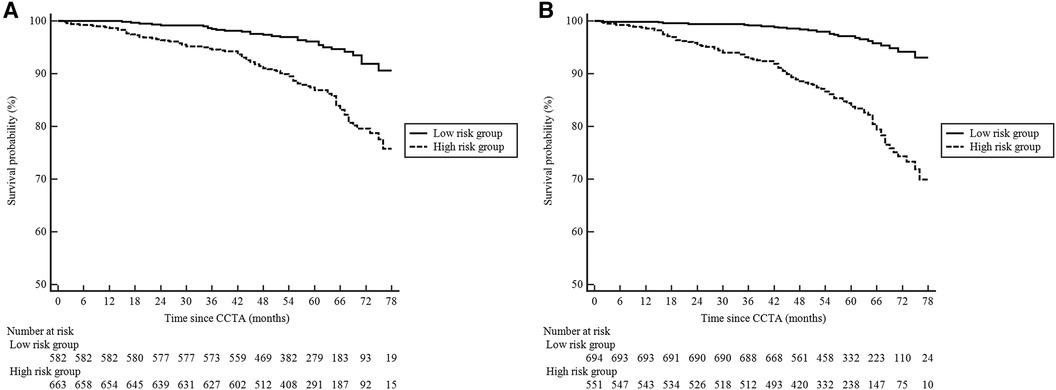
Figure 4. Kaplan–Meier curves comparing the high- and low-risk groups determined by the two models. (A) RF-CL model; (B) CACS-CL model. CCTA, coronary computed tomographic angiography; RF-CL, risk factor-weighted clinical likelihood; CACS-CL, coronary artery calcium score-weighted clinical likelihood.
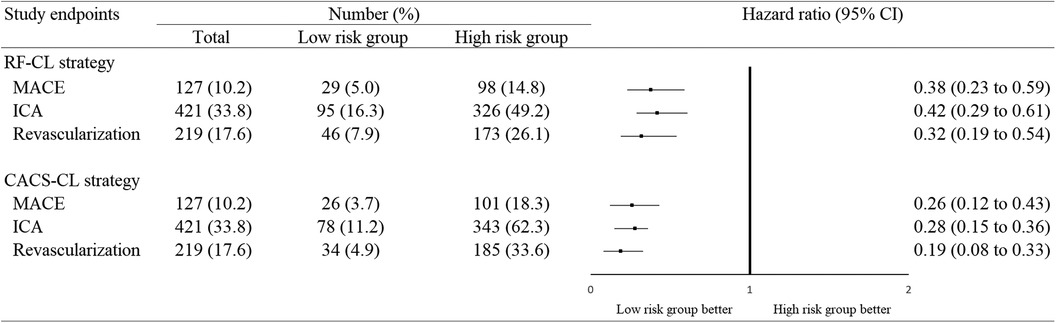
Figure 5. Association between study endpoints and risk groups determined by the two models. MACE, major adverse cardiovascular event; ICA, invasive coronary angiography; CI, confidence interval; RF-CL, risk factor-weighted clinical likelihood; CACS-CL, coronary artery calcium score-weighted clinical likelihood.
Reclassification table and NRI
Compared with patients in the high-risk group, patients in the low-risk group were less likely to have obstructive CAD [RF-CL model, 20% (118/582) vs. 66% (438/663), p < 0.0001; CACS-CL model, 9% (62/694) vs. 88% (486/551), p < 0.0001]. Table 4 is the reclassification table comparing the CACS-CL with the RF-CL model. Compared with the RF-CL model, the CACS-CL model correctly divided 177 patients from the high- to low-risk group but falsely divided 9 patients from the low- to high-risk group in 697 negative patients. Of the 548 positive patients, 61 were correctly divided into the high-risk group but falsely divided 5 into the low-risk group. In other words, to avoid an unnecessary CIT and omissive CIT, the number needed to test CACS was 1,245/(177-9) ≈ 8 and 1,245/(61-5) = 21, respectively. Thus, compared with the RF-CL model, the NRI for the CACS-CL model was 24% in negative, 10% in positive, and 34% in all (p < 0.0001). The application of the CACS-CL model instead of the RF-CL model would result in a prominent change in downstream clinical management: 24% of the negative patients were reclassified into the low-risk group, for which no further CIT was recommended; 10% of the positive patients were reclassified into the high-risk group, for which further CIT recommended.
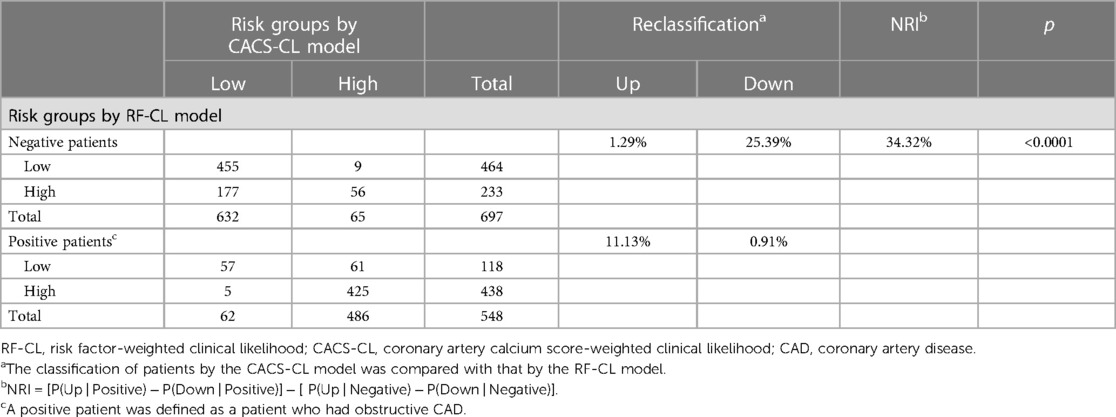
Table 4. Reclassification table comparing the RF-CL and CACS-CL models.
Discussion
In this CCTA-based cohort comprised of patients with DM and SCP suspected of CCS, the CACS-CL model revealed a larger AUC, less discrepancy between observed and predicted probabilities, and a positive IDI and NRI when compared with the RF-CL model. Both the RF-CL and CACS-CL models classified a proportion of patients into the low-risk groups with low prevalence of CAD and MACE, but the incorporation of CACS in the CACS-CL model was associated with improved effectiveness of risk assessment to optimize downstream clinical management.
Although all complications of DM are important, CAD specifically continues to be the leading cause of morbidity and mortality in this group (2, 27). In addition to being associated with increased cardiovascular risk, DM has the potential to affect a number of clinical management choices for CAD, including whether or not a CIT is appropriate (2, 27). However, two large randomized controlled trials (RCTs), FACTOR-64 and DIAD, did not support routine screening for CAD by CIT in DM patients to reduce MACE (6, 7). In this context, a PTP estimation-based approach for risk assessment to identify individuals who may derive maximum benefit from further CIT in patients with DM and SCP has been recommended by the newest guidelines (2).
Both the RF-CL and CACS-CL models were externally validated and compared in different CCTA-based cohorts of general SCP patients and our previous studies from the CICM-SCP registry (10–13). Furthermore, we have demonstrated that the RF-CL model was associated with greater efficiency in optimizing downstream clinical management for patients with SCP and DM (9), which was also supported by the lower prevalence of CAD and MACE when comparing the low- with the high-risk group determined by the RF-CL model in this study. However, the modest AUC and evident discrepancy between observed and predicted probabilities for the RF-CL model implied that there was still room for improvement in terms of the PTP estimation for patients with SCP and DM. Moreover, a cumulative MACE rate of approximately 5% is not prerequisite enough for allowing a more restrictive policy to investigate CAD in the low-risk group, especially considering the subsequent intervention after CCTA in a real-world cohort.
CACS revealed robust diagnosis and prognosis information above other biomarkers (28–31) and was recommended by recent guidelines especially for patients at low risk (8, 14), but our recent works have demonstrated that the performance of CACS alone was not as good as that of CACS-CL model (11, 32). In conformity with previous findings comparing the CACS-CL model with the RF-CL model (10–13), we demonstrated that the CACS-CL model offered a more accurate estimation of PTP and prediction of MACE. As far as we know, this is the first comparative description of the RF-CL and CACS-CL models in patients with SCP and DM. Moreover, there was a significant increase in clinically useful reclassification when CACS was added to these patients: when comparing the CACS-CL with the RF-CL model, the NRI was positive, and the association between study endpoints (MACE, use of downstream diagnostic and therapeutic interventions) and risk groups was enhanced. The replacement of the RF-CL model with the CACS-CL model would avoid an unnecessary CIT and omissive CIT at the expense of 8 and 21 additional CACS scans, respectively. Thus, considering the CACS scan as a quick, lower-radiation, and relatively inexpensive tool, more emphasis should be placed on the CACS-CL model for the effective identification of patients with SCP and DM who may derive minimal benefit from further CIT in clinical practice, which has been supported by studies evaluating the role of multimodal imaging in CCS (33–35).
Although this is the first study to evaluate the RF-CL and CACS-CL models for patients with SCP and DM, several issues merit consideration. First, this study was an observational cohort. The clinical management of patients before and after CCTA relied on a local physician. Thus, whether the CACS-CL model will lead to more appropriate decision-making of downstream management and better clinical outcomes needs to be addressed in future studies, such as RCTs. Second, this analysis focused on the presence of obstructive CAD documented by CCTA. Previous studies have demonstrated that CCTA had a high negative predictive value compared with ICA (36, 37), so CCTA could offer robust reassurance to exclude obstructive CAD. Moreover, we defined unassessable segments as positive ones based on current guideline recommendations in which further testing should be referred for non-conclusive CCTA. Third, this analysis focused on the presence of coronary diameter stenosis ≥50%. Evaluation of high-risk CAD, such as left main disease or three-vessel disease with a maximal degree of coronary diameter stenosis ≥70%, would be helpful to identify patients who may derive maximal benefit from revascularization (38–40). Fourth, the potential advantage of CACS is its ability to reclassify patients with borderline PTP (5%–15%), which has been demonstrated in the general population (12, 26, 41). Thus, further studies are needed to investigate whether the reclassification effect of CACS is most pronounced for diabetic patients with borderline PTP. Lastly, this study only focused on SCP. Thus, the conclusions should not be extrapolated to patients with dyspnea or acute chest pain or asymptomatic patients.
Conclusions
Among patients with DM and SCP suspected of CCS, the CACS-CL model demonstrated superiority in terms of the diagnosis of obstructive CAD and prediction of MACE. As a result, compared with the RF-CL model, the CACS-CL model-based risk assessment might have more potential to avoid unnecessary and omissive CIT at a low expense. In the future, the cost-effectiveness of the CACS-CL model that increases the use of CACS scans needs to be comprehensively validated in RCTs comprised of patients with DM and SCP suspected of CCS.
Data availability statement
The raw data supporting the conclusions of this article will be made available by the authors, without undue reservation.
Ethics statement
The studies involving humans were approved by the Ethics Committees of Tianjin Chest Hospital. The studies were conducted in accordance with the local legislation and institutional requirements. The participants provided their written informed consent to participate in this study.
Author contributions
TC: Data curation, Formal Analysis, Writing – original draft. DS: Data curation, Formal Analysis, Investigation, Writing – original draft. JZ (3rd author): Data curation, Formal Analysis, Writing – original draft. MX: Data curation, Investigation, Writing – review and editing. YL: Data curation, Writing – review and editing. MH: Data curation, Writing – review and editing. YT: Data curation, Formal Analysis, Writing – review and editing. YA: Data curation, Writing – review and editing. XZ: Data curation, Writing – review and editing. JZ (10th author): Funding acquisition, Investigation, Project administration, Resources, Supervision, Writing – review and editing. JZ (11th author): Conceptualization, Formal Analysis, Funding acquisition, Methodology, Supervision, Validation, Writing – review and editing.
Funding
The authors declare that the research was conducted in the absence of any commercial or financial relationships that could be construed as a potential conflict of interest.
This work was supported by the National Natural Science Foundation of China (62206197 and 62106160), Applied and Basic Research by Multi-input Foundation of Tianjin (21JCYBJC00820), Tianjin Health Research Project (TJWJ2022QN067), Tianjin Scientific and Technological Project (23KPXMRC00110), Tianjin Key Research Program of Traditional Chinese Medicine (2023006), and Tianjin Health Industry High-level Talent Selection and Training Project (TJSQNYXXR-D2-134). The funding bodies did not have any input into the design of the study, data analysis, data interpretation, or manuscript writing.
Conflict of interest
The authors declare that the research was conducted in the absence of any commercial or financial relationships that could be construed as a potential conflict of interest.
Publisher's note
All claims expressed in this article are solely those of the authors and do not necessarily represent those of their affiliated organizations, or those of the publisher, the editors and the reviewers. Any product that may be evaluated in this article, or claim that may be made by its manufacturer, is not guaranteed or endorsed by the publisher.
Supplementary material
The Supplementary Material for this article can be found online at: https://www.frontiersin.org/articles/10.3389/fcvm.2024.1368743/full#supplementary-material
References
1. Cardoso R, Dudum R, Ferraro RA, Bittencourt M, Blankstein R, Blaha MJ, et al. Cardiac computed tomography for personalized management of patients with type 2 diabetes mellitus. Circ Cardiovasc Imaging. (2020) 13:e011365. doi: 10.1161/CIRCIMAGING.120.011365
2. Marx N, Federici M, Schütt K, Müller-Wieland D, Ajjan RA, Antunes MJ, et al. 2023 ESC guidelines for the management of cardiovascular disease in patients with diabetes: developed by the task force on the management of cardiovascular disease in patients with diabetes of the European Society of Cardiology (ESC). Eur Heart J. (2023) 44(39):ehad192. doi: 10.1093/eurheartj/ehad192
3. Chu X, Feng B, Ge J, Guo L, Huo Y, Ji L, et al. Chinese expert consensus on the risk assessment and management of panvascular disease inpatients with type 2 diabetes mellitus (2022 edition). Cardiol Plus. (2022) 7:162–77. doi: 10.1097/CP9.0000000000000029
4. Rawshani A, Rawshani A, Franzén S, Sattar N, Eliasson B, Svensson A-M, et al. Risk factors, mortality, and cardiovascular outcomes in patients with type 2 diabetes. N Engl J Med. (2018) 379:633–44. doi: 10.1056/NEJMoa1800256
5. Ke C, Lipscombe LL, Weisman A, Zhou L, Austin PC, Shah BR, et al. Trends in the association between diabetes and cardiovascular events, 1994–2019. JAMA. (2022) 328:1866–9. doi: 10.1001/jama.2022.14914
6. Turrini F, Scarlini S, Mannucci C, Messora R, Giovanardi P, Magnavacchi P, et al. Does coronary Atherosclerosis Deserve to be Diagnosed earlY in Diabetic patients? The DADDY-D trial. Screening diabetic patients for unknown coronary disease. Eur J Intern Med. (2015) 26:407–13. doi: 10.1016/j.ejim.2015.05.006
7. Muhlestein JB, Lappé DL, Lima JA, Rosen BD, May HT, Knight S, et al. Effect of screening for coronary artery disease using CT angiography on mortality and cardiac events in high-risk patients with diabetes: the FACTOR-64 randomized clinical trial. JAMA. (2014) 312:2234–43. doi: 10.1001/jama.2014.15825
8. Knuuti J, Wijns W, Saraste A, Capodanno D, Barbato E, Funck-Brentano C, et al. 2019 ESC guidelines for the diagnosis and management of chronic coronary syndromes. Eur Heart J. (2020) 41:407–77. doi: 10.1093/eurheartj/ehz425
9. Zhao J, Wang S, Zhao P, Huo Y, Li C, Zhou J. Comparison of risk assessment strategies for patients with diabetes mellitus and stable chest pain: a coronary computed tomography angiography study. J Diabetes Res. (2022) 2022:8183487. doi: 10.1155/2022/8183487
10. Winther S, Schmidt SE, Mayrhofer T, Botker HE, Hoffmann U, Douglas PS, et al. Incorporating coronary calcification into pre-test assessment of the likelihood of coronary artery disease. J Am Coll Cardiol. (2020) 76:2421–32. doi: 10.1016/j.jacc.2020.09.585
11. Zhou J, Li C, Cong H, Duan L, Wang H, Wang C, et al. Comparison of different investigation strategies to defer cardiac testing in patients with stable chest pain. JACC Cardiovasc Imaging. (2022) 15:91–104. doi: 10.1016/j.jcmg.2021.08.022
12. Zhou J, Zhao J, Li Z, Cong H, Wang C, Zhang H, et al. Coronary calcification improves the estimation for clinical likelihood of obstructive coronary artery disease and avoids unnecessary testing in patients with borderline pretest probability. Eur J Prev Cardiol. (2021) 29(3):zwab036. doi: 10.1093/eurjpc/zwab036
13. Winther S, Schmidt SE, Foldyna B, Mayrhofer T, Rasmussen LD, Dahl JN, et al. Coronary calcium scoring improves risk prediction in patients with suspected obstructive coronary artery disease. J Am Coll Cardiol. (2022) 80:1965–77. doi: 10.1016/j.jacc.2022.08.805
14. Gulati M, Levy PD, Mukherjee D, Amsterdam E, Bhatt DL, Birtcher KK, et al. 2021 AHA/ACC/ASE/CHEST/SAEM/SCCT/SCMR guideline for the evaluation and diagnosis of chest pain: a report of the American college of cardiology/American heart association joint committee on clinical practice guidelines. J Am Coll Cardiol. (2021) 78:e187–285. doi: 10.1016/j.jacc.2021.07.053
15. Zhou J, Chen Y, Zhang Y, Wang H, Tan Y, Liu Y, et al. Epicardial fat volume improves the prediction of obstructive coronary artery disease above traditional risk factors and coronary calcium score. Circ Cardiovasc Imaging. (2019) 12:e008002. doi: 10.1161/CIRCIMAGING.118.008002
16. Zhou J, Li C, Zhang H, Liu C, Yang J, Zhao J, et al. Association between coronary artery disease reporting and data system–recommended post–coronary CT angiography management and clinical outcomes in patients with stable chest pain from a Chinese registry. Radiology. (2023) 307:e222965. doi: 10.1148/radiol.222965
17. Zhou J, Liu Y, Huang L, Tan Y, Li X, Zhang H, et al. Validation and comparison of four models to calculate pretest probability of obstructive coronary artery disease in a Chinese population: a coronary computed tomographic angiography study. J Cardiovasc Comput Tomogr. (2017) 11:317–23. doi: 10.1016/j.jcct.2017.05.004
18. Zhao J, Zhang H, Liu C, Zhang Y, Xie C, Wang M, et al. Identification of vulnerable non-culprit lesions by coronary computed tomography angiography in patients with chronic coronary syndrome and diabetes mellitus. Front Cardiovasc Med. (2023) 10:1143119. doi: 10.3389/fcvm.2023.1143119
19. Jiang H, Feng C, Jin Y, Feng J, Li G, Ren P, et al. Comparison of NICE and ESC strategy for risk assessment in women with stable chest pain: a coronary computed tomography angiography study. Rev Cardiovasc Med. (2022) 23:26. doi: 10.31083/j.rcm2301026
20. Thygesen K, Alpert JS, Jaffe AS, Chaitman BR, Bax JJ, Morrow DA, et al. Fourth universal definition of myocardial infarction (2018). J Am Coll Cardiol. (2018) 72:2231–64. doi: 10.1016/j.jacc.2018.08.1038
21. Chang HJ, Lin FY, Gebow D, An HY, Andreini D, Bathina R, et al. Selective referral using CCTA versus direct referral for individuals referred to invasive coronary angiography for suspected CAD: a randomized, controlled, open-label trial. JACC Cardiovasc Imaging. (2018) 29(3):e105–7. doi: 10.1016/j.jcmg.2018.09.018
22. Dewey M, Rief M, Martus P, Kendziora B, Feger S, Dreger H, et al. Evaluation of computed tomography in patients with atypical angina or chest pain clinically referred for invasive coronary angiography: randomised controlled trial. Br Med J. (2016) 355:i5441. doi: 10.1136/bmj.i5441
23. Group DT. CT or invasive coronary angiography in stable chest pain. N Engl J Med. (2022) 386:1591–602. doi: 10.1056/NEJMoa2200963
24. Collins GS, Reitsma JB, Altman DG, Moons KG, Group T. Transparent reporting of a multivariable prediction model for individual prognosis or diagnosis (TRIPOD): the TRIPOD statement. The TRIPOD group. Circulation. (2015) 131:211–9. doi: 10.1161/CIRCULATIONAHA.114.014508
25. Alba AC, Agoritsas T, Walsh M, Hanna S, Iorio A, Devereaux PJ, et al. Discrimination and calibration of clinical prediction models: users’ guides to the medical literature. JAMA. (2017) 318:1377–84. doi: 10.1001/jama.2017.12126
26. Brix GS, Rasmussen LD, Rohde PD, Schmidt SE, Nyegaard M, Douglas PS, et al. Calcium scoring improves clinical management in patients with low clinical likelihood of coronary artery disease. JACC Cardiovasc Imaging. (2024) 17(2):233. doi: 10.1016/j.jcmg.2023.11.008
27. Arnold SV, Bhatt DL, Barsness GW, Beatty AL, Deedwania PC, Inzucchi SE, et al. Clinical management of stable coronary artery disease in patients with type 2 diabetes mellitus: a scientific statement from the American Heart Association. Circulation. (2020) 141:e779–806. doi: 10.1161/CIR.0000000000000766
28. Genders TS, Steyerberg EW, Hunink MG, Nieman K, Galema TW, Mollet NR, et al. Prediction model to estimate presence of coronary artery disease: retrospective pooled analysis of existing cohorts. Br Med J. (2012) 344:e3485. doi: 10.1136/bmj.e3485
29. Genders TSS, Coles A, Hoffmann U, Patel MR, Mark DB, Lee KL, et al. The external validity of prediction models for the diagnosis of obstructive coronary artery disease in patients with stable chest pain: insights from the PROMISE trial. JACC Cardiovasc Imaging. (2018) 11:437–46. doi: 10.1016/j.jcmg.2017.02.020
30. Mittal TK, Pottle A, Nicol E, Barbir M, Ariff B, Mirsadraee S, et al. Prevalence of obstructive coronary artery disease and prognosis in patients with stable symptoms and a zero-coronary calcium score. Eur Heart J Cardiovasc Imaging. (2017) 18:922–9. doi: 10.1093/ehjci/jex037
31. Hulten E, Bittencourt MS, Ghoshhajra B, O'Leary D, Christman MP, Blaha MJ, et al. Incremental prognostic value of coronary artery calcium score versus CT angiography among symptomatic patients without known coronary artery disease. Atherosclerosis. (2014) 233:190–5. doi: 10.1016/j.atherosclerosis.2013.12.029
32. Wang C, Zhang X, Liu C, Zhang C, Sun G, Zhou J. Coronary artery calcium score improves risk assessment of symptomatic patients in low-risk group based on current guidelines. Rev Cardiovasc Med. (2023) 24:162. doi: 10.31083/j.rcm2406162
33. Morrone D, Gentile F, Aimo A, Cameli M, Barison A, Picoi ME, et al. Perspectives in noninvasive imaging for chronic coronary syndromes. Int J Cardiol. (2022) 365:19–29. doi: 10.1016/j.ijcard.2022.07.038
34. Bergamaschi LA-O, Pavon AA-O, Angeli FA-O, Tuttolomondo DA-O, Belmonte MA-O, Armillotta MA-O, et al. The role of non-invasive multimodality imaging in chronic coronary syndrome: anatomical and functional pathways. Diagnostics (Basel). (2023) 13(12):2083. doi: 10.3390/diagnostics13122083
35. Serruys PW, Hara H, Garg S, Kawashima H, Nørgaard BL, Dweck MR, et al. Coronary computed tomographic angiography for complete assessment of coronary artery disease: JACC state-of-the-art review. J Am Coll Cardiol. (2021) 78(7):713–36. doi: 10.1016/j.jacc.2021.06.019
36. Haase R, Schlattmann P, Gueret P, Andreini D, Pontone G, Alkadhi H, et al. Diagnosis of obstructive coronary artery disease using computed tomography angiography in patients with stable chest pain depending on clinical probability and in clinically important subgroups: meta-analysis of individual patient data. Br Med J. (2019) 365:l1945. doi: 10.1136/bmj.l1945
37. Knuuti J, Ballo H, Juarez-Orozco LE, Saraste A, Kolh P, Rutjes AWS, et al. The performance of non-invasive tests to rule-in and rule-out significant coronary artery stenosis in patients with stable angina: a meta-analysis focused on post-test disease probability. Eur Heart J. (2018) 39:3322–30. doi: 10.1093/eurheartj/ehy267
38. Yang Y, Chen L, Yam Y, Achenbach S, Al-Mallah M, Berman DS, et al. A clinical model to identify patients with high-risk coronary artery disease. JACC Cardiovasc Imaging. (2015) 8:427–34. doi: 10.1016/j.jcmg.2014.11.015
39. Jang JJ, Bhapkar M, Coles A, Vemulapalli S, Fordyce CB, Lee KL, et al. Predictive model for high-risk coronary artery disease. Circ Cardiovasc Imaging. (2019) 12:e007940. doi: 10.1161/CIRCIMAGING.118.007940
40. Jiang H, Feng J, Feng C, Ren P, Ren K, Jin Y, et al. Validation and comparison of PROMISE and CONFIRM model to predict high-risk coronary artery disease in symptomatic and diabetes mellitus patients. Rev Cardiovasc Med. (2022) 23:80. doi: 10.31083/j.rcm2303080
Keywords: diabetes mellitus, stable chest pain, coronary computed tomography angiography, risk assessment, coronary artery calcium score, pretest probability
Citation: Chen T, Shao D, Zhao J, Xiu M, Li Y, He M, Tan Y, An Y, Zhang X, Zhao J and Zhou J (2024) Comparison of the RF-CL and CACS-CL models to estimate the pretest probability of obstructive coronary artery disease and predict prognosis in patients with stable chest pain and diabetes mellitus. Front. Cardiovasc. Med. 11:1368743. doi: 10.3389/fcvm.2024.1368743
Received: 11 January 2024; Accepted: 8 March 2024;
Published: 22 March 2024.
Edited by:
Christian Tesche, Augustinum Klinik München, GermanyReviewed by:
Luca Bergamaschi, University of Bologna, ItalyNikolaos Stalikas, University General Hospital of Thessaloniki AHEPA, Greece
© 2024 Chen, Shao, Zhao, Xiu, Li, He, Tan, An, Zhang, Zhao and Zhou. This is an open-access article distributed under the terms of the Creative Commons Attribution License (CC BY). The use, distribution or reproduction in other forums is permitted, provided the original author(s) and the copyright owner(s) are credited and that the original publication in this journal is cited, in accordance with accepted academic practice. No use, distribution or reproduction is permitted which does not comply with these terms.
*Correspondence: Jia Zhao zhoujiawenzhang@126.com Jia Zhou orange2012@126.com
†These authors have contributed equally to this work and share first authorship