Machine learning models for predicting the risk factor of carotid plaque in cardiovascular disease
 Chengling Bin1 Qin Li1 Jing Tang1 Chaorong Dai1 Ting Jiang1 Xiufang Xie2 Min Qiu3 Lumiao Chen4
  Shaorong Yang1*
- 1Health Management Section, The First People’s Hospital of Neijiang, Neijiang, China
- 2Department of Respiratory and Critical Care Medicine, The First People’s Hospital of Neijiang, Neijiang, China
- 3Special Inspection Department, The First People’s Hospital of Neijiang, Neijiang, China
- 4Laboratory Department, The First People’s Hospital of Neijiang, Neijiang, China
Introduction: Cardiovascular disease (CVD) is a group of diseases involving the heart or blood vessels and represents a leading cause of death and disability worldwide. Carotid plaque is an important risk factor for CVD that can reflect the severity of atherosclerosis. Accordingly, developing a prediction model for carotid plaque formation is essential to assist in the early prevention and management of CVD.
Methods: In this study, eight machine learning algorithms were established, and their performance in predicting carotid plaque risk was compared. Physical examination data were collected from 4,659 patients and used for model training and validation. The eight predictive models based on machine learning algorithms were optimized using the above dataset and 10-fold cross-validation. The Shapley Additive Explanations (SHAP) tool was used to compute and visualize feature importance. Then, the performance of the models was evaluated according to the area under the receiver operating characteristic curve (AUC), feature importance, accuracy and specificity.
Results: The experimental results indicated that the XGBoost algorithm outperformed the other machine learning algorithms, with an AUC, accuracy and specificity of 0.808, 0.749 and 0.762, respectively. Moreover, age, smoke, alcohol drink and BMI were the top four predictors of carotid plaque formation. It is feasible to predict carotid plaque risk using machine learning algorithms.
Conclusions: This study indicates that our models can be applied to routine chronic disease management procedures to enable more preemptive, broad-based screening for carotid plaque and improve the prognosis of CVD patients.
1. Introduction
Cardiovascular disease (CVD) is generally divided into several types, such as coronary heart disease (CHD), cerebrovascular disease, heart failure, hypertension and so on (1). CVD is one of the leading causes of death worldwide, with 17.9 million deaths in 2016 and predicted to increase to approximately 23.6 million deaths by 2030 (2, 3). Due to the changes in lifestyle, aging population and urbanization, the prevalence of CVD in China has significantly increased (4). Cardiovascular disease afflicts 20% of the adult population in China, accounting for more than 40% of all deaths (5). Therefore, it is crucial to identify and diagnose CVD early to reduce the burden on families and society.
Hypertension and atherosclerosis are two well-recognized risk factors for CVD (6, 7). Current evidence suggests that a person with hypertension has a significant lifetime risk of cardiovascular disease by age 30 (8). According to previous studies, over half of all CVD cases in China are related to hypertension (4). In addition, atherosclerosis refers to the formation of carotid plaques in the inner lining of medium and large arteries. The risk of CVD is 1.3 to 2.8-fold higher among people with carotid plaques than those without, according to several large cohort studies (9, 10). Carotid plaque screening was recommended as part of the CVD risk assessments by the 2016 European Guidelines on CVD Prevention in Clinical Practice (11). Hence, carotid plaques have become an important measure of risk in many clinical studies.
In computer science, machine learning (ML) is a kind of artificial intelligence (AI) that harnesses data-driven techniques to recognize patterns and predict behavior (12). ML has been widely applied in multiple medical and health fields, such as cancer (13), diabetes (14), cardiovascular disease (CVD) (15) and mental health (16). ML can be used to predict the prevalence and treatment efficacy of diseases. Generally, the use of machine learning models can improve patient safety and care quality and reduce medical expenses (17). Interestingly, machine learning can predict hypertension based on clinical indicators. In a Swedish study, LR was used to establish a model to study heart rate, memory, metabolic characteristics and their relationship with hypertension (18). Using LR, Elizabeth Held et al. developed a hypertension risk model based on age, sex, smoking, and genetic data (19). Moreover, bioinformatics and machine learning identified immune cell infiltration and diagnostic biomarkers of carotid plaques (20, 21). The XGBoost algorithm has been reported to be the best predictive model for primary stroke prevention in a Chinese study (22). However, the predictive models for recognizing carotid plaques in CVD have rarely been documented in the literature, and it is essential to build a model to directly predict the risk of carotid plaques.
This study aimed to identify the most effective prediction model for the formation of carotid plaque among Chinese adults through eight machine learning methods: logistic regression (LR), support vector machine (SVM), random forest (RF), MLP Neural Network, XGBoost (Extreme Gradient Boosting), decision tree (DT), K-Nearest Neighbors (KNN), and Naive Bayes model (NBM), to screen high-risk populations, take preventive measures and reduce the prevalence of CVD.
2. Materials and methods
2.1. Study design and data resource
The data used for the machine learning model in this study came from the physical examination center of a third-class hospital in southwest China from September 2020 to October 2021. The inclusion criteria were (1) age > 18 years. (2) Patients without coronary heart disease, stroke, heart disease, cancer and other serious diseases. Physical examination data were collected from 4,659 patients, including 1,692 patients with carotid plaques and 2,967 normal patients. The diagnosis of carotid plaque was based on a doppler ultrasound examination, and personal information was kept strictly confidential.
This study sought to build a risk prediction model for carotid plaque formation based on physical examination data and machine learning techniques to explore the risk factors of CVD and help clinicians in decision-making. The data processing and model-building process of machine learning is shown in Figure 1.
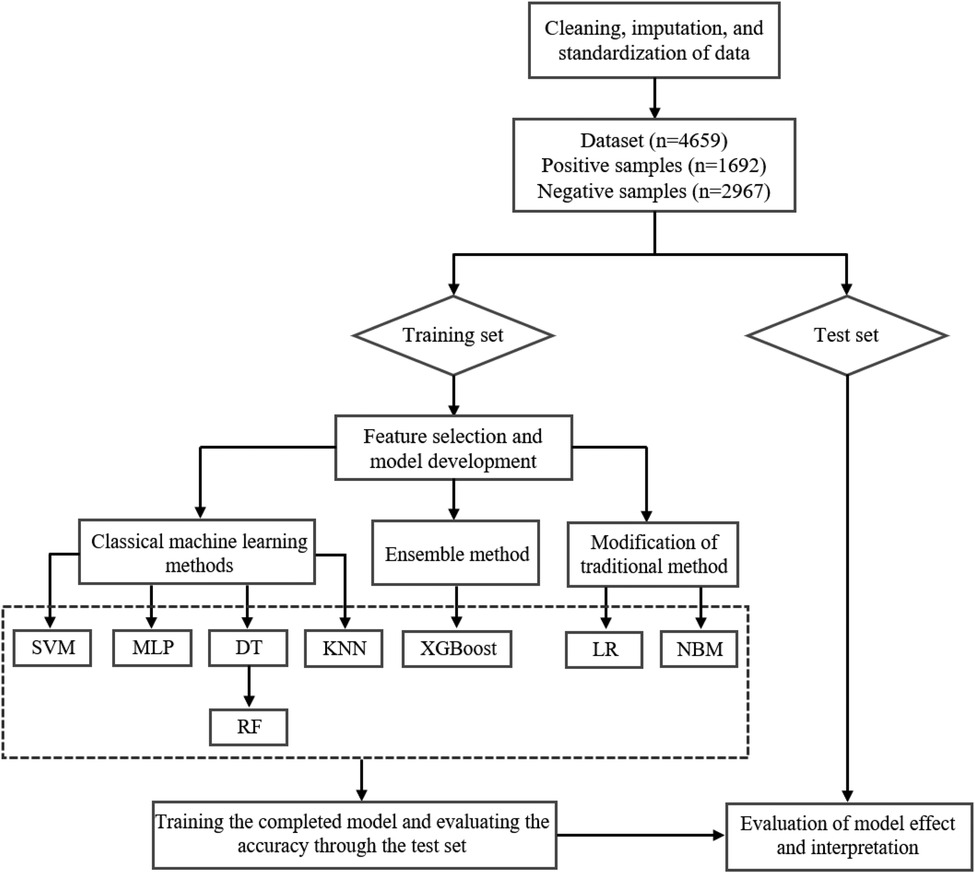
Figure 1. The flow diagram of data processing and model building process.
2.2. Feature selection
The constituent factors employed for the construction of the carotid plaque risk prediction model were acquired directly from outcomes of physical examinations, and demonstrated statistical significance in the course of data analysis (P < 0.05). According to the literature (23–25), we selected 14 variables related to carotid plaque formation. All direct variables were transformed into categorical variables to facilitate relevant calculations in machine learning models, and the specific details of the variables are presented in Table 1.
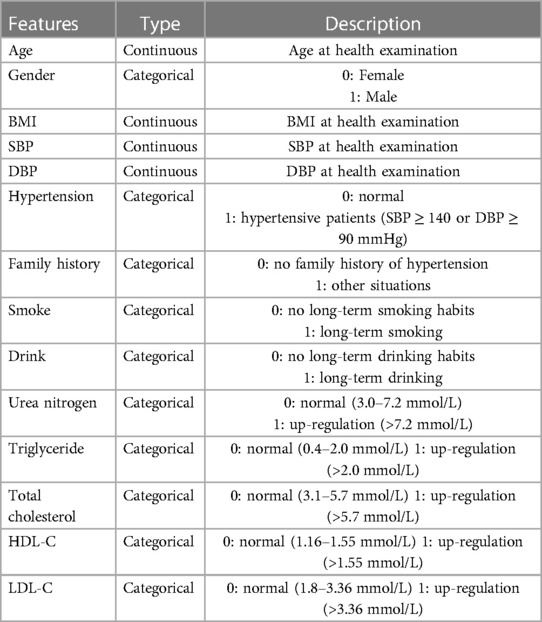
Table 1. Features description information.
2.3. Machine learning algorithms
Eight predictive models were used to develop risk models based on the extracted features to predict the risk of carotid plaque formation.
Logistic regression (LR): LR is a generalized linear regression analysis model similar to linear regression modeling, and both are derived from the exponential distribution family. However, LR introduces a sigmoid function to normalize the dependent variable. Besides, the LR algorithm can directly probe the association between the categorical dependent variable and independent variables (26), commonly utilized in data mining, automatic disease diagnosis, economic prediction, etc.
Support vector machine (SVM): SVM is a generalized linear classification based on supervised learning that can create a hyperplane between two kinds of data to maximize the margin (27). SVM is a classifier with sparsity and robustness, which utilizes hinge loss to compute empirical risk and adds a normalized term in the solution system to optimize structural danger.
Random forest (RF): RF is a global learning technology based on decision tree analysis. The RF algorithm creates multiple decision trees using the data set obtained by bootstrapping the original data and randomly selecting a subset of variables in each step of the decision tree (28). Then, the model selects all predicted patterns of each decision tree. The RF classifiers were trained independently, contributing to the fast learning process.
The multilayer perceptron (MLP) Neural Network: MLP is also named Artificial Neural Network (ANN), a nonlinear mapping model. The MLP can have multiple hidden layers besides the input and output layers. The simplest MLP requires a hidden layer; the input, hidden and output layers can be called a simple neural network when they connect. A neural network consists of a series of functions derived from a bionic neural network that involve connecting multiple eigenvalues and combining them in a linear and nonlinear way (29).
XGBoost (Extreme Gradient Boosting): XGBoost is an optimized distributed gradient enhancement library that is efficient, flexible and portable. The algorithm for XGBoost is accomplished under the framework of Gradient Boosting (30). XGBoost also offers parallel tree promotion, which could precisely resolve numerous data science issues. For example, the same code runs in primarily distributed environments (Hadoop, SGE, MPI) and can solve issues beyond billions of examples.
Decision tree (DT): This decision analysis method is based on the occurrence probability of various situations; the probability (the expected value of the net present value is greater than or equal to zero) can be computed by generating a decision tree (31). The DT algorithm is a graphical method that objectively applies probability analysis. Its computational complexity is not high; the output results are easy to understand and insensitive to the loss of intermediate values.
K-Nearest Neighbors (KNN): KNN is a nonparametric statistical method for classification and regression. This method is simple and effective, of which the generated model is based on the entire training dataset. The prediction result of the new data point is obtained by searching the K instances (nearest neighbors) similar to the data point on the whole training set and summarizing the output variables of these K instances. The prediction effect of KNN is good and is not sensitive to outliers.
Naive Bayes model (NBM): NBM is a classification method based on the Bayesian theorem and independent assumption of feature conditions. The misjudgment rate is very low due to the knowledge of probability statistics used to classify the sample datasets (32). NBM comprises prior and posterior probabilities, which avoids the subjective bias of using only prior probability and the over-fitting phenomenon of using only sample information.
2.4. Model development
We randomly separated the data into a training set and validation set according to a ratio of 2:1; the validation set was further used to adjust the model parameters to establish several new models, while the training set was used to evaluate the performance of the eight predictive models. The main profiles of the training and validation sets are presented in Table 2. Linear and tree “weak” classifiers were used to adjust parameters and select the model with higher accuracy for output in the XGBoost algorithm. Considering that the total amount was relatively small, 10-fold cross-validation was used to reduce the impact of fitting on the model and adjust the parameters of machine learning models for obtaining optimal results when the model allows. All machine learning algorithms were operated in Python 3.8.
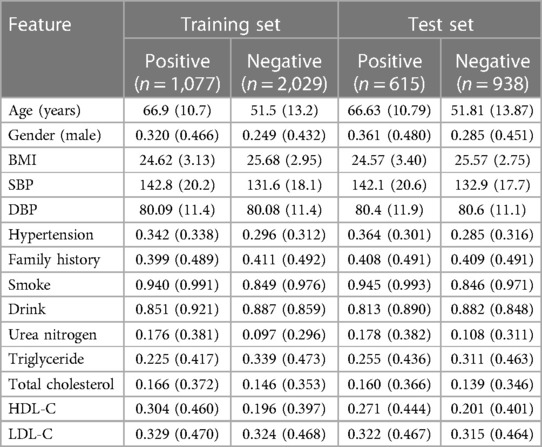
Table 2. The main profiles of the training set and test set.
2.5. Validation
Several evaluation criteria were adopted to validate the performance of the predictive models, including the area under the receiver operating characteristic curve (AUC), accuracy, sensitivity, specificity, precision, F-value and Youden index. Accuracy is the most commonly used classification performance indicator, indicating the model's accuracy. Sensitivity is the percentage of positive samples predicted to be positive. Specificity refers to the ratio of the number of negative samples identified by the model to the total number of negative samples. These parameters could be calculated as follows:
Where the TP is the number of positive samples determined as positive (true positive), FN is the amount of positive determined as negative (false negative), TN is the amount of negative determined as negative (true negative), FP is the number of negative samples judged as positive (false positive) (23). A receiver operating characteristic (ROC) curve was generated by obtaining the coordinate points under different thresholds and connecting various coordinate points with the true positive rate TP as the vertical axis and the false positive case FP rate as the horizontal axis. The AUC refers to the area under the ROC curve, which is less than 1. The larger the AUC value, the higher the accuracy of the classifier.
2.6. Model interpretation
Traditional interpretation methods for machine learning algorithms only reflect the importance of features and exhibit a limited ability to judge how the features are related to the final predicted result. To solve this problem, the Shapley Additive Explanations (SHAP) tool was used to better explain the prediction model, which is an additive interpretation model. The model generated a predicted value for each predicted sample, and a SHAP value was assigned to each feature in the sample. The absolute value reflects the importance of the feature, of which the positive and negative values reflect the positive and negative effects in predicting the risk of carotid plaque. A SHAP value greater than 0 indicated that the feature improved the predicted value and played a positive role.
3. Results
3.1. Baseline characteristics
Overall, the model error decreased as the number of features increased. However, in practical terms, it is challenging to implement an excessive number of features. Accordingly, the number of features should be adequate. Based on the risk factors of hypertension collected in a previous study (29), laboratory variables were added according to the results of physical examination, which is used to obtain more accurate predictive results. After feature extraction and selection, several variables such as age, gender, BMI, family history, smoke, alcohol drink, SBP, DBP, hypertension and so on were finally chosen as input features of the machine learning models. The above features were strongly associated with carotid plaque formation (P < 0.05). The results are summarized in Table 3.
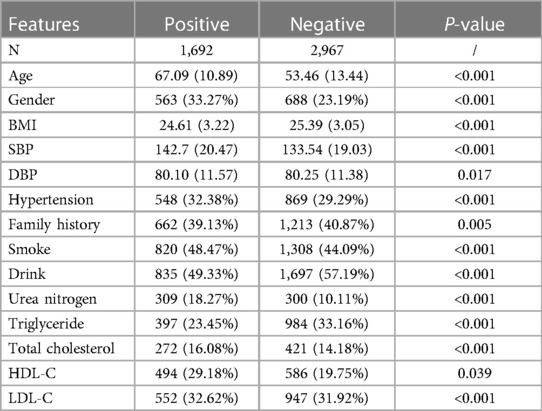
Table 3. Baseline characteristics of the participants.
3.2. Model parameters
Based on the feature parameters selected above, we used the training set to determine the optimal hyperparameters of eight machine learning algorithms, including the value of k (the number of closest points) in the KNN method, tree depth in the DT model, learning rate in XGBoost algorithm, etc. The hyperparameter results of the various models with optimal performance are summarized in Table 4, including the default values in some machine learning algorithms.
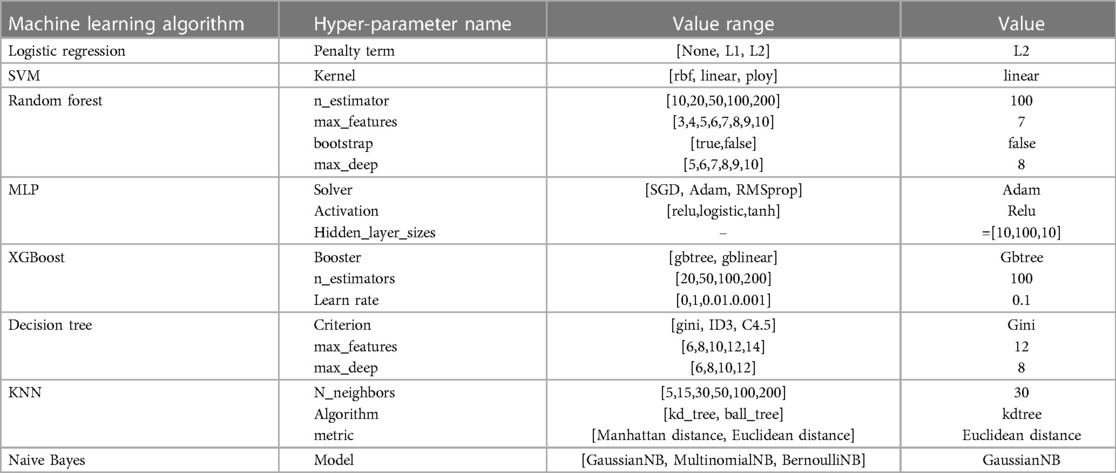
Table 4. The concrete results of hyperparameter in each machine learning algorithm.
3.3. Comparison of model performance
After building models based on the training set, their performance was assessed using the test set (Table 5). Interestingly, the integrated algorithm XGBoost outperformed all models, with an AUC value of 0.808. In contrast, the DT model was associated with the worst performance (AUC value 0.72). The ROC curves of the eight machine-learning models are shown in Figure 2. Besides, the confidence interval (CI) of LR, SVM, RF, MLP, XGBoost, DT, KNN and NBM is [0.768, 0.796], [0.790, 0.814], [0.781, 0.810], [0.775, 0.789], [0.796, 0.815], [0.704, 0.770], [0.738, 0.780], [0.747, 0.785], respectively. According to the results of CI, it is obvious that the results of our models are stable and reliable.
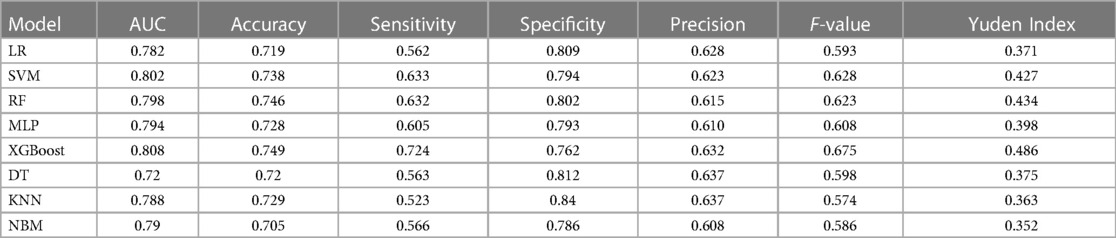
Table 5. The performance of each machine learning models.
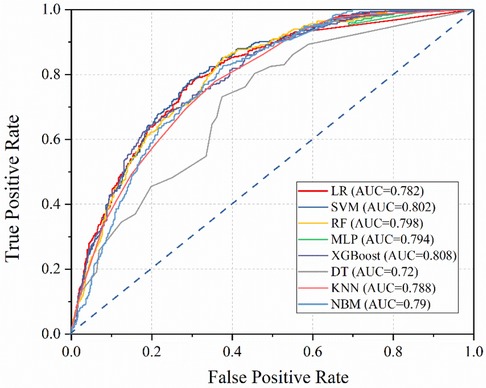
Figure 2. ROC curves of the eight machine learning models.
The classification confusion matrix of the eight prediction models is shown in Figure 3. Among the top 4 models, the XGBoost model yielded the best performance in terms of TN, FP, FN and TP (510, 159, 104 and 273) compared to the SVM model (541, 140, 134 and 231), RF model (560, 138, 128 and 220) and MLP neural network model (540, 141, 144 and 221, respectively).

Figure 3. The confusion matrix of the eight machine learning models, including (A–H) LR, SVM, RF, MLP, XGBoost, DT, KNN and NBM, respectively.
In addition to the AUC value, the accuracy, sensitivity and specificity of models are important indicators for evaluating a model's performance. For the four models with the best performance mentioned above (XGBoost, SVM, RF and MLP), the accuracy rate was 0.749, 0.738, 0.746 and 0.728, the sensitivity was 0.724, 0.633, 0.632 and 0.605, and the specificity was 0.762, 0.794, 0.802 and 0.793, respectively. Based on the above result, the XGBoost model yielded the best comprehensive performance.
Based on the performance of the XGBoost model, we computed the importance of each feature based on the absolute SHAP value (Figure 4). The negative and positive contributions of the feature are indicated in blue and red, respectively. The SHAP summary plot is also presented in Figure 5. The most important characteristic was age, followed by smoke, alcohol drink, BMI, hypertension and triglyceride, SBP, DBP, urea nitrogen, LDL-C, total cholesterol, HDL-C, gender and family history.
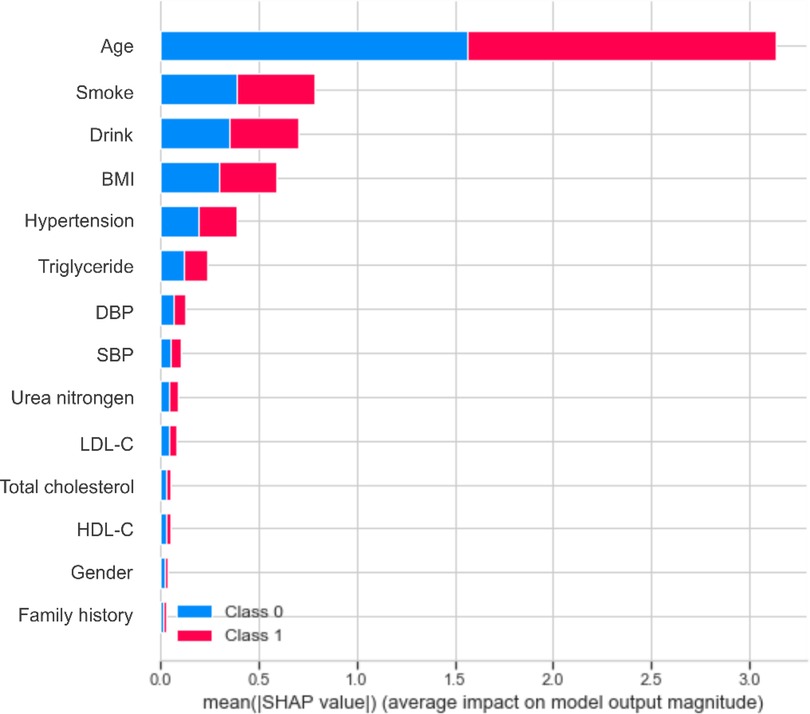
Figure 4. The feature importance ranking based on the SHAP value for the XGBoost model.
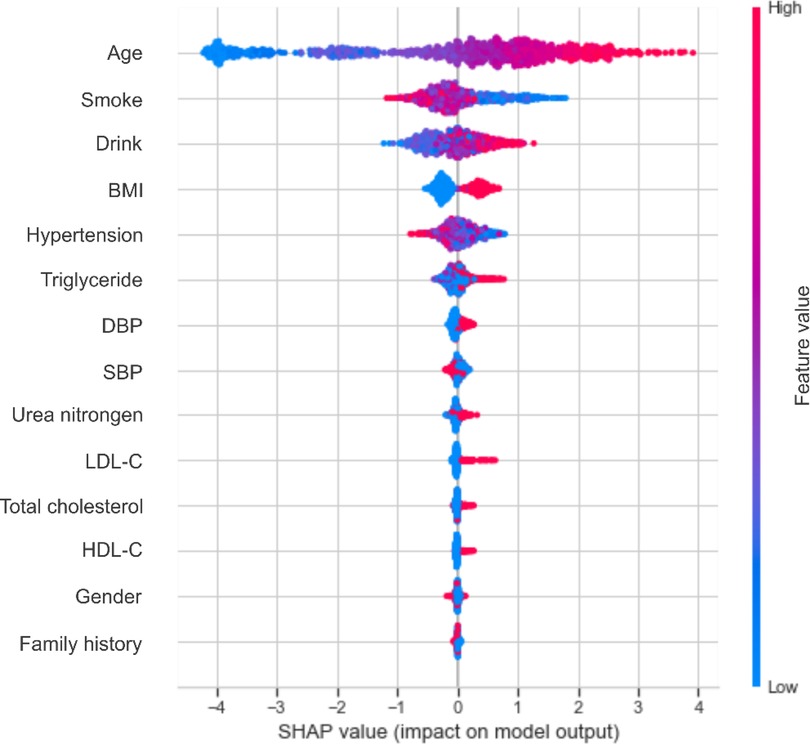
Figure 5. The SHAP summary chart of the important risk factors. Each dot represents a sample, with the red color implying a high feature value and blue one implying a low value. A higher SHAP value means a higher risk of incident carotid plaque.
4. Discussion
Cardiovascular diseases are a group of disorders involving the heart or blood vessels and remain a major cause of death and disability worldwide, accounting for about one-third of deaths each year. Hypertension is a primary risk factor for cardiovascular disease, and the risk assessment of hypertensive patients is the basis for developing primary and secondary prevention measures. Nowadays, evaluating target organ damage is an important part of the evaluation of hypertensive patients. Embodying subclinical target organ damage in hypertensive patients, carotid plaque formation can reflect the severity of atherosclerosis in the body and is an important risk factor for major cardiovascular diseases such as myocardial infarction and stroke. Therefore, a direct risk assessment and prediction of carotid plaque formation would be more effective. To our knowledge, most risk prediction models associated with cardiovascular disease have been based on hypertension (33–35). Herein, we established a carotid plaque risk prediction model using machine learning to lay the groundwork for hypertension and cardiovascular disease prevention in China, given the scarcity of related studies.
In the past, the early identification and treatment of diseases were highly challenging, often requiring the consensus of many human medical experts. With the advent of artificial intelligence, building disease risk prediction models based on machine learning has become a new method of early identification of high-risk populations. From the point of view of saving medical costs, the predictive models could realize early detection and intervention, which could identify individuals at risk of developing carotid plaque before they exhibit symptoms or complications. Early detection allows for timely interventions, such as lifestyle modifications or medication, which can help prevent the progression of the disease and the need for more expensive treatments or hospitalizations in the future. Then, the predictive models could help identify individuals who are more likely to develop carotid plaque, allowing healthcare providers to prioritize resources and target screening efforts. By focusing on high-risk individuals, unnecessary screenings and tests for low-risk individuals can be minimized, thereby reducing overall healthcare costs. For example, according to the charging standards of the hospital (a tertiary A-level hospital at the prefecture-level city), the cost of physical examination in this project is only 72 RMB/person, while the charge for a carotid ultrasound is 185 RMB/person. Based on the optimal calculation, the 4,659 patients counted in this work could save more than 520,000 RMB, and this is only the conclusion obtained from the data of one hospital. Finally, the predictive models could analyze a wide range of patient data, including demographics, medical history and lifestyle factors to generate personalized treatment plans. The healthcare resources can be utilized more efficiently, potentially reducing costs associated with ineffective or unnecessary treatments.
In this study, eight machine learning algorithms were used to establish a risk prediction model for carotid plaque, and the input features were from physical examination data that are convenient to obtain. Among the eight models, XGBoost yielded the best performance (AUC value 0.808 and accuracy 0.749), suggesting that the machine learning models based on 13 key features were reliable and practical.
Compared with traditional statistical methods, machine learning models enable the most accurate predictions possible due to their ability to successfully build predictive models using small amounts of data with high feature dimensions but exhibit limitations, including poor interpretability and the inability to get a complete picture of the internal structure of the model, which is also known as the “black box”. This is further explained by the fact that as the complexity of the defined mathematical objects (neural networks) increases, we do not have a perfect theory to describe the expressibility, training dynamics, and various other properties of artificial neural networks at the whole system level. To improve the transparency of the model, we applied the SHAP method for the XGBoost algorithm to quantitatively explain the contribution of each feature to the whole model. This approach could measure the impact of each feature on the predictive model.
Age, smoke, drink and BMI were the top four most important characteristics, consistent with the literature (28, 29, 36, 37). Early identification of key risk factors is important for risk assessment and prevention of carotid plaque, hypertension and cardiovascular disease. In the present study, age accounted for the largest proportion of the feature weight. It has been shown that the elasticity of blood vessels deteriorates with age (38), which could prompt the development of atherosclerosis. An article published in The Lancet Global Health revealed that 200 million Chinese people are expected to suffer from carotid plaque by 2020 (39). The detection rate of carotid plaque in patients over 45 years of age with diagnosed stroke or transient ischemic attack is 80%, which is close to 100% at age 60. Smoke and drink ranked second and third in the whole features. An increasing body of evidence suggests that nicotine in cigarettes can increase the level of low-density lipoprotein that causes atherosclerosis, reduce the level of high-density lipoprotein that protects arteries from atherosclerosis, and increase blood pressure (40, 41), leading to atherosclerosis. Heavy drinking can decrease cerebral blood flow, damage the liver, and affect lipid metabolism (42). Besides, alcohol increases cardiac excitability, leading to increased heart rate and contraction, conducive to increased blood pressure.
Besides, BMI is an important risk factor. There is an increasing consensus that obesity can heighten peripheral blood vessel resistance, increasing blood pressure and further contributing to carotid plaque formation (43, 44). A study showed that the arteries of obese subjects began to stiffen when they were teenagers (45). Solving the problem of obesity as early as possible is critical for vascular health, and regular exercise to keep BMI in the normal range is necessary. Among the numerous indicators of obesity, BMI is most closely related to the formation of carotid plaque (46), followed by hypertension, triglyceride, DBP, SBP, urea nitrogen, LDL-C, total cholesterol, HDL-C, gender and family history.
The XGBoost machine learning model established in the present study exhibited good predictive performance with important public health implications. Data from routine physical exams can help doctors screen people at high risk for carotid plaque and take preventive measures to prevent them from developing more dangerous cardiovascular diseases. In addition, XGBoost and other models used in this study are nonlinear ensemble algorithms. There is no need to select variables in advance, even the number of potential variables is large (47). Potential variables can be further discovered through large-scale population data, which is also a big advantage brought by machine learning.
Despite the above promising findings, the current research still has some limitations. Firstly, the dataset utilized for model training in this work was obtained from the cross-sectional data of physical examinations, which cannot predict the absolute risk of disease and limits the generalizability of the results. Besides, the data from the cross-sectional study was collected at the same point in time, so it does not reflect causation or temporal correlation. Secondly, our data came from a third-class hospital in southwest China, suggesting that our conclusions only reflect the relevant characteristics of the residents in a specific area. Given that diet and climate vary greatly in different regions, it remains unclear whether the established machine learning models can be extended to the whole country. Thirdly, the sensitivity of the model in this work is not particularly high, which may result in some omissions when using it as a screening tool. We expect to improve the overall performance of the predictive models by using more training data and improving the machine model algorithm in the future. Moreover, the number of features was relatively small, and the prediction models may lack universality. Generally, a greater number of features lead to a more accurate model.
5. Conclusions
Overall, we developed and compared eight machine learning models for predicting carotid plaque risk. The results showed better performance of the XGBoost algorithm than other machine learning methods with an AUC, accuracy, sensitivity and specificity of 0.808, 0.749, 0.724 and 0.762, respectively. In addition, age, smoke, drink and BMI were the features with the most significant weight in the prediction model. The training set for all models consisted of routine physical examination results, which can be easily applied to chronic disease health management systems and could assist clinicians in targeted carotid plaque prevention and early intervention.
Data availability statement
The raw data supporting the conclusions of this article will be made available by the authors, without undue reservation.
Author contributions
Conceptualization, CB and SY; Methodology, CB, QL, and TJ; Formal Analysis, CB, XX, and JT; Data Curation, CB, MQ, and LC; Writing-Original Draft Preparation, CB and CD; Writing-Review & Editing, CB and SY; Funding Acquisition, SY. All authors have read and agreed to the published version of the manuscript. All authors contributed to the article and approved the submitted version.
Conflict of interest
The authors declare that the research was conducted in the absence of any commercial or financial relationships that could be construed as a potential conflict of interest.
Publisher's note
All claims expressed in this article are solely those of the authors and do not necessarily represent those of their affiliated organizations, or those of the publisher, the editors and the reviewers. Any product that may be evaluated in this article, or claim that may be made by its manufacturer, is not guaranteed or endorsed by the publisher.
References
1. Cheng X, Manandhar I, Aryal S, Joe B. Application of artificial intelligence in cardiovascular medicine. Compr Physiol. (2021) 11:2455–66. doi: 10.1002/cphy.c200034
2. Tsao CW, Aday AW, Almarzooq ZI, Alonso A, Beaton AZ, Bittencourt MS, et al. Heart disease and stroke statistics-2022 update: a report from the American heart association. Circulation. (2022) 145:e153–639. doi: 10.1161/cir.0000000000001052
3. World health organization cardiovascular disease risk charts: revised models to estimate risk in 21 global regions. Lancet Glob Health. (2019) 7:e1332–45. doi: 10.1016/s2214-109x(19)30318-3
4. Wang W, Hu SS, Kong LZ, Gao RL, Zhu ML, Wang WY, et al. Summary of report on cardiovascular diseases in China, 2012. Biomed Environ Sci. (2014) 27:552–8. doi: 10.3967/bes2014.085
5. Weiwei C, Runlin G, Lisheng L, Manlu Z, Wen W, Yongjun W, et al. Outline of the report on cardiovascular diseases in China, 2014. Eur Heart J Suppl. (2016) 18:F2–11. doi: 10.1093/eurheartj/suw030
6. Kjeldsen SE, Narkiewicz K, Burnier M, Oparil S. The global burden of disease study 2015 and blood pressure. Blood Press. (2017) 26:1. doi: 10.1080/08037051.2016.1267557
7. Bromfield S, Muntner P. High blood pressure: the leading global burden of disease risk factor and the need for worldwide prevention programs. Curr Hypertens Rep. (2013) 15:134–6. doi: 10.1007/s11906-013-0340-9
8. Rapsomaniki E, Timmis A, George J, Pujades-Rodriguez M, Shah AD, Denaxas S, et al. Blood pressure and incidence of twelve cardiovascular diseases: lifetime risks, healthy life-years lost, and age-specific associations in 1·25 million people. Lancet. (2014) 383:1899–911. doi: 10.1016/s0140-6736(14)60685-1
9. Naqvi TZ, Lee MS. Carotid intima-media thickness and plaque in cardiovascular risk assessment. JACC Cardiovasc Imaging. (2014) 7:1025–38. doi: 10.1016/j.jcmg.2013.11.014
10. Zhang Y, Fang X, Hua Y, Tang Z, Guan S, Wu X, et al. Carotid artery plaques, carotid intima-Media thickness, and risk of cardiovascular events and all-cause death in older adults: a 5-year prospective, community-based study. Angiology. (2018) 69:120–9. doi: 10.1177/0003319717716842
11. Piepoli MF, Hoes AW, Agewall S, Albus C, Brotons C, Catapano AL, et al. 2016 European guidelines on cardiovascular disease prevention in clinical practice: the sixth joint task force of the European society of cardiology and other societies on cardiovascular disease prevention in clinical practice (constituted by representatives of 10 societies and by invited experts) developed with the special contribution of the European association for cardiovascular prevention & rehabilitation (EACPR). Atherosclerosis. (2016) 252:207–74. doi: 10.1016/j.atherosclerosis.2016.05.037
12. Topol EJ. High-performance medicine: the convergence of human and artificial intelligence. Nat Med. (2019) 25:44–56. doi: 10.1038/s41591-018-0300-7
13. Issa NT, Stathias V, Schürer S, Dakshanamurthy S. Machine and deep learning approaches for cancer drug repurposing. Semin Cancer Biol. (2021) 68:132–42. doi: 10.1016/j.semcancer.2019.12.011
14. Liu Q, Zhang M, He Y, Zhang L, Zou J, Yan Y, et al. Predicting the risk of incident type 2 diabetes Mellitus in Chinese elderly using machine learning techniques. J Pers Med. (2022) 12:905. doi: 10.3390/jpm12060905
15. Chen L, Han Z, Wang J, Yang C. The emerging roles of machine learning in cardiovascular diseases: a narrative review. Ann Transl Med. (2022) 10:611. doi: 10.21037/atm-22-1853
16. Le Glaz A, Haralambous Y, Kim-Dufor DH, Lenca P, Billot R, Ryan TC, et al. Machine learning and natural language processing in mental health: systematic review. J Med Internet Res. (2021) 23:e15708. doi: 10.2196/15708
17. Liang H, Tsui BY, Ni H, Valentim CCS, Baxter SL, Liu G, et al. Evaluation and accurate diagnoses of pediatric diseases using artificial intelligence. Nat Med. (2019) 25:433–8. doi: 10.1038/s41591-018-0335-9
18. Fava C, Sjögren M, Montagnana M, Danese E, Almgren P, Engström G, et al. Prediction of blood pressure changes over time and incidence of hypertension by a genetic risk score in Swedes. Hypertension. (2013) 61:319–26. doi: 10.1161/hypertensionaha.112.202655
19. Held E, Cape J, Tintle N. Comparing machine learning and logistic regression methods for predicting hypertension using a combination of gene expression and next-generation sequencing data. BMC Proc. (2016) 10:141–5. doi: 10.1186/s12919-016-0020-2
20. Wang J, Kang Z, Liu Y, Li Z, Liu Y, Liu J. Identification of immune cell infiltration and diagnostic biomarkers in unstable atherosclerotic plaques by integrated bioinformatics analysis and machine learning. Front Immunol. (2022) 13:956078. doi: 10.3389/fimmu.2022.956078
21. Zhang H, Huang Y, Li X, Chen W, Lun Y, Zhang J. Identifying hub genes and immune cell infiltration for the progression of carotid atherosclerotic plaques in the context of predictive and preventive using integrative bioinformatics approaches and machine-learning strategies. J Immunol Res. (2022) 2022:7657379. doi: 10.1155/2022/7657379
22. Wu D, Cui G, Huang X, Chen Y, Liu G, Ren L, et al. An accurate and explainable ensemble learning method for carotid plaque prediction in an asymptomatic population. Comput Methods Programs Biomed. (2022) 221:106842. doi: 10.1016/j.cmpb.2022.106842
23. Wang D, Li J, Sun Y, Ding X, Zhang X, Liu S, et al. A machine learning model for accurate prediction of sepsis in ICU patients. Front Public Health. (2021) 9:754348. doi: 10.3389/fpubh.2021.754348
24. Zheng X, Fang F, Nong W, Feng D, Yang Y. Development and validation of a model to estimate the risk of acute ischemic stroke in geriatric patients with primary hypertension. BMC Geriatr. (2021) 21:458. doi: 10.1186/s12877-021-02392-7
25. Wang J, Wen X, Li W, Li X, Wang Y, Lu W. Risk factors for stroke in the Chinese population: a systematic review and meta-analysis. J Stroke Cerebrovasc Dis. (2017) 26:509–17. doi: 10.1016/j.jstrokecerebrovasdis.2016.12.002
26. Buya S, Tongkumchum P, Owusu BE. Modelling of land-use change in Thailand using binary logistic regression and multinomial logistic regression. Arab J Geosci. (2020) 13:437. doi: 10.1007/s12517-020-05451-2
27. Cortes C, Vapnik V. Support-vector networks. Mach Learn. (1995) 20:273–97. doi: 10.1007/BF00994018
28. Dinh A, Miertschin S, Young A, Mohanty SD. A data-driven approach to predicting diabetes and cardiovascular disease with machine learning. BMC Med Inform Decis Mak. (2019) 19:211. doi: 10.1186/s12911-019-0918-5
29. Zhao H, Zhang X, Xu Y, Gao L, Ma Z, Sun Y, et al. Predicting the risk of hypertension based on several easy-to-collect risk factors: a machine learning method. Front Public Health. (2021) 9:619429. doi: 10.3389/fpubh.2021.619429
30. Chen T, Guestrin C. XGBoost: a scalable tree boosting system. Proceedings of the 22nd ACM SIGKDD international conference on knowledge discovery and data mining; (2016). p. 785–94.
31. Barros RC, Basgalupp MP, de Carvalho ACPLF, Freitas AA. A survey of evolutionary algorithms for decision-tree induction. IEEE Trans Syst Man Cybern C. (2012) 42:291–312. doi: 10.1109/tsmcc.2011.2157494
32. Li M, Fan P, Ma W, Liu K, Zang J, Samart C, et al. Constructing layered structures to enhance the breakdown strength and energy density of Na0.5Bi0.5TiO3-based lead-free dielectric ceramics. J Mater Chem C. (2019) 7:15292–300. doi: 10.1039/c9tc05637h
33. Alghnam S, Alessy SA, Bosaad M, Alzahrani S, Al Alwan II, Alqarni A, et al. The association between obesity and chronic conditions: results from a large electronic health records system in Saudi Arabia. Int J Environ Res Public Health. (2021) 18:12361. doi: 10.3390/ijerph182312361
34. Al-Sumaih I, Johnston B, Donnelly M, O'Neill C. The relationship between obesity, diabetes, hypertension and vitamin D deficiency among Saudi arabians aged 15 and over: results from the Saudi health interview survey. BMC Endocr Disord. (2020) 20:81. doi: 10.1186/s12902-020-00562-z
35. Damen JA, Hooft L, Schuit E, Debray TP, Collins GS, Tzoulaki I, et al. Prediction models for cardiovascular disease risk in the general population: systematic review. BMJ (2016) 353:i2416. doi: 10.1136/bmj.i2416
36. Wu Y, Hu H, Cai J, Chen R, Zuo X, Cheng H, et al. Machine learning for predicting the 3-year risk of incident diabetes in Chinese adults. Front Public Health. (2021) 9:626331. doi: 10.3389/fpubh.2021.626331
37. Silva GFS, Fagundes TP, Teixeira BC, Chiavegatto Filho ADP. Machine learning for hypertension prediction: a systematic review. Curr Hypertens Rep. (2022) 24:523–33. doi: 10.1007/s11906-022-01212-6
38. Mariūnas M, Kuzborska Z. Influence of load magnitude and duration on the relationship between human arterial blood pressure and flow rate. Acta Bioeng Biomech. (2011) 13(2):67–72.
39. Song P, Fang Z, Wang H, Cai Y, Rahimi K, Zhu Y, et al. Global and regional prevalence, burden, and risk factors for carotid atherosclerosis: a systematic review, meta-analysis, and modelling study. Lancet Glob Health. (2020) 8:e721–9. doi: 10.1016/s2214-109x(20)30117-0
40. Mehta S, Srivastava N, Bhatia A, Dhawan V. Exposure of cigarette smoke condensate activates NLRP3 inflammasome in vitro and in vivo: a connotation of innate immunity and atherosclerosis. Int Immunopharmacol. (2020) 84:106561. doi: 10.1016/j.intimp.2020.106561
41. Jones MR, Magid HSA, Al-Rifai M, McEvoy JW, Kaufman JD, Hinckley Stukovsky K, et al. Secondhand smoke exposure and subclinical cardiovascular disease: the multi-ethnic study of atherosclerosis. J Am Heart Assoc Cardiovasc Cerebrovasc Dis. (2016) 5:12. doi: 10.1161/JAHA.115.002965
42. Kohsaka S, Jin Z, Rundek T, Homma S, Sacco RL, Di Tullio MR. Alcohol consumption and atherosclerotic burden in the proximal thoracic aorta. Atherosclerosis. (2011) 219(2):794–8. doi: 10.1016/j.atherosclerosis.2011.07.129
43. Guo B, Shi Z, Zhang W, Zhao H, He K, Hu X, et al. Trajectories of body mass index (BMI) and hypertension risk among middle-aged and elderly Chinese people. J Hum Hypertens. (2020) 35:537–45. doi: 10.1038/s41371-020-0368-7
44. Wiewióra M, Krzak A, Twardzik M, Piecuch J. Obesity, blood rheology and angiogenesis. Clin Hemorheol Microcirc. (2018) 69(3):339–42. doi: 10.3233/CH-170348
45. Dangardt F, Charakida M, Georgiopoulos G, Chiesa ST, Rapala A, Wade KH, et al. Association between fat mass through adolescence and arterial stiffness: a population-based study from the avon longitudinal study of parents and children. Lancet Child Adolesc Health. (2019) 3:474–81. doi: 10.1016/S2352-4642(19)30105-1
46. Rovella V, Anemona L, Cardellini M, Scimeca M, Saggini A, Santeusanio G, et al. The role of obesity in carotid plaque instability: interaction with age, gender, and cardiovascular risk factors. Cardiovasc Diabetol. (2018) 17:46. doi: 10.1186/s12933-018-0685-0
Keywords: machine learning, prediction model, carotid plaque, shap, cardiovascular disease
Citation: Bin C, Li Q, Tang J, Dai C, Jiang T, Xie X, Qiu M, Chen L and Yang S (2023) Machine learning models for predicting the risk factor of carotid plaque in cardiovascular disease. Front. Cardiovasc. Med. 10:1178782. doi: 10.3389/fcvm.2023.1178782
Received: 6 March 2023; Accepted: 12 September 2023;
Published: 22 September 2023.
Edited by:
Speranza Rubattu, Sapienza University of Rome, ItalyReviewed by:
Saijun Zhou, Tianjin Medical University, ChinaAbhinav Grover, Medical College of Wisconsin, United States
Yuqing Xu, Zhejiang University, China
© 2023 Bin, Li, Tang, Dai, Jiang, Xie, Qiu, Chen and Yang. This is an open-access article distributed under the terms of the Creative Commons Attribution License (CC BY). The use, distribution or reproduction in other forums is permitted, provided the original author(s) and the copyright owner(s) are credited and that the original publication in this journal is cited, in accordance with accepted academic practice. No use, distribution or reproduction is permitted which does not comply with these terms.
*Correspondence: Shaorong Yang w201606202008@163.com