Computational clustering reveals differentiated coronary artery calcium progression at prevalent levels of pulse wave velocity by classifying high-risk patients
 Maximo Rousseau-Portalis
 Leandro Cymberknop1
  Ricardo Armentano
- 1Bioengineering Research and Development Group, National Technological University, Buenos Aires, Argentina
- 2Department of Internal Medicine, Italian Hospital of Buenos Aires, Buenos Aires, Argentina
- 3Departamento de Ingeniería Biológica, CENUR Litoral Norte, Universidad de la República, Paysandú, Uruguay
Many studies found that increased arterial stiffness is significantly associated with the presence and progression of Coronary Calcium Score (CCS). However, none so far have used machine learning algorithms to improve their value. Therefore, this study aims to evaluate the association between carotid-femoral Pulse Wave Velocity (cfPWV) and CCS score through computational clustering. We conducted a retrospective cross-sectional study using data from a cardiovascular risk screening program that included 377 participants. We used an unsupervised clustering algorithm using age, weight, height, blood pressure, heart rate, and cfPWV as input variables. Differences between cluster groups were analyzed through Chi-square and T-student tests. The association between (i) cfPWV and age groups, (ii) log (CCS) and age groups, and (iii) cfPWV and log(CCS) were addressed through linear regression analysis. Clusters were labeled post hoc based on cardiovascular risk. A “higher-risk group” had significantly higher left (0.76 vs. 0.70 mm, P < 0.001) and right (0.71 vs. 0.66 mm, P = 0.003) intima-media thickness, CCS (42 vs. 4 Agatston units, P = 0.012), and ascending (3.40 vs. 3.20 cm, P < 0.001) and descending (2.60 vs. 2.37 cm, P < 0.001) aorta diameters. Association with age appeared linear for cfPWV and exponential for log (CCS). The progression of the log (CCS) and cfPWV through age groups was steeper in the “higher-risk group” than in the “lower-risk group”. cfPWV strongly correlated with CCS, and CCS progression over cfPWV differed among clusters. This finding could improve PWV as a “gate-keeper” of CCS testing and potentially enhance cardiovascular risk stratification.
1. Introduction
Cardiovascular disease (CVD), majorly through ischemic heart disease, remains the leading cause of death and reduced quality of life worldwide despite enormous advances in controlling blood pressure, diabetes, and hypercholesterolemia (1, 2). As cardiovascular risk stratification is crucial for preventing cardiovascular disease, physicians perform a risk assessment through calculators, such as SCORE, ACVD, WHO, and Framingham, based on traditional cardiovascular risk factors (CVRF) (i.e., sex, age, blood pressure, diabetes, smoking, LDL, HDL) (3).
Although highly useful in clinical practice, these cardiovascular risk estimates are not entirely accurate because traditional CVRFs do not fully explain cardiovascular events. Some studies show that approximately 50% of people do not have any CVRF but still have CVD (4). Moreover, a study showed that about two-thirds of patients undergoing coronary angiography to diagnose CVD had normal coronary arteries (5). Most risk scores have low sensitivity for detecting young individuals with increased absolute cardiovascular risk due to the preponderant effect of age on risk estimation (6, 7). The highest risk for inadequate classification arises mainly in intermediate-risk groups, where CVD prevention is crucial (8, 9).
Individuals with subclinical atherosclerosis have higher cardiovascular events and all-cause death rates (10). In this context, new parameters have been sought to assess cardiovascular risk in search of the variance unexplained by traditional CVRFs and detect subclinical vascular damage. Unlike primary prevention, this strategy permits timely detection of CVD, thus developing more effective and personalized strategies. Novel CVD biomarkers are varied and include biochemical [e.g., C-reactive protein, homocysteine, fibrinogen, lipoprotein(a)], imaging (e.g., coronary artery calcium, intima-media thickness), and biomechanical parameters (e.g., pulse wave velocity, brachial/ankle index, augmentation index) (9, 11–14).
The coronary calcium score (CCS), assessed through a CT scan, is the non-invasive method most commonly used to quantify coronary artery calcifications. CCS has emerged as a robust biomarker of coronary atherosclerosis, can localize lesions, and correlate with plaque burden and cardiovascular disease assessed by angiography (15–18). This method is a strong predictor of cardiovascular events (19) and is considered by ACC/AHA and the European Society of Cardiology for risk reclassification among patients with low to intermediate risk, i.e., a 10-year cardiovascular risk between 6% and 20% (20, 21). Coronary artery calcium scoring has superior discrimination and risk reclassification compared with other subclinical imaging markers or biomarkers (22). Moreover, the absence of coronary calcifications (CCS = 0) has a high negative predictive value for coronary stenosis and, therefore, helps identify individuals at low risk for an event (23). Some cardiovascular risk calculators, such as the MESA, include CCS to perform risk estimations and obtain the vascular age of patients (24). The application of this stratification tool is low despite international recommendations, probably due to its cost and radiation, limiting its availability in low-resource scenarios where cardiovascular risk reclassification of young adults may be needed the most (25).
Pulse wave velocity (PWV) has emerged as a non-invasive, simple, low-cost, reliable, and non-irradiating alternative for assessing subclinical vascular damage (26–28). PWV is a straightforward and tangible way of assessing arterial stiffness—the stiffer the artery, the higher PWV (27). Although there are several ways to measure PWV, carotid-femoral PWV (cfPWV) is the gold standard for assessing large artery stiffness as it has the most clinical evidence of predicting cardiovascular events (26, 27). PWV is a surrogate of CVD as it is a structural and functional marker of cumulative damage to central arteries (27, 29). It is a strong predictor of cardiovascular events (mainly coronary events) independently from traditional CVRFs in both clinical and community-based cohorts (30–33), improving model fit and reclassifying risk for future CVD events in models that include standard risk factors (13). Recently, many studies have used PWV to perform vascular age estimates and divide patients into different phenotypes of vascular aging (34, 35). Despite the existing evidence, there is no unique recommendation regarding PWV's role in risk stratification among international guidelines. In all, most guidelines agree that arterial stiffness may serve as a valuable marker to predict cardiovascular events, but many (especially occidental guidelines) do not recommend systematically measuring PWV in the general population (36).
On the other hand, we are currently witnessing a revolution in cardiology by accumulating large volumes of data from electronic health records, medical imaging data, clinical trials, biobanks, and wearable devices (37). In this regard, medical “Big Data” can nurture Machine Learning (ML, a branch of artificial intelligence) algorithms to differentiate structural and functional patterns embedded in multiple datasets, potentially reduce diagnostic and therapeutic errors, and improve timing, efficiency, and poor workflow (38, 39). Artificial intelligence (AI) has been a late entrant in healthcare (40), although its application has already spurred in many areas, including imaging (37), pathology (41), dermatology (42), and others (38). To date, there is a huge scope in ML algorithms in predicting cardiovascular disease, and there are several AI applications already cleared by the FDA (41).
One of the most used unsupervised learning algorithms is clustering. This ML technique allows subjects to be segregated into distinct groups without prior labeling. These models divide data into groups depending on the “similarity” between data points, which is particularly useful when there are no apparent patterns. Likewise, clustering may contribute to identifying novel biomarkers, disease subgroups, and predictors of clinical outcomes (43). Some studies show clinically relevant and practical applications of these models in cardiovascular medicine (44, 45).
As cardiovascular imaging rapidly grows and has a major cost counterpoint, AI may reduce the financial burden and improve value (37). As with other imaging studies, CCS appears to be an excellent candidate for artificial intelligence tools (46). Although less extensively explored, ML algorithms applied to PWV have demonstrated an improved testing value (47).
Multiple uses for ML algorithms have been proposed in cardiovascular medicine, but none so far have been used to evaluate the association between PWV and CCS. This approach may identify higher-risk individuals who would benefit most from a CCS assessment and avoid unnecessary costs and radiation associated with CT scans in patients with a low risk of presenting coronary disease. Therefore, this study aims to evaluate in a community-based cohort of patients the association between cfPWV and CCS through clustering.
2. Methods
2.1. Participants
We conducted a retrospective cross-sectional study on participants from a cardiovascular risk screening program that were assessed for demographic, anthropometric, laboratory, and hemodynamic variables related to CVD (48). Participants were included in this study if they had at least one of the following cardiovascular risk factors: advanced age, hypertension, hypercholesterolemia, type two diabetes mellitus, or being a current smoker. Participants were excluded if they lacked assessment of subclinical CVD by cfPWV and CCS and were also excluded those who had a known history of coronary heart disease or stroke.
2.2. Variables
The workflow and the gathering and definitions of variables are described in another study (48). Measurements of cfPWV (14) and CCS (49) are also described elsewhere. The cardiovascular risk at 10 years was estimated using the Framingham (50) and SCORE models (51) by entering age, total cholesterol, high-density lipoprotein (HDL) cholesterol, and systolic blood pressure as continuous variables and sex, diabetes, and current smoking as categorical variables (presence or absence).
2.3. Clustering
Subsequently, the data underwent cluster analysis. First, the data were normalized, allowing the variables to follow a uniform scale. Second, the principal component analysis technique was applied to reduce dimensionality, and third, the subjects' similarities were calculated in terms of distance measures between variables (Euclidean distance) using the k-means technique. The number of clusters was determined using the Silhouette coefficient. By this technique, we concluded that having two clusters was the most appropriate configuration (52).
The used model requires input variables to assign individuals into groups automatically. In this case, we chose variables relevant for a cardiovascular assessment that could be easily collected in a physician's office, adding the cfPWV. Therefore, age, weight, height, systolic and diastolic blood pressure, heart rate, and cfPWV were included to perform cluster analysis.
2.4. Statistical analysis
Numerical variables were summarized using mean and standard deviation for variables with a normal distribution and median and interquartile range for variables with a non-normal distribution. Normality was qualitatively assessed through histograms and formally assessed through the Shapiro-Wilk test. Categorical variables were summarized in percentages in each category. Bivariate analysis between cluster groups regarding categorical and numerical variables were performed using the chi-square test and T-student test, respectively. Furthermore, we stratified patients into age groups (<40, 40–49, 50–59, ≥60 years) to see the differences within the variables of interest among clusters and the entire sample and address this potential confounder. Using the mean values of each age group, we performed three exploratory linear regression models, including (i) cfPWV and age groups, (ii) the log transformation of CCS [log (CCS)] and age groups, and (iii) cfPWV and log (CCS). All hypothesis testing involved two-tailed tests with a significance level of α = 0.05 and a power of 1-β = 80% were performed in the free open-source R program version 4.0.2.
2.5. Ethics
The study was conducted following the principles of the Declaration of Helsinki, and the ethics committee of the Bioengineering Research and Development Group of the National Technological University of Buenos Aires, Argentina, approved this study.
3. Results
377 individuals from the screening program were finally included in the study. Table 1 describes the overall characteristics of patients and their segregation into clusters. Clusters were labeled after the clustering analysis based on their cardiovascular risk differences through Framingham and SCORE in a “higher-risk group” and a “lower-risk group”. Regarding output variables only, we found that the “higher-risk group” had significantly higher left (0.76 vs. 0.70 mm, P < 0.001) and right (0.71 vs. 0.66 mm, P = 0.003) IMT, CCS (42 vs. 4 Agatston units, P = 0.012), ascending (3.40 vs. 3.20 cm, P < 0.001) and descending (2.60 vs. 2.37 cm, P < 0.001) aorta diameters, and Framingham (P < 0.001) and SCORE (P = 0.003) 10-year risk estimators than the “lower-risk group”.

Table 1. General characteristics and segregation of individuals through clusteringa.
To weigh the benefit of including arterial stiffness in the model, we performed a sensitivity analysis without cfPWV as an input variable. We found that the latter model underperformed the original model regarding CCS, IMT, and cardiovascular risk discrimination (see Supplementary Material S1).
We found a significant difference in cfPWV and CCS among age groups, where cfPWV and CCS increased with age in the “lower-risk group”, the “higher-risk group”, and the entire sample (see Supplementary Material S2).
Through a linear regression, we found that the progression of PWV and CCS over age differed significantly among clusters, being steeper for the “higher-risk group” compared with the “lower-risk group”. This association with age appeared as linear for cfPWV (Figure 1A) and exponential (Figure 1B) for log (CCS). We also found that the association between cfPWV and CCS differed significantly between clusters, where the linear trends in PWV and CCS progression over age change depending on the assigned cluster group. The progression of the log (CCS) and cfPWV through age groups was steeper in the “higher-risk group” than in the “lower-risk group”. Moreover, we found that the cfPWV of the cluster centroid belonging to the “higher-risk group” was 12 m/s compared to 9.5 m/s from the centroid belonging to the “lower-risk group” (Figure 1C).
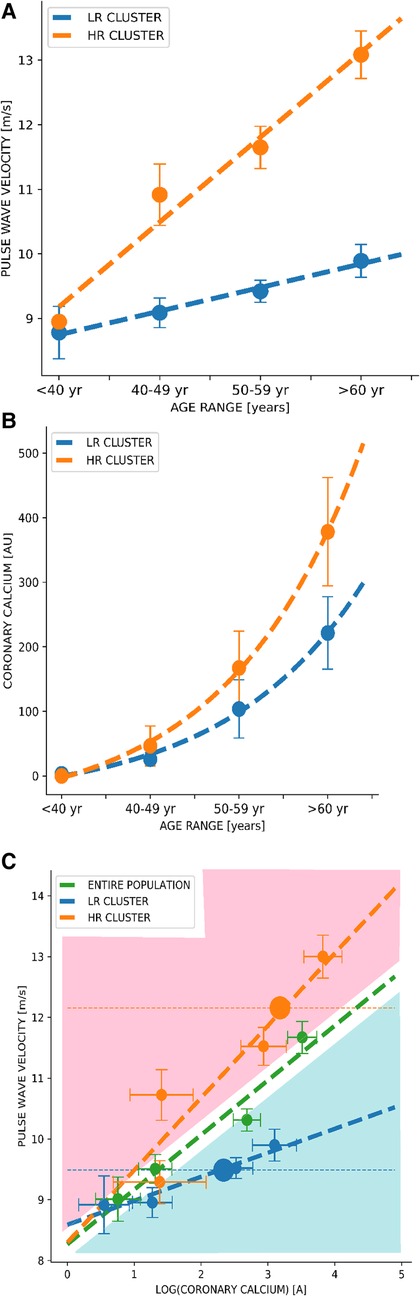
Figure 1. Dynamics of pulse wave velocity vs. coronary artery calcium curves through clustering among age groups. (A) Correlation between Pulse Wave Velocity and age groups. (B) Correlation between Coronary Calcium Score and age groups. (C) Correlation between Pulse Wave Velocity and Coronary Calcium Score. Green curves correspond to the analysis of the entire population, and blue and orange curves correspond to the lower-risk and higher-risk groups, respectively. Values are shown as the mean (dots) and 95% confidence interval (bars). A, Agatston units; m/s, meters per second; yr, years; LR cluster, lower-risk cluster; HR cluster, higher-risk cluster.
4. Discussion
In a sample of adults included in a cardiovascular screening program, we found that a clustering algorithm—only using age, weight, height, systolic and diastolic blood pressure, heart rate, and cfPWV as input variables—separated the cohort into two differentiated groups, in terms of traditional cardiovascular risk factor scores (i.e., Framingham, SCORE) and subclinical cardiovascular disease parameters. Basically, one group showed higher cardiovascular risk, greater intima-media thickness, higher CCS score, greater aorta diameter, and, as expected, higher cfPWV (consequently named “higher-risk group”). Moreover, CCS progression over cfPWV differed among clusters. The “higher-risk group” had a steeper trend in the progression of cfPWV and CCS over age and cfPWV over CCS compared to the cluster named “lower-risk group” (Figure 1C). We also found that the cfPWV of the cluster centroid belonging to the “higher-risk group” was 12 m/s compared to 9.5 m/s from the centroid belonging to the “lower-risk group”. Concerning the latter, it is interesting to point out that the Korean (53) and Japanese (54) guidelines consider a cfPWV >10 m/s as an indicator of subclinical organ damage.
Our first finding is that cfPWV correlated well with CCS. Kim et al. (26) have broadly reviewed in their paper on “Pulse Wave Velocity in Atherosclerosis” the body of evidence exploring the association between PWV and CCS as a surrogate of coronary atherosclerosis. Studies found that increased arterial stiffness is significantly associated with both the presence and progression of CCS. This association has been replicated in community-based cohorts undergoing health check-ups (55–59), patients with type two diabetes (60, 61), and with suspected coronary artery disease undergoing coronary angiography (62). Despite cfPWV being the gold standard, most studies have used baPWV, probably due to the preponderance of Asian evidence, where baPWV is most commonly used (63). Regardless of demonstrating causality—which is challenging due to scarce longitudinal studies (26, 55)—the proxy for this finding is identifying individuals with increased arterial stiffness and thereby increased likelihood of presenting coronary calcifications. In this way, PWV may be a “gate-keeper” for CCS testing and reduce the costs and radiation associated with CCS measurement (27). Our results align with current evidence concerning the strong association between PWV and coronary atherosclerosis. However, our novel approach suggests that running the data through clustering reveals two different laws in the association of PWV and CCS.
Arterial stiffness is one of the earliest markers of atherosclerosis and vascular aging (29, 64) and can be accelerated by other cardiovascular risk factors (65). From a physiopathology standpoint, atherosclerosis and arteriosclerosis appear to be the underlying processes behind CCS and PWV changes, respectively. There are common risk factors (e.g., hypertension, dyslipidemia, diabetes, smoking) among them, and their pathologic mechanisms appear to overlap (66). Arterial stiffness involves changes in the extracellular matrix, including elastin degradation and collagen deposition, leading to atherosclerosis (65). Vascular remodeling in the presence of increased stiffness could predispose to calcification of the intima and media layer (67) and increased wall shear stress and afterload hence triggering a pathophysiological cascade leading to atherosclerosis and plaque rupture (68) and cardiac remodeling (27, 55). Moreover, arterial stiffness reduces the buffering in the aortic trunk that helps maintain coronary flow during diastole, further limiting coronary perfusion in an occluded lumen (69). In turn, atherosclerosis generates endothelial dysfunction and structural wall changes, increasing arterial stiffness (70).
We are currently seeing a paradigm shift from population-based care into the precision medicine era (39). AI, through ML methods, could help achieve a “personalized” medicine by summarizing enormous quantities of medical information rather than a rigidly defined “one-size-fits-all” algorithm commonly seen in everyday physician practice (38). The advantages of AI tools include freedom from statistical assumptions, exploring multiple hidden patterns, and learning independently (71, 72). These features could revolutionize healthcare and offer the potential for earlier detection of disease, improved diagnostic accuracy, and more accurate prognosis and disease severity prediction to guide optimal management (73, 74).
Although this is the first time cfPWV and CCS association using ML algorithms has been evaluated, there are applications already used for these parameters individually. Automatic and semi-automatic AI-based methods correlate robustly with traditional CCS computation methods but consume less time and resources (75). For example, Motwani et al. developed an ML model that outperformed the Framingham risk score and computed tomography coronary calcification angiography (CTCA) severity risk scores to predict 5-year all-cause mortality in patients who underwent CTCA (76). Also, “Zebra Medical Vision” has recently acquired an FDA clearance for an AI-based tool to assess cardiovascular risk in patients based on coronary artery calcium (77, 78). As for PWV, Vallée et al. found the PWV index as the main factor for predicting coronary heart disease through decision tree models (79). Also, they created artificial neural network models, which included the PWV index that accurately predicted coronary heart disease (80).
By having access to the machine learning algorithm used in this study and cfPWV assessment, one could automatically determine the patient cluster assignment. However, for cases where individual patients are not included in the algorithm, the complementary method for clinical use is proposed:
Physicians could manually determine cluster assignment using patients' cfPWV and cfPWV vs. age curves generated by the system (Figure 1A). Given the patient's age and cfPWV values, we can fix—as in a nomogram—where the point falls and thus graphically assign a cluster without necessarily including the patient in the system. If cfPWV value falls below the curve corresponding to the general population (blue area), the patient could be assigned to the “lower-risk group”, and if it falls upwards (red area), it could be assigned to the “higher-risk group”. Subsequently, we could estimate the patients' PWV progression based on the assigned cluster and graphically estimate patients' coronary calcium based on the assigned cluster and on the log (CCS) vs. age curves (Figure 1B). Thus, considering the patient's comorbidities, lifestyle, and measurement of cfPWV, physicians can use CCS prediction curves and—depending on the clustering group assignment—evaluate the necessity of ratifying calcium values through a CT scan. Through this clustering algorithm, we could generate new curves every year by analyzing different populations with cfPWV and CCS measurements to improve stratification.
The proposed method may enhance the usefulness of subclinical vascular damage screening tools and aid the commonly challenging decision of starting pharmacological therapy (i.e., statins). It should be mentioned that the cardiovascular risk assessment carried out in this study does not aim to replace traditional risk scores, but instead be a complement in scenarios where PVW and (eventually) CCS might be available. Therefore, mid-age patients who have already been evaluated by multivariate risk models such as SCORE or Framingham and have borderline 10-year cardiovascular risk (81) or young individuals where risk scores underestimate cardiovascular risk and need direct subclinical disease assessment might benefit from this proposal (82).
Despite our study findings, we must acknowledge its limitations. First, inclusion criteria and clustering models were generated using retrospective data from a single center, limiting the external validity of results to other areas. Secondly, machine learning algorithms nurture themselves from Big Data and most often need an enormous quantity of info to take advantage of its usefulness. In this study, we only had a small quantity of data in terms of model generation, which increases the uncertainty of the trends shown. Third, clustering algorithms are dependent on the initial cluster pattern. Therefore, the method should be reproduced in other cohorts to address this potential bias to archive robust conclusions about this methodology (83).
Applying this ML tool may extend the usage of PWV and CCS in clinical practice and help reduce the global burden of CVD. Nevertheless, these preliminary findings warrant validation by more extensive and heterogeneous patient cohorts to elucidate the benefit of clustering and explore the benefits of other ML algorithms in PWV and CCS association.
5. Conclusions
This paper sought to illustrate the state-of-the-art of two subclinical vascular damage parameters and how their use may be enhanced through ML goggles. We found that a clustering algorithm segregated CCS progression over cfPWV into two groups of patients with divergent subclinical vascular disease. By these findings, we intend to identify a higher-risk cluster with a higher probability of detecting coronary artery disease by CCS and saving cost and radiation in patients belonging to a lower-risk cluster. In all, this finding could improve PWV as a “gate-keeper” of CCS testing and potentially enhance patient stratification.
Data availability statement
The data analyzed in this study is subject to the following licenses/restrictions: If necessary datasets and results may be provided to confirm results. Requests to access these datasets should be directed to Maximo Rousseau-Portalis, mrousseauportalis@frba.utn.edu.ar.
Ethics statement
The studies involving human participants were reviewed and approved by Bioengineering Research and Development Group of the National Technological University of Buenos Aires, Argentina. The patients/participants provided their written informed consent to participate in this study.
Author contributions
MR-P: study planning, data analysis, and manuscript writing, and manuscript review. IF: data analysis and manuscript review. LC: study planning, data analysis, and manuscript review. RA: study planning, data analysis, manuscript review. All authors contributed to the article and approved the submitted version.
Conflict of interest
The authors declare that the research was conducted in the absence of any commercial or financial relationships that could be construed as a potential conflict of interest.
Publisher's note
All claims expressed in this article are solely those of the authors and do not necessarily represent those of their affiliated organizations, or those of the publisher, the editors and the reviewers. Any product that may be evaluated in this article, or claim that may be made by its manufacturer, is not guaranteed or endorsed by the publisher.
Supplementary material
The Supplementary Material for this article can be found online at: https://www.frontiersin.org/articles/10.3389/fcvm.2023.1161914/full#supplementary-material.
References
1. Roth GA, Mensah GA, Johnson CO, Addolorato G, Ammirati E, Baddour LM, et al. Global burden of cardiovascular diseases and risk factors, 1990–2019: update from the GBD 2019 study. J Am Coll Cardiol. (2020) 76:2982–3021. doi: 10.1016/j.jacc.2020.11.010
2. Vos T, Lim SS, Abbafati C, Abbas KM, Abbasi M, Abbasifard M, et al. Global burden of 369 diseases and injuries in 204 countries and territories, 1990–2019: a systematic analysis for the global burden of disease study 2019. Lancet. (2020) 396:1204–22. doi: 10.1016/S0140-6736(20)30925-9
3. Mach F, Baigent C, Catapano AL, Koskinas KC, Casula M, Badimon L, et al. 2019 ESC/EAS guidelines for the management of dyslipidaemias: lipid modification to reduce cardiovascular risk: the task force for the management of dyslipidaemias of the European society of cardiology (ESC) and European atherosclerosis society (EAS). Eur Heart J. (2020) 41:111–88. doi: 10.1093/eurheartj/ehz455
4. Hennekens CH. Increasing burden of cardiovascular disease. Circulation. (1998) 97:1095–102. doi: 10.1161/01.CIR.97.11.1095
5. Patel MR, Peterson ED, Dai D, Brennan JM, Redberg RF, Anderson HV, et al. Low diagnostic yield of elective coronary angiography. N Engl J Med. (2010) 362:886–95. doi: 10.1056/NEJMoa0907272
6. Michos ED, Nasir K, Braunstein JB, Rumberger JA, Budoff MJ, Post WS, et al. Framingham risk equation underestimates subclinical atherosclerosis risk in asymptomatic women. Atherosclerosis. (2006) 184:201–6. doi: 10.1016/j.atherosclerosis.2005.04.004
7. Akosah KO, Schaper A, Cogbill C, Schoenfeld P. Preventing myocardial infarction in the young adult in the first place: how do the national cholesterol education panel iii guidelines perform? J Am Coll Cardiol. (2003) 41:1475–9. doi: 10.1016/S0735-1097(03)00187-6
8. Goff DC, Lloyd-Jones Donald M, Bennett G, Coady S, D‘Agostino RB, Gibbons R, et al. 2013 ACC/AHA guideline on the assessment of cardiovascular risk. J Am Coll Cardiol. (2014) 63:2935–59. doi: 10.1016/j.jacc.2013.11.005
9. US Preventive Services Task Force. Risk assessment for cardiovascular disease with nontraditional risk factors: US preventive services task force recommendation statement. J Am Med Assoc. (2018) 320:272–80. doi: 10.1001/jama.2018.8359
10. Ahmadi A, Argulian E, Leipsic J, Newby DE, Narula J. From subclinical atherosclerosis to plaque progression and acute coronary events: JACC state-of-the-art review. J Am Coll Cardiol. (2019) 74:1608–17. doi: 10.1016/j.jacc.2019.08.012
11. Hackam DG, Anand SS. Emerging risk factors for atherosclerotic vascular disease a critical review of the evidence. J Am Med Assoc. (2003) 290:932–40. doi: 10.1001/jama.290.7.932
12. Serra R, Ielapi N, Barbetta A, Andreucci M, de Franciscis S. Novel biomarkers for cardiovascular risk. Biomark Med. (2018) 12:1015–24. doi: 10.2217/bmm-2018-0056
13. Ben-Shlomo Y, Spears M, Boustred C, May M, Anderson SG, Benjamin EJ, et al. Aortic pulse wave velocity improves cardiovascular event prediction. J Am Coll Cardiol. (2014) 63:636–46. doi: 10.1016/j.jacc.2013.09.063
14. Santana DB, Zócalo YA, Ventura IF, Arrosa JFT, Florio L, Lluberas R, et al. Health informatics design for assisted diagnosis of subclinical atherosclerosis, structural, and functional arterial age calculus and patient-specific cardiovascular risk evaluation. IEEE Trans Inf Technol Biomed. (2012) 16:943–51. doi: 10.1109/TITB.2012.2190990
15. Stolzmann P, Alkadhi H, Scheffel H, Plass A, Leschka S, Falk V, et al. Combining cardiac magnetic resonance and computed tomography coronary calcium scoring: added value for the assessment of morphological coronary disease? Int J Cardiovasc Imaging. (2011) 27:969–77. doi: 10.1007/s10554-010-9738-5
16. Budoff MJ, Nasir K, McClelland RL, Detrano R, Wong N, Blumenthal RS, et al. Coronary calcium predicts events better with absolute calcium scores than age-sex-race/ethnicity percentiles. J Am Coll Cardiol. (2009) 53:345–52. doi: 10.1016/j.jacc.2008.07.072
17. Rumberger JA, Schwartz RS, Simons DB, Sheedy PF, Edwards WD, Fitzpatrick LA. Relation of coronary calcium determined by electron beam computed tomography and lumen narrowing determined by autopsy. Am J Cardiol. (1994) 73:1169–73. doi: 10.1016/0002-9149(94)90176-7
18. Arad Y, Spadaro LA, Goodman K, Newstein D, Guerci AD. Prediction of coronary events with electron beam computed tomography. J Am Coll Cardiol. (2000) 36:1253–60. doi: 10.1016/S0735-1097(00)00872-X
19. Hadamitzky M, Freissmuth B, Meyer T, Hein F, Kastrati A, Martinoff S, et al. Prognostic value of coronary computed tomographic angiography for prediction of cardiac events in patients with suspected coronary artery disease. JACC Cardiovasc Imaging. (2009) 2:404–11. doi: 10.1016/j.jcmg.2008.11.015
20. Arnett DK, Blumenthal RS, Albert MA, Buroker AB, Goldberger ZD, Hahn EJ, et al. 2019 ACC/AHA guideline on the primary prevention of cardiovascular disease: a report of the American college of cardiology/American heart association task force on clinical practice guidelines. Circulation. (2019) 140:e596–646. doi: 10.1161/CIR.0000000000000678
21. Piepoli MF, Hoes AW, Agewall S, Albus C, Brotons C, Catapano AL, et al. 2016 European guidelines on cardiovascular disease prevention in clinical practice: the sixth joint task force of the European society of cardiology and other societies on cardiovascular disease prevention in clinical practice (constituted by representatives of 10 societies and by invited experts)developed with the special contribution of the European association for cardiovascular prevention & rehabilitation (EACPR). Eur Heart J. (2016) 37:2315–81. doi: 10.1093/eurheartj/ehw106
22. Yeboah J, Young R, McClelland RL, Delaney JC, Polonsky TS, Dawood FZ, et al. Utility of nontraditional risk markers in atherosclerotic cardiovascular disease risk assessment. J Am Coll Cardiol. (2016) 67:139–47. doi: 10.1016/j.jacc.2015.10.058
23. Haberl R, Becker A, Leber A, Knez A, Becker C, Lang C, et al. Correlation of coronary calcification and angiographically documented stenoses in patients with suspected coronary artery disease: results of 1,764 patients. J Am Coll Cardiol. (2001) 37:451–7. doi: 10.1016/S0735-1097(00)01119-0
24. Blaha MJ, Naazie IN, Cainzos-Achirica M, Dardari ZA, DeFilippis AP, McClelland RL, et al. Derivation of a coronary age calculator using traditional risk factors and coronary artery calcium: the multi-ethnic study of atherosclerosis. J Am Heart Assoc. (2021) 10:e019351. doi: 10.1161/JAHA.120.019351
25. Al-Kindi Sadeer G, Costa M, Tashtish N, Duriuex J, Zidar D, Rashid I, et al. No-charge coronary artery calcium screening for cardiovascular risk assessment. J Am Coll Cardiol. (2020) 76:1259–62. doi: 10.1016/j.jacc.2020.06.077
26. Kim H-L, Kim S-H. Pulse wave velocity in atherosclerosis. Front Cardiovasc Med. (2019) 6:41. doi: 10.3389/fcvm.2019.00041
27. Chirinos JA, Segers P, Hughes T, Townsend R. Large-artery stiffness in health and disease. J Am Coll Cardiol. (2019) 74:1237–63. doi: 10.1016/j.jacc.2019.07.012
28. Munakata M. Brachial-ankle pulse wave velocity in the measurement of arterial stiffness: recent evidence and clinical applications. Curr Hypertens Rev. (2014) 10:49–57. doi: 10.2174/157340211001141111160957
29. Cohn JN, Quyyumi AA, Hollenberg NK, Jamerson KA. Surrogate markers for cardiovascular disease. Circulation. (2004) 109:IV31–46. doi: 10.1161/01.CIR.0000133442.99186.39
30. Vlachopoulos C, Aznaouridis K, Stefanadis C. Prediction of cardiovascular events and all-cause mortality with arterial stiffness. J Am Coll Cardiol. (2010) 55:1318–27. doi: 10.1016/j.jacc.2009.10.061
31. Mattace-Raso FUS, van der Cammen TJM, Hofman A, van Popele NM, Bos ML, Schalekamp MADH, et al. Arterial stiffness and risk of coronary heart disease and stroke. Circulation. (2006) 113:657–63. doi: 10.1161/CIRCULATIONAHA.105.555235
32. Mitchell GF, Hwang S-J, Vasan RS, Larson MG, Pencina MJ, Hamburg NM, et al. Arterial stiffness and cardiovascular events. Circulation. (2010) 121:505–11. doi: 10.1161/CIRCULATIONAHA.109.886655
33. Sutton-Tyrrell K, Najjar SS, Boudreau RM, Venkitachalam L, Kupelian V, Simonsick EM, et al. Elevated aortic pulse wave velocity, a marker of arterial stiffness, predicts cardiovascular events in well-functioning older adults. Circulation. (2005) 111:3384–90. doi: 10.1161/CIRCULATIONAHA.104.483628
34. Bruno RM, Nilsson PM, Engström G, Wadström BN, Empana J-P, Boutouyrie P, et al. Early and supernormal vascular aging. Hypertension. (2020) 76:1616–24. doi: 10.1161/HYPERTENSIONAHA.120.14971
35. Nilsson Wadström B, Engström G, Nilsson PM. Exploring and comparing definitions of healthy vascular ageing in the population: characteristics and prospective cardiovascular risk. J Hum Hypertens. (2021) 35:428–36. doi: 10.1038/s41371-020-0353-1
36. Rey-García J, Townsend RR. Large artery stiffness: a companion to the 2015 AHA science statement on arterial stiffness. Pulse. (2021) 9:1–10. doi: 10.1159/000518613
37. Dey D, Slomka PJ, Leeson P, Comaniciu D, Shrestha S, Sengupta PP, et al. Artificial intelligence in cardiovascular imaging. J Am Coll Cardiol. (2019) 73:1317–35. doi: 10.1016/j.jacc.2018.12.054
38. Buch VH, Ahmed I, Maruthappu M. Artificial intelligence in medicine: current trends and future possibilities. Br J Gen Pract. (2018) 68:143–4. doi: 10.3399/bjgp18X695213
39. Haq I-U, Haq I, Xu B. Artificial intelligence in personalized cardiovascular medicine and cardiovascular imaging. Cardiovasc Diagn Ther. (2021) 11:91123–923. doi: 10.21037/cdt.2020.03.09
40. Topol EJ. High-performance medicine: the convergence of human and artificial intelligence. Nat Med. (2019) 25:44–56. doi: 10.1038/s41591-018-0300-7
41. Serag A, Ion-Margineanu A, Qureshi H, McMillan R, Saint Martin M-J, Diamond J, et al. Translational AI and deep learning in diagnostic pathology. Front Med. (2019) 6:185. doi: 10.3389/fmed.2019.00185
42. Han SS, Kim MS, Lim W, Park GH, Park I, Chang SE. Classification of the clinical images for benign and malignant cutaneous tumors using a deep learning algorithm. J Invest Dermatol. (2018) 138:1529–38. doi: 10.1016/j.jid.2018.01.028
43. Quer G, Arnaout R, Henne M, Arnaout R. Machine learning and the future of cardiovascular care. J Am Coll Cardiol. (2021) 77:300–13. doi: 10.1016/j.jacc.2020.11.030
44. Luo Y, Ahmad FS, Shah SJ. Tensor factorization for precision medicine in heart failure with preserved ejection fraction. J Cardiovasc Transl Res. (2017) 10:305–12. doi: 10.1007/s12265-016-9727-8
45. Katz DH, Deo RC, Aguilar FG, Selvaraj S, Martinez EE, Beussink-Nelson L, et al. Phenomapping for the identification of hypertensive patients with the myocardial substrate for heart failure with preserved ejection fraction. J Cardiovasc Transl Res. (2017) 10:275–84. doi: 10.1007/s12265-017-9739-z
46. Hardy M, Harvey H. Artificial intelligence in diagnostic imaging: impact on the radiography profession. Br J Radiol. (2020) 93:20190840. doi: 10.1259/bjr.20190840
47. Vallée A, Cinaud A, Protogerou A, Zhang Y, Topouchian J, Safar ME, et al. Arterial stiffness and coronary ischemia: new aspects and paradigms. Curr Hypertens Rep. (2020) 22:5. doi: 10.1007/s11906-019-1006-z
48. Chironi G, Orobinskaia L, Mégnien J-L, Sirieix M-E, Clément-Guinaudeau S, Bensalah M, et al. Early thoracic aorta enlargement in asymptomatic individuals at risk for cardiovascular disease: determinant factors and clinical implication. J Hypertens. (2010) 28:2134–8. doi: 10.1097/HJH.0b013e32833cd276
49. Agatston AS, Janowitz WR, Hildner FJ, Zusmer NR, Viamonte M, Detrano R. Quantification of coronary artery calcium using ultrafast computed tomography. J Am Coll Cardiol. (1990) 15:827–32. doi: 10.1016/0735-1097(90)90282-T
50. D’Agostino RB, Vasan RS, Pencina MJ, Wolf PA, Cobain M, Massaro JM, et al. General cardiovascular risk profile for use in primary care. Circulation. (2008) 117:743–53. doi: 10.1161/CIRCULATIONAHA.107.699579
51. Conroy RM, Pyörälä K, Fitzgerald AP, Sans S, Menotti A, De Backer G, et al. Estimation of ten-year risk of fatal cardiovascular disease in Europe: the SCORE project. Eur Heart J. (2003) 24:987–1003. doi: 10.1016/S0195-668X(03)00114-3
52. Omar AMS, Ramirez R, Haddadin F, Sabharwal B, Khandaker M, Patel Y, et al. Unsupervised clustering for phenotypic stratification of clinical, demographic, and stress attributes of cardiac risk in patients with nonischemic exercise stress echocardiography. Echocardiography. (2020) 37:505–19. doi: 10.1111/echo.14638
53. Kim HC, Ihm S-H, Kim G-H, Kim JH, Kim K, Lee H-Y, et al. 2018 Korean society of hypertension guidelines for the management of hypertension: part I-epidemiology of hypertension. Clin Hypertens. (2019) 25:16. doi: 10.1186/s40885-019-0121-0
54. Umemura S, Arima H, Arima S, Asayama K, Dohi Y, Hirooka Y, et al. The Japanese society of hypertension guidelines for the management of hypertension (JSH 2019). Hypertens Res. (2019) 42:1235–481. doi: 10.1038/s41440-019-0284-9
55. Lee J-Y, Ryu S, Lee SH, Kim BJ, Kim B-S, Kang J-H, et al. Association between brachial-ankle pulse wave velocity and progression of coronary artery calcium: a prospective cohort study. Cardiovasc Diabetol. (2015) 14:147. doi: 10.1186/s12933-015-0311-3
56. Vishnu A, Choo J, Wilcox B, Hisamatsu T, Barinas-Mitchell EJM, Fujiyoshi A, et al. Brachial-ankle pulse wave velocity is associated with coronary calcification among 1131 healthy middle-aged men. Int J Cardiol. (2015) 189:67–72. doi: 10.1016/j.ijcard.2015.04.020
57. Torii S, Arima H, Ohkubo T, Fujiyoshi A, Kadota A, Takashima N, et al. Association between pulse wave velocity and coronary artery calcification in Japanese men. J Atheroscler Thromb. (2015) 22(12):1266–77. doi: 10.5551/jat.30247
58. Cainzos-Achirica M, Rampal S, Chang Y, Ryu S, Zhang Y, Zhao D, et al. Brachial-ankle pulse wave velocity is associated with coronary calcium in young and middle-aged asymptomatic adults: the kangbuk samsung health study. Atherosclerosis. (2015) 241:350–6. doi: 10.1016/j.atherosclerosis.2015.05.031
59. Nam H-J, Jung IH, Kim J, Kim JH, Suh J, Kim HS, et al. Association between brachial-ankle pulse wave velocity and occult coronary artery disease detected by multi-detector computed tomography. Int J Cardiol. (2012) 157:227–32. doi: 10.1016/j.ijcard.2011.01.045
60. Kim BH, Jang JS, Kwon YS, Kim JH, Kim IJ, Lee CW. High brachial ankle pulse wave velocity as a marker for predicting coronary artery stenosis in patients with type 2 diabetes. Endocrinol Metab. (2018) 33:88–96. doi: 10.3803/EnM.2018.33.1.88
61. Funck KL, Laugesen E, Øvrehus K, Jensen JM, Nørgaard BL, Dey D, et al. Increased high-risk coronary plaque burden is associated with arterial stiffness in patients with type 2 diabetes without clinical signs of coronary artery disease: a computed tomography angiography study. J Hypertens. (2017) 35:1235–43. doi: 10.1097/HJH.0000000000001308
62. Kim H-L, Jin KN, Seo J-B, Choi YH, Chung W-Y, Kim S-H, et al. The association of brachial-ankle pulse wave velocity with coronary artery disease evaluated by coronary computed tomography angiography. PLoS One. (2015) 10:e0123164. doi: 10.1371/journal.pone.0123164
63. Vlachopoulos C, Xaplanteris P, Aboyans V, Brodmann M, Cífková R, Cosentino F, et al. The role of vascular biomarkers for primary and secondary prevention. A position paper from the European society of cardiology working group on peripheral circulation: endorsed by the association for research into arterial structure and physiology (ARTERY) society. Atherosclerosis. (2015) 241:507–32. doi: 10.1016/j.atherosclerosis.2015.05.007
64. Cavalcante JL, Lima JAC, Redheuil A, Al-Mallah Mouaz H. Aortic stiffness: current understanding and future directions. J Am Coll Cardiol. (2011) 57:1511–22. doi: 10.1016/j.jacc.2010.12.017
65. Zieman SJ, Melenovsky V, Kass DA. Mechanisms, pathophysiology, and therapy of arterial stiffness. Arterioscler Thromb Vasc Biol. (2005) 25:932–43. doi: 10.1161/01.ATV.0000160548.78317.29
66. Palombo C, Kozakova M. Arterial stiffness, atherosclerosis and cardiovascular risk: pathophysiologic mechanisms and emerging clinical indications. Vascul Pharmacol. (2016) 77:1–7. doi: 10.1016/j.vph.2015.11.083
67. Rattazzi M, Bertacco E, Puato M, Faggin E, Pauletto P. Hypertension and vascular calcification: a vicious cycle? J Hypertens. (2012) 30:1885–93. doi: 10.1097/HJH.0b013e328356c257
68. Witteman JCM, Grobbee DE, Valkenburg HA, Stijnen T, Burger H, Hofman A, et al. J-shaped relation between change in diastolic blood pressure and progression of aortic atherosclerosis. Lancet. (1994) 343:504–7. doi: 10.1016/S0140-6736(94)91459-1
69. London GM, Guerin AP. Influence of arterial pulse and reflected waves on blood pressure and cardiac function. Am Heart J. (1999) 138:S220–4. doi: 10.1016/S0002-8703(99)70313-3
70. Lakatta EG, Levy D. Arterial and cardiac aging: major shareholders in cardiovascular disease enterprises. Circulation. (2003) 107:139–46. doi: 10.1161/01.CIR.0000048892.83521.58
71. Amigó JM, Small M. Mathematical methods in medicine: neuroscience, cardiology and pathology. Philos Trans R Soc Math Phys Eng Sci. (2017) 375:20170016. doi: 10.1098/rsta.2017.0016
72. Tu JV. Advantages and disadvantages of using artificial neural networks versus logistic regression for predicting medical outcomes. J Clin Epidemiol. (1996) 49:1225–31. doi: 10.1016/S0895-4356(96)00002-9
73. MacEwen C. Artificial intelligence in healthcare. Academy of Medical Royal Colleges. Available at https://www.aomrc.org.uk/reports-guidance/artificial-intelligence-in-healthcare/ (Accessed January 17, 2022).
74. Mesko B. The role of artificial intelligence in precision medicine. Expert Rev Precis Med Drug Dev. (2017) 2:239–41. doi: 10.1080/23808993.2017.1380516
75. Zeleznik R, Foldyna B, Eslami P, Weiss J, Alexander I, Taron J, et al. Deep convolutional neural networks to predict cardiovascular risk from computed tomography. Nat Commun. (2021) 12:715. doi: 10.1038/s41467-021-20966-2
76. Motwani M, Dey D, Berman DS, Germano G, Achenbach S, Al-Mallah MH, et al. Machine learning for prediction of all-cause mortality in patients with suspected coronary artery disease: a 5-year multicentre prospective registry analysis. Eur Heart J. (2017) 38:500–7. doi: 10.1093/eurheartj/ehw188
77. Nanox AI. Imaging AI, meets population health. Available at: https://www.nanox.vision/ai (Accessed April 1, 2022).
78. Stemmer A, Shadmi R, Bregman-Amitai O, Chettrit D, Blagev D, Orlovsky M, et al. Using machine learning algorithms to review computed tomography scans and assess risk for cardiovascular disease: retrospective analysis from the national lung screening trial (NLST). PLoS One. (2020) 15:e0236021. doi: 10.1371/journal.pone.0236021
79. Vallée A, Petruescu L, Kretz S, Safar ME, Blacher J. Added value of aortic pulse wave velocity index in a predictive diagnosis decision tree of coronary heart disease. Am J Hypertens. (2019) 32:375–83. doi: 10.1093/ajh/hpz004
80. Vallée A, Cinaud A, Blachier V, Lelong H, Safar ME, Blacher J. Coronary heart disease diagnosis by artificial neural networks including aortic pulse wave velocity index and clinical parameters. J Hypertens. (2019) 37:1682–8. doi: 10.1097/HJH.0000000000002075
81. Visseren FLJ, Mach F, Smulders YM, Carballo D, Koskinas KC, Bäck M, et al. 2021 ESC guidelines on cardiovascular disease prevention in clinical practice: developed by the task force for cardiovascular disease prevention in clinical practice with representatives of the European society of cardiology and 12 medical societies with the special contribution of the European association of preventive cardiology (EAPC). Eur J Prev Cardiol. (2022) 29:5–115. doi: 10.1093/eurjpc/zwab154
82. Stone NJ, Smith SC, Orringer CE, Rigotti NA, Navar AM, Khan SS, et al. Managing atherosclerotic cardiovascular risk in young adults: JACC state-of-the-art review. J Am Coll Cardiol. (2022) 79:819–36. doi: 10.1016/j.jacc.2021.12.016
Keywords: pulse wave velocity, coronary artery disease, machine learning, clustering, coronary calcium computed tomography
Citation: Rousseau-Portalis M, Cymberknop L, Farro I and Armentano R (2023) Computational clustering reveals differentiated coronary artery calcium progression at prevalent levels of pulse wave velocity by classifying high-risk patients. Front. Cardiovasc. Med. 10:1161914. doi: 10.3389/fcvm.2023.1161914
Received: 8 February 2023; Accepted: 2 May 2023;
Published: 16 May 2023.
Edited by:
Sarah Costantino, University of Zurich, SwitzerlandReviewed by:
Francesco Faita, Institute of Clinical Physiology, ItalyLin Xu, General Hospital of Guangzhou Military Command, China
© 2023 Rousseau-Portalis, Cymberknop, Farro and Armentano. This is an open-access article distributed under the terms of the Creative Commons Attribution License (CC BY). The use, distribution or reproduction in other forums is permitted, provided the original author(s) and the copyright owner(s) are credited and that the original publication in this journal is cited, in accordance with accepted academic practice. No use, distribution or reproduction is permitted which does not comply with these terms.
*Correspondence: Maximo Rousseau-Portalis mrousseauportalis@frba.utn.edu.ar