Cardiac MRF using rosette trajectories for simultaneous myocardial T1, T2, and proton density fat fraction mapping
 Yuchi Liu
 Jesse Hamilton
 Yun Jiang1,2
  Nicole Seiberlich
- 1Department of Radiology, University of Michigan, Ann Arbor, MI, United States
- 2Department of Biomedical Engineering, University of Michigan, Ann Arbor, MI, United States
The goal of this work is to extend prior work on cardiac MR Fingerprinting (cMRF) using rosette k-space trajectories to enable simultaneous T1, T2, and proton density fat fraction (PDFF) mapping in the heart. A rosette trajectory designed for water-fat separation at 1.5T was used in a 2D ECG-triggered 15-heartbeat cMRF sequence. Water and fat specific T1 and T2 maps were generated from the cMRF data. A PDFF map was also retrieved using Hierarchical IDEAL by segmenting the rosette cMRF data into multiple echoes. The accuracy of rosette cMRF in T1, T2, and PDFF quantification was validated in the ISMRM/NIST phantom and an in-house built fat fraction phantom, respectively. The proposed method was also applied for myocardial tissue mapping of healthy subjects and cardiac patients at 1.5T. T1, T2, and PDFF values measured using rosette cMRF in the ISMRM/NIST phantom and the fat fraction phantom agreed well with the reference values. In 16 healthy subjects, rosette cMRF yielded T1 values which were 80~90 ms higher than spiral cMRF and MOLLI. T2 values obtained using rosette cMRF were ~3 ms higher than spiral cMRF and ~5 ms lower than conventional T2-prep bSSFP method. Rosette cMRF was also able to detect abnormal T1 and T2 values in cardiomyopathy patients and may provide more accurate maps due to effective fat suppression. In conclusion, this study shows that rosette cMRF has the potential for efficient cardiac tissue characterization through simultaneous quantification of myocardial T1, T2, and PDFF.
Introduction
Quantitative cardiac MRI is a powerful tool which can enable comprehensive tissue characterization for cardiac disease diagnosis. In particular, T1 and T2 mapping in the heart have been shown to be more sensitive to pathological changes than traditional T1- and T2-weighted images, including in cases of myocardial inflammation, fibrosis, myocarditis, infarcts, and edema, etc., (1–3). In addition, elimination of fat signals can reduce errors in these quantitative maps caused by water-fat partial volume effects, and quantitative proton density fat fraction (PDFF) mapping may provide additional value in diagnosing diseases like intramyocardial fat infiltration (4, 5). Recently, studies have shown that epicardial adipose tissue may play a role in COVID-19 myocardial inflammation, and quantification of epicardial fat volume may potentially aid evaluating this risk factor for COVID-19 complications (6).
When collected as part of the clinical routine, T1 and T2 mapping and fat imaging in the myocardium are often performed in separate scans and thus require long scan times with multiple breath holds. Multi-parametric mapping methods such as cardiac Magnetic Resonance Fingerprinting (cMRF) (7) are potentially more efficient because they can provide multiple quantitative measurements in a single scan. Previously, the Dixon method has been incorporated in the cMRF framework using multi-echo radial acquisitions to enable T1, T2, and PDFF quantification (8). Alternatively, rosette trajectories have also been used in the cMRF sequence to achieve water-fat separation along with myocardial T1 and T2 mapping (9). Rosette trajectories can be designed to sample the center of k-space multiple times during one readout, resulting in the suppression of signals at certain off-resonance frequencies due to dephasing. In other words, rosette trajectories can be used to generate a “pass band” and “null band” in the spectral dimension. This feature has been used for water-fat separation (10), chemical shift encoding (11, 12), and simultaneous multi-slice imaging (13). While the previous rosette cMRF work achieved water-fat separation, quantification of fat fraction was found unreliable due to the nature of the proton density estimates generated by pattern matching (9). The goal of this work is to extend rosette cMRF to enable quantitative PDFF measurements using Hierarchical IDEAL along with myocardial T1 and T2 mapping from a single scan.
Materials and methods
Pulse sequence design
A rosette trajectory with eight lobes and a readout duration of 7.7 ms (Figure 1A) was designed to suppress signals at −220 Hz (the main resonance frequency of fat at 1.5T). The time optimal gradient design software package developed by Vaziri and Lustig (14, 15) was used for the gradient waveform design according to the following criteria: maximum gradient amplitude 23 mT/m, maximum slew rate 145 T/m/s, FOV 300 × 300 mm2, matrix size 192 × 192, in-plane resolution 1.56 × 1.56 mm2. Simulation studies show that this trajectory suppresses 94.7% of the signal at−220 Hz (Figure 1B). This readout trajectory was incorporated into a previously reported 15-heartbeat ECG-triggered cMRF sequence structure (9) with flip angles ranging from 4 to 25 degrees. A constant TR of 9.7 ms and TE of 1.39 ms were used. A total of 26 repetitions of this acquisition were collected at late diastole during each heartbeat, resulting in an acquisition window of ~250 ms per heartbeat and a total of 390 highly undersampled images (one image per TR) over 15 heartbeats. The rosette trajectory was rotated by the golden angle (111°) between TRs. A slice thickness of 8 mm was employed in all phantom and in vivo experiments. All data were acquired at the resonance frequency of water.
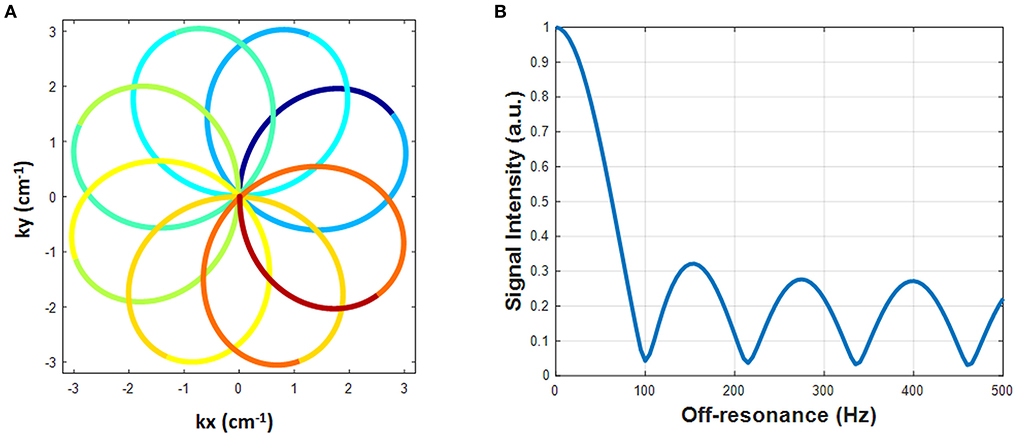
Figure 1. The designed rosette trajectory and its spectral response. (A) The rosette trajectory used in this work, where the segments used to generate images at different echo times are indicated by different colors. (B) Spectral response of the trajectory. Fat signals at −220 Hz are suppressed to 5.3%.
Dictionary generation and image reconstruction
An individual dictionary was simulated for each subject that models the subject's cardiac rhythm (7) and includes corrections for slice profile and preparation pulse efficiency (16). The dictionary resolution, denoted by min:step:max, was (10:10:2000, 2050:50:3000 3200:200:4000 4500 5000) ms for T1 in the heart; (10:10:90, 100:20:1000, 1040:40:2000, 2050:50:3000) ms for T1 in phantoms; (4:2:80, 85:5:120, 130:10:300, 350:50:500) ms for T2 in the heart; (2:2:8, 10:5:100, 110:10:300, 350:50:1100) ms for T2 in phantoms. The dictionary was compressed along the time dimension using singular value decomposition (SVD) (17). A threshold was set to preserve 99.9% of the signal energy, resulting in the first six singular values retained.
The cMRF k-space data were first compressed along the coil dimension using SVD to preserve 98% of the signal energy. Then the k-space data were projected to the subspace derived from the SVD of the dictionary as described above, resulting in six “coefficient images” by applying the NUFFT (18). These six coefficient images correspond to the six largest singular values and aliasing artifacts are greatly reduced in them. When rosette data are collected at the resonance frequency of water (as described above), water signal is preserved, but signal from fat is suppressed, resulting in images which depict water but not fat. As in previous work (9), fat images were generated by demodulating the acquired data at the resonance frequency of fat with a single-peak fat model and then reapplying the projection and NUFFT to the k-space data.
Additionally, a B0 map was computed by generating two images with different echo times by gridding the first and second halves of the readout (lobes 1–4 for echo 1 and lobes 5–8 for echo 2) and calculating the phase difference of these two images (9). B0 correction was performed on both the water and fat coefficient images by demodulating the k-space data at a series of frequencies from−150 Hz to 150 Hz with a step size of 5 Hz. The final B0 corrected image combines pixels demodulated at the true resonance frequency according to the B0 map. The two sets of B0 corrected coefficient images, one for water and one for fat, were then matched to the compressed dictionary using direct pattern match to generate the final T1 and T2 maps, and proton density images for water and fat, respectively. For spiral cMRF data, similar dictionary generation and pattern matching processes were performed without B0 correction due to the lack of a co-registered B0 map.
To generate quantitative PDFF maps, the data were processed as multi-echo acquisitions using Hierarchical IDEAL (19) in a separate process from MRF reconstruction (pattern matching was not involved). The 8-lobe trajectory was divided into nine segments (Figure 1A). The first and the last segment were half lobes going from the center to the edge of k-space and rewinding from the edge of k-space back to the center, respectively. The other seven segments started and ended at the edge of k-space with a zero-crossing in the middle. Because the images generated from single segments were highly undersampled, an SVD was performed along the time dimension to reduce aliasing artifacts. Data from each segment were projected onto a low-dimensional subspace of rank six derived from the SVD of the dictionary as described above. Subspace images corresponding to the first singular value from each of the nine rosette segments served as multi-echo images. TE of each echo was defined as the time of the zero-crossing of each segment; the TEs of the nine echoes were: 1.39, 2.46, 3.4, 4.34, 5.28, 6.22, 7.16, 8.1, and 9.2 ms. These multi-echo images and their corresponding TEs served as the inputs to the Hierarchical IDEAL toolbox. Note that B0 correction was not performed on these multi-echo images prior to the IDEAL processing because B0 fitting was already embedded in the IDEAL algorithm. A six-peak fat model was used in the Hierarchical IDEAL algorithm and outputs of the toolbox were a water image and a fat image. A PDFF map was calculated from the water and fat images using a noise correction method (20) to reduce bias in the regions where either water or fat image has low SNR according to the following equation:
where and are pixel-wise signal intensities of the water and fat images generated from Hierarchical IDEAL, respectively.
Phantom experiments
All experiments were performed on a 1.5T scanner (Siemens Sola, Erlangen, Germany). Rosette cMRF data were collected in the T2 layer of the ISMRM/NIST MRI system phantom (21, 22) to validate the accuracy of water T1 and T2 quantification. The mean and standard deviation of the T1 and T2 values within a physiological range obtained using rosette cMRF were compared with gold standard values measured using inversion recovery and single echo spin echo methods.
The accuracy of rosette cMRF in PDFF quantification was validated using an in-house developed fat fraction phantom (23). This phantom had one vial filled with peanut oil, one vial filled with water solution, and the rest of the five vials filled with a mixture of peanut oil and water solution to target a range of PDFF values from 10% to 50%. The water solution contained 43 mM sodium dodecyl sulfate, 43 mM sodium chloride, 3.75 mM sodium azide, and 0.3 mM gadolinium. For all vials except for the one with pure peanut oil, agar (2% w/v) was added over heat and the vials formed a solid gel after cooling to room temperature. Note that super-paramagnetic iron oxide was not added in this phantom compared to the original recipe in (23). Considering imperfect operations which might cause water solution and/or peanut oil losses in transfer, the actual PDFF values were measured using a three-point GRE sequence with optimal echo times at 1.5T (1.9/3.4/4.9 ms). The three-point GRE data were processed using the Hierarchical IDEAL toolbox in the same way as for rosette cMRF 9-echo data, and the results were used as the gold-standard PDFF values.
Both phantoms were scanned in an axial orientation using a 20-channel head coil with simulated ECG signals at 60 bpm. For both phantoms, ROIs in each vial were drawn manually. The mean and standard deviation in T1 and T2 values in the ISMRM/NIST phantom and PDFF values in the fat fraction phantom for each ROI were compared to reference values using a linear regression test.
In vivo experiments
Sixteen healthy subjects and two patients with suspected cardiomyopathy were scanned after written informed consent in this IRB-approved study. Mid-ventricular level short axis slices in the heart were acquired using the proposed rosette cMRF sequence and the original spiral 15-heartbeat cMRF sequence with the same flip angle pattern and acquisition window (9). Conventional T1 and T2 maps (MOLLI and T2-prepared bSSFP) were also collected in twelve of the healthy subjects and patients. The conventional scans are part of the Siemens MyoMaps product and used the following parameters: FOV 300 × 300 mm2, matrix size 192 × 192, GRAPPA R = 2 and 6/8 Partial Fourier acquisition. The 5(3)3 version of MOLLI was used with an acquisition window of 285.2 ms. The conventional T2 mapping scan used a 1(3)1(3)1 acquisition scheme with T2 preparation times of 0, 25, 55 ms and an acquisition window of 242 ms. Shimming was performed over the volume of the heart instead of the entire FOV to achieve better B0 field homogeneity. For patient scans, rosette cMRF, spiral cMRF and MOLLI were also performed ~10 min after contrast agent injection.
ROIs over the myocardial wall were drawn manually in segments 7–12 of the standardized AHA model. The mean and standard deviation in T1 and T2 values of each ROI as well as over the entire myocardium were calculated. In healthy subjects, a student's t-test was used to compare T1 and T2 measurements using rosette cMRF, spiral cMRF, and conventional T1/T2 mapping sequences. Significant difference was considered with P < 0.05.
To further investigate the effects of fat suppression on T1 and T2 measurements using rosette cMRF in vivo, a water-fat “unseparated” situation was mimicked by combining the water and fat information from the rosette trajectory. To this end, using rosette cMRF data in all healthy subjects, the k-space data demodulated at the fat frequency (fat signals with water suppression) were added to the original acquired k-space data (water signals with fat suppression). Then image reconstruction and pattern matching were performed in the same way as for spiral cMRF data. The mean and standard deviation in T1 and T2 values of the ROIs described above were calculated and compared with rosette and spiral cMRF measurements.
Results
Phantom data
In the ISMRM/NIST system phantom, T1 and T2 measurements using rosette cMRF are in excellent agreement with the reference values (Supplementary Figure 1) (slope of best-fit line 1.02/1.01 for T1/T2, R2>0.99). In the fat fraction phantom, water and fat specific T1 and T2 maps, proton density images, and the PDFF map generated by Hierarchical IDEAL using the rosette cMRF data are shown in Figure 2. PDFF measurements using rosette cMRF agree well with 3-point GRE measurements (Figure 2B) (slope of best-fit line 1.07, R2 > 0.99). The water and fat specific T1 and T2 measurements in the fat fraction phantom are shown in Supplementary Figure 2. T1 and T2 measurements are consistent across the vials regardless of PDFF values (except in the high/low PDFF vials which have too little signal for either water or fat).
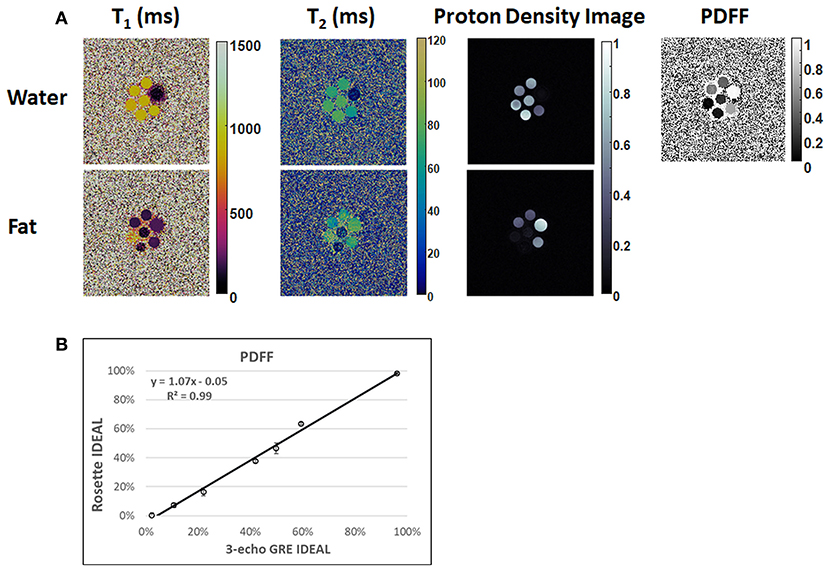
Figure 2. Results in the fat fraction phantom. (A) Water and fat specific T1 and T2 maps, proton density images, and the PDFF map generated by Hierarchical IDEAL using the rosette cMRF data. (B) PDFF measurements using rosette cMRF compared with reference values.
Healthy subjects
Representative maps and images from one healthy subject are shown in Figure 3. The averaged T1 and T2 values of all subjects in each segment as well as in the entire myocardium are shown in Figure 4. Over the entire myocardium, spiral cMRF yielded similar T1 values (1,002 ± 50.6 ms) compared with MOLLI (996.5 ± 20.1 ms) while rosette cMRF generated significantly higher T1 values (1,081.1 ± 31.8 ms). Both spiral and rosette cMRF yielded significantly lower T2 values (spiral 37.4 ± 2.8 ms; rosette 40.5 ± 1.4 ms) compared with the conventional method (45.7 ± 2.2 ms) over the entire myocardium., and rosette cMRF generated significantly higher T2 values than spiral cMRF. Averaged PDFF over the myocardium was 0.4% among all subjects (ranging from −4.5% to 5.7%). Individual PDFF of the sixteen healthy subjects are shown in Figure 5.
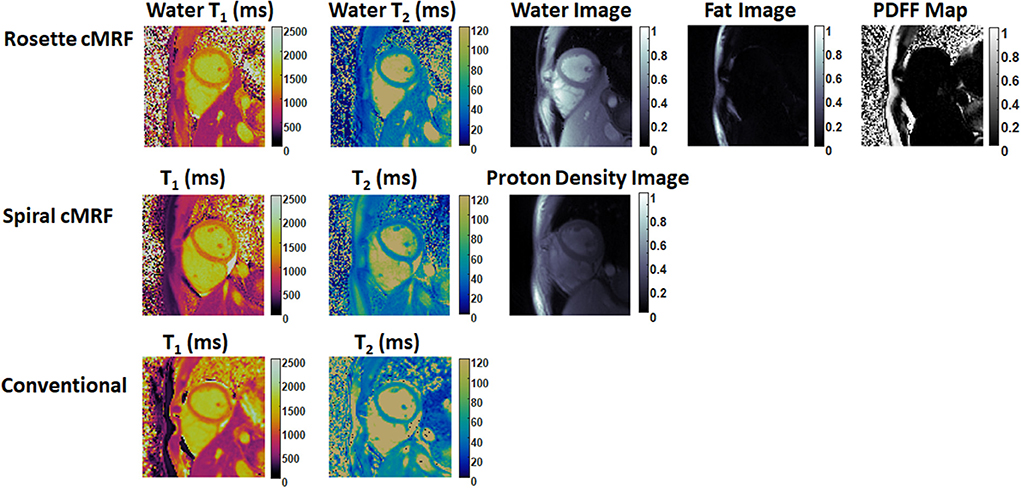
Figure 3. Representative T1 map, T2 map, water image, fat image, and PDFF maps in a healthy subject. T1 and T2 maps measured by spiral cMRF and conventional methods are shown for comparison. The field-of-view has been cropped to 150 × 150 mm2 to better visualize the heart.
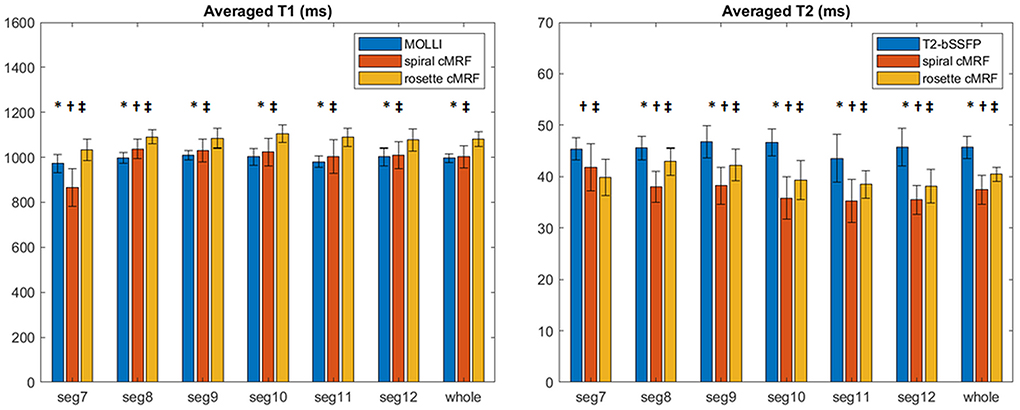
Figure 4. T1 and T2 values in 16 healthy subjects measured using conventional methods, spiral cMRF, and rosette cMRF. Measurements in segment 7–12 as well as over the entire myocardium are shown. *Significant difference between spiral and rosette cMRF. †Significant difference between conventional method and spiral cMRF. ‡Significant difference between conventional method and rosette cMRF.
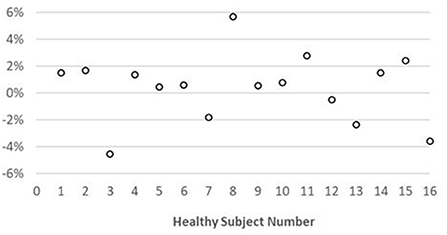
Figure 5. Individual PDFF over the myocardium measured using rosette cMRF in 16 healthy subjects.
In most of the individual segments (AHA segments 8-12), T1 and T2 values measured by the three methods show similar trends as in the entire slice. Spiral cMRF generated similar T1 values compared with MOLLI except for segment 7 and 8; rosette cMRF generated significantly higher T1 values compared with both MOLLI and spiral cMRF throughout all segments. Both spiral and rosette cMRF yielded significantly lower T2 values compared with conventional method throughout all segments. Rosette cMRF generated significantly higher T2 values than spiral cMRF in all segments except for segment 7. A cyclic pattern was noted in T1 and T2 measurements across the segments using all three methods, with lateral T1 and T2 slightly lower than septal ones. Variations in T1 and T2 across the segments are most pronounced in spiral cMRF (T1 ~170 ms; T2 ~6.6 ms), but smaller in rosette cMRF (T1 ~70 ms; T2 ~4.4 ms) and conventional methods (T1 ~38 ms; T2 ~3.2 ms).
With fat signals added back, the averaged rosette cMRF T1 measurements in segment 7 in all healthy subjects decreased from 1033.6 ± 48.4 ms to 1016 ± 85 ms; averaged T2 increased from 39.8 ± 3.6 ms to 43.5 ± 4.6 ms. A comparison of T1 and T2 measurements in all segments as well as the entire slice between spiral cMRF, rosette cMRF (with fat suppression), and rosette cMRF with fat signals added back is shown in Supplementary Figure 3.
cMRF maps in patients
Figures 6, 7 show the pre- and post-contrast maps and images from one patient with cardiomyopathy, respectively. Elevated native T1 and T2 were observed using all three methods. PDFF over the myocardium measured by rosette cMRF pre- and post-contrast are 2.7 and 1.3%, respectively. Pre- and post-contrast results for the second patient are shown in Figures 8, 9. Myocardial PDFF measured by rosette cMRF pre- and post-contrast are 4.2 and 2.9%, respectively. Spiral cMRF maps exhibit blurring, especially in the T2 maps, caused by epicardial fat; rosette cMRF was able to achieve much clearer boundaries of the myocardium due to fat signal suppression.
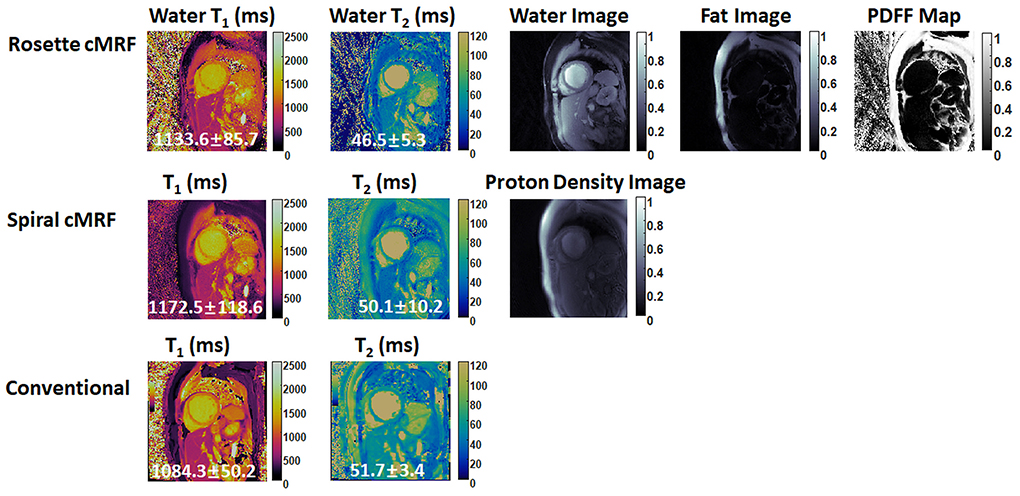
Figure 6. Pre-contrast results in the first cardiomyopathy patient acquired using rosette cMRF, spiral cMRF, and conventional methods. T1 and T2 values over the entire myocardium are shown in the maps.
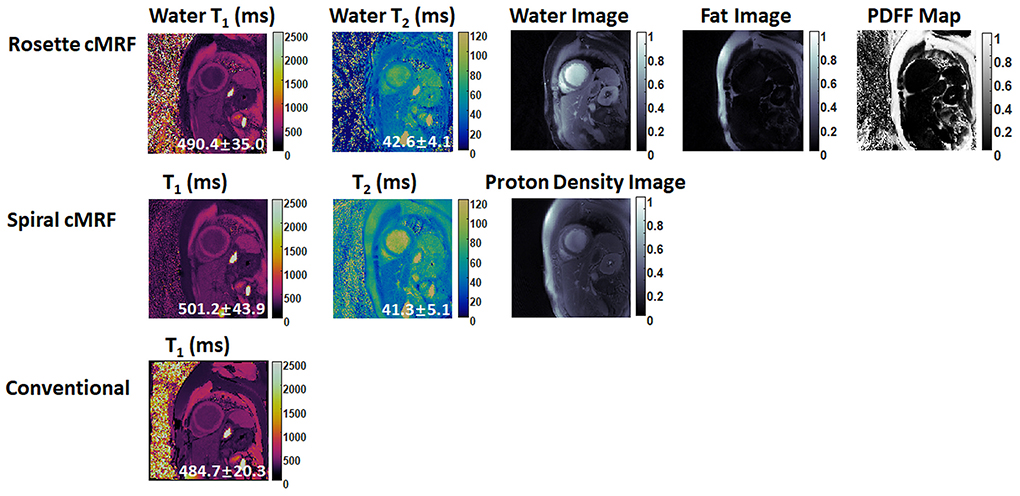
Figure 7. Post-contrast results in the first cardiomyopathy patient acquired using rosette cMRF, spiral cMRF, and conventional methods. T1 and T2 values over the entire myocardium are shown in the maps.
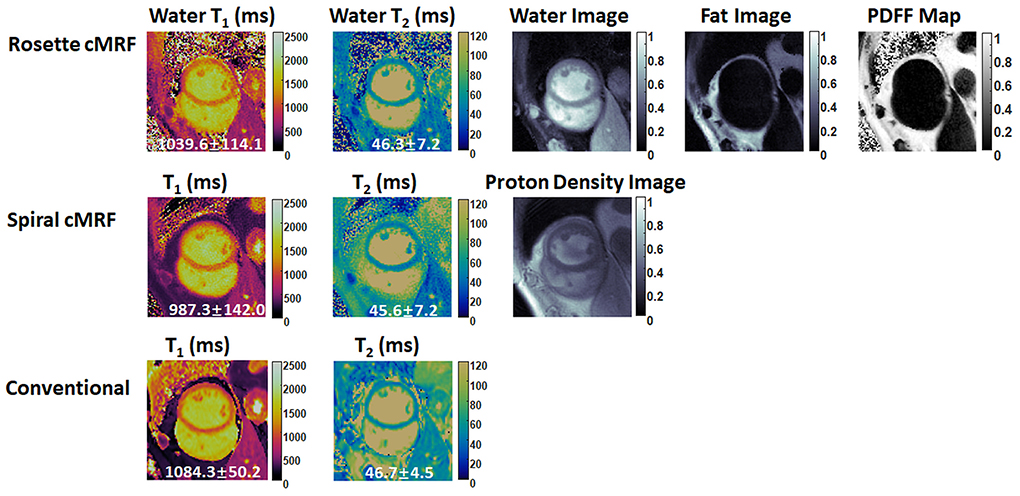
Figure 8. Pre-contrast results in the second cardiomyopathy patient acquired using rosette cMRF, spiral cMRF, and conventional methods. T1 and T2 values over the entire myocardium are shown in the maps. The field-of-view has been cropped to 150 × 150 mm2 to better visualize the heart.
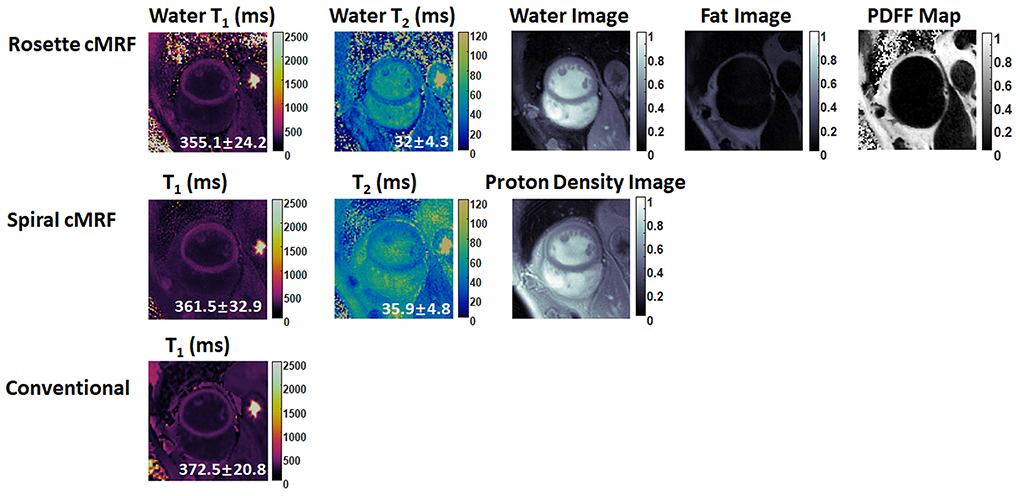
Figure 9. Post-contrast results in the second cardiomyopathy patient acquired using rosette cMRF, spiral cMRF, and conventional methods. T1 and T2 values over the entire myocardium are shown in the maps. The field-of-view has been cropped to 150 × 150 mm2 to better visualize the heart.
Discussion
The current study is an extension of previous work which used rosette cMRF for water-fat separation in addition to T1 and T2 mapping. The rosette trajectory originally designed for water-fat separation at 1.5T was optimized to improve off-resonance fat signal suppression from 86.5 to 94.7%. Note that the rosette trajectory was redesigned for PDFF measurement as compared to the trajectory used in (9), and thus all phantom and in vivo results presented here have no overlap with those reported in the previous work. A segmentation strategy was used to generate nine single echo images from each rosette readout, which could be used in conjunction with the Hierarchical IDEAL algorithm to enable PDFF quantification with no penalty in acquisition time. The first SVD coefficient images were used as the inputs to IDEAL in this work. Even though additional T1 and/or T2 corrections to these images were not found necessary for the specific sequence used in this study, potential T1 and T2 weighting of these images depending on the specific sequence structure (e.g. flip angles, magnetization preparation modules) might cause inaccuracy in PDFF quantification especially for low or high T1 (or T2) values. In contrast, the previous work was able to generate qualitative water and fat images but not quantitative PDFF maps; while the attempt was made to calculate PDFF maps from the water and fat proton density images generated by pattern matching, these values were found to be inaccurate, as these proton density images derived from the scaling factors between the signal time courses and the dictionary entries are not quantitative maps of proton density. In this work, a similar calculation relying on proton density images for PDFF using the newly designed rosette trajectory again resulted in inaccurate values (Supplementary Figure 4).
Other studies have explored water-fat separation and PDFF quantification using the MRF framework in static organs (24–28) and in the heart. For example, Dixon-cMRF using multi-echo radial readout has been proposed to quantify T1, T2, and PDFF simultaneously in the heart (8, 29). Compared to rosette cMRF, Dixon-cMRF generated comparable myocardial T1 (1032 ms) and T2 (42.1 ms) in healthy subjects in a similar acquisition time (~15 s) with slightly larger voxel size (2 × 2 × 8 mm3 in healthy subjects and 1.8 × 1.8 × 8 mm3 in patients). While Dixon-cMRF employed a different water-fat separation algorithm (graph cut) for PDFF quantification compared to the current study that used Hierarchical IDEAL, similar PDFF values were observed in healthy subjects (1.3% in the septum). Negative PDFF values were observed in the myocardium (Figure 5) due to the noise correction method performed in this study (20). When used in tissues with no fat content, this correction results in mean PDFF values of zero (with both positive and negative values possible). Unlike other MRF studies including Dixon-cMRF, advanced reconstruction methods such as low-rank reconstruction were not used in the current study to avoid long computation times with B0 correction. In this work, direct pattern match with SVD along the time dimension in conjunction with rosette MRF yields good image and map quality without the need for advanced reconstruction techniques. Incorporating low-rank reconstruction yields slightly smaller standard deviations in the T1 and T2 measurements with almost identical mean values and image quality at a price of much longer computing time (data not shown here).
T1 and T2 values measured by spiral cMRF and conventional methods in a large cohort of healthy subjects (n = 58) at 1.5T have been reported previously (30). Over the entire mid-ventricular slice, the current study found T1 values very close to the previous report and T2 values slightly lower in both spiral cMRF and conventional measurements. The trend that spiral cMRF with confounding factor corrections yielded higher T1 values than MOLLI and lower T2 values than T2-prep bSSFP method is also consistent with previous reports (16, 30). Similar to the previous rosette cMRF work (9), the current study found that rosette cMRF yielded ~3 ms higher T2 values than spiral cMRF over the entire myocardium. However, the significant difference between rosette and spiral cMRF T1 measurements observed in the current study was not found previously, possibly due to a much smaller number of subjects in the previous work (9).
While the previous rosette cMRF work only reported T1 and T2 values over the entire myocardium, the current study also examined each AHA segment of the mid-ventricular slice. Interestingly, segment 7 shows more pronounced difference in T1 measurements and an opposite trend in T2 measurements compared to the other segments regarding the comparison between spiral and rosette cMRF. Given that segment 7 (anterior wall) is surrounded by more epicardial fat than the other segments in the healthy subjects, and fat has T1 of 300~370 ms (lower than myocardium) and T2 of ~53 ms (higher than myocardium) at 1.5T (31), the higher T1 and lower T2 measured by rosette cMRF are possibly due to reduced fat contamination and may potentially be more accurate compared to spiral cMRF measurements. This hypothesis was also verified by the fact that T1 in segment 7 was decreased and T2 was increased when fat signals were added back to rosette cMRF data retrospectively (Supplementary Figure 3). The fact that rosette cMRF yielded smaller variations in T1 and T2 across cardiac segments compared to spiral cMRF (Figure 4) could also be evidence of effective fat signal suppression and more reliable T1 and T2 mapping. Note that difference between spiral and rosette cMRF measurements was still observed after fat signals were added back to the rosette data, indicating fat is not the only factor causing the difference. B0 field inhomogeneity, which was not modeled in this simulation, might play a role because it causes blurring in spiral images but signal loss in rosette images. Spiral and rosette trajectories may also react to flow differently due to their different gradient waveforms and gradient moments, resulting in variations in T1 and T2 measurements.
Preliminary results from cardiomyopathy patients are shown in this study. Both spiral and rosette cMRF were able to detect abnormal T1 and T2 values, while rosette cMRF potentially provided better image quality by suppressing fat signals in the water T1 and T2 maps. Studies with a larger cohort of cardiac patients are on-going to validate the proposed method in a variety of cardiac diseases.
In addition to T1 and T2, is also an important tissue property reflecting iron load in the myocardium (32). Given the multi-echo acquisition nature of rosette trajectories, quantification in the heart and liver has been shown feasible using rosette trajectories (33). Even though the current study did not aim at quantification and thus used a relatively short rosette readout, future work will explore the quantification of T1, T2, and PDFF simultaneously using either a long rosette readout (34) or multi-echo radial readout (35) in the MRF framework.
There are a few limitations of the current study. First, even though the accuracy of PDFF quantification was validated in fat fraction phantoms, in vivo validation of PDFF measurements was not performed due to unavailability of the clinical PDFF mapping sequences. Second, repeatability of rosette cMRF was not tested in healthy subjects. Third, the image quality in patient data was not assessed by cardiologists using a systematic approach such as a Likert scale. Future studies will aim to address these aspects.
Conclusion
In conclusion, rosette cMRF is a promising method for efficient cardiac tissue characterization through the simultaneous quantification of myocardial T1, T2, and PDFF.
Data availability statement
The original contributions presented in the study are included in the article/Supplementary material, further inquiries can be directed to the corresponding author.
Ethics statement
The studies involving human participants were reviewed and approved by Institutional Review Boards of the University of Michigan Medical Campus. The patients/participants provided their written informed consent to participate in this study.
Author contributions
YL and JH contributed to pulse sequence development and data acquisition. YL performed data reconstruction, statistical analysis, wrote the draft of the manuscript, and created figures. All authors contributed to conception of the study, manuscript revision, and approved the submitted version.
Funding
JH is supported by NIH/NHLBI R01HL163030. This work was supported by NSF/CBET 1553441, NIH/NHLBI R01HL094557, and Siemens Healthineers (Erlangen, Germany). Siemens Healthineers was not involved in the study design, collection, analysis, interpretation of data, the writing of this article or the decision to submit it for publication.
Conflict of interest
The authors declare that the research was conducted in the absence of any commercial or financial relationships that could be construed as a potential conflict of interest.
Publisher's note
All claims expressed in this article are solely those of the authors and do not necessarily represent those of their affiliated organizations, or those of the publisher, the editors and the reviewers. Any product that may be evaluated in this article, or claim that may be made by its manufacturer, is not guaranteed or endorsed by the publisher.
Supplementary material
The Supplementary Material for this article can be found online at: https://www.frontiersin.org/articles/10.3389/fcvm.2022.977603/full#supplementary-material
References
1. Puntmann VO, Nagel E. T1 and T2 mapping in nonischemic cardiomyopathies and agreement with endomyocardial biopsy. J Am Coll Cardiol. (2016) 68:1923–4. doi: 10.1016/j.jacc.2016.06.075
2. Patel AR, Kramer CM. Role of cardiac magnetic resonance in the diagnosis and prognosis of nonischemic cardiomyopathy. JACC Cardiovasc Imaging. (2017) 10:1180–93. doi: 10.1016/j.jcmg.2017.08.005
3. Hamlin SA, Henry TS, Little BP, Lerakis S, Stillman AE. Mapping the future of cardiac MR imaging: case-based review of T1 and T2 mapping techniques. RadioGraphics. (2014) 34:1594–611. doi: 10.1148/rg.346140030
4. Farrelly C, Shah S, Davarpanah A, Keeling AN, Carr JC. ECG-gated multiecho Dixon fat-water separation in cardiac MRI: advantages over conventional fat-saturated imaging. Am J Roentgenol. (2012) 199W74–83. doi: 10.2214/AJR.11.7759
5. Kellman P, Hernando D, Shah S, Zuehlsdorff S, Jerecic R, Mancini C, et al. Multiecho dixon fat and water separation method for detecting fibrofatty infiltration in the myocardium. Magn Reson Med. (2008) 61:215–21. doi: 10.1002/mrm.21657
6. Iacobellis G, Secchi F, Capitanio G, Basilico S, Schiaffino S, Boveri S, et al. Epicardial fat inflammation in severe COVID-19. Obesity. (2020) 28:2260–2. doi: 10.1002/oby.23019
7. Hamilton JI, Jiang Y, Chen Y, Ma D, Lo WC, Griswold M, et al. MR fingerprinting for rapid quantification of myocardial T1, T2, and proton spin density. Magn Reson Med. (2017) 77:1446–58. doi: 10.1002/mrm.26216
8. Jaubert O, Cruz G, Bustin A, Schneider T, Lavin B, Koken P, et al. Water–fat Dixon cardiac magnetic resonance fingerprinting. Magn Reson Med. (2019) 00:1–17. doi: 10.1002/mrm.28070
9. Liu Y, Hamilton J, Eck B, Griswold M, Seiberlich N. Myocardial T1 and T2 quantification and water–fat separation using cardiac MR fingerprinting with rosette trajectories at 3T and 1.5T. Magn Reson Med. (2021) 85:103–19. doi: 10.1002/mrm.28404
10. Noll DC. Multishot rosette trajectories for spectrally selective MR imaging. IEEE Trans Med Imaging. (1997) 16:372–7. doi: 10.1109/42.611345
11. Schirda C V, Tanase C, Boada FE. Rosette spectroscopic imaging: optimal parameters for alias-free, high sensitivity spectroscopic imaging. J Magn Reson Imaging. (2009) 29:1375–85. doi: 10.1002/jmri.21760
12. Schirda C V, Zhao T, Andronesi OC, Lee Y, Pan JW, Mountz JM, et al.In vivo brain rosette spectroscopic imaging (RSI) with LASER excitation, constant gradient strength readout, and automated LCModel quantification for all voxels. Magn Reson Med. (2016) 76:380–90. doi: 10.1002/mrm.25896
13. Noll DC, Peltier SJ, Boada FE. Simultaneous multislice acquisition using rosette trajectories (SMART): a new imaging method for functional MRI. Magn Reson Med. (1998) 39:709–16. doi: 10.1002/mrm.1910390507
14. Lustig M, Kim SJ, Pauly JM. A fast method for designing time-optimal gradient waveforms for arbitrary k-space trajectories. IEEE Trans Med Imaging. (2008) 27:866–73. doi: 10.1109/TMI.2008.922699
15. Vaziri S, Lustig M. The fastest arbitrary k-space trajectories. Proc Intl Soc Mag Reson Med. (2012) 20:2284.
16. Hamilton JI, Jiang Y, Ma D, Lo W-C, Gulani V, Griswold M, et al. Investigating and reducing the effects of confounding factors for robust T1 and T2 mapping with cardiac MR fingerprinting. Magn Reson Imaging. (2018) 53:40–51. doi: 10.1016/j.mri.2018.06.018
17. McGivney DF, Pierre E, Ma D, Jiang Y, Saybasili H, Gulani V, et al. SVD compression for magnetic resonance fingerprinting in the time domain. IEEE Trans Med Imaging. (2014) 33:2311–22. doi: 10.1109/TMI.2014.2337321
18. Fessler JA. On NUFFT-based gridding for non-Cartesian MRI. J Magn Reson. (2007) 188:191–5. doi: 10.1016/j.jmr.2007.06.012
19. Tsao J, Jiang Y. Hierarchical IDEAL: Fast, robust, and multiresolution separation of multiple chemical species from multiple echo times. Magn Reson Med. (2013) 70:155–9. doi: 10.1002/mrm.24441
20. Liu CY, McKenzie CA Yu H, Brittain JH, Reeder SB. Fat quantification with IDEAL gradient echo imaging: Correction of bias from T1 and noise. Magn Reson Med. (2007) (58):354–64. doi: 10.1002/mrm.21301
21. Keenan K, Stupic K, Russek S, Chenevert T, Prasad P, Reddick W, et al. Multi–site, multi–vendor comparison of T1 measurement using ISMRM/NIST system phantom. Proc Int Soc Magn Reson Med. (2016) 24:3290.
22. Russek S, Boss M, Jackson E, Jennings D, Eveloch J, Gunter J, et al. Characterization of NIST/ISMRM MRI system phantom. Proc Int Soc Magn Reson Med.(2012) 20:2456.
23. Hines CDG Yu H, Shimakawa A, McKenzie CA, Brittain JH, Reeder SB. T1 independent, T2* corrected MRI with accurate spectral modeling for quantification of fat: Validation in a fat-water-SPIO phantom. J Magn Reson Imaging. (2009) 30:1215–22. doi: 10.1002/jmri.21957
24. Cencini M, Biagi L, Kaggie JD, Schulte RF, Tosetti M, Buonincontri G. Magnetic resonance fingerprinting with dictionary - based fat and water separation (DBFW MRF): a multi - component approach. Magn Reson Med. (2019) 81:3032–45. doi: 10.1002/mrm.27628
25. Koolstra K, Webb AG, Veeger TTJ, Kan HE, Koken P, Börnert P. Water–fat separation in spiral magnetic resonance fingerprinting for high temporal resolution tissue relaxation time quantification in muscle. Magn Reson Med. (2020) 84:646–62. doi: 10.1002/mrm.28143
26. Nolte T, Gross-Weege N, Doneva M, Koken P, Elevelt A, Truhn D, et al. Spiral blurring correction with water–fat separation for magnetic resonance fingerprinting in the breast. Magn Reson Med. (2020) 83:1192–207. doi: 10.1002/mrm.27994
27. Ostenson J, Damon BM, Welch EB. MR fingerprinting with simultaneous T1, T2, and fat signal fraction estimation with integrated B0 correction reduces bias in water T1 and T2 estimates. Magn Reson Imaging. (2019) 60:7–19. doi: 10.1016/j.mri.2019.03.017
28. Marty B, Carlier PG. MR fingerprinting for water T1 and fat fraction quantification in fat infiltrated skeletal muscles. Magn Reson Med. (2019) 83:621–34. doi: 10.1002/mrm.27960
29. Jaubert O, Cruz G, Bustin A, Hajhosseiny R, Nazir S, Schneider T, et al. T1, T2, and fat fraction cardiac MR fingerprinting: preliminary clinical evaluation. J Magn Reson Imaging. (2020) 53:1253–65. doi: 10.1002/jmri.27415
30. Hamilton JI, Pahwa S, Adedigba J, Frankel S, O'Connor G, Thomas R, et al. Simultaneous mapping of T1 and T2 using cardiac magnetic resonance fingerprinting in a cohort of healthy subjects at 1.5T. J Magn Reson Imaging. (2020) 52:1044–52. doi: 10.1002/jmri.27155
31. Rakow-Penner R, Daniel B, Yu H, Sawyer-Glover A, Glover GH. Relaxation times of breast tissue at 1.5T and 3T measured using IDEAL. J Magn Reson Imaging. (2006) 23:87–91. doi: 10.1002/jmri.20469
32. Anderson LJ, Holden S, Davis B, Prescott E, Charrier CC, Bunce NH, et al. Cardiovascular T2-star (T2*) magnetic resonance for the early diagnosis of myocardial iron overload. Eur Heart J. (2001) 22:2171–9. doi: 10.1053/euhj.2001.2822
33. Bush AM, Sandino CM, Ramachandran S, Ong F, Dwork N, Zucker EJ, et al. Rosette trajectories enable ungated, motion-robust, simultaneous cardiac and liver T2 * iron assessment. J Magn Reson Imaging. (2020) 52:1688–98. doi: 10.1002/jmri.27196
34. Cummings E, Liu Y, Jiang Y, Ropella-Panagis K, Hamilton J, Seiberlich N. Simultaneous mapping of T1, T2, T2*, and fat fraction at 0.55T with rosette MRF. In: Proceedings of the Low Field Workshop, International Society for Magnetic Resonance in Medicine, virtual. (2022).
Keywords: cardiac MRF, T1 mapping, T2 mapping, PDFF, rosette trajectory
Citation: Liu Y, Hamilton J, Jiang Y and Seiberlich N (2022) Cardiac MRF using rosette trajectories for simultaneous myocardial T1, T2, and proton density fat fraction mapping. Front. Cardiovasc. Med. 9:977603. doi: 10.3389/fcvm.2022.977603
Received: 24 June 2022; Accepted: 25 August 2022;
Published: 20 September 2022.
Edited by:
Christopher T. Nguyen, Cleveland Clinic, United StatesReviewed by:
Stanislas Rapacchi, UMR7339 Centre de Résonance Magnétique Biologique et Médicale (CRMBM), FranceAndrew Scott, Royal Brompton Hospital, United Kingdom
Copyright © 2022 Liu, Hamilton, Jiang and Seiberlich. This is an open-access article distributed under the terms of the Creative Commons Attribution License (CC BY). The use, distribution or reproduction in other forums is permitted, provided the original author(s) and the copyright owner(s) are credited and that the original publication in this journal is cited, in accordance with accepted academic practice. No use, distribution or reproduction is permitted which does not comply with these terms.
*Correspondence: Yuchi Liu, yuchiliu@med.umich.edu