Model Embraced Electromechanical Coupling Time for Estimation of Heart Failure in Patients With Hypertrophic Cardiomyopathy
 Su Hu1,2†
  Lan Mi3†
  Jianli Fu4† Wangxia Ma5 Jingsong Ni6 Zhenxia Zhang7 Botao Li1 Gongchang Guan1 Junkui Wang1
  Na Zhao1*
- 1Department of Cardiovascular Medicine, Shaanxi Provincial People’s Hospital, Xi’an, China
- 2Department of Cardiovascular Medicine, The Second Affiliated Hospital of Xi’an Medical University, Xi’an, China
- 3Key Laboratory of Carcinogenesis and Translational Research (Ministry of Education), Department of Lymphoma, Peking University Cancer Hospital and Institute, Beijing, China
- 4Department of Cardiovascular Surgery, Shaanxi Provincial People’s Hospital, Xi’an, China
- 5Department of Cardiovascular Medicine, Zhouzhi County Hospital, Xi’an, China
- 6Department of Cardiovascular Medicine, Huazhou District People’s Hospital, Weinan, China
- 7Department of Cardiovascular Medicine, Pucheng County Hospital, Weinan, China
Objective: This study aimed to establish a model embraced electromechanical coupling time (EMC-T) and assess the value of the model for the prediction of heart failure (HF) in patients with hypertrophic cardiomyopathy (HCM).
Materials and Methods: Data on 82 patients with HCM at Shaanxi Provincial People’s Hospital between February 2019 and November 2021 were collected and then formed the training dataset (n = 82). Data were used to screen predictors of HF using univariate and multivariate analyses. Predictors were implemented to discover the optimal cut-off value, were incorporated into a model, and shown as a nomogram. The cumulative HF curve was calculated using the Kaplan–Meier method. Additionally, patients with HCM at other hospitals collected from March 2019 to March 2021 formed the validation dataset. The model’s performance was confirmed both in training and validation sets.
Results: During a median of 22.91 months, 19 (13.38%) patients experienced HF. Cox analysis showed that EMC-T courses in the lateral wall, myoglobin, PR interval, and left atrial volume index were independent predictors of HF in patients with HCM. Five factors were incorporated into the model and shown as a nomogram. Stratification of patients into two risk subgroups by applying risk score (<230.65, ≥230.65) allowed significant distinction between Kaplan–Meier curves for cumulative incidence of HF events. In training dataset, the model had an AUC of 0.948 (95% CI: 0.885–1.000, p < 0.001) and achieved a good C-index of 0.918 (95% CI: 0.867–0.969). In validation dataset, the model had an AUC of 0.991 (95% CI: 0.848–1.000, p < 0.001) and achieved a strong C-index of 0.941 (95% CI: 0.923–1.000). Calibration plots showed high agreement between predicted and observed outcomes in both two datasets.
Conclusion: We established and validated a novel model incorporating electromechanical coupling time courses for predicting HF in patients with HCM.
Introduction
Hypertrophic cardiomyopathy (HCM) is the most common genetic cardiovascular disorder, which is recognised as an important cause of sudden cardiac death (SCD) and can lead to disability from heart failure (HF) and stroke (1–3). Owing to the improvement of SCD risk stratification and use of implantable defibrillators, HF has become an increasingly prominent adverse outcome in the natural course of HCM (4, 5). Mild-to-severe cardiac functional impairment, commonly expressed as exertional dyspnoea and fatigue, occurs in approximately 50% of patients with HCM. As the left ventricular ejection fraction (LVEF) generally remains within the normal range (6), identification of predictors of HF development in patients with HCM is needed in clinical practice. Few studies have recognised that diastolic function parameters, including mitral inflow, pulmonary venous flow, and global longitudinal strain evaluation by speckle-tracking echocardiography, are associated with HF outcome (7–10). However, data on risk assessment models to monitor the evolution of HF in patients with HCM are lacking.
Cardiac excitation-contraction coupling is a process that links cardiomyocyte action potential to cardiomyocyte contractile (11). The process is difficult to test experimentally; nevertheless, cardiac electromechanical coupling efficiency, presented as electromechanical coupling time, previously evaluated by combining tissue Doppler imaging (TDI) echo and electrocardiogram (ECG) measurement has been proven (12). In a preliminary study, electromechanical coupling time was proposed as a potential index for evaluating cardiac systolic function in patients with stage B HF, which is a precursor of HF (12, 13). Few studies have explored electromechanical coupling time and outcomes in HCM, and we hypothesised that electromechanical coupling time was delayed in HCM with HF and would predict HF in patients with HCM. The current study was undertaken to establish a model based on electromechanical coupling time and to assess the value of the model for the prediction of HF occurring in a cohort of patients with HCM.
Materials and Methods
Study Protocol and Patient Involvement
This was an observational, multi-centre cohort study performed at Shaanxi Provincial People’s Hospital, China. The HCM cohort was evaluated to identify consecutive patients from February 2019 to November 2020 and formed the training dataset. An independent population study with an external HCM cohort was performed in Shaanxi, China at Pucheng County Hospital, Zhouzhi County Hospital, and Huazhou District People’s Hospital from March 2019 to March 2021.
Inclusion criteria for the study were as follows: (1) a diagnosis of HCM based on the presence of left ventricular hypertrophy on echocardiography (15 mm), which is not solely explained by abnormal loading conditions, according to the guidelines of the European Society of Cardiology (3); (2) age ≥18 and ≤70 years; (3) left ventricular ejection fraction ≥ 50%; and (4) New York Heart Association (NYHA) function class I or II.
The exclusion criteria were as follows: (1) other cardiac or systemic diseases that may produce left ventricular hypertrophy; (2) a history of hypertension; (3) a history of diabetic mellitus; (4) a history of coronary artery disease; (5) burden of premature beat ≥ 10%, second- or third-degree atrioventricular block, left bundle branch block (LBBB), interventricular conduction delay (IVCD), or acute pulmonary oedema; (6) previous episode of atrial fibrillation; (7) previous septal alcohol ablation or morrow surgery; (8) onset of atrial fibrillation during follow-up; and (9) onset of SCD during follow-up.
Our research focused on the feedback and input of patients through consultations. Patients were involved in the study design and conduction of this research. During the preliminary feasibility stage, the priority of the research question, and methods of recruitment were informed via panel discussions with patients and one structured on-line interviews. Furthermore, a patient joined the independent steering committee during the execution phases of the research. We intended to share the vital results of this study with our patients and planned to explore patient and public involvement in the development of an appropriate approach of dissemination.
Data Collection
Demographic characteristics including age, sex, body mass index (BMI), family history of sudden cardiac death (SCD), unexplained syncope ≤ 2 years, risk-SCD score (3), heart rate (HR), resting blood pressure, 6-min walk test (6-MWT), brain natriuretic peptide (BNP), and medication history were collected at enrolment.
Peripheral blood was sampled from patients in a fasting state in the morning following the enrolment day. Venous plasma concentrations of serum kalium, calcium, natrium, glycated haemoglobin, total cholesterol, low-density lipoprotein, high-density lipoprotein, triglyceride, lipoproteins, serum creatinine, N-terminal pro-B-type natriuretic peptide, red blood cells, haemoglobin, white blood cells, creatine, phosphokinase-myohaemoglobin (MB), myohaemoglobin (MB), troponin I, thyroid stimulating hormone, free triiodothyronine 3, and free triiodothyronine 4 were determined in the clinical laboratory department using standard biochemical techniques.
An ECG was performed as previously described (14). Twenty-four-hour ECG recordings were obtained using a digital Holter system. The transthoracic echocardiography protocol was based on standardised acquisition from the European Association of Echocardiography/American Society of Echocardiography (ASE) guidelines in all patients (15). Recordings in standardised views, including two-dimensional, M-mode, and colour flow Doppler and pulsed tissue Doppler imaging (TDI), were acquired with an EPIQ 7C system (S5-1 probe, Philips, Netherlands) for subsequent analysis. All measurements were calculated as the average of three consecutive cardiac cycles. Interventricular septum (IVS) thickness and left ventricular posterior wall (LVPW) thickness were defined as the greatest thickness in any single segment. Right ventricular diameters (RVDs) were evaluated as the greatest diameter at the end-diastolic stage in the apical four-chamber view and left ventricular long axis view, respectively. Left ventricular mass (LVM) and LVM index (LVMI) were calculated according to the Devereux formula: LVM (g) = 0.8 × 1.04 × [(IVS + LVPW + LVEDD)3-LVEDD3] + 0.6, LVMI (g/m2) = LVM/body surface area (BSA), respectively, and the body surface area (BSA) was calculated as follows: 0.0061 × height (cm) + 0.0128 × weight (kg)–0.1529. Left atrial volume (LAV) was calculated using the biplane area length method at end systole (16), LAVI (ml/m2) = LAV/BSA. Left ventricular ejection fraction (LVEF) was calculated using biplane Simpson’s rule (15). Left outflow tract gradients (LVOTG) were measured and automatically calculated from the flow velocities using the modified Bernoulli equation (17). The tricuspid regurgitation peak velocity was recorded using continuous wave Doppler.
Electromechanical coupling time courses (Qsb, Qst) in the interventricular septum (IVS) and lateral wall (Lat) of the left ventricle were measured using a combination of TDI echo and ECG. The Qsb time course is from the onset of the Q wave on the ECG to the beginning of the S wave on the TDI. The Qst time course is from the onset of the Q wave on the ECG to the top of the S wave on the TDI (Figure 1). HR is related to the electrical and mechanical activities of the heart (18). We determined all the data of electromechanical coupling time courses with HR correction, referenced as the formula in a previous study: electromechanical coupling time courses with HR correction = electromechanical coupling time courses without HR correction/HR × 60 (12, 18).
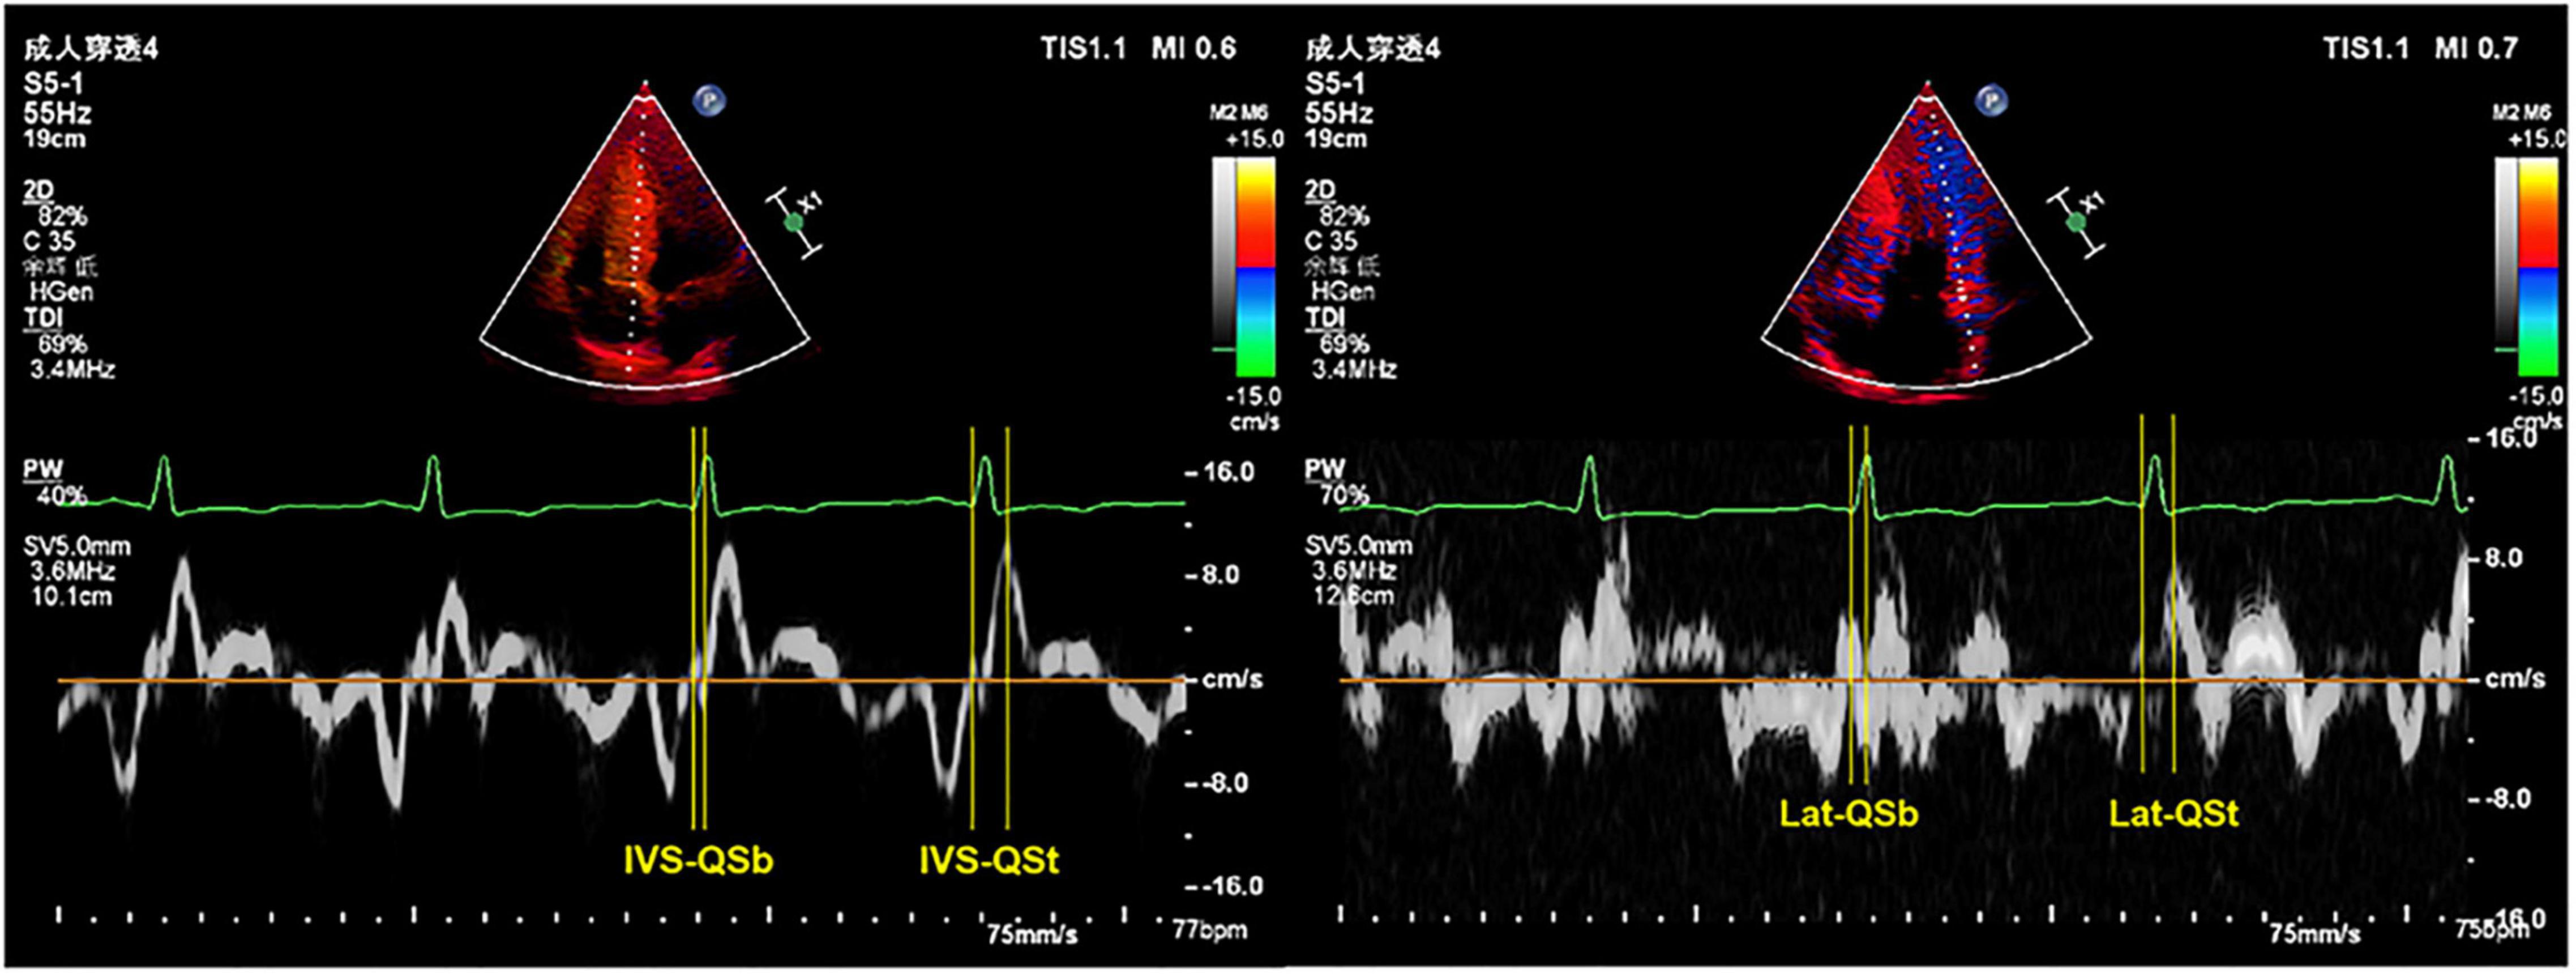
Figure 1. Representative images of TDI combined with ECG to measure the electromechanical coupling time. TDI, tissue Doppler imaging; ECG, electrocardiography; IVS, interventricular septum; Lat, lateral wall; QSb, from the onset of QRS wave on ECG to the beginning of S wave on TDI; QSt, from the onset of QRS wave on ECG to the top of S wave on TDI.
End-Point
The primary end-point was HF admission, which was defined as follows: (1) exertional dyspnoea, (2) NYHA function class III-IV, and (3) diuretic is essential for improving symptoms. All patients were followed-up via face-to-face interviews in our hospital. The duration of follow-up was determined using the initial visit to the date of the first HF occurrence or the last visit (December 2021).
Statistical Analysis
Data were collected using IBM SPSS statistical software (version 20.0) for Windows (SPSS Inc., Chicago, IL, United States) and R 4.0.1 (New York1). Continuous variables were expressed as the mean and standard deviation. Categorical variables were expressed as frequencies and percentages. The Kolmogorov–Smirnov test was used to assess the normal distribution of the quantitative variables. The independent samples t-test was performed to compare parametric values between the HF and non-HF groups, whereas categorical variables were compared using the Chi-square test. Univariate and multivariate survival analyses were performed using the Cox regression analysis. Interclass correlation coefficient (ICC) was used to evaluate intra- and inter-observer variability in electromechanical coupling time parameters. The clinically significant predictors of the final regression model were formulated as a nomogram. Kaplan–Meier survival curves were used in the two groups according to the model score to further assess the prognostic value. The function “surv_cutpoint” in the R package “survminer” was applied to determine the optimal cut-off value of these chosen variables in our study. The accuracy of the predictive model was assessed using receiver operating characteristic curve (ROC) analysis and Harrell’s concordance index (C index). A calibration curve was derived to explore the consistency between predicted probabilities by the nomogram and observed HF rates. External validation was performed in an independent population. The nomogram was used to assess each patient in the validation dataset. Thereafter, the area under the curve (AUC), C-index and calibration curve were calculated to assess the discriminative performance and predictive accuracy of the nomogram model. Decision curve analysis (DCA) was used to calculate the net benefit by using the model in both training and validation datasets (19). The total scores of each patient were calculated based on the nomogram, and we developed an application for clinical use of the model.
All probability values were two-tailed. A p-value of less than 0.05 was considered statistically significant. The R code is submitted as a Supplementary Material.
Ethics
Our study complied with the Declaration of Helsinki and was approved by the ethics committee of the Shaanxi Provincial People’s Hospital. Written informed consent was obtained from all patients.
Results
Study Population
Eighty-two patients fulfilled the study inclusion criteria out of a cohort of 142 patients with HCM. The reasons for exclusion were: 16 for having no second visit during the study period (lost to follow-up), 8 for coronary heart diseases, 4 for previous septal alcohol ablation, 2 for previous morrow surgery, 4 for previous acute HF, 2 for SCD, 10 for previous episode of atrial fibrillation, 11 for onset of atrial fibrillation during follow-up, and 2 for onset of SCD during follow-up (Figure 2). Clinical, demographic, echocardiographic characteristics, and electromechanical coupling time parameters of the population at the initial evaluation are presented in Table 1. The mean age was 42.20 ± 10.83 years, and 46 (56.09%) patients were men. The left ventricular wall thickness was 22.60 ± 5.04 mm (range, 15–35), and the mean ejection fraction was 59.50 ± 5.72%. All patients received standardised medical care during the clinical course.
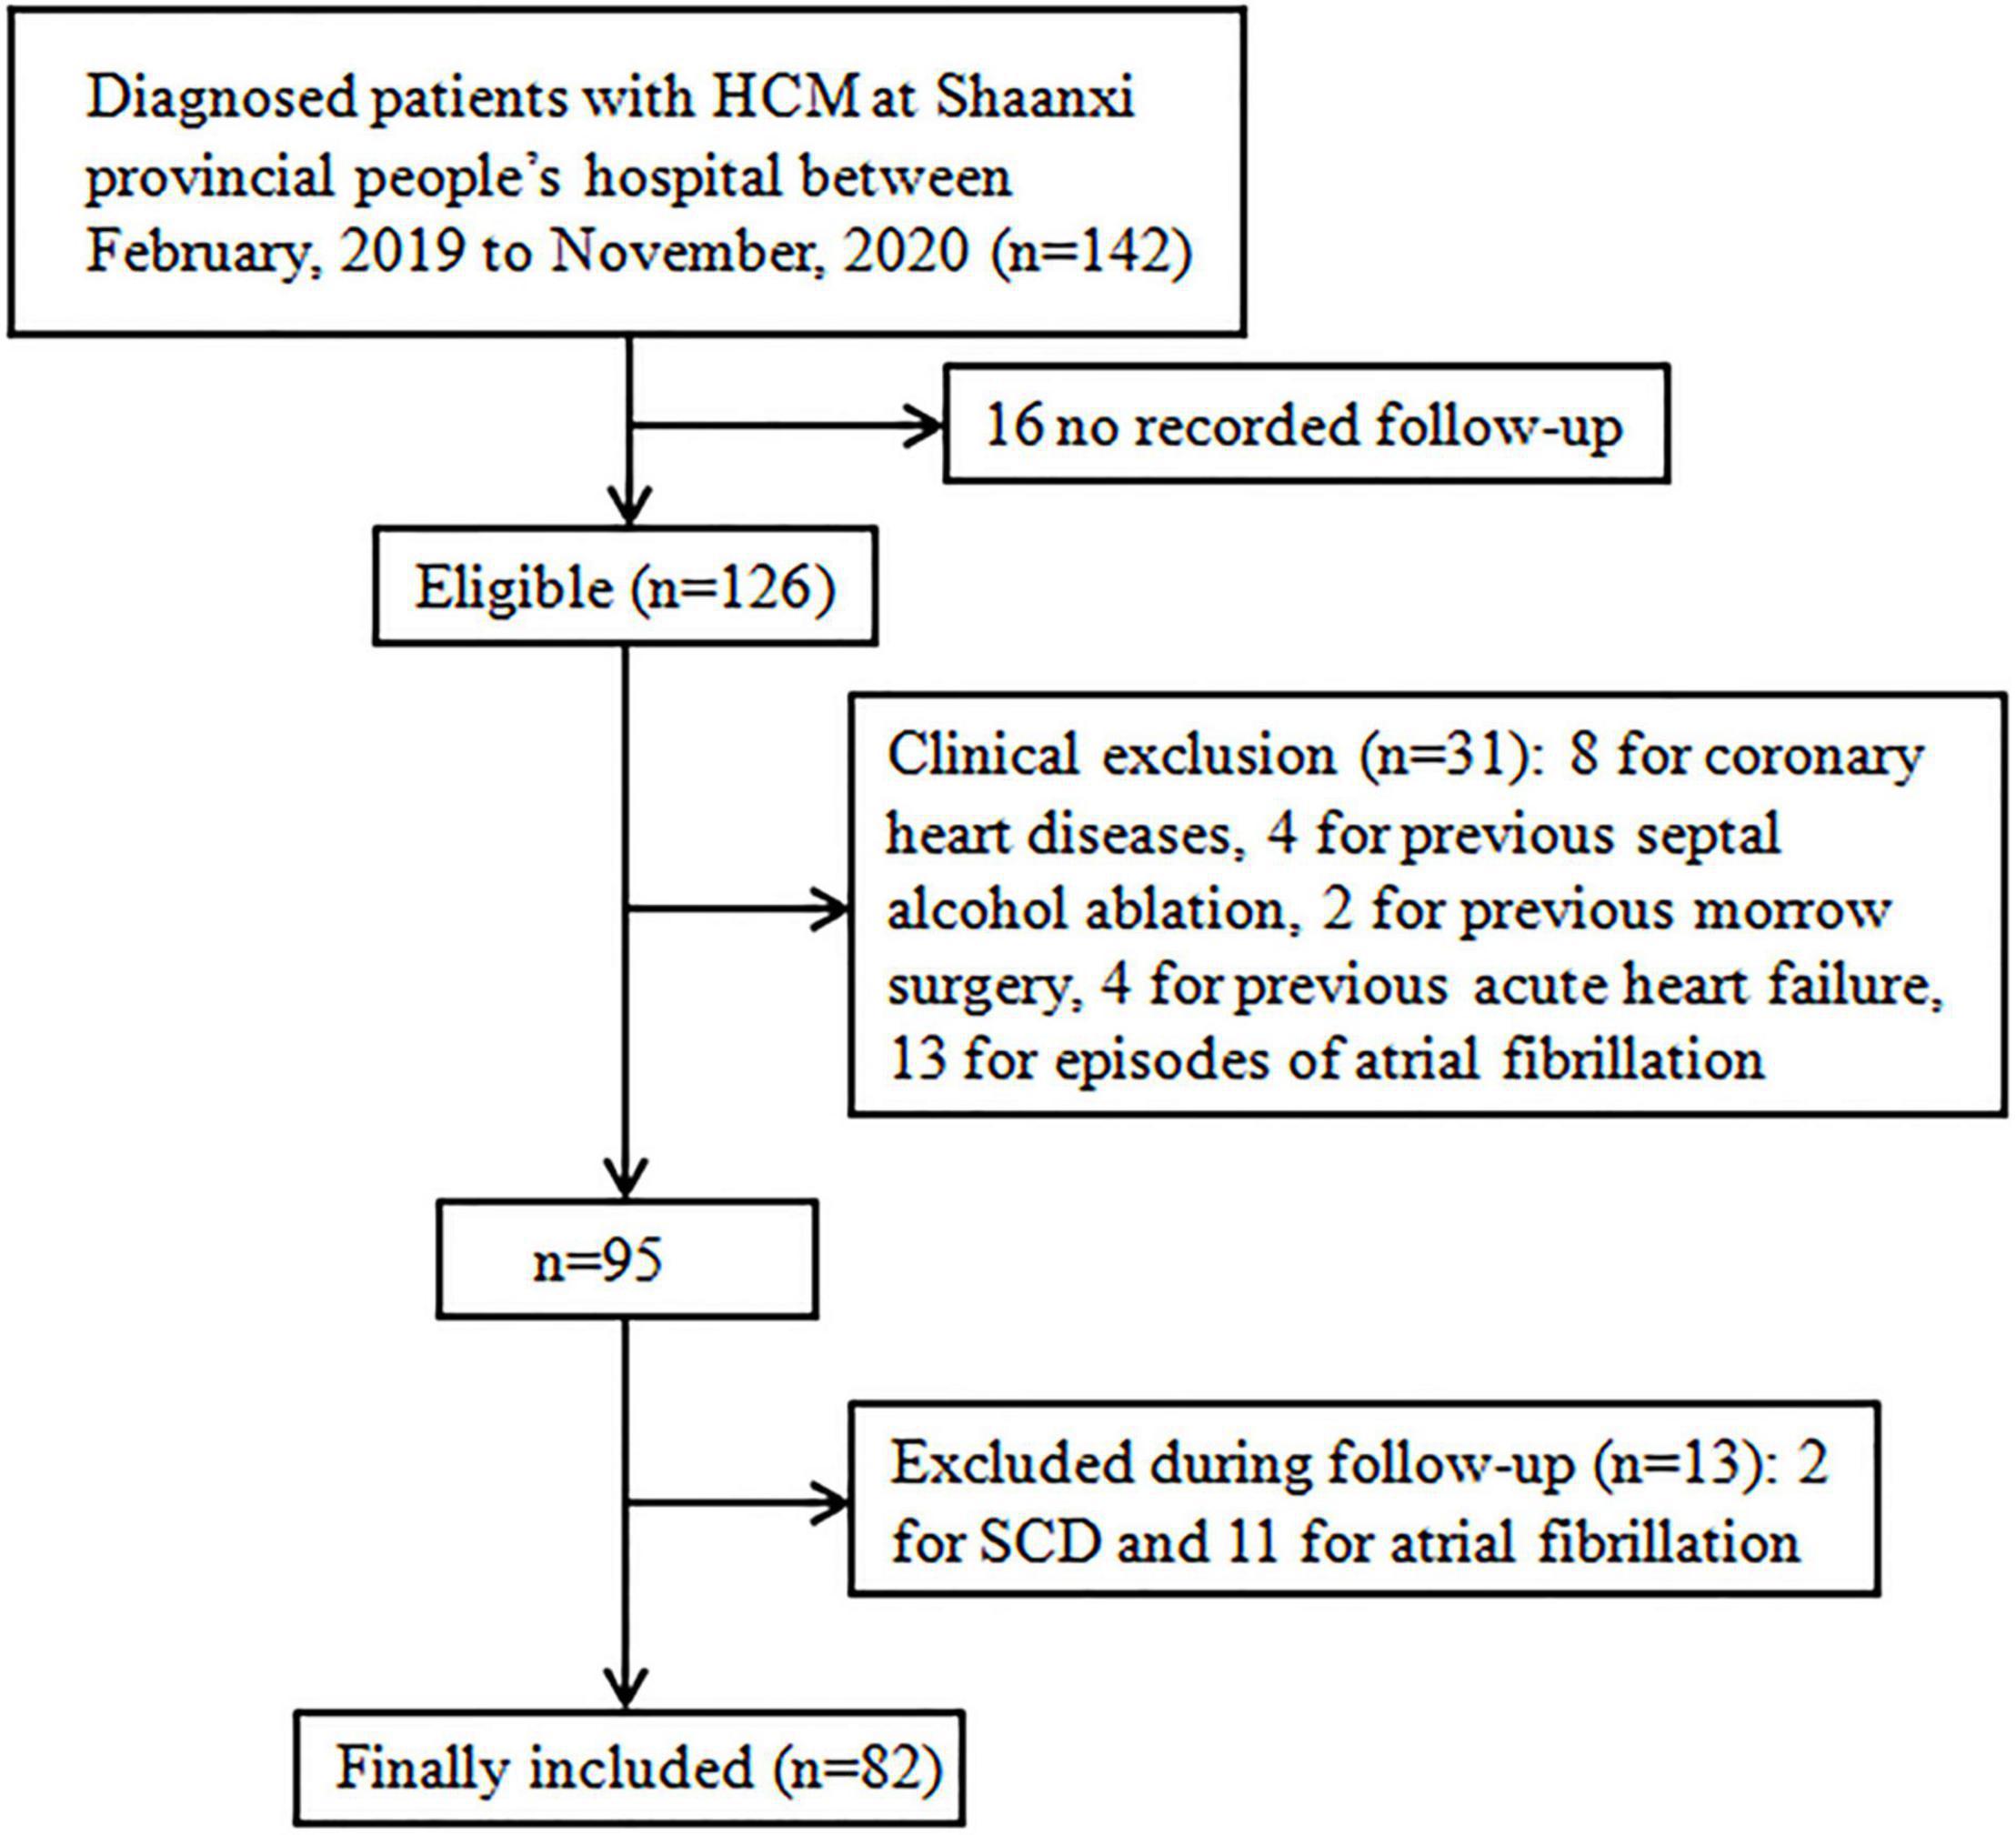
Figure 2. Flow chart. Study selection process: over 142 patients were diagnosed with HCM at Shaanxi Provincial People’s Hospital between February, 2019 and November, 2020 (n = 142), 16 did not have available follow-up data, 8 for coronary heart diseases, 4 for previous septal alcohol ablation, 2 for previous morrow surgery, 4 for previous acute heart failure, 2 for SCD, 10 for previous episode of atrial fibrillation, 11 for onset of atrial fibrillation during follow-up, and 2 for onset of SCD during follow-up; HCM, hypertrophic cardiomyopathy, SCD, sudden cardiac death.
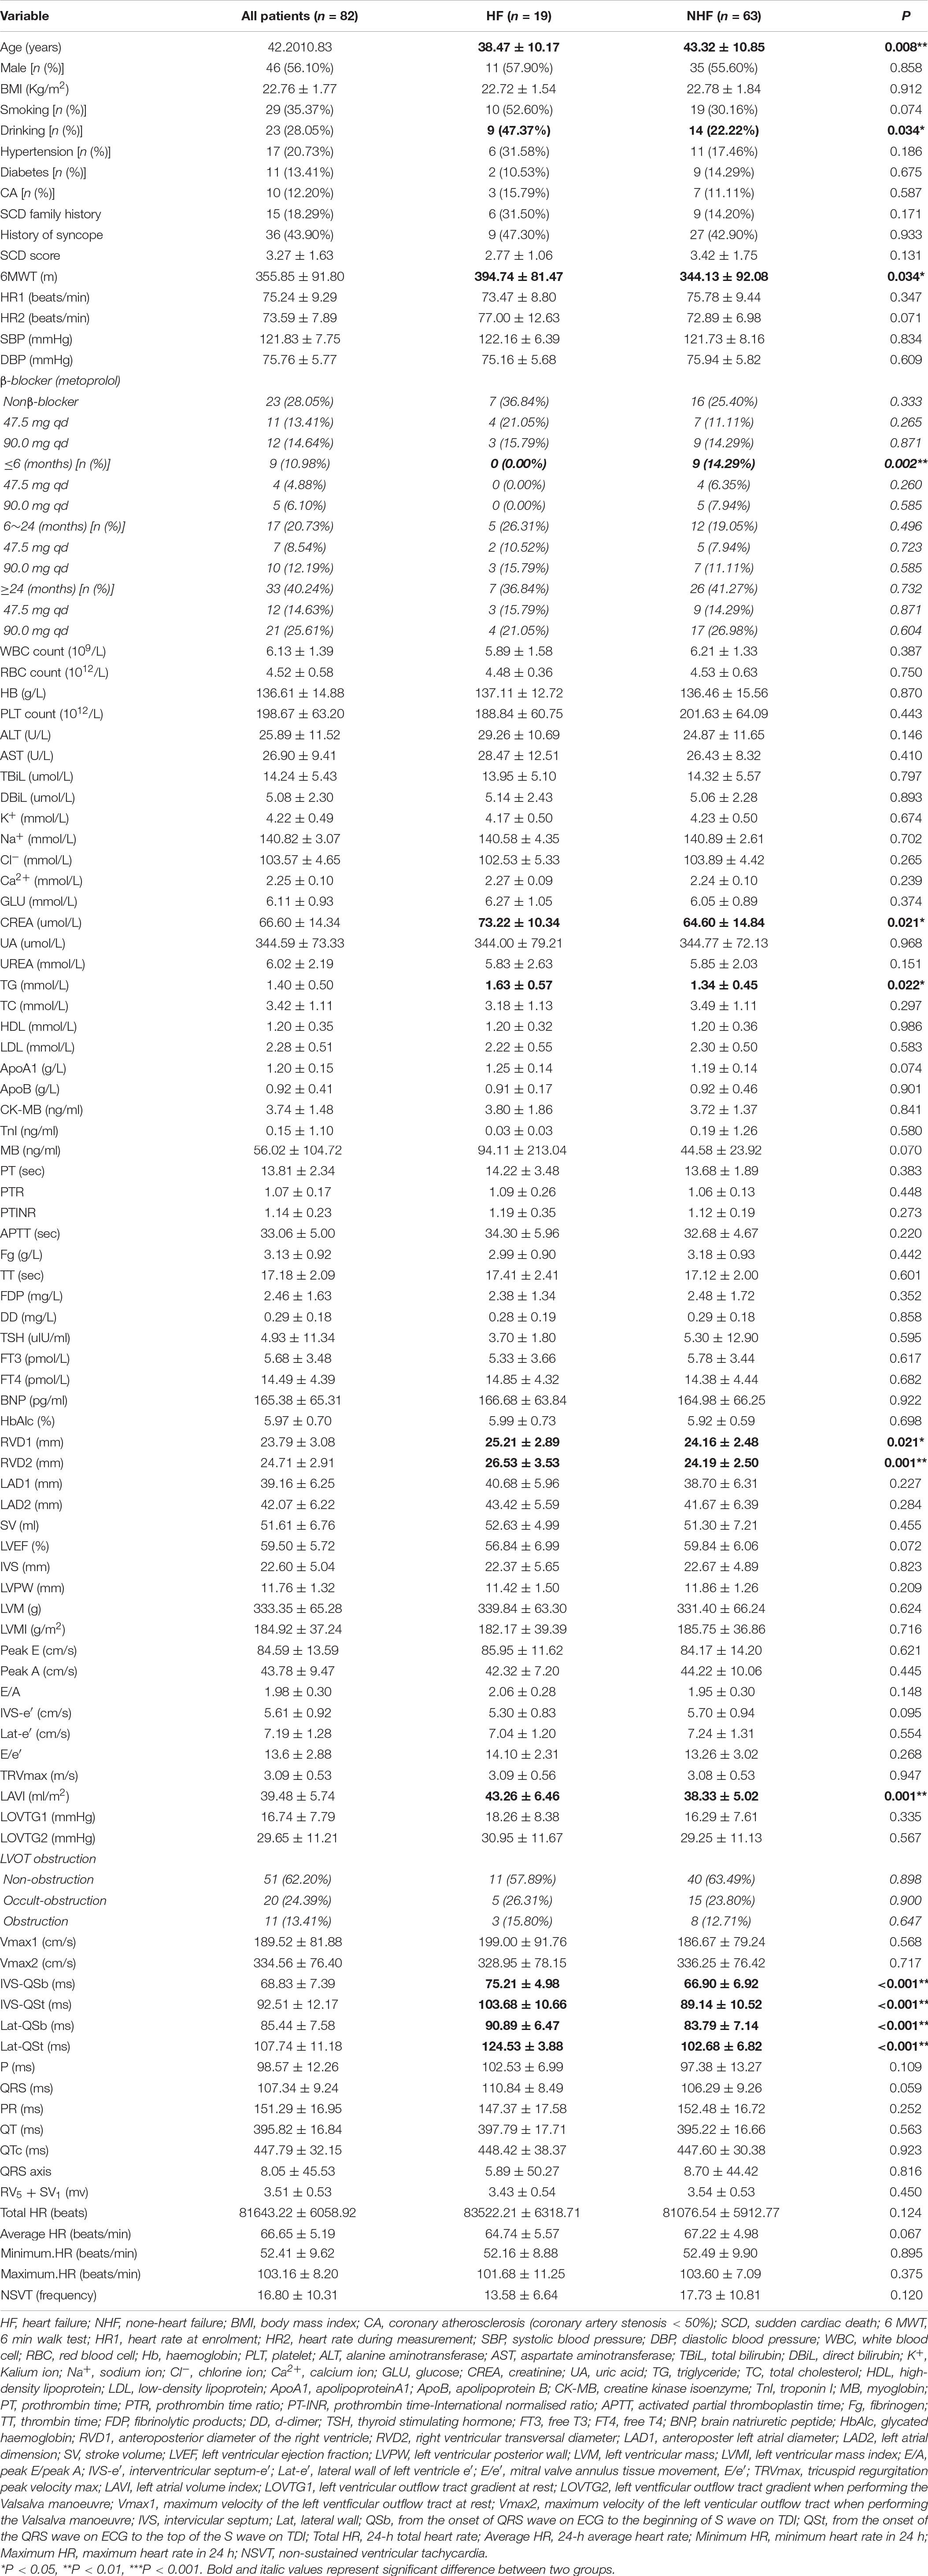
Table 1. Baseline characteristics of patients with and without heart failure (n = 82).
Baseline Characteristics of Patients With and Without Heart Failure
Patients were followed-up for a median duration of 23 months (interquartile range, 11–34 months). Nineteen patients (23.17%) experienced HF. The baseline characteristics of patients with and without HF are outlined in Table 1. There were no significant differences in BMI, HR, IVS thickness, LVEF, LVOTG at rest, and provoked LVOTG. Compared with patients without HF, those who experienced HF had lower age, higher levels of creatine and triglyceride, obviously longer results for the 6-MWT, largest anteroposterior diameter of the right ventricle (RVD-1), larger right ventricular transverse diameter (RVD-2), and greater left atrial volume index (LAVI). Moreover, all four cardiac electromechanical coupling time courses (IVS-QSb, IVS-QSt, Lat-QSb, and Lat-QSt) were longer in patients who experienced HF (p < 0.001 for all comparisons).
Electromechanical Coupling Time Parameters as Independent Predictors of Heart Failure Event
Univariate Cox analyses to predict the endpoint are shown in Table 2. Significant predictors of HF events were IVS-QSb, IVS-QSt, Lat-QSb, Lat-QSt, SCD family history, 6-MWT, CREA, ApoA1, MB, RVD-1, RVD-2, LVEF, LAVI, P, QRS, and PR. Table 3 presents the results of multivariate Cox analysis, which demonstrated that Lat-QSb [hazard ratio (HR): 1.330; 95% confidence interval (95% CI): 1.083–1.633; p = 0.007], Lat-QSt (HR: 1.230; 95% CI: 1.026–1.463; p = 0.025), MB (HR: 1.004; 95% CI: 1.000–1.008; p = 0.042), PR (HR, 0.925; 95% CI, 0.864–0.989; p = 0.023), and LAVI (HR: 1.210; 95% CI: 1.006–1.454; p = 0.043) were significant and independent predictors of HF occurrence.
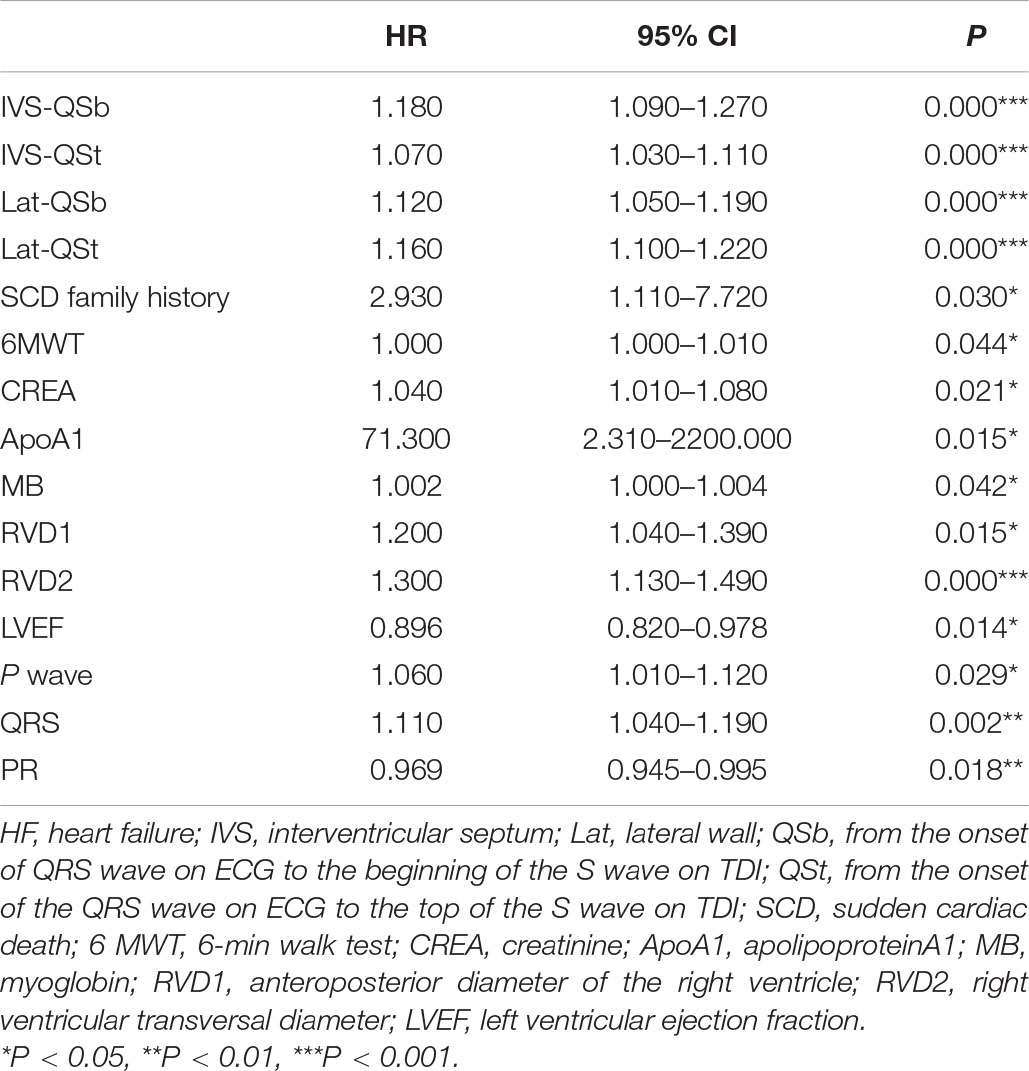
Table 2. Univariate Cox analysis for HF.
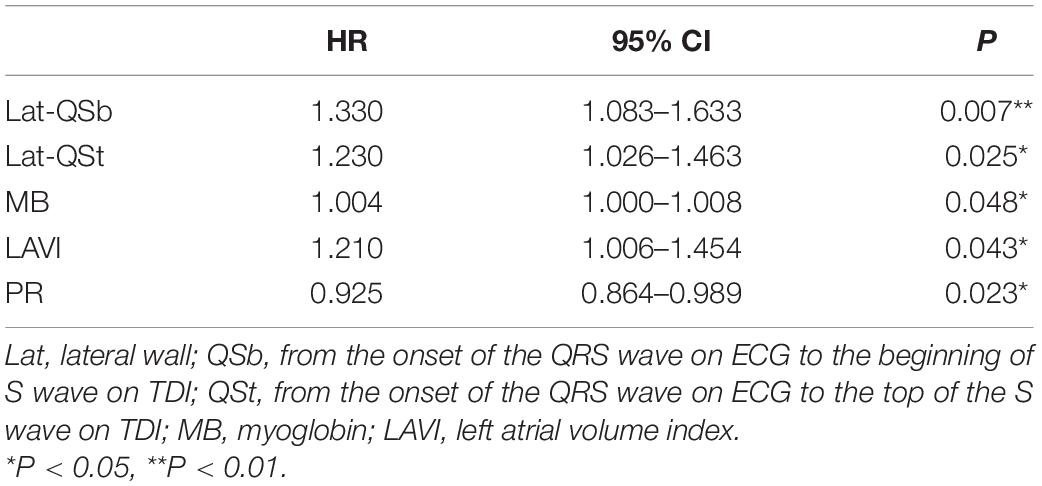
Table 3. Multivariate Cox analysis for HF.
Intraobserver and Interobserver Variability
Additionally, the assessment of intra- and inter-observer variability in electromechanical coupling time parameters documented good ICCs. ICCs of all these parameters (IVS-QSb, IVS-QSt, Lat-QSb, Lat-QSt) were 0.827 (95% CI: 0.756–0.881; p < 0.001).
Predictive Nomogram for the Probability of Heart Failure
Based on the final Cox regression analysis, a nomogram that incorporated independent significant prognostic factors was established (Figure 3). The nomogram illustrated Lat-QSt as sharing the largest contribution to prognosis, followed by PR. Lat-QSb and LAVI had a moderate impact on survival. Each subtype within these variables was assigned a score on a five-point scale. Following the addition of the total score and locating it on the total point scale, a straight line can be drawn down to determine the estimated probability of survival at each time point. In practice, the process has been incorporated into a mobile application (APP)2 to conveniently calculate the HF occurrence probability.
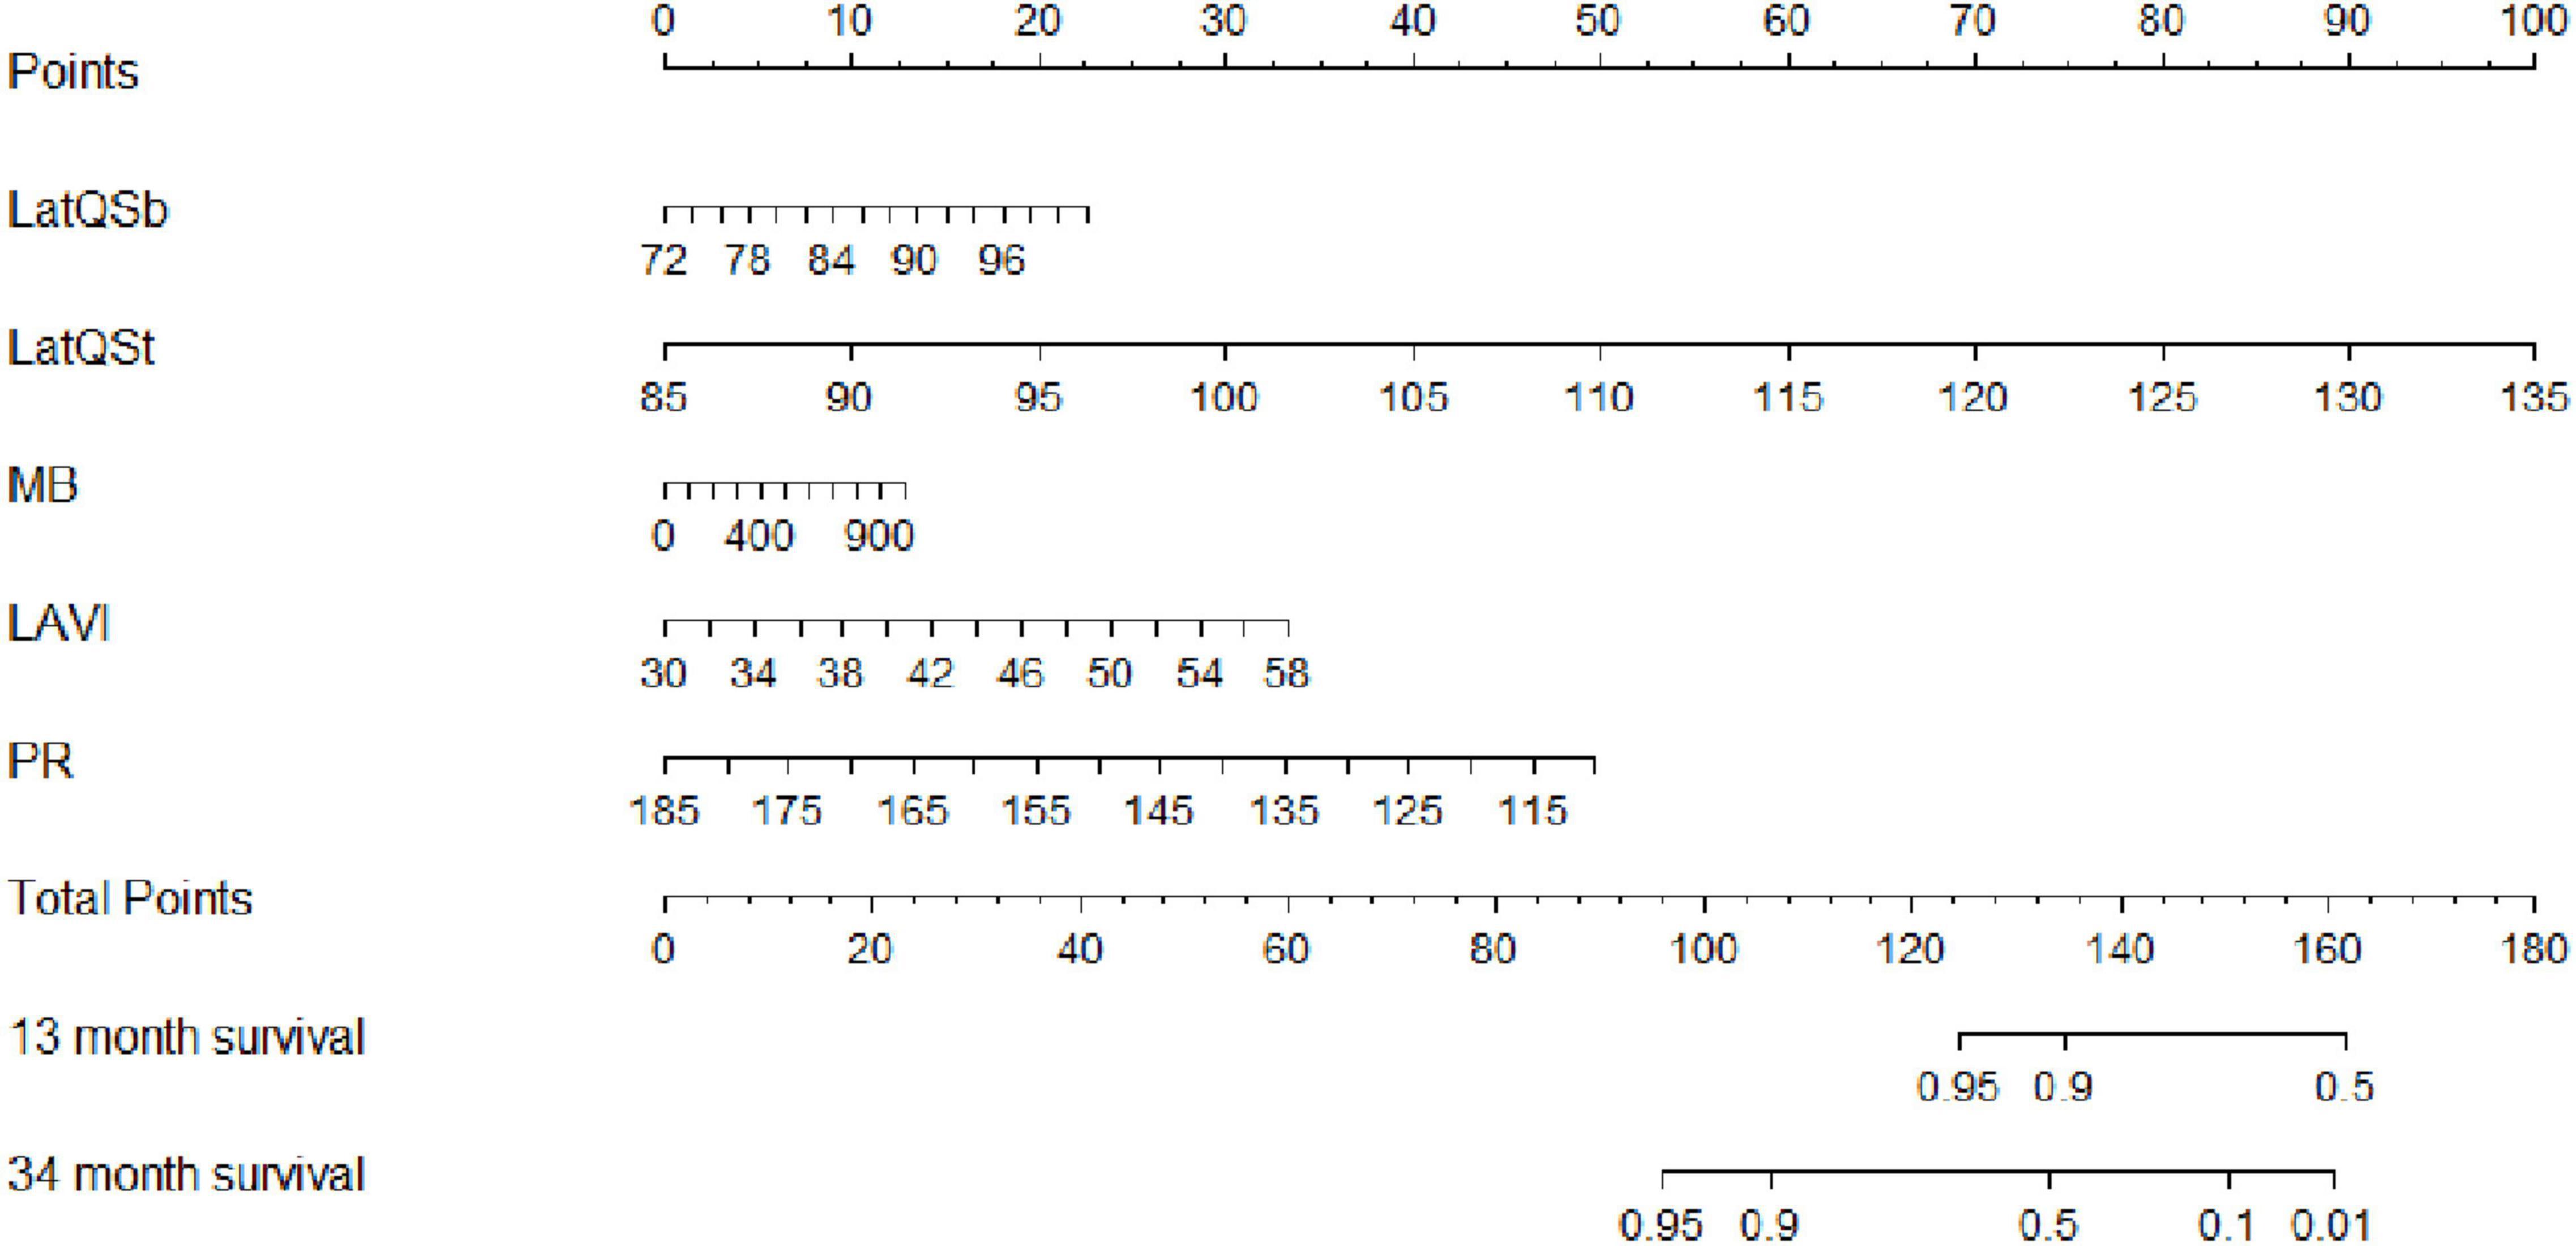
Figure 3. Nomogram to estimate the risk of HF in HCM. To use the nomogram, find the position of each variable on the corresponding axis, draw a line to the points axis for the number of points, add the points from all of the variables, and draw a line from the total points axis to determine the HF probabilities at the lower line of the nomogram. Lat, lateral wall; Qsb, from the onset of QRS wave on ECG to the beginning of S wave on TDI; Qst, from the onset of QRS wave on ECG to the top of S wave on TDI; MB, myoglobin; LAVI, left atrial volume index; PR, PR interval.
We determined the cut-off value by grouping the patients into two subgroups after sorting by total score (score: <230.65, ≥230.65). Stratification of patients into two risk subgroups by applying the cut-off value allowed significant distinction between Kaplan–Meier curves for the cumulative incidence of HF events (Figure 4). A log-rank test of the curves for the two patient groups identified significant intergroup differences (log-rank test = 28.2, p < 0.001).
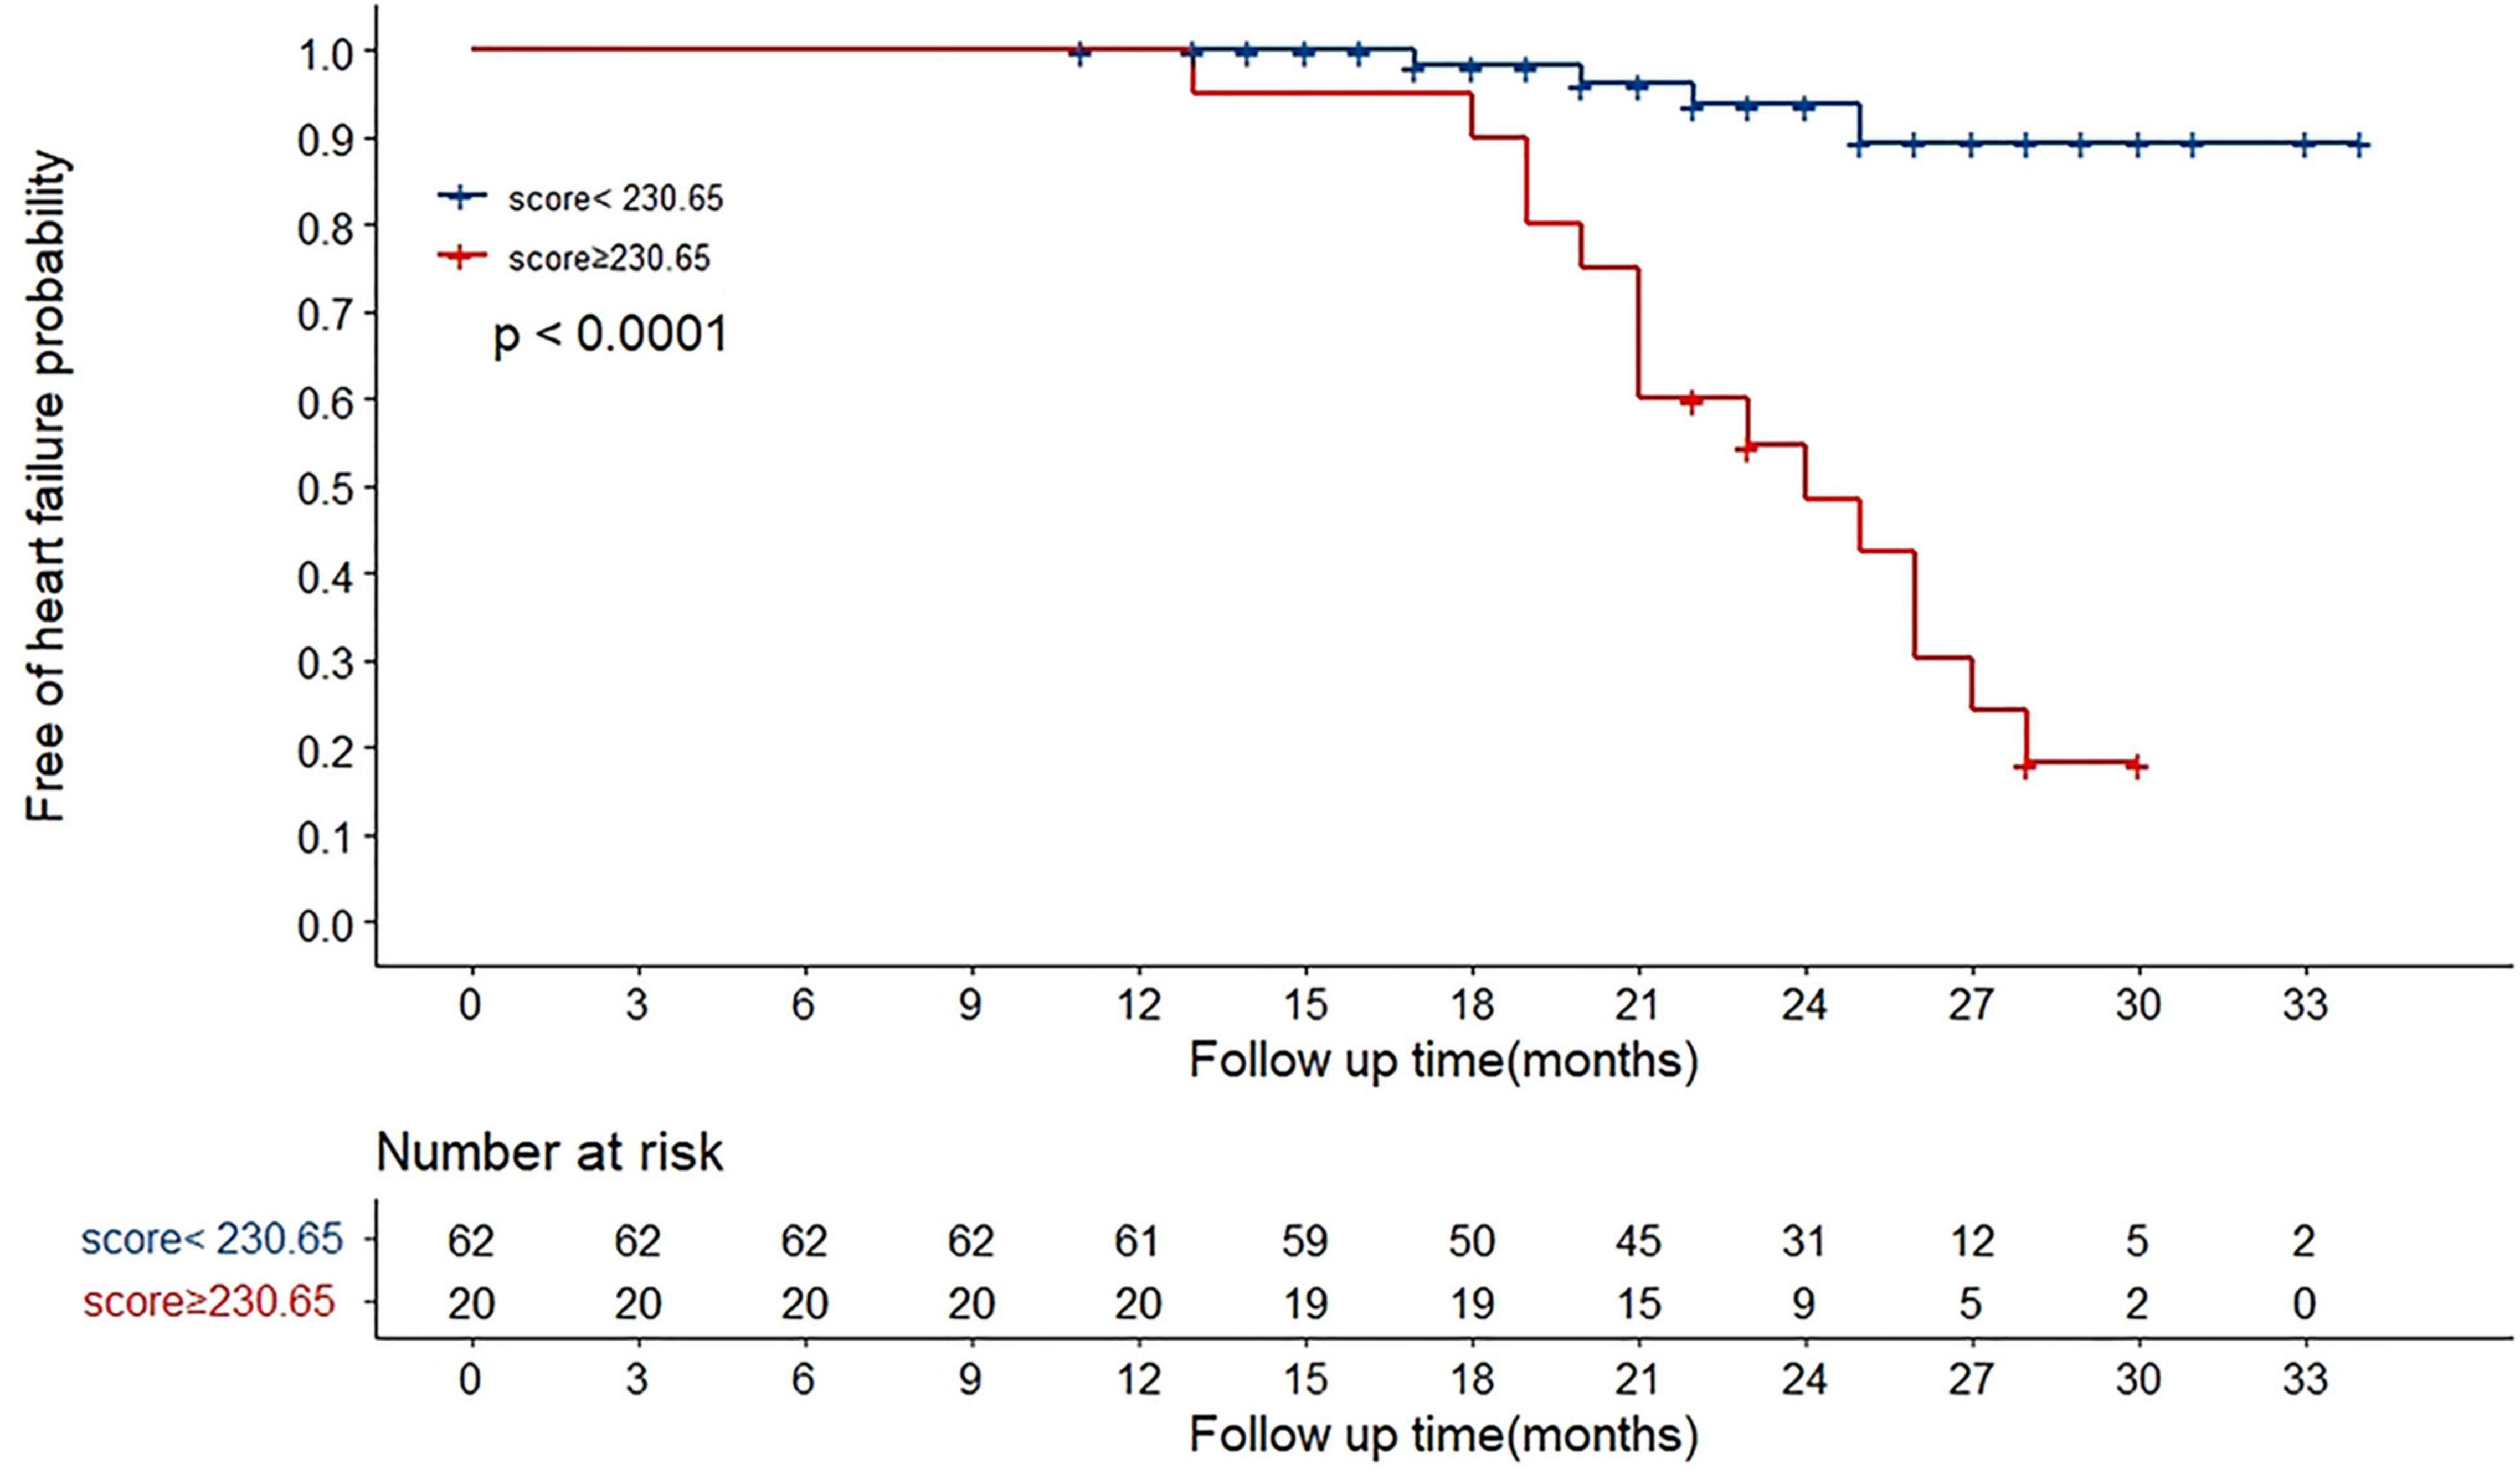
Figure 4. Overall HF occurrence stratified by nomogram in the cohort. The 82 patients were divided into upper and lower groups according to risk scores measured by nomogram (group 1 score: <230.65, group 2 score: ≥230.65). The risk of HF increased along with increasing risk score (log-rank test 28.2, p < 0.001).
Performance of the Predictive Nomogram
We plotted ROC curves to assess the accuracy of nomogram in predicting the risk of HF occurrence. The AUC for combining MB, PR, and LAVI was 0.751 (95% CI: 0.616–0.886), while that for our predictive nomogram was 0.948 (95% CI: 0.885–1.000, p < 0.001) (Figure 5A). Additionally, the nomogram displayed strong discrimination with a C-index of 0.918 (95% CI: 0.867–0.969) and strong calibration. The calibration curve of the accuracy was highly consistent with the diagonal, indicating that the predicted probability of HF was in accordance with the actual probability (Figure 5B).
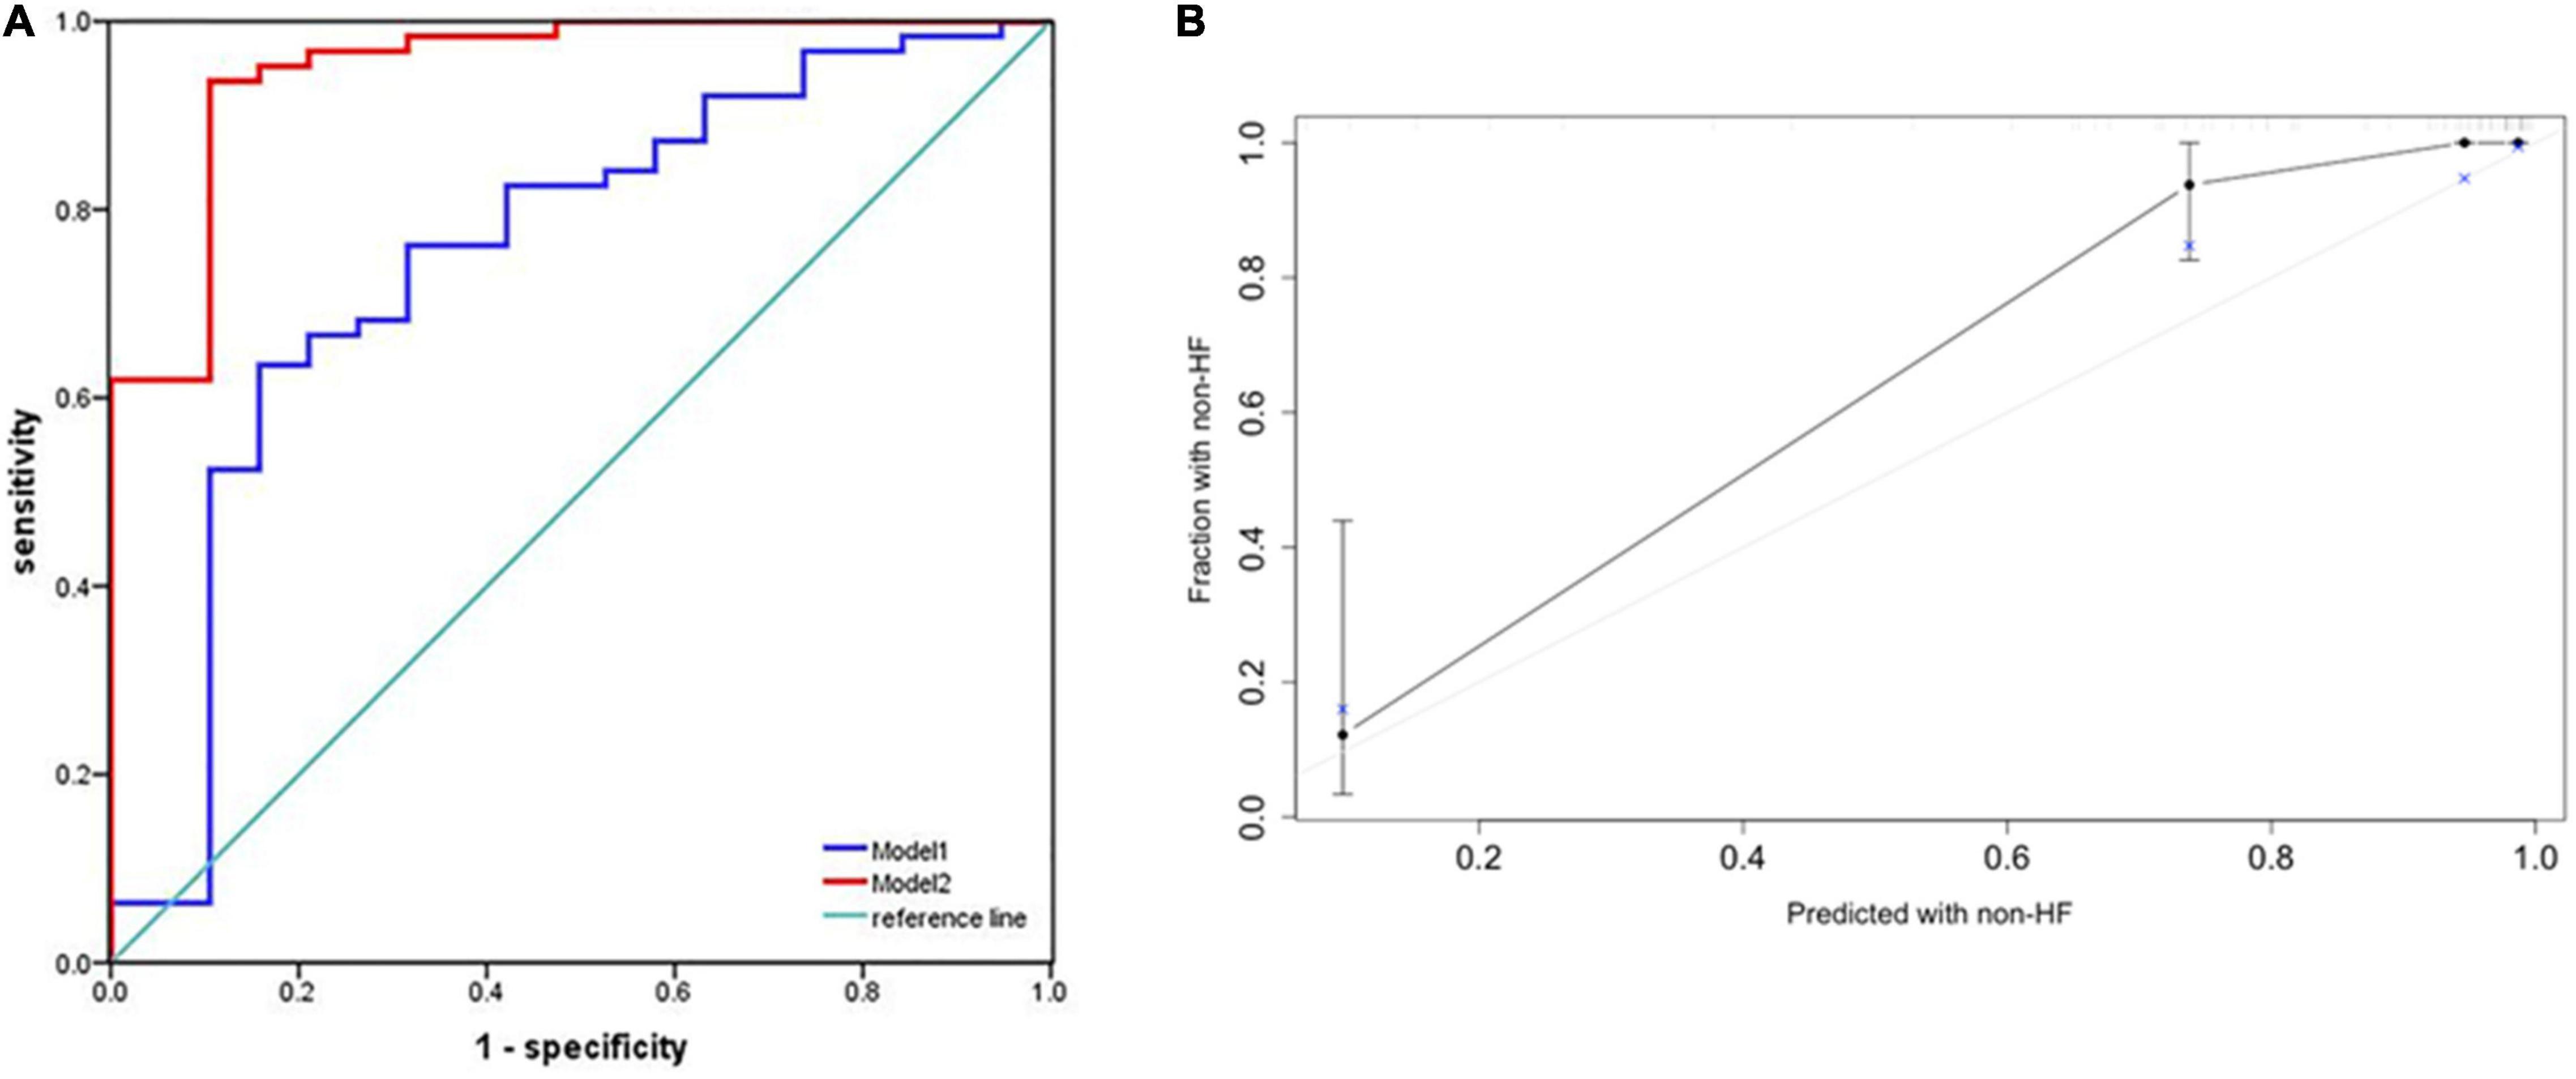
Figure 5. Performance of the predictive nomogram for probabilities of heart failure. (A) Receiver operating characteristic (ROC) curve analysis for predicting heart failure. The area under the curve (AUC) for combining MB, PR, and LAVI was 0.751 (95% CI: 0.616–0.886) (Model 1). When Lat-QSb and Lat-QSt were added to the above model (Model 2), the AUC was 0.948 (95% CI: 0.885–1.000, p < 0.001). (B) Calibration plot of the predictive nomogram for predicting the probabilities of heart failure. An ideal calibration plot is indicated by a 45° diagonal grey line. Lat, lateral wall; QSb, from the onset of Q wave on ECG to the beginning of S wave on TDI; QSt, from the onset of Q wave on ECG to the top of S wave on TDI; MB, myoglobin; LAVI, left atrial volume index; PR, PR interval.
External Validation of the Predictive Nomogram
External validation was performed through comparisons between the nomogram prediction and actual probability for each patient in an independent population. The clinical, demographic, echocardiographic characteristics as well as electromechanical coupling time parameters of the population at the initial evaluation are presented in Supplementary Table 1. The AUC values and C-index in the validation dataset were 0.991 (95% CI: 0.848–1.000, p < 0.001) (Figure 6A) and 0.941 (95% CI: 0.923–1.000), respectively. The calibration plots (Figure 6B) for probabilities of the HF rates presented good concordance between the predicted and observed outcomes.
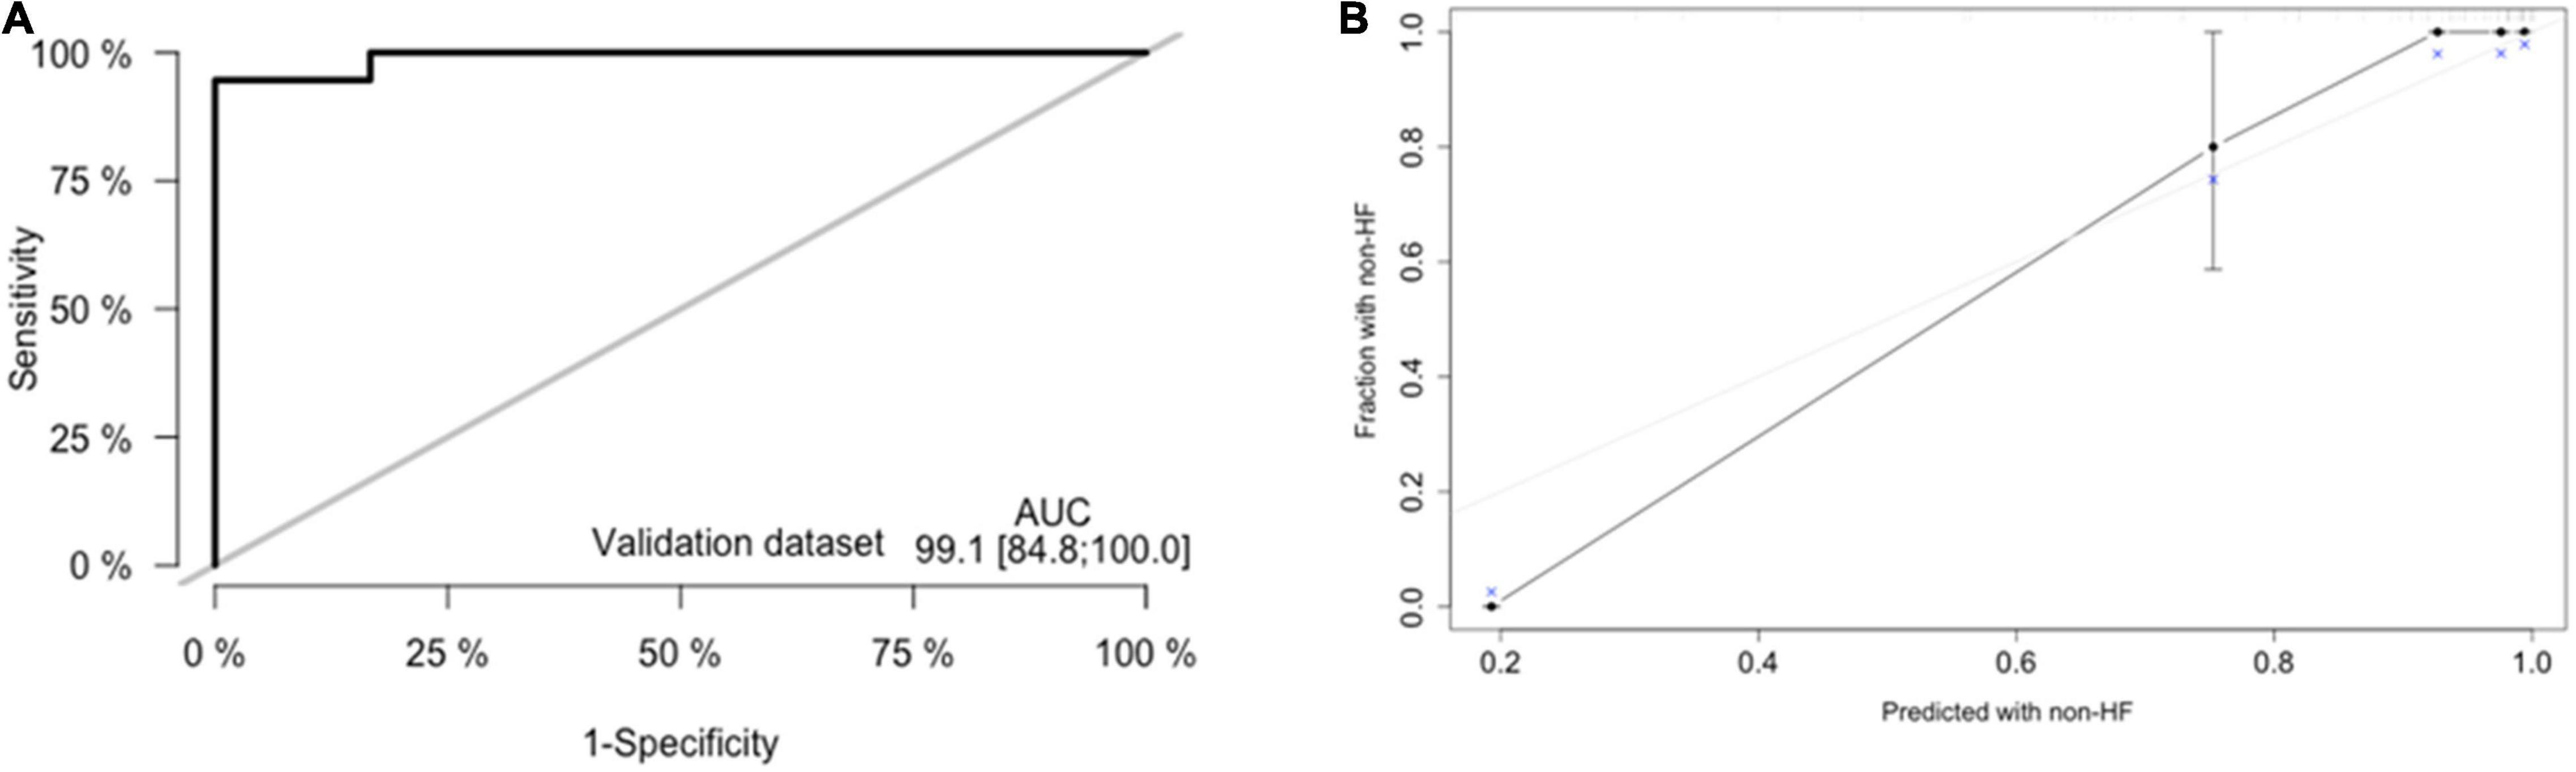
Figure 6. External validation of nomogram in validation dataset. (A) Discrimination: Area under the curve (AUC) of the receiver operating characteristic (ROC) curve analysis was 0.948 (95% CI: 0.885–1.000, p < 0.001). (B) Calibration plot.
Both in training dataset and validation dataset, the DCA curves demonstrated the advantages of using predictive nomogram in clinical settings (Supplementary Figure 1).
Discussion
Since guidelines highlight the evolution of SCD risk stratification strategies to identify patients with SCD and management of left outflow tract (LVOT) obstruction, mortality due to the initiation of SCD and LVOT obstruction has decreased significantly over the years (3, 20). HF development has emerged as a predominant complication in HCM patients; however, there is no recommendation in terms of prevention of HF to meet the needs of patients with HCM. Moreover, few predictive models have been previously explored to predict HF risk in patients with HCM. Our study contributes to the profile of patients with HCM at risk of HF events.
The current cohort study particularly highlights the electromechanical coupling time parameters as independent predictors of HF occurrence in HCM. These time courses represent the efficiency of the electrical activity transferred into mechanical activity, which served as markers of early regional myocardial dysfunction (21). The asymmetry of the heart might influence the electromechanical coupling time; moreover, our study detected electromechanical coupling time course in two walls of the left hypertrophic ventricle (including Lat and IVS). Although all the indexes were significantly longer in HCM patients with HF than in HCM patients without HF, only the electromechanical coupling time courses (Lat-QSb, Lat-QSt) in the lateral wall were associated with the end-point on multivariate analysis. This result might be partly explained by the fact that excitement of the left ventricular lateral wall was usually delayed by 15–20 ms compared with the IVS (22). The association between electromechanical coupling time courses in IVS and HF events attributed to different activation spreads between IVS and the lateral wall, which may be refined by increasing the population sample size.
Additionally, the results revealed that the most significant variables in our model included LAVI, MB, and PR interval. In recent years, LAVI has been recognised as a marker of arrhythmias (23–25), diastolic dysfunction, and haemodynamic load (26) in patients with HCM. Moreover, our study confirmed that LAVI is an independent predictor of HF occurrence in patients with HCM. This result is in line with a few other studies (27), which may shed light on the role of the LA in patients with HCM. The PR interval duration was from the onset of the P wave to the beginning of the QRS wave on the ECG. The exclusion criteria for the PR interval in our study were applied as referenced in a previous meta-analysis, which included extreme PR values (≤80 ms or ≥320 ms), second- or third-degree heart block, Wolff–Parkinson–White syndrome, pacemaker placement, use of class I or III blocking medications, and use of digoxin (28). Our results showed that prolonged PR values ranging from 112 to 182 ms (median: 156 ms) were a significant and independent protective factor for HF. This result may be due to the reduced preload influenced by atrial filling time and has not yet been clarified. A previous large-scale meta-analysis identified genetic variants that were significantly associated with PR interval (28). Interestingly, a variant in MYH6, which encodes a cardiac myosin heavy chain subunit, leads to human HCM (29, 30). This may provide novel clues to the understanding of atrioventricular conduction for cardiac activity in patients with HCM. The hazard ratio of MB in our model was 1.002, which seems to be slightly affected by HF. This clinical meaning of MB has not been determined, and we also have found that it is difficult to elaborate on the issue.
In the present study, a nomogram incorporating significant predictive factors was established. According to our Kaplan–Meier survival analyses, the estimated cumulative occurrence of HF was higher in the nomogram with a cut-off point ≥ 230.65. Based on the nomogram, Lat-QSt shared the largest contribution to HF occurrence, followed by PR, LAVI, and Lat-QSb. We attempted to compare the models with and without electromechanical coupling time courses. Comparing the model of combining PR, LAVI, and MB and adding up Lat-QSt and Lat-QSb increased the discriminatory predictive value, which was shown by the significant increase in AUC from 0.751 to 0.948 and high Harrell’s C-index (0.918; 95% CI: 0.867–0.969) for predicting HF occurrence in patients with HCM. Moreover, the calibration of the nomogram showed optimal agreement between predictive and actual HF events, guaranteeing the repeatability and reliability of the established model (31). Additionally, external validation further determined the generalisability of our predictive model.
To the best of our knowledge, this is the first model for predicting HF in patients with HCM. Nonetheless, there are several caveats and limitations to be noted. First, HCM patients diagnosed with atrial fibrillation or those with atrial fibrillation within the follow-up period were excluded from the study because of selection bias, and our model may underestimate the occurrence of HF. Second, not all potential predictors, such as the global longitudinal strain mentioned previously (9), provoked LVOT gradient, and genetic phenotypes, were tested for HCM patients in clinical practice. Third, our study was based on data obtained from a single centre, and the model still requires additional databases from other centres to be used for external validation.
Conclusion
In conclusion, we established and validated a novel model for predicting HF in patients with HCM. Through this model, clinicians could more easily and precisely identify HCM patients at high risk of HF by using the easy-to-use scoring app that we created (see text footnote 2), which might support performance of specific treatment strategies for individual patients.
Data Availability Statement
The original contributions presented in this study are included in the article/Supplementary Material, further inquiries can be directed to the corresponding author.
Ethics Statement
Our study complied with the Declaration of Helsinki and was approved by the ethics committee of Shaanxi Provincial People’s Hospital. Written informed consent for participation was not required for this study in accordance with the national legislation and the institutional requirements.
Author Contributions
SH and JF performed the ultrasound test and collected the data. SH and LM analysed the data and drafted the manuscript. SH and BL prepared and analysed the data. ZZ, JN, WM, GG, and JW provided the original data. NZ conceived and designed the study, interpreted the results, and drafted and revised the manuscript. All authors provided critical comments on the manuscript, read, and approved the final manuscript.
Funding
This work was supported by the Top-Notch Talent Project of Shaanxi Provincial People’s Hospital (2021BJ-03).
Conflict of Interest
The authors declare that the research was conducted in the absence of any commercial or financial relationships that could be construed as a potential conflict of interest.
Publisher’s Note
All claims expressed in this article are solely those of the authors and do not necessarily represent those of their affiliated organizations, or those of the publisher, the editors and the reviewers. Any product that may be evaluated in this article, or claim that may be made by its manufacturer, is not guaranteed or endorsed by the publisher.
Supplementary Material
The Supplementary Material for this article can be found online at: https://www.frontiersin.org/articles/10.3389/fcvm.2022.895035/full#supplementary-material
Footnotes
References
2. Braunwald E, Lambrew CT, Rockoff SD, Ross J Jr, Morrow AG. Idiopathic hypertrophic subaortic stenosis. I. A description of the disease based upon an analysis of 64 patients. Circulation. (1964) 30:3–119. doi: 10.1161/01.cir.29.5s4.iv-3
3. Authors/Task Force Members, Elliott PM, Anastasakis A, Borger MA, Borggrefe M, Cecchi F, et al. 2014 ESC guidelines on diagnosis and management of hypertrophic cardiomyopathy: the task force for the diagnosis and management of hypertrophic cardiomyopathy of the European society of cardiology (ESC). Eur Heart J. (2014) 35:2733–79. doi: 10.1093/eurheartj/ehu284
4. Maron BJ, Rowin EJ, Udelson JE, Maron MS. Clinical spectrum and management of heart failure in hypertrophic cardiomyopathy. JACC Heart Fail. (2018) 6:353–63. doi: 10.1016/j.jchf.2017.09.011
5. Maron BJ, Ommen SR, Semsarian C, Spirito P, Olivotto I, Maron MS. Hypertrophic cardiomyopathy: present and future, with translation into contemporary cardiovascular medicine. J Am Coll Cardiol. (2014) 64:83–99. doi: 10.1016/j.jacc.2014.05.003
6. Maron BJ. Clinical course and management of hypertrophic cardiomyopathy. N Engl J Med. (2018) 379:655–68.
7. Saito Y, Yamada H, Kusunose K, Saito K, Sata M. Noninvasive assessment of left-ventricular diastolic electromechanical coupling in hypertensive heart disease. J Echocardiogr. (2019) 17:206–12. doi: 10.1007/s12574-019-00421-4
8. Kalra A, Harris KM, Maron BA, Maron MS, Garberich RF, Haas TS, et al. Relation of doppler tissue imaging parameters with heart failure progression in hypertrophic cardiomyopathy. Am J Cardiol. (2016) 117:1808–14. doi: 10.1016/j.amjcard.2016.03.018
9. Reant P, Mirabel M, Lloyd G, Peyrou J, Lopez Ayala JM, Dickie S, et al. Global longitudinal strain is associated with heart failure outcomes in hypertrophic cardiomyopathy. Heart. (2016) 102:741–7. doi: 10.1136/heartjnl-2015-308576
10. Liu H, Pozios I, Haileselassie B, Nowbar A, Sorensen LL, Phillip S, et al. Role of global longitudinal strain in predicting outcomes in hypertrophic cardiomyopathy. Am J Cardiol. (2017) 120:670–5. doi: 10.1016/j.amjcard.2017.05.039
11. Eisner DA, Caldwell JL, Kistamas K, Trafford AW. Calcium and excitation-contraction coupling in the heart. Circ Res. (2017) 121:181–95. doi: 10.1161/CIRCRESAHA.117.310230
12. Gao J, Zhu M, Yu HY, Wang SQ, Feng XH, Xu M. Excitation-contraction coupling time is more sensitive in evaluating cardiac systolic function. Chin Med J (Engl). (2018) 131:1834–9. doi: 10.4103/0366-6999.237395
13. Cohn JN, Francis GS. Stage B, a pre-cursor of heart failure. Heart Fail Clin. (2012) 8:xvii–xviii.
14. Levy D, Salomon M, D’Agostino RB, Belanger AJ, Kannel WB. Prognostic implications of baseline electrocardiographic features and their serial changes in subjects with left ventricular hypertrophy. Circulation. (1994) 90:1786–93. doi: 10.1161/01.cir.90.4.1786
15. Lang RM, Bierig M, Devereux RB, Flachskampf FA, Foster E, Pellikka PA, et al. Recommendations for chamber quantification: a report from the American society of echocardiography’s guidelines and standards committee and the chamber quantification writing group, developed in conjunction with the European association of echocardiography, a branch of the European society of cardiology. J Am Soc Echocardiogr. (2005) 18:1440–63. doi: 10.1016/j.echo.2005.10.005
16. Lang RM, Badano LP, Mor-Avi V, Afilalo J, Armstrong A, Ernande L, et al. Recommendations for cardiac chamber quantification by echocardiography in adults: an update from the American society of echocardiography and the European association of cardiovascular imaging. Eur Heart J Cardiovasc Imaging. (2015) 16:233–70.
17. Yoganathan AP, Cape EG, Sung HW, Williams FP, Jimoh A. Review of hydrodynamic principles for the cardiologist: applications to the study of blood flow and jets by imaging techniques. J Am Coll Cardiol. (1988) 12:1344–53. doi: 10.1016/0735-1097(88)92620-4
18. Chan HL, Lin MA, Chao PK, Lin CH. Correlates of the shift in heart rate variability with postures and walking by time-frequency analysis. Comput Methods Programs Biomed. (2007) 86:124–30. doi: 10.1016/j.cmpb.2007.02.003
19. Zhang XS, Gale RP, Zhang MJ, Huang XJ, Jiang Q. A predictive scoring system for therapy-failure in persons with chronic myeloid leukemia receiving initial imatinib therapy. Leukemia. (2022) 36:1336–42. doi: 10.1038/s41375-022-01527-y
20. Ommen SR, Mital S, Burke MA, Day SM, Deswal A, Elliott P, et al. 2020 AHA/ACC guideline for the diagnosis and treatment of patients with hypertrophic cardiomyopathy: a report of the American college of cardiology/American heart association joint committee on clinical practice guidelines. Circulation. (2020) 142:e558–631.
21. Pai RG, Gill KS. Amplitudes, durations, and timings of apically directed left ventricular myocardial velocities: II. Systolic and diastolic asynchrony in patients with left ventricular hypertrophy. J Am Soc Echocardiogr. (1998) 11:112–8. doi: 10.1016/s0894-7317(98)70068-9
22. Durrer D, van Dam RT, Freud GE, Janse MJ, Meijler FL, Arzbaecher RC. Total excitation of the isolated human heart. Circulation. (1970) 41:899–912. doi: 10.1161/01.cir.41.6.899
23. Limongelli G, Fioretti V, Di Maio M, Verrengia M, Rubino M, Gravino R, et al. Left atrial volume during stress is associated with increased risk of arrhythmias in patients with hypertrophic cardiomyopathy. J Cardiovasc Echogr. (2019) 29:1–6. doi: 10.4103/jcecho.jcecho_45_18
24. Debonnaire P, Joyce E, Hiemstra Y, Mertens BJ, Atsma DE, Schalij MJ, et al. Left atrial size and function in hypertrophic cardiomyopathy patients and risk of new-onset atrial fibrillation. Circ Arrhythm Electrophysiol. (2017) 10:e004052. doi: 10.1161/CIRCEP.116.004052
25. Guttmann OP, Pavlou M, O’Mahony C, Monserrat L, Anastasakis A, Rapezzi C, et al. Predictors of atrial fibrillation in hypertrophic cardiomyopathy. Heart. (2017) 103:672–8.
26. Tsang TS, Barnes ME, Gersh BJ, Bailey KR, Seward JB. Left atrial volume as a morphophysiologic expression of left ventricular diastolic dysfunction and relation to cardiovascular risk burden. Am J Cardiol. (2002) 90:1284–9. doi: 10.1016/s0002-9149(02)02864-3
27. Hiemstra YL, Debonnaire P, van Zwet EW, Bootsma M, Schalij MJ, Bax JJ, et al. Development of and progression of overt heart failure in nonobstructive hypertrophic cardiomyopathy. Am J Cardiol. (2018) 122:656–62. doi: 10.1016/j.amjcard.2018.04.038
28. Lin H, van Setten J, Smith AV, Bihlmeyer NA, Warren HR, Brody JA, et al. Common and rare coding genetic variation underlying the electrocardiographic PR interval. Circ Genom Precis Med. (2018) 11:e002037. doi: 10.1161/CIRCGEN.117.002037
29. Carniel E, Taylor MR, Sinagra G, Di Lenarda A, Ku L, Fain PR, et al. Alpha-myosin heavy chain: a sarcomeric gene associated with dilated and hypertrophic phenotypes of cardiomyopathy. Circulation. (2005) 112:54–9. doi: 10.1161/CIRCULATIONAHA.104.507699
30. Jiang J, Wakimoto H, Seidman JG, Seidman CE. Allele-specific silencing of mutant Myh6 transcripts in mice suppresses hypertrophic cardiomyopathy. Science. (2013) 342:111–4. doi: 10.1126/science.1236921
Keywords: hypertrophic cardiomyopathy, heart failure, electromechanical coupling time, scoring app, predictive model
Citation: Hu S, Mi L, Fu J, Ma W, Ni J, Zhang Z, Li B, Guan G, Wang J and Zhao N (2022) Model Embraced Electromechanical Coupling Time for Estimation of Heart Failure in Patients With Hypertrophic Cardiomyopathy. Front. Cardiovasc. Med. 9:895035. doi: 10.3389/fcvm.2022.895035
Received: 12 March 2022; Accepted: 16 May 2022;
Published: 16 June 2022.
Edited by:
Emanuele Monda, University of Campania Luigi Vanvitelli, ItalyReviewed by:
Michele Lioncino, University of Campania Luigi Vanvitelli, ItalyQian Chen, Guangxi Medical University Cancer Hospital, China
Copyright © 2022 Hu, Mi, Fu, Ma, Ni, Zhang, Li, Guan, Wang and Zhao. This is an open-access article distributed under the terms of the Creative Commons Attribution License (CC BY). The use, distribution or reproduction in other forums is permitted, provided the original author(s) and the copyright owner(s) are credited and that the original publication in this journal is cited, in accordance with accepted academic practice. No use, distribution or reproduction is permitted which does not comply with these terms.
*Correspondence: Na Zhao, 173307845@qq.com
†These authors have contributed equally to this work