What Does Sleeping Brain Tell About Stress? A Pilot Functional Near-Infrared Spectroscopy Study Into Stress-Related Cortical Hemodynamic Features During Sleep
 Zilu Liang1,2*
- 1Ubiquitous and Personal Computing Laboratory, Faculty of Engineering, Kyoto University of Advanced Science, Kyoto, Japan
- 2Institute of Industrial Science, The University of Tokyo, Tokyo, Japan
People with mental stress often experience disturbed sleep, suggesting stress-related abnormalities in brain activity during sleep. However, no study has looked at the physiological oscillations in brain hemodynamics during sleep in relation to stress. In this pilot study, we aimed to explore the relationships between bedtime stress and the hemodynamics in the prefrontal cortex during the first sleep cycle. We tracked the stress biomarkers, salivary cortisol, and secretory immunoglobulin A (sIgA) on a daily basis and utilized the days of lower levels of measured stress as natural controls to the days of higher levels of measured stress. Cortical hemodynamics was measured using a cutting-edge wearable functional near-infrared spectroscopy (fNIRS) system. Time-domain, frequency-domain features as well as nonlinear features were derived from the cleaned hemodynamic signals. We proposed an original ensemble algorithm to generate an average importance score for each feature based on the assessment of six statistical and machine learning techniques. With all channels counted in, the top five most referred feature types are Hurst exponent, mean, the ratio of the major/minor axis standard deviation of the Poincaré plot of the signal, statistical complexity, and crest factor. The left rostral prefrontal cortex (RLPFC) was the most relevant sub-region. Significantly strong correlations were found between the hemodynamic features derived at this sub-region and all three stress indicators. The dorsolateral prefrontal cortex (DLPFC) is also a relevant cortical area. The areas of mid-DLPFC and caudal-DLPFC both demonstrated significant and moderate association to all three stress indicators. No relevance was found in the ventrolateral prefrontal cortex. The preliminary results shed light on the possible role of the RLPCF, especially the left RLPCF, in processing stress during sleep. In addition, our findings echoed the previous stress studies conducted during wake time and provides supplementary evidence on the relevance of the dorsolateral prefrontal cortex in stress responses during sleep. This pilot study serves as a proof-of-concept for a new research paradigm to stress research and identified exciting opportunities for future studies.
1 Introduction
There is abundant evidence that mental stress is often linked to reduced sleep quality, suggesting abnormalities in brain activity during sleep when people are stressed (Buysse et al., 2011). While our understanding into how stress affects brain activity when we are awake (and are engaged in lab-based stress induction tasks) has been greatly advanced in recent years (Alonso et al., 2015; Kramer et al., 2017; Chang and Yu, 2018; Rosenbaum et al., 2018; Rampino et al., 2019; Schaal et al., 2019; Rosenbaum et al., 2021), no study has looked at how stress modulates brain activity during sleep. Attempts to study stress during sleep face several challenges. First, traditional neuroimaging techniques for studying stress in daytime are not suited for in-sleep measurement due to various methodological restraints imposed by these techniques. Hemodynamic imaging methods such as functional magnetic resonance imaging (fMRI) can generate hemodynamic profiles at high spatial resolution, but they are invasive as people could hardly fall asleep in noisy fMRI scanners. Functional near-infrared spectroscopy (fNIRS) achieves better trade-off between convenience and spatial resolution, but traditional fNIRS systems still use many cables which make them unsuited for measurement during sleep. Electrophysiological neuroimaging techniques such as electroencephalography (EEG) is widely used to measure brain activity during sleep, but their spatial resolution is limited, and they are sensitive to motion artifacts. Second, laboratory-induced stress response is often temporary, and the effect could barely sustain until and throughout nocturnal sleep (Rosenbaum et al., 2021). Established methods for inducing social stress (e.g., the Trier Social Stress Test (Chang and Yu, 2018)), emotional stress (e.g., viewing scary pictures (Rampino et al., 2019)), and physical stress (e.g., sleep deprivation (Alonso et al., 2015)) may fail to mirror natural stress responses, as a laboratory setting often does not represent the typical conditions under which stress occurs in real life (Wolfram et al., 2013). Laboratory-induced stress responses often fade out in an hour (Rosenbaum et al., 2021; Rosenbaum et al., 2018), while real-life stress responses could last hours to days or even longer after the onset of the stressors (Joëls and Baram, 2009). Another pitfall of lab-based stress induction protocols is that they are unsuited for longitudinal repeated measurement from individual subjects as they are likely to cause response habituation especially in the hypothalamic–pituitary–adrenal (HPA) axis as indicated by the cortisol secretion level (Schommer et al., 2003; Kudielka et al., 2006; Jönsson et al., 2010; Gianferante et al., 2014). In addition, stress has been routinely treated as a dichotomous variable (i.e., stress is either present or absent) in many research studies. In real life, however, people may experience various levels of stress with different temporal profiles (Joëls and Baram, 2009). The dichotomous perspective of stress is also unnatural when biomarkers of stress responses such as cortisol is used as an indicator because it is difficult to set a universal cutoff line that accommodates interpersonal variability.
This pilot study is the first to look at how bedtime stress associates to brain activity during sleep. We aimed to explore which cortical areas demonstrate stress-related blood flow patterns during the first sleep cycle. Especially, we focused on answering the following two research questions:
• What hemodynamic features are significantly associated to each stress indicator?
• Which sub-regions in the PFC are significantly associated to each stress indicator?
The study design included addressing the limitations of the existing research paradigm. Table 1 highlights the originality of the present study in comparison with previous studies. This study adopted the N-of-1 approach which is an idiographic research methodology that overcomes the pitfalls of the widely adopted large-sample approach. The large-sample approach requires stringent conditions such as cohort homogeneity—a condition difficult to meet no matter how large the sample size is. When the within-subject variability is much larger than the inter-subject variability, which is common in psychology and physiology studies, the large-sample approach often fails to provide us with findings that generalize well to individuals (Molenaar, 2004; Barlow and Nock, 2009; Mehl and Conner, 2012; van Ockenburg et al., 2015; Burg et al., 2017; Fishera et al., 2018; Piccirillo et al., 2019). In contrast, the N-of-1 approach embraces longitudinal repeated measurement on a single subject to generate the most relevant and reliable information for the specific person, which represents a true scientific undertaking (Barlow and Nock, 2009).
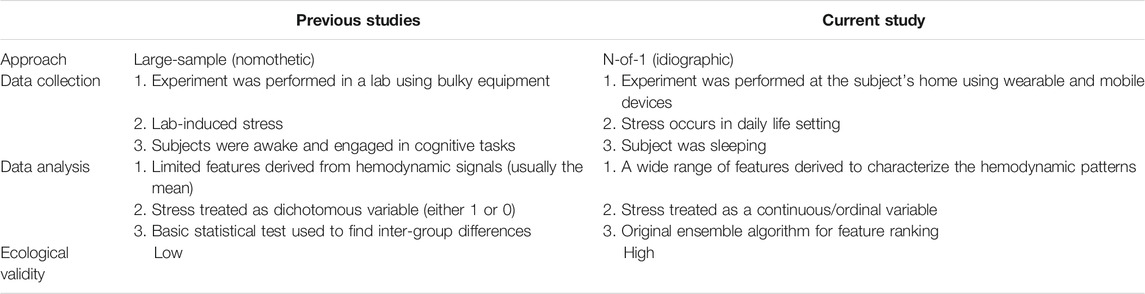
TABLE 1. Research paradigm comparison between the current study and previous studies.
With respect to the experiment settings, we performed the measurement at the subject’s home using a cutting-edge wearable fNIRS system together with non-invasive wearable and mobile devices to achieve the highest level of ecological validity. We also did not rely on lab-based stress induction protocols, as they require the subjects to be actively engaged in cognitive tasks and often fail to induce stress responses that sustain until bedtime. Instead, we tracked the stress indicators on a daily basis, and utilized the days of lower levels of measured stress as natural controls to the days of higher levels of measured stress. Stress responses in human may manifest in multiple physiological systems with varied temporal profile (Joëls and Baram, 2009). In this study, stress was quantified using both objective and subjective indicators. The objective indicators included two widely used stress biomarkers that reflect the hormonal and immunological responses to stress: salivary cortisol and secretory immunoglobulin A (sIgA). The rise of salivary cortisol reveals the stress-related changes in the hypothalamic–pituitary–adrenal (HPA) axis. Meanwhile, stress-associated immunological response could occur more rapidly compared to the HPA axis, characterized by a quick and temporal rise and then decrease in sIgA (Engeland et al., 2016). sIgA may also be a valuable indicator for differentiating between positive and negative stress effects or between successful and unsuccessful adaptation or coping with situational demands (Zeier et al., 1996). The subjective perception of stress can be measured using psychometric instruments ranging from as simple as a Likert scale to as complex as the 30-item Perceived Stress Questionnaire (PSQ) (Levenstein et al., 1993). In this study, the perceived stress level was rated on a 1–10 Likert scale that was implemented using a mobile application. Another significant difference of this study is that the measurement was mostly performed when the subject was sleeping, while in previous stress neuroimaging studies the subjects were all awake and were engaged in cognitive tasks.
In this study, stress response was treated as a continuous phenomenon in contrast to the traditional dichotomous perspective. The data analysis focused on finding significant associations between cortical hemodynamic features and each individual stress indicator. Previous studies mostly rely on one feature type—the mean of the concentration changes in oxyhemoglobin (ΔO2Hb) and deoxyhemoglobin (ΔHHb). While this feature type has the merit of easy interpretation, it fails to fully capture the characteristics of the cortical hemodynamic signals. In search for the most useful stress-association features, we derived a wide range of time-domain, frequency-domain, and nonlinear features from the cortical hemodynamic signals. We also proposed an original ensemble feature ranking algorithm that leverages six different statistical and machine learning techniques to generate an average importance score for each feature.
This pilot study does not intend to generate conclusive findings, but rather serves as a proof-of-concept for a new research paradigm that can be implemented to study stress in unexplored settings (e.g., during sleep). Understanding the neurophysiological mechanism that underlies the relation between stress and sleep has the significance of giving hint to the development of brain activity markers of stress, which can be readily measured and monitored using wearable brain imaging technologies. Despite of being a small-scale pilot study, the data collection and analysis protocols are readily applicable to large-scale studies. The observations from this study serve as a foundation for future research to elucidate where the brain processes stress during sleep, based on which new stress indicators or stress coping strategies may be developed.
2 Data Collection
2.1 Measuring Stress
In this study, we quantified stress using both objective (i.e., cortisol and sIgA) and subjective indicators (i.e., perceived stress rating). Salivary cortisol and sIgA were measured using the SOMA Dual Analyte LFD test kits. These kits can be used for real-time measurement in a naturalistic setting. Saliva samples were collected using oral fluid collector (OFC) swabs and were incubated for 15 min in OFC buffers before being read. The participant was instructed not to eat, drink, or brush teeth 30 min prior to providing saliva samples. The calibration range of cortisol and sIgA were 1.25–40 nmol/L and 25–800 μg/ml, respectively (Dunbar et al., 2015). The validity of the SOMA kits has been examined in previous studies (Mitsuishi et al., 2019). The measured salivary cortisol and sIgA data were manually logged in a CSV file. Perceived stress was rated on a 1–10 Likert scale (1 = not stressed at all; 10 = extremely stressed) which was implemented using a mobile application named HealthLog.
2.2 Measuring Prefrontal Hemodynamics
A wearable functional near-infrared spectroscopy (fNIRS) (Brite 24; Artinis Medical Systems Co., Netherlands) was used to measure the concentration changes in oxyhemoglobin (ΔO2Hb) and deoxyhemoglobin (ΔHHb) in the PFC. The fNIRS is a non-invasive brain imaging technique that strikes a good trade-off between temporal and spatial resolution (Tak and Ye, 2014). The advantage of the Brite 24 system—which weighs only 300 g—is that it permits the monitoring of ΔO2Hb and ΔHHb without imposing constraints on the posture and movement of the subject, and thus is suited for studying cortical hemodynamics during sleep. In this study, the Brite 24 consists of 10 transmitters (Tx) and 8 receivers (Rx). The Txs take turns to emit light at wavelengths of 760 nm (dominantly absorbed by HHb) and 850 nm (dominantly absorbed by O2Hb). They were fixed on a soft neoprene head cap, which ensures the alignment of optode placement across different measurements. The optodes were placed at an interoptode distance of 3 cm to achieve the maximum penetration depth of 1.5 cm and were configured into 27 channels as shown in the Template DAQ state at the bottom of Figure 1. All optodes were placed between the FpZ–F3–Cz–F4–FpZ regions in the PFC according to the international 10–20 EEG system. The sampling rate was set to 50 Hz. The Brite 24 device has a battery life of up to 2.5 h when it is used for continuous online measurement. While the battery life could be extended by connecting the device to an external power supply, we decided not to use that strategy out of safety concern for the subject. The PFC was selected as the region of interest in this pilot study because previous studies performed during wake time have shed light on the role of the PFC in responding to acute and chronic stress (Cerqueira et al., 2007; Hains and Arnsten, 2008; Dedovic et al., 2009; Yuen et al., 2009; Arnsten et al., 2015; Nejati et al., 2021).
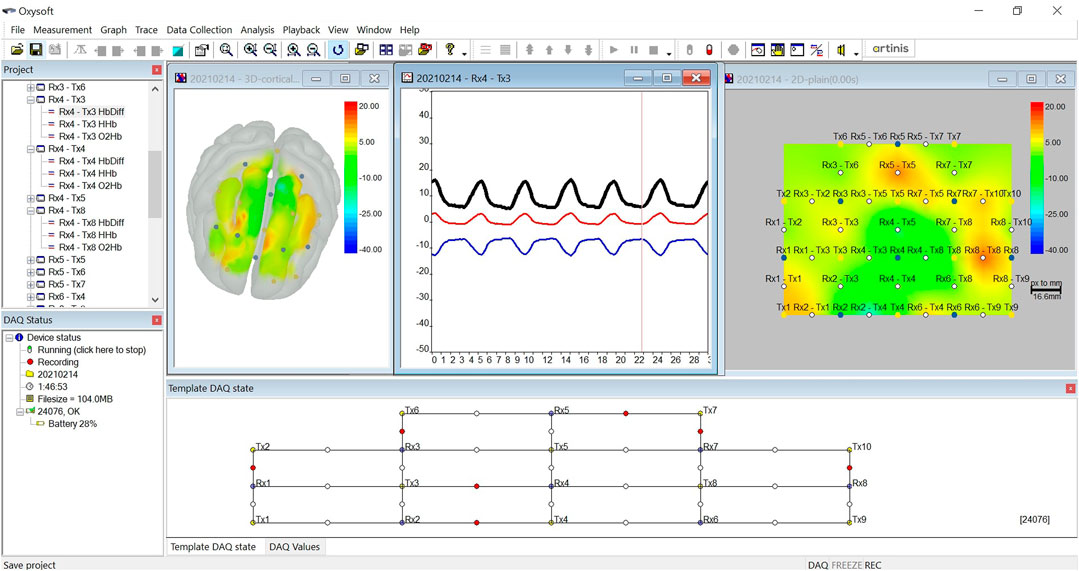
FIGURE 1. Screenshot of the OxySoft.
The Brite 24 system consists of companion software named OxySoft. The software allows the real-time inspection of the signal quality of each channel when the fNIRS device is paired up via Bluetooth connection. Channels with poor quality are marked by red dots, as shown at the bottom of Figure 1. The OxySoft supports several visualization formats of the ΔO2Hb and ΔHHb signals, including time series plots, 2D heatmap, and 3D heatmap in a glass head. The data recorded by the Brite 24 device were synchronized with the software at regular time interval and were stored in temporal files. When a measurement was stopped, OxySoft processed the temporal files to generate a complete data file that contained raw optical density (OD) data.
2.3 Measuring Complementary Physiological Data
In addition to the Brite 24 system, we also used a Fitbit Sense together with the companion Fitbit app to collect complementary data of sleep, heart rate, and breath rate. These data were utilized in the data preprocessing pipeline to remove physiological artifacts, which is described in detail in the next section. Fitbit is well-suited to this study as it supports the collection of multiple streams of physiological signals without imposing additional burden to the subject. Despite that Fitbit devices may not offer medical-grade measurements, numerous validation studies have demonstrated that Fitbit devices can achieve reasonable accuracy and a better trade-off between accuracy and ecological validity (Menghini et al., 2020; Liang and Chapa-Martell, 2019; Liang and Chapa-Martell, 2018).
2.4 Data Collection Procedure
Grounded on the N-of-1 approach, a longitudinal data collection experiment was conducted with a healthy subject (male, 30 years). The principle of the N-of-1 method allows the exclusion of confounding factors pertaining interpersonal differences in health and physiological conditions. In comparison, the traditional large-sample approach requires stringent conditions such as cohort homogeneity and the findings often do not generalize well to individuals (Molenaar, 2004; Barlow and Nock, 2009; van Ockenburg et al., 2015; Fishera et al., 2018). The large-sample approach becomes especially problematic when the variability within subject is much larger than the variability across subjects (Mehl and Conner, 2012; Fishera et al., 2018). There has been increasing evidence that the large-sample approach may not provide us with information that generalizes well to individuals (Molenaar and Campbell, 2009; Burg et al., 2017; Piccirillo et al., 2019), and hence should not be deemed as more scientific than other approaches that explicitly address within-person variability (Mehl and Conner, 2012). On the other hand, the N-of-1 approach has been well-recognized to provide the highest reliability at the individual level (Molenaar, 2004; Molenaar and Campbell, 2009; Mehl and Conner, 2012; van Ockenburg et al., 2015). The subject was recruited through personal connections. The inclusion criteria were 1) healthy subjects aged 18–65 years without chronic diseases, sleep disorders, and mental disorders, 2) has a smartphone, and 3) understand the contents of the informed consent. This study was approved by the Ethics Committee of the Kyoto University of Advanced Science. Written informed consent was obtained from the subject before the data collection experiment started.
The data collection procedure is illustrated in Figure 2. Saliva samples were collected before bedtime at night. We ensured that saliva sample collection was always done during a fixed time period 22:00–23:00 to control the confounding effect of the circadian hormonal rhythm (Oster et al., 2017). The subject was asked to rate how stressful he felt on the HealthLog app after a saliva sample was collected. The Brite 24 and Fitbit Sense were put on the subject when he was ready for sleep. The Brite 24 head cap was placed symmetrically on the subject’s head, and the Fitbit Sense was worn on the non-dominant wrist. To reset the brain to a common baseline, the subject first went through a wake rest phase where he simply sat quietly for 2 min while staying awake. The wake rest phase was followed immediately by the sleep phase. The Brite 24 was left on until it ran out of battery. The subject was instructed to remove and stop the Brite 24 (simply by pressing the main button) when he needed to go to the restroom early morning or when he woke up, whichever happened first. The subject was asked to synchronize the Fitbit Sense with the companion mobile application after waking up.
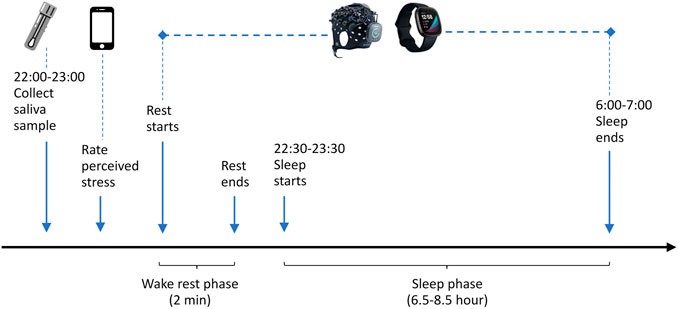
FIGURE 2. Data collection procedure.
3 Data Analysis
The objective of the data analysis was to identify the channel-wise features derived from the hemodynamic signals that are significantly associated to stress indicators. We first processed the raw OD signals to yield cleaned high quality ΔO2Hb and ΔHHb signals, and then derived features from the cleaned signals at each channel. The data analysis pipeline was implemented using Python 3.8.8.
3.1 Data Preprocessing
We exported data from all the devices and instruments for preprocessing. Stress data and Fitbit data were aggregated at a 1-day resolution (i.e., one data point for each day during the experiment period). The perceived stress data were exported from the HealthLog app into a CSV file with a premium account subscription. Fitbit data of sleep, heart rate, and breath rate were exported using a web app that we developed in our previous study (Liang et al., 2016). All these data were then merged by matching date stamps.
The fNIRS data were collected at a high sampling rate of 50 Hz and required more complex preprocessing. The total raw signals measured by the Brite 24 consist of several components, and the ΔO2Hb and ΔHHb related to neural activity is only a small portion. Noisy components are those related to breath, heartbeat, and movement, which need to be removed (Tak and Ye, 2014). The fNIRS data preprocessing pipeline is illustrated in Figure 3.
1) Export raw OD signals. Using the OxySoft, we exported raw OD signals in EDF format so that they were semi-compatible with the data formats supported by the MNE-NIRS Python library (Luke et al., 2021). Although the OxySoft also allows the export of ΔO2Hb and ΔHHb signals that have been converted from raw OD signals, unfortunately the Artinis format of these signals is not supported by the MNE-NIRS library at the time of this study. It is worth noting that the MNE-NIRS library read in the EDF data as EEG signals by default; hence, additional processing was needed to convert the signal type to fNIRS after loading EDF files using the MNE-NIRS library.
2) Trim the signals. Since we were only interested in the first sleep cycle, we discarded the signal segments before the sleep start time and after the first sleep cycle. The sleep start time as recorded by the Fitbit Sense was used as the start time (Ts) of the effective data. The end time (Te) of the effective data were set to Te = Ts + 90 min as the average sleep cycle of healthy adults is 90 min (Feinberg and Floyd, 1979).
3) Remove channels with poor signal quality. The quality of the OD signals could be compromised by many factors during the measurement. While the OxySoft allows real-time inspection of signal quality, it does not provide computational tools to remove channels with poor signals. In our data preprocessing pipeline, we removed channels with poor signal quality using the Scalp Coupling Index (SCI) method (Pollonini et al., 2014). We first performed channel-wise filtering on the OD signals at both wavelengths using a band-pass filter (0.7–1.5 Hz) to preserve only the heartbeat components. The resulting signals were normalized to balance any difference between their amplitudes. The zero-lag cross-correlation between the resulting signals of the same channel—defined as the SCI—was computed and used as a quantitative measure of the signal-to-noise ratio of the channel. Channels with an SCI-value below 0.75 were regarded as poor channels and were removed from the subsequent analysis.
4) Transform OD to ΔO2Hb and ΔHHb. The modified Beer–Lambert law (MBLL) was applied to convert the OD signals to ΔO2Hb and ΔHHb signals (Delpy et al., 1988). As shown in Eq. 1,
5) Filter out physiological systemic responses. The hemodynamic response due to neural activity has frequency content predominantly below 0.5 Hz (in many cases around 0.1 Hz). The ΔO2Hb and ΔHHb signals were band-pass filtered to remove cardiac and respiratory noise. According to the Fitbit data, the subject typically had a breath and heart rate between 11–13 bmp and 55–80 bmp, respectively, during sleep. Hence, the cutoff frequency of the band-pass filter was set to 0.02–0.18 Hz.
6) Remove motion artifacts. Although fNIRS is considered more resilient to motion artifacts than EEG, abrupt head motion such as tossing and turning in sleep may still induce spikes that contaminate the true cortical hemodynamic signals. We used the correlation based signal improvement (CBSI) method (Cui et al., 2010) for motion artifacts removal. This method is based on the observation that the ΔO2Hb and ΔHHb signals, which are typically strongly negatively correlated, will become more positively correlated when contaminated with motion artifacts. Correspondingly, the CBSI method removes motion artifact through recovering the negative correlation between the ΔO2Hb and ΔHHb signals.
7) Compute epoch-wise average. The effective data of each measurement trial spanned over 90 min (generating 270,000 data points each night). The duration was significantly longer than that of traditional fNIRS studies where a measurement is usually at the scale of several minutes. To efficiently analyze such huge amount of data, we averaged the cleaned ΔO2Hb and ΔHHb signals epoch-by-epoch at a 30-s interval. Each epoch contains 1,500 data points. This step was compliant with the standard procedure for sleep analysis (Iber et al., 2017). The output time series signals are denoted as {Xn: n = 1, … , N} where N = 180.
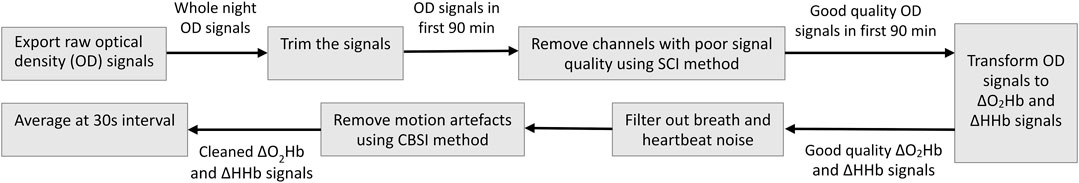
FIGURE 3. Pipeline for fNIRS data preprocessing.
3.2 Feature Construction
We derived 36 features from the ΔO2Hb signal and 36 features from the ΔHHb at each channel. These features fall into three groups. The first group contains 11 time-domain features. These features were directly extracted from the cleaned signals.
• Descriptive statistics: mean
• Skewness (skew): a normalized measure of the asymmetry of the probability distribution of a signal.
• Kurtosis (kurt): a normalized measure of the relative importance of tails versus shoulders in causing dispersion of a signal.
• The 5th-order moment (mmt5): a measure of the relative importance of tails versus center in causing skew of a signal.
• Mean absolute value (MAV): the average of the absolute value of the signal amplitude.
• Root mean square (RMS): a measure of the average power of a signal.
• Zero crossing (ZC): the number of times the signal changes value from positive to negative and vice versa. It can be interpreted as a measure of the noisiness of a signal.
• Crest factor (CF): an indicator of how extreme the peaks are in a signal.
The second group contains two most typical frequency-domain features. Fast Fourier transform (FFT) was applied to convert {Xn: n = 1, 2, 3, … , N} from time domain to frequency domain to extract the following two features.
• Total power (totalSpec): the sum of the spectral components of a signal.
• Maximal power (maxSpec): the maximum amplitude of the spectral components of a signal.
The third group contains 23 features that characterize the nonlinear characteristics of the cortical hemodynamic signals. Human physiological systems are dynamical systems that often exhibit nonlinear characteristics (Goldberger and West, 1992; Cheffer et al., 2021). Previous studies found that nonlinearities are particularly present in the brain (Toyoda et al., 2008; Ma et al., 2018). To extract nonlinear features, we first used Takens’ time-delay embedding to construct a phase space representation of the system as:
where τ is the time delay and d the embedding dimension. The optimal value of τ and d were decided by minimizing the time-delayed mutual information and by the false nearest neighbors method (Kantz and Schreiber, 2003), respectively. The search range was set to [1, 10] for τ and [2, 6] for d at an increment of 1. The signals were then embedded using the optimal τopt and dopt. The maximal Lyapunov exponent (MLE), Hurst exponent (HE), and correlation dimension (CD) were computed from the embedded ΔO2Hb and ΔHHb signals. Several nonlinear analysis techniques were also applied to derive features, including recurrence quantitative analysis (RQA), Poincaré plots (PP), and detrended fluctuation analysis (DFA). Different measures of entropy were also calculated.
The RQA computes several quantitative metrics from a recurrence plot (RP). A RP is a visualization of the recurrence behavior of the phase space trajectory
where
Poincaré plot (PP) is a special type of RP used to quantify self-similarity of a dynamical system. It is a scatter plot of each pair of consecutive data points in a time series signal (technogram), which is often in a shape of ellipse. The minor axis (or width) of the ellipse, denoted as SD1, reflects the level of short-term instantaneous variability. The major axis (or length) of the ellipse, denoted as SD2, reflects the long-term variability. PP has been widely used in ECG analysis to help diagnose cardio abnormalities (Hoshi et al., 2013).
The DFA method is often used to quantify the fractal scaling properties and is useful for revealing the statistical self-similarity of a signal (Peng et al., 1994). It has been proven particularly useful in neurology studies (Peng et al., 1994; Hardstone et al., 2012). The DFA first converts a signal to mean-centered cumulative sum. The output signal is then split into epochs, detrended, and the RMS is computed. This process is repeated over a range of epoch sizes n at different scale. A linear trend line is then fit to the log (RMS) − log(n) plot. The slope of the fitted trend line, denoted by α, is called scaling exponent.
The derived nonlinear features are summarized below.
• Optimal delay (τopt).
• Optimal embedding dimension (dopt).
• Maximal Lyapunov exponent (MLE): a measure of separation rate of a signal’s trajectories in the phase space. It indicates the predictability of a dynamic system. A positive maximum Lyapunov exponent is an indicator of the presence of chaos (Eckmann and Ruelle, 1985).
• Hurst exponent (HE): a measure of long-term memory (or long-range dependency) of a signal. A value of HE in the range 0–0.5 indicates long-term negative autocorrelation, while a value in the range 0.5–1.0 indicates long-term positive autocorrelation. A value of 0.5 can indicate a completely uncorrelated signal.
• Correlation dimension (CD): an indicator used to distinguish deterministic chaos from stochastic processes.
• Recurrence rate (RR): the number of black dots in a RP excluding the main diagonal line. It is a measure of the relative density of recurrence points in the entire RP.
• Percent determinism (DET): the fraction of recurrence points that form diagonal lines. It reports the percentage of recurrent points in diagonal structures.
• Maximal diagonal line length (Dmax): the length of the single longest line in the diagonal direction within an entire RP. The smaller the Dmax, the more divergent the trajectories.
• Average diagonal line length (Davg): the average time that two segments of the phase space trajectory are close to each other.
• Entropy of diagonal lines lengths (ENTD): the Shannon entropy of the frequency distribution of the diagonal line lengths. It reflects the complexity of the deterministic structure in the system.
• Laminarity (LAM): the histogram of lengths of vertical lines in a RP. It reports the percentage of recurrent points in vertical structures.
• Trapping time (TT): the average length of the vertical lines. It indicates the mean time the system will abide at a specific state.
• Longest vertical line length (Vmax): the maximal length of the vertical lines in the entire RP.
• Entropy of vertical lines lengths (ENTV): the Shannon entropy of the frequency distribution of the vertical line lengths.
• Standard deviation of the minor axis of a PP (SD1).
• Standard deviation of the major axis of a PP (SD2).
• Ratio of SD1 and SD2 (SDratio); computed as SD1/SD2.
• Area of the fitted ellipse (Se): the area of the ellipse fitted into the PP. It is computed as Se = π × SD1 × SD2.
• Scaling exponent (α): the slope of the fitted trend line in DFA, where each epoch has no overlap.
• Scaling exponent with overlap (αOL): the slope of the fitted trend line in DFA, where each epoch has 50% overlap.
• Sample entropy (sampEn): a measure of the negative natural logarithm of the probability that if two sets of data points of length m have Euclidean distance D [Xm (n1), Xm (n2)] < r (n1 ≠ n2) then two sets of data points of m + 1 also have Euclidean distance D [Xm+1 (n1), Xm+1 (n2)] < r. In this study, r was set to 0.2σ. A lower value for the sample entropy corresponds to a higher probability indicating more self-similarity and less noise in the signal (Richman and Moorman, 2000).
• Permutation entropy (perEn): a complexity measure that captures the order relations between the values of a signal. Signals with smaller perEn are more regular and deterministic, and those with higher perEn are noisier and more random.
• Statistical complexity (SC): the product of the normalized permutation and a normalized version of the Jensen–Shannon divergence between the ordinal distribution and the uniform distribution (López-Ruiz et al., 1995).
3.3 Feature Ranking
We proposed an original ensemble approach to rank channel-wise hemodynamic features for each stress indicator. As outlined in Figure 4, this approach utilized six feature selection statistical and machine learning techniques to generate an average importance score for each feature
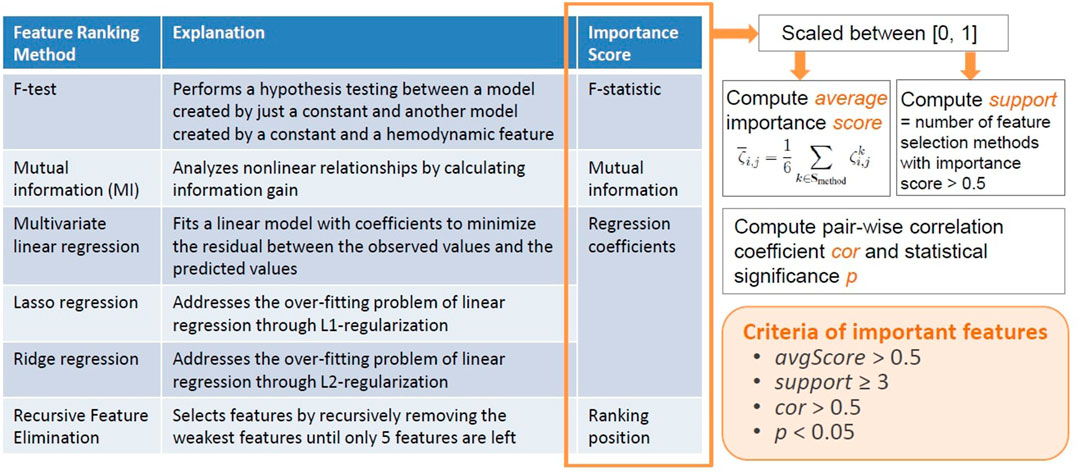
FIGURE 4. Proposed ensemble method for selecting important hemodynamic features.
The F-test and mutual information (MI) are univariate methods that consider the relationship between each feature and a target stress indicator individually. The F-test method performs a hypothesis testing between a model created by just a constant and another model created by a constant and a hemodynamic feature, and hence reveals the significance of each feature in improving the model. The calculated F-statistic was used as the importance scores of features. While the F-statistic only reflects the linear relationship between a feature and a target stress indicator, the MI method analyzes nonlinear relationships by calculating information gain (Estevez et al., 2009; Ross, 2014). The MI between a hemodynamic feature and a target stress indicator reveals the reduction in uncertainty for the stress indicator given the known value of the feature (Ross, 2014), which was used as the importance score of features. The multivariate linear regression (LR) method fits a linear model with coefficients to minimize the residual between the observed values and the predicted values of the stress indicator. The Lasso regression and Ridge regression methods address the over-fitting problem of linear regression through L1-regularization and L2-regularization, respectively. In addition, the Lasso regression is considered a very useful technique in selecting a strong subset of features as it aggressively produces coefficients of 0 for some features. On the other hand, the Ridge regression is suited for data interpretation because useful features tend to have non-zero coefficients. The α parameters were all set to 0.5 for Lasso and Ridge regression. For the three linear regression methods, the estimated coefficients were used as the importance scores of the features. The RFE method selects features by recursively removing the weakest features until only five features are left. The ranking position of RFE was used as the importance score.
The cortical hemodynamic features were all scaled between [0, 1] before each feature selection technique was performed. For feature i (i ∈ Sfeature), the importance score generated by method k, denoted by
4 Results
4.1 Descriptive Statistics
In total 15 days of data were collected from the subject. As shown in Table 2, the average level of salivary cortisol and sIgA were 3.4 nmol and 295.3 μg/ml, respectively. These values were within the normal ranges for healthy adults (Zeier et al., 1996; Oster et al., 2017). Perceived stress ranges from 2.0 to 8.0 with an average score of 3.8. Only 4 out of the 15 days were rated above 5, indicating that the subject did not perceive constant chronic stress during the data collection experiment. A correlation analysis found no significant linear relationship among the three stress indicators.
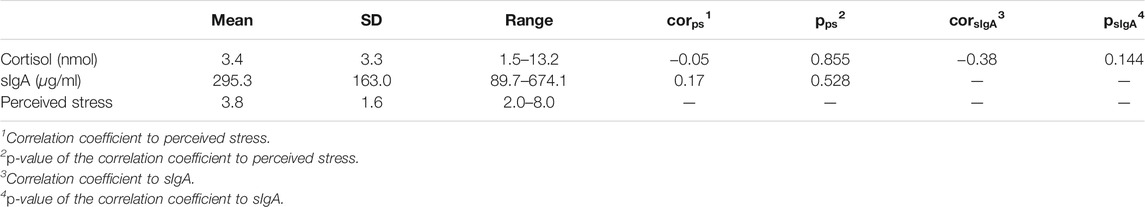
TABLE 2. Descriptive statistics of stress indicators.
4.2 PFC Hemodynamic Features Associated to Stress
Channel-wise hemodynamic features associated to stress indicators are summarized in Table 3–8. The aggregated frequency of each feature type is illustrated in Figure 5. Visualization of the channels associated to each stress indicator is provided in Figures 6, 7.
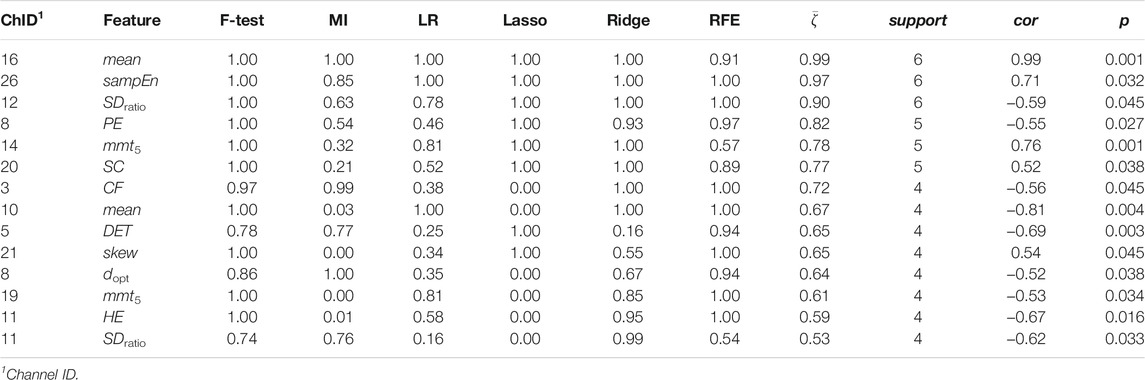
TABLE 3. Channel-wise ΔO2Hb features associated to salivary cortisol.
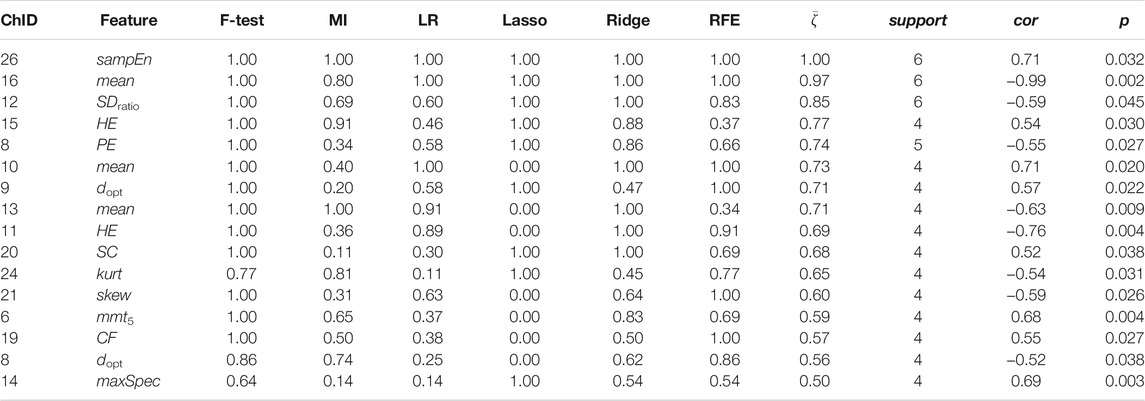
TABLE 4. Channel-wise ΔHHb features associated to salivary cortisol.
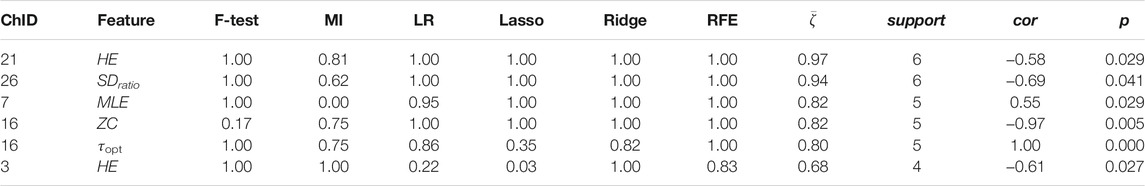
TABLE 5. Channel-wise ΔO2Hb features associated to salivary sIgA.
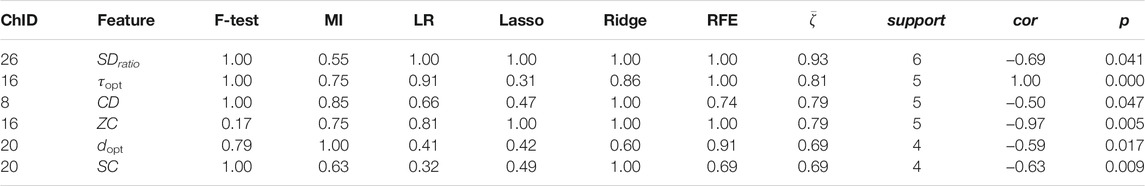
TABLE 6. Channel-wise ΔHHb features associated to salivary sIgA.
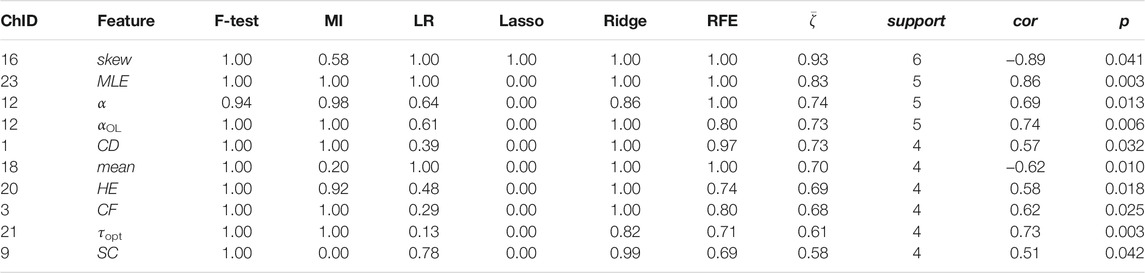
TABLE 7. Channel-wise ΔO2Hb features associated to perceived stress.
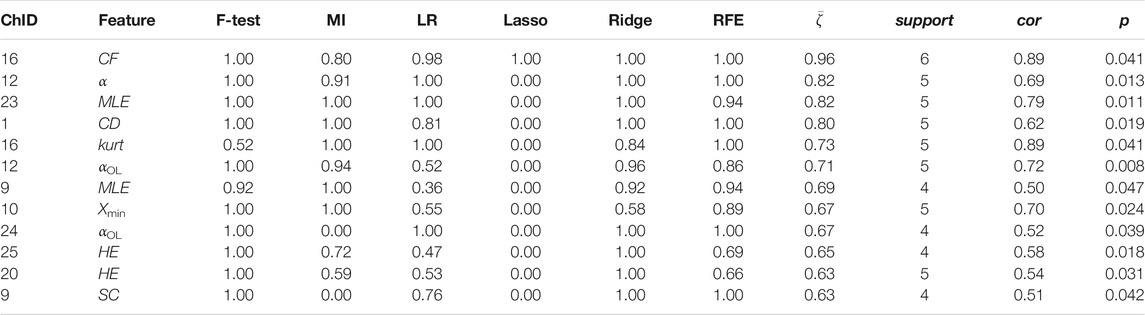
TABLE 8. Channel-wise ΔHHb features associated to perceived stress.
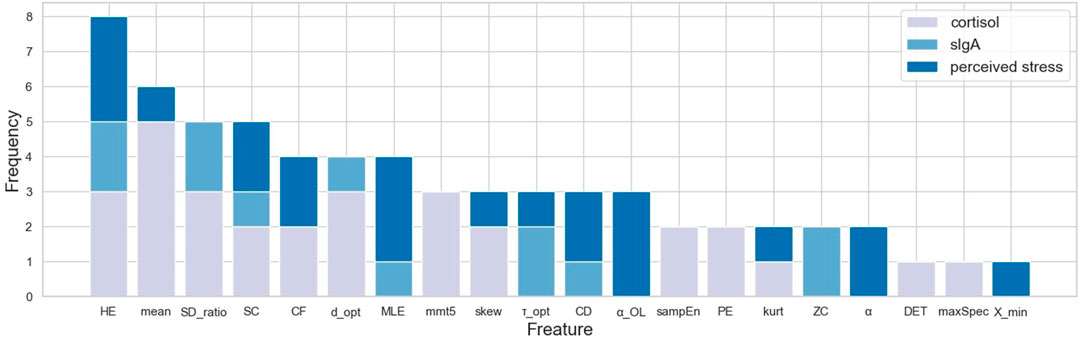
FIGURE 5. Frequency of associated feature types summed across all channels.
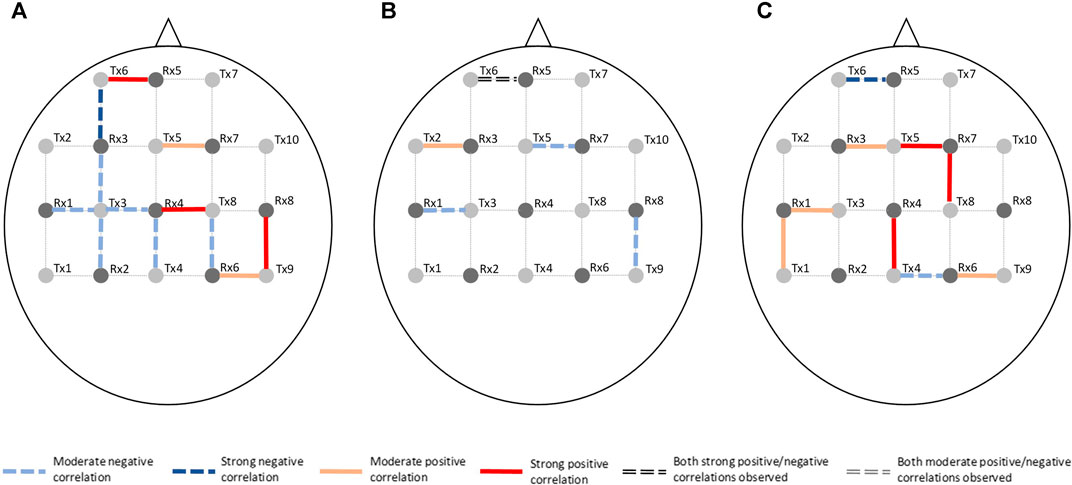
FIGURE 6. Visualization of channels associated to ΔO2Hb on the optode template. Stress indicator is (A) cortisol, (B) sIgA, and (C) perceived stress, respectively.
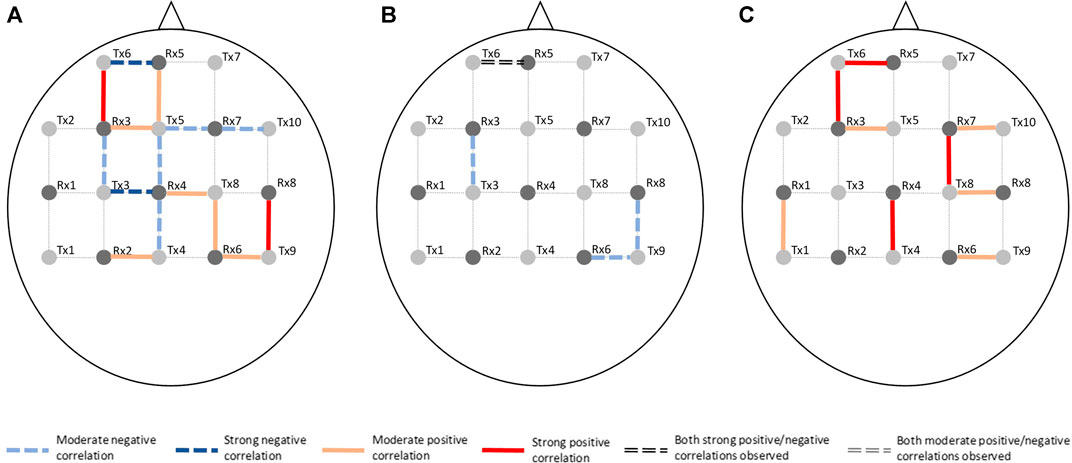
FIGURE 7. Visualization of channels associated to ΔHHb on the optode template. Stress indicator is (A) cortisol, (B) sIgA, and (C) perceived stress, respectively.
Stress was associated to features in both time and frequency domains as well as to nonlinear features. For cortisol, the top three associated cortical hemodynamic features of both the ΔO2Hb and ΔHHb signals are the
Less channel-wise features were found to associate to sIgA. Only two ΔO2Hb features (i.e., HE of channel 21 and SDratio of channel 26) and one ΔHHb feature (i.e., SDratio of channel 26) were supported by all six feature selection technique. A lower sIgA level was moderately associated to higher values of the Hurst exponent of the ΔO2Hb signal at channel 21 as well as increased SDratio of both the ΔO2Hb and ΔHHb signals at channel 26. The most frequently referred feature type for sIgA were HE, SDratio, τopt, and ZC. In addition, ZC was associated only to sIgA but not to the other two stress indicators.
Two time-domain features associated to perceived stress were supported by all six feature selection methods. These two features were also the only features that had non-zero coefficient when the Lasso method was applied. Higher perceived stress was strongly associated to reduced skewness of the ΔO2Hb signal and increased crest factor of the ΔHHb signal at channel 16. The most frequently referred feature types were HE, MLE, and αOL. In the meantime, α, αOL, and Xmin were the feature types specific to perceived stress.
Figures 6, 7 demonstrated that channel 3 (optode pair Tx3-Rx1), 16 (Tx6-Rx5), 20 (Tx9-Rx6), 21 (Tx5-Rx7), and 26 (Tx9-Rx8) were the most relevant channels. The features of both the ΔO2Hb and the ΔHHb signals at channel 16 were strongly associated to all three stress indicators. Channel 20 had similar relevance but with only moderate associations. The features of the ΔO2Hb signals at channels 3 and 21 were moderately associated to all three stress indicators. In addition, the features of both the ΔO2Hb and the ΔHHb signals at channel 26 were moderately associated to both cortisol and sIgA.
5 Discussion
This pilot study demonstrated the feasibility of investigating stressed brain during sleep by configuring a digital ecosystem with wearable/portable devices and mobile applications. The sleep data collected with Fitbit Sense provided information on sleep start time, and the heart and breath rate data facilitated personalized filtering of the fNIRS signals. The use of mobile applications such as the HealthLog app can also help reduce the burden of manual log, and thus is likely to improve subjects’ adherence to the study protocol. We do not intend to draw conclusions due to the pilot nature of the study; instead, we discuss several observations that may inspire future studies in the same direction.
Stress can be measured along multiple dimensions using several indicators. In this study, we measured salivary cortisol, sIgA, and collected subjective ratings on perceived stress. The correlation analysis revealed that while some features derived from the cortical hemodynamic signals associated with all stress indicators, others may be specific to only one or two stress indicators. The analysis showed that the brain activity may be characterized using various features derived from the hemodynamic signals. Time-domain features, frequency-domain features, and nonlinear features all showed promise. Taken together, the top five most frequently referred feature types were Hurst exponent, mean, the ratio of the major/minor axis standard deviation of a Poincaré plot, statistical complexity, and crest factor. Breaking down into individual stress indicator, the mean of the cortical hemodynamic signals is the most frequently referred feature type for cortisol. This coincides with the fact that most studies that rely on cortisol as the stress indicator solely characterize the cortical hemodynamic patterns using the mean of the ΔO2Hb and the ΔHHb signals. On the other hand, nonlinear features of the hemodynamic signals could be more useful when sIgA and perceived stress are used as stress indicators. Four feature types had the same highest frequency for sIgA: Hurst exponent, major/minor axis standard deviation ratio of the Poincaré plot, optimal delay, and zero crossing. For perceived stress, Hurst exponent, maximal Lyapunov exponent, and over lapped α in DFA were the most frequently referred feature types. It is also found that the time-domain features (e.g., mean) derived from the ΔO2Hb signals and those from the ΔHHb signals demonstrated opposite correlation directions to stress indicators, whereas the nonlinear features (e.g., Hurst exponent, correlation dimension, and statistical complexity) derived from the two cortical hemodynamic signals demonstrate the same correlation direction. While the two hemodynamic signals share some common important features, each one also contributed unique features. This suggests the necessity of consider both signals when investigating braining activity using fNIRS, which provides support to the argument made in previous studies (Tachtsidis and Scholkmann, 2016). It is also worth mentioning that the time-domain and frequency-domain features have the merit of their interpretability, whereas some nonlinear features such as the Hurst exponent and the optimal delay may hinder straightforward interpretation.
This study also generated preliminary observations on the sub-regions in the PFC associated to stress. The left rostral prefrontal cortex (channel 16; optode pair Tx6-Rx5), or RLPFC for short, is undoubtedly the most relevant sub-region. Significantly strong correlations were found between the hemodynamic features derived at this sub-region and all three stress indicators. The specific features selected at channel 16 varied depending on the target stress indicator. Higher cortisol level (indicating stronger stress response) was associated to increased mean ΔO2Hb and decreased mean ΔHHb. Lower sIgA level (indicating stronger stress response) was associated to higher levels of noisiness in the ΔO2Hb and ΔHHb signals characterized by increased zero crossing. Higher perceived stress level was associated to increased symmetry in the ΔO2Hb signal and higher peak in the ΔHHb signal. The dorsolateral prefrontal cortex (DLPFC) was also a relevant cortical area. The area of mid-DLPFC (channel 3; optode pair Tx3-Rx1) and caudal-DLPFC (channel 20; optode pair Tx9-Rx6) both demonstrated significant and moderate associations to all three stress indicators. In the case of the caudal-DLPFC (channel 20), consistent relationships were found between stress and a same feature: the statistical complexity of the ΔHHb signal. In contrast, a ΔO2Hb feature at the mid-DLPFC (channel 3) correlates differently to different stress indicators. To be more specific, lower crest factor of the ΔO2Hb signal at channel 3 was associated to higher cortisol level (indicating stronger hormonal stress response) but at the same time higher sIgA level (indicating weaker immunological stress response). Rather than viewing this as contradictory, an alternative interpretation could be that different stress indicators characterize different facets of the human stress response, suggesting the necessity of using multiple indicators in stress studies. The relevance of the DLPFC in stress response of healthy subjects during wake time has been documented in previous stress studies using near-infrared spectroscopy (NIRS) technique (Yang et al., 2007; Yanagisawa et al., 2011; Rosenbaum et al., 2018; Schaal et al., 2019). Table 9 summarizes the experiment protocols and the main findings of these studies, which were all conducted when subjects were awake and were engaged in cognitive tasks. Our findings provide supplementary support to the within-person role of the DLPFC in processing stress during sleep. In addition, the preliminary result shed light on the possible role of the RLPFC, especially the left RLPFC, in processing stress during sleep. On the other hand, no relevance was found in the ventrolateral prefrontal cortex (VLPFC). While (Yanagisawa et al., 2011) found negative association between the activity in the VLPFC and the subjective ratings on social pain (which was induced by a feeling of social isolation), our finding suggests that this region may not be involved in processing daily life stress during sleep.
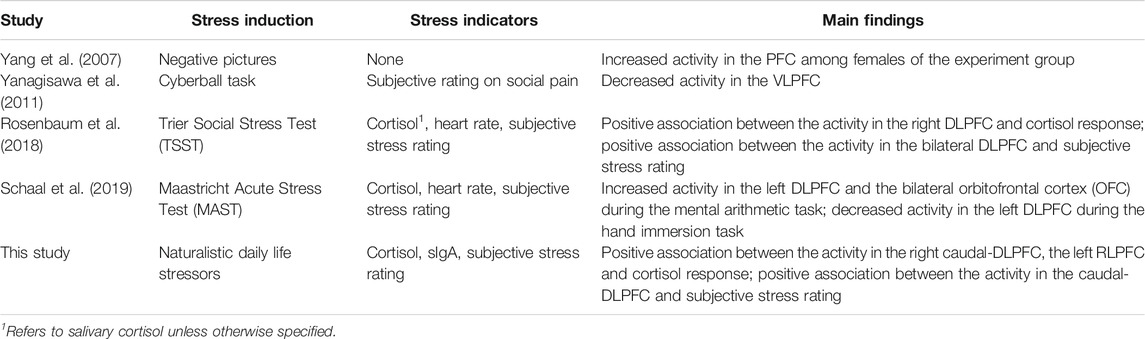
TABLE 9. Comparison of Experiment Protocols and Main Findings of Previous Daytime fNIRS Stress Studies and the Current In-sleep fNIRS Stress Study.
The preliminary findings should be interpreted with caution due to the strong limitations of the present study. First, while the idiographic N-of-1 approach adopted in this study represents a true scientific undertaking (Barlow and Nock, 2009), the preliminary findings solely hold for this specific subject. Future studies may conduct the longitudinal measurement on more subjects to identify possible common patterns across subjects. Second, the data analysis protocol in this study did not count in the interplay among different channels nor the confounding effect of different sleep stages. Analyzing the orchestration of the cortical hemodynamic signals from a dynamic network perspective may leads to new insights into how the brain responds to stress during sleep. Furthermore, this study only focused on the activity in the PFC area in the first sleep cycle. The potential role of other cortical areas in stress response during a full course of sleep demands further studies.
Data Availability Statement
The raw data supporting the conclusions of this article will be made available by the authors, without undue reservation.
Ethics Statement
The studies involving human participants were reviewed and approved by the Ethics Committee of Kyoto University of Advanced Science. The patients/participants provided their written informed consent to participate in this study.
Author Contributions
ZL conceived and designed the study; ZL performed the data collection experiments, retrieved the data, and performed data preprocessing and analysis; ZL drafted the manuscript and made revision.
Funding
This work was supported by the Japan Society for the Promotion of Science (JSPS) KAKENHI (Grant Number 16H07469, 19K20141, and 21K17670).
Conflict of Interest
The author declares that the research was conducted in the absence of any commercial or financial relationships that could be construed as a potential conflict of interest.
Publisher’s Note
All claims expressed in this article are solely those of the authors and do not necessarily represent those of their affiliated organizations, or those of the publisher, the editors, and the reviewers. Any product that may be evaluated in this article, or claim that may be made by its manufacturer, is not guaranteed or endorsed by the publisher.
References
Alonso, J. F., Romero, S., Ballester, M. R., Antonijoan, R. M., and Mañanas, M. A. (2015). Stress Assessment Based on Eeg Univariate Features and Functional Connectivity Measures. Physiol. Meas. 36, 1351–1365. doi:10.1088/0967-3334/36/7/1351
Arnsten, A. F. T., Raskind, M. A., Taylor, F. B., and Connor, D. F. (2015). The Effects of Stress Exposure on Prefrontal Cortex: Translating Basic Research into Successful Treatments for Post-Traumatic Stress Disorder. Neurobiol. Stress 1, 89–99. doi:10.1016/j.ynstr.2014.10.002
Barlow, D. H., and Nock, M. K. (2009). Why Can't We Be More Idiographic in Our Research? Perspect. Psychol. Sci. 4, 19–21. doi:10.1111/j.1745-6924.2009.01088.x
Burg, M. M., Schwartz, J. E., Kronish, I. M., Diaz, K. M., Alcantara, C., Duer-Hefele, J., et al. (2017). Does Stress Result in You Exercising Less? or Does Exercising Result in You Being Less Stressed? or Is it Both? Testing the Bi-Directional Stress-Exercise Association at the Group and Person (N of 1) Level. Ann. Behav. Med. 51, 799–809. doi:10.1007/s12160-017-9902-4
Buysse, D. J., Germain, A., Hall, M., Monk, T. H., and Nofzinger, E. A. (2011). A Neurobiological Model of Insomnia. Drug Discov. Today Dis. Models 8, 129–137. doi:10.1016/j.ddmod.2011.07.002
Cerqueira, J. J., Mailliet, F., Almeida, O. F. X., Jay, T. M., and Sousa, N. (2007). The Prefrontal Cortex as a Key Target of the Maladaptive Response to Stress. J. Neurosci. 27, 2781–2787. doi:10.1523/jneurosci.4372-06.2007
Chang, J., and Yu, R. (2018). Alternations in Functional Connectivity of Amygdalar Subregions under Acute Social Stress. Neurobiol. Stress 9, 264–270. doi:10.1016/j.ynstr.2018.06.001
Cheffer, A., Savi, M. A., Pereira, T. L., and de Paula, A. S. (2021). Heart Rhythm Analysis Using a Nonlinear Dynamics Perspective. Appl. Math. Model. 96, 152–176. doi:10.1016/j.apm.2021.03.014
Cui, X., Bray, S., and Reiss, A. L. (2010). Functional Near Infrared Spectroscopy (Nirs) Signal Improvement Based on Negative Correlation between Oxygenated and Deoxygenated Hemoglobin Dynamics. NeuroImage 49, 3039–3046. doi:10.1016/j.neuroimage.2009.11.050
Dedovic, K., D'Aguiar, C., and Pruessner, J. C. (2009). What Stress Does to Your Brain: a Review of Neuroimaging Studies. Can. J. Psychiatry 54, 6–15. doi:10.1177/070674370905400104
Delpy, D. T., Cope, M., Zee, P. v. d., Arridge, S., Wray, S., and Wyatt, J. (1988). Estimation of Optical Pathlength through Tissue from Direct Time of Flight Measurement. Phys. Med. Biol. 33, 1433–1442. doi:10.1088/0031-9155/33/12/008
Dunbar, J., Hazell, G., and Jehanli, A. (2015). “Evaluation of a New point of Care Quantitative Cube Reader for Salivary Analysis in Premier League Soccer Clubs,” in International Sports Science and Sports Medicine Conference, Newcastle upon Tyne, United Kingdom, August 8–10, 2015.
Eckmann, J.-P., and Ruelle, D. (1985). Ergodic Theory of Chaos and Strange Attractors. Rev. Mod. Phys. 57, 617–656. doi:10.1103/revmodphys.57.617
Engeland, C. G., Hugo, F. N., Hilgert, J. B., Nascimento, G. G., Junges, R., Lim, H.-J., et al. (2016). Psychological Distress and Salivary Secretory Immunity. Brain Behav. Immun. 52, 11–17. doi:10.1016/j.bbi.2015.08.017
Estevez, P. A., Tesmer, M., Perez, C. A., and Zurada, J. M. (2009). Normalized Mutual Information Feature Selection. IEEE Trans. Neural Netw. 20, 189–201. doi:10.1109/TNN.2008.2005601
Feinberg, I., and Floyd, T. C. (1979). Systematic Trends Across the Night in Human Sleep Cycles. Psychophysiology 16, 283–291. doi:10.1111/j.1469-8986.1979.tb02991.x
Fishera, A. J., Medaglia, J. D., and Jeronimus, B. F. (2018). Lack of Group-To-Individual Generalizability Is a Threat to Human Subjects Research. Proc. Natl. Acad. Sci. USA 115, E6106–E6115. doi:10.1073/pnas.1711978115
Gianferante, D., Thoma, M. V., Hanlin, L., Chen, X., Breines, J. G., Zoccola, P. M., et al. (2014). Post-Stress Rumination Predicts Hpa Axis Responses to Repeated Acute Stress. Psychoneuroendocrinology 49, 244–252. doi:10.1016/j.psyneuen.2014.07.021
Goldberger, A. L., and West, B. J. (1992). Chaos and Order in the Human Body. CHANCE 5, 47–55. doi:10.1080/09332480.1992.11882463
Hains, A. B., and Arnsten, A. F. T. (2008). Molecular Mechanisms of Stress-Induced Prefrontal Cortical Impairment: Implications for Mental Illness. Learn. Mem. 15, 551–564. doi:10.1101/lm.921708
Hardstone, R., Poil, S.-S., Schiavone, G., Jansen, R., Nikulin, V., Mansvelder, H., et al. (2012). Detrended Fluctuation Analysis: A Scale-Free View on Neuronal Oscillations. Front. Physiol. 3, 450. doi:10.3389/fphys.2012.00450
Hoshi, R. A., Pastre, C. M., Vanderlei, L. C. M., and Godoy, M. F. (2013). Poincaré Plot Indexes of Heart Rate Variability: Relationships with Other Nonlinear Variables. Auton. Neurosci. 177, 271–274. doi:10.1016/j.autneu.2013.05.004
Iber, C., Ancoli-Israel, S., Chesson, A., and Quan, S. (2017). For the American Academy of Sleep Medicine. The Aasm Manual for the Scoring of Sleep and Associated Events Rules, Terminology and Technical Specifications. Darien, IL: Am. Acad. Sleep 538, 1–49. Medicine Version 2.4.
Joëls, M., and Baram, T. Z. (2009). The Neuro-Symphony of Stress. Nat. Rev. Neurosci. 10, 459–466. doi:10.1038/nrn2632
Jönsson, P., Wallergård, M., Österberg, K., Åse, M. H., Johansson, G., and Karlson, B. (2010). Cardiovascular and Cortisol Reactivity and Habituation to a Virtual Reality Version of the Trier Social Stress Test. A pilot study 35, 1397–1403. doi:10.1016/j.psyneuen.2010.04.003
Kantz, H., and Schreiber, T. (2003). Nonlinear Time Series Analysis. New York, NY: Cambridge University Press.
Krämer, B., Diekhof, E. K., and Gruber, O. (2017). Effects of City Living on the Mesolimbic Reward System-An Fmri Study. Hum. Brain Mapp. 38, 3444–3453. doi:10.1002/hbm.23600
Kudielka, B. M., von Känel, R., Preckel, D., Zgraggen, L., Mischler, K., and Fischer, J. E. (2006). Exhaustion Is Associated with Reduced Habituation of Free Cortisol Responses to Repeated Acute Psychosocial Stress. Biol. Psychol. 72, 147–153. doi:10.1016/j.biopsycho.2005.09.001
Levenstein, S., Prantera, C., Varvo, V., Scribano, M. L., Berto, E., Luzi, C., et al. (1993). Development of the Perceived Stress Questionnaire: A New Tool for Psychosomatic Research. J. Psychosomatic Res. 37, 19–32. doi:10.1016/0022-3999(93)90120-5
Liang, Z., and Chapa Martell, M. A. (2018). Validity of Consumer Activity Wristbands and Wearable Eeg for Measuring Overall Sleep Parameters and Sleep Structure in Free-Living Conditions. J. Healthc. Inform. Res. 2, 152–178. doi:10.1007/s41666-018-0013-1
Liang, Z., and Chapa-Martell, M. A. (2019). Accuracy of Fitbit Wristbands in Measuring Sleep Stage Transitions and the Effect of User-specific Factors. JMIR Mhealth Uhealth 7, e13384. doi:10.2196/13384
Liang, Z., Ploderer, B., Liu, W., Nagata, Y., Bailey, J., Kulik, L., et al. (2016). Sleepexplorer: A Visualization Tool to Make Sense of Correlations between Personal Sleep Data and Contextual Factors. Personal. Ubiquitous Comput. 20, 985–1000. doi:10.1007/s00779-016-0960-6
López-Ruiz, R., Mancini, H. L., and Calbet, X. (1995). A Statistical Measure of Complexity. Phys. Lett. A209, 321–326.
Luke, R., Larson, E., Shader, M. J., Innes-Brown, H., Yper, L. V., Lee, A. K., et al. (2021). Analysis Methods for Measuring Fnirs Responses Generated by a Block-Design Paradigm. Neurophotonics 8, 025008. doi:10.1117/1.NPh.8.2.025008
Ma, Y., Shi, W., Peng, C.-K., and Yang, A. C. (2018). Nonlinear Dynamical Analysis of Sleep Electroencephalography Using Fractal and Entropy Approaches. Sleep Med. Rev. 37, 85–93. doi:10.1016/j.smrv.2017.01.003
Menghini, L., Cellini, N., Goldstone, A., Baker, F. C., and Zambotti, M. D. (2020). A Standardized Framework for Testing the Performance of Sleep-Tracking Technology: Step-by-Step Guidelines and Open-Source Code. Sleep 44 (2), zsaa170. doi:10.1093/sleep/zsaa170
Mitsuishi, H., Okamura, H., Yusuke, M., and Yoshiko, A. (2019). “The Validity of Salivary Cortisol Analysis Using Cube Reader [in Japanese],” in The Proceedings of the Annual Convention of the Japanese Psychological Association, Osaka, Japan, September 11—13, 2019(The Japanese Psychological Association) 83. doi:10.4992/pacjpa.83.0_2c-028
Molenaar, P. C. M. (2004). A Manifesto on Psychology as Idiographic Science: Bringing the Person Back into Scientific Psychology, This Time Forever. Meas. Interdiscip. Res. Perspect. 2, 201–218. doi:10.1207/s15366359mea0204_1
Molenaar, P. C. M., and Campbell, C. G. (2009). The New Person-specific Paradigm in Psychology. Curr. Dir. Psychol. Sci. 18, 112–117. doi:10.1111/j.1467-8721.2009.01619.x
M. R. Mehl, and T. S. Conner (Editors) (2012). Handbook of Research Methods for Studying Daily Life (New York, NY: The Guilford Press).
Nejati, V., Majdi, R., Salehinejad, M. A., and Nitsche, M. A. (2021). The Role of Dorsolateral and Ventromedial Prefrontal Cortex in the Processing of Emotional Dimensions. Scientific Rep. 11, 1971. doi:10.1038/s41598-021-81454-7
Oster, H., Challet, E., Ott, V., Arvat, E., de Kloet, E. R., Dijk, D.-J., et al. (2017). The Functional and Clinical Significance of the 24-hour Rhythm of Circulating Glucocorticoids. Endocr. Rev. 38, 3–45. doi:10.1210/er.2015-1080
Peng, C.-K., Buldyrev, S. V., Havlin, S., Simons, M., Stanley, H. E., and Goldberger, A. (1994). Mosaic Organization of Dna Nucleotides. Phys. Rev. A 49, 1685–1689. doi:10.1103/PhysRevE.49.1685
Piccirillo, M. L., Beck, E. D., and Rodebaugh, T. L. (2019). A Clinician’s Primer for Idiographic Research: Considerations and Recommendations. Behav. Ther. 50, 938–951. doi:10.1016/j.beth.2019.02.002
Pollonini, L., Olds, C., Abaya, H., Bortfeld, H., Beauchamp, M. S., and Oghalai, J. S. (2014). Auditory Cortex Activation to Natural Speech and Simulated Cochlear Implant Speech Measured with Functional Near-Infrared Spectroscopy. Hear. Res. 309, 84–93. doi:10.1016/j.heares.2013.11.007
Rampino, A., Torretta, S., Rizzo, G., Viscanti, G., Quarto, T., Gelao, B., et al. (2019). Emotional Stability Interacts with Cortisol Levels before Fmri on Brain Processing of Fearful Faces. Neuroscience 416, 190–197. doi:10.1016/j.neuroscience.2019.08.002
Richman, J., and Moorman, J. R. (2000). Physiological Time-Series Analysis Using Approximate Entropy and Sample Entropy. Am. J. Physiology-Heart Circulatory Physiol. 278, H2039–H2049. doi:10.1152/ajpheart.2000.278.6.h2039
Rosenbaum, D., Hilsendegen, P., Thomas, M., Haeussinger, F. B., Metzger, F. G., Nuerk, H.-C., et al. (2018). Cortical Hemodynamic Changes during the Trier Social Stress Test: An Fnirs Study. Neuroimage 1, 107–115. doi:10.1016/j.neuroimage.2017.12.061
Rosenbaum, D., Int-Veen, I., Laicher, H., Torka, F., Kroczek, A., Rubel, J., et al. (2021). Insights from a Laboratory and Naturalistic Investigation on Stress, Rumination and Frontal Brain Functioning in Mdd: An Fnirs Study. Neurobiol. Stress 15, 100344. doi:10.1016/j.ynstr.2021.100344
Ross, B. C. (2014). Mutual Information between Discrete and Continuous Data Sets. PLoS ONE 9, e87357. doi:10.1371/journal.pone.0087357
Schaal, N. K., Hepp, P., Schweda, A., Wolf, O. T., and Krampe, C. (2019). A Functional Near-Infrared Spectroscopy Study on the Cortical Haemodynamic Responses during the Maastricht Acute Stress Test. Sci. Rep. 9, 13459. doi:10.1038/s41598-019-49826-2
Schommer, N. C., Hellhammer, D. H., and Kirschbaum, C. (2003). Dissociation between Reactivity of the Hypothalamus-Pituitary-Adrenal Axis and the Sympathetic-Adrenal-Medullary System to Repeated Psychosocial Stress. Psychosom Med. 65, 450–460. doi:10.1097/01.psy.0000035721.12441.17
Steinbrink, J., Wabnitz, H., Obrig, H., Villringer, A., and Rinneberg, H. (2001). Determining Changes in Nir Absorption Using a Layered Model of the Human Head. Phys. Med. Biol. 46, 879. doi:10.1088/0031-9155/46/3/320
Strangman, G. E., Zhang, Q., and Li, Z. (2014). Scalp and Skull Influence on Near Infrared Photon Propagation in the Colin27 Brain Template. NeuroImage 85, 136–149. doi:10.1016/j.neuroimage.2013.04.090
Tachtsidis, I., and Scholkmann, F. (2016). False Positives and False Negatives in Functional Near-Infrared Spectroscopy: Issues, Challenges, and the Way Forward. Neurophotonics 3, 031405. doi:10.1117/1.nph.3.3.031405
Tak, S., and Ye, J. C. (2014). Statistical Analysis of Fnirs Data: A Comprehensive Review. Neuroimage 85, 72–91. doi:10.1016/j.neuroimage.2013.06.016
Toyoda, H., Kashikura, K., Okada, T., Nakashita, S., Honda, M., Yonekurae, Y., et al. (2008). Source of Nonlinearity of the Bold Response Revealed by Simultaneous Fmri and Nirs. NeuroImage 39, 997–1013. doi:10.1016/j.neuroimage.2007.09.053
van Ockenburg, S. L., Booij, S. H., Riese, H., Rosmalen, J. G. M., and Janssens, K. A. M. (2015). How to Assess Stress Biomarkers for Idiographic Research? Psychoneuroendocrinolo 62, 189–199. doi:10.1016/j.psyneuen.2015.08.002
Wolfram, M., Bellingrath, S., Feuerhahn, N., and Kudielka, B. M. (2013). Cortisol Responses to Naturalistic and Laboratory Stress in Student Teachers: Comparison with a Non-Stress Control Day. Stress and Health 29, 143–149. doi:10.1002/smi.2439
Yanagisawa, K., Masui, K., Furutani, K., Nomura, M., Yoshida, H., and Ura, M. (2011). Temporal Distance Insulates against Immediate Social Pain: an Nirs Study of Social Exclusion. Soc. Neurosci. 6, 377–387. doi:10.1080/17470919.2011.559127
Yang, H., Zhou, Z., Liu, Y., Ruan, Z., Gong, H., Luo, Q., et al. (2007). Gender Difference in Hemodynamic Responses of Prefrontal Area to Emotional Stress by Near-Infrared Spectroscopy. Behav. Brain Res. 178, 172–176. doi:10.1016/j.bbr.2006.11.039
Yuen, E. Y., Liu, W., Karatsoreos, I. N., Feng, J., McEwen, B. S., and Yan, Z. (2009). Acute Stress Enhances Glutamatergic Transmission in Prefrontal Cortex and Facilitates Working Memory. PNAS 106, 14075–14079. doi:10.1073/pnas.0906791106
Keywords: ubiquitous computing, functional near-infrared spectroscopy (fNIRS), stress, prefrontal cortex, wearable computing, sleep
Citation: Liang Z (2021) What Does Sleeping Brain Tell About Stress? A Pilot Functional Near-Infrared Spectroscopy Study Into Stress-Related Cortical Hemodynamic Features During Sleep. Front. Comput. Sci. 3:774949. doi: 10.3389/fcomp.2021.774949
Received: 13 September 2021; Accepted: 29 October 2021;
Published: 02 December 2021.
Edited by:
Laura M. Ferrari, Université Côte d’Azur, FranceCopyright © 2021 Liang. This is an open-access article distributed under the terms of the Creative Commons Attribution License (CC BY). The use, distribution or reproduction in other forums is permitted, provided the original author(s) and the copyright owner(s) are credited and that the original publication in this journal is cited, in accordance with accepted academic practice. No use, distribution or reproduction is permitted which does not comply with these terms.
*Correspondence: Zilu Liang, liang.zilu@kuas.ac.jp