Exogenous Vitamin D3 Modulates Response of Bovine Macrophages to Mycobacterium avium subsp. paratuberculosis Infection and Is Dependent Upon Stage of Johne’s Disease
 Taylor L. T. Wherry1,2
  Rohana P. Dassanayake3
  Eduardo Casas3
  Shankumar Mooyottu2
  John P. Bannantine1
  Judith R. Stabel1*
- 1Infectious Bacterial Diseases, National Animal Disease Center, United States Department of Agriculture - Agricultural Research Service (USDA-ARS), Ames, IA, United States
- 2Department of Veterinary Pathology, Iowa State University, Ames, IA, United States
- 3Ruminant Diseases and Immunology, National Animal Disease Center, United States Department of Agriculture - Agricultural Research Service (USDA-ARS), Ames, IA, United States
Mycobacterium avium subspecies paratuberculosis (MAP), the causative agent of ruminant enteritis, targets intestinal macrophages. During infection, macrophages contribute to mucosal inflammation and development of granulomas in the small intestine which worsens as disease progression occurs. Vitamin D3 is an immunomodulatory steroid hormone with beneficial roles in host-pathogen interactions. Few studies have investigated immunologic roles of 25-hydroxyvitamin D3 (25(OH)D3) and 1,25-dihydroxyvitamin D3 (1,25(OH)2D3) in cattle, particularly cattle infected with MAP. This study examined the effects of exogenous vitamin D3 on immune responses of monocyte derived macrophages (MDMs) isolated from dairy cattle naturally infected with MAP. MDMs were pre-treated with ± 100 ng/ml 25(OH)D3 or ± 4 ng/ml 1,25(OH)2D3, then incubated 24 hrs with live MAP in the presence of their respective pre-treatment concentrations. Following treatment with either vitamin D3 analog, phagocytosis of MAP by MDMs was significantly greater in clinically infected animals, with a greater amount of live and dead bacteria. Clinical cows had significantly less CD40 surface expression on MDMs compared to subclinical cows and noninfected controls. 1,25(OH)2D3 also significantly increased nitrite production in MAP infected cows. 1,25(OH)2D3 treatment played a key role in upregulating secretion of pro-inflammatory cytokines IL-1β and IL-12 while downregulating IL-10, IL-6, and IFN-γ. 1,25(OH)2D3 also negatively regulated transcripts of CYP24A1, CYP27B1, DEFB7, NOS2, and IL10. Results from this study demonstrate that vitamin D3 compounds, but mainly 1,25(OH)2D3, modulate both pro- and anti-inflammatory immune responses in dairy cattle infected with MAP, impacting the bacterial viability within the macrophage.
1 Introduction
Johne’s disease in ruminants, caused by the intracellular pathogen Mycobacterium avium subsp. paratuberculosis (MAP), is characterized by a chronic enteritis leading to clinical symptoms of watery diarrhea and wasting due to malabsorption of nutrients by a thickened intestinal wall (Manning and Collins, 2001). Economic impacts vary depending on the prevalence of MAP-positive animals in the herd, but losses can reach upwards of $245/cow annually (Ott et al., 1999). To mitigate losses due to high culling rates and decreased milk yield, it is important to understand the highly specialized mechanisms of immune system evasion and manipulation MAP utilizes that allows for propagation of disease.
Macrophages are key reservoirs for MAP and provide a niche microenvironment in which the pathogen can replicate while concealing itself from innate and adaptive immune responses within the infected host. Initial recognition of mycobacteria species by APCs has been suggested to be mediated by mycobacterial DNA binding TLR9 (Bafica et al., 2005; Arsenault et al., 2013), and bacterial cell wall lipoproteins interacting with TLR2 (Weiss et al., 2008), which forms heterodimers with TLR1 or TLR6 (Jin et al., 2007; Kang et al., 2009). Additionally, mutations in TLR1, TLR2, and TLR4 have been found to be associated with increased susceptibility to MAP infection in cattle, possibly as a result in dampened pro-inflammatory cytokine responses such as IFN-γ and IL-12 (Bhide et al., 2009; Mucha et al., 2009). To successfully establish chronic infection, MAP employs a variety of tools. Studies have shown MAP’s ability to block signaling of IFN-γ and TNF-α, which are both cell-activating pro-inflammatory cytokines that play a role in inhibiting intracellular replication of MAP (Stabel, 1995; Arsenault et al., 2012). MAP may control pro- and anti-apoptotic events within monocytes and macrophages, which perhaps functions to regulate replication and dissemination of the bacteria since apoptosis and engulfment by clean-up macrophages would perpetuate the infection cycle (Allen et al., 2001; Kabara and Coussens, 2012; Periasamy et al., 2013). Most importantly, MAP can arrest phagosome-lysosome fusion, thereby preventing the acidification of the compartment and subsequent pathogen destruction (Sturgill-Koszycki et al., 1994; Hostetter et al., 2003; Weiss et al., 2004). Thus, a delicate balance of both pro-inflammatory and regulatory cytokine action is needed to prevent progression to advanced disease states by maintaining control of the infection while regulating inflammation in the host tissue.
The dynamics of macrophage activation and polarization to a host defense (M1) or resolution/repair (M2) phenotype plays a significant role in the progression of bovine paratuberculosis. Classically activated M1 macrophages possess a pro-inflammatory cytokine repertoire, commonly defined by production of IFN-γ, TNF-α, IL-12, IL-1β, and nitric oxide (Benoit et al., 2008). In contrast, alternatively activated M2 macrophages can be identified through the production of anti-inflammatory mediators such as IL-4, IL-10, and IL-13. In intestinal tissue from MAP infected cattle, subclinical infections have a similar ratio of M1 to M2 macrophage phenotypes, likely contributing to control of the infection, while clinically infected animals skewed towards an M2 phenotype (Jenvey et al., 2019). This imbalance between classically activated M1 and alternatively activated M2 macrophages in clinical animals is often accompanied by a failure of pro-inflammatory T helper 1 (Th1) responses in later stage clinical disease, contributing to an increased bacterial load and intestinal pathology (Khalifeh and Stabel, 2004; Khare et al., 2016). Both cell mediated and humoral responses to pathogen infection are dependent upon the co-stimulatory signal resulting from T cell CD40 ligand (CD40L, CD154) ligation with CD40 on antigen presenting cells (Yamauchi et al., 2000; Elgueta et al., 2009).
The non-classical immunomodulatory effects of vitamin D3 on host-pathogen interactions have been well established in human and veterinary medicine (Crowle et al., 1987; Waters et al., 2001; Lippolis et al., 2011). Cells of the immune system have the capability to convert circulating 25-dihydroxyvitamin D3 (25(OH)D3) to its bioactive form, 1α-dihydroxyvitamin D3 (1,25(OH)2D3) (Adams et al., 1983; Nelson et al., 2010b), which in turn modulates immune system signaling during infection. This local conversion is achieved through the action of 1α-hydroxylase, also known as CYP27B1 (García-Barragán et al., 2018). The precursor 25(OH)D3 is found in the circulation at a concentration 1,000 times greater than 1,25(OH)2D3 and possesses a longer biological half-life of 15 days compared to 4-6 hrs, respectively (Horst et al., 1981; Jones, 2008). Evidence of local regulation of vitamin D3 conversion within bovine monocytes and macrophages has been established in vitro (Nelson et al., 2010b) and in vivo (Nelson et al., 2010a). Additionally, foundational work in human tuberculosis, caused by Mycobacterium tuberculosis (M. tb), revealed the requirement of 1,25(OH)2D3 action to upregulate antimicrobial peptide cathelicidin following TLR2/1 heterodimer signaling in human monocytes and macrophages (Liu et al., 2006; Liu et al., 2007). Activation of cathelicidin by 1,25(OH)2D3 resulted in decreased intracellular viability of M. tb through upregulation of vitamin D receptor (VDR) and CYP27B1. Species differences exist, with humans possessing a single cathelicidin gene compared to 11 cathelicidin genes in cattle, upon which no effects of 1,25(OH)2D3 have thus far been observed (Nelson et al., 2010b).
Outside of cathelicidin responses in cattle, vitamin D3 influences other inflammatory responses following antigenic exposure. Stimulation of bovine monocytes with lipopolysaccharide (LPS) and treatment with 1,25(OH)2D3 has been shown to enhance pro-inflammatory gene expression responses, such as IL-1β (IL1B) and inducible nitric oxide synthase (iNOS/NOS2) (Nelson et al., 2010b). A corresponding increase in nitrite concentration was also observed, along with upregulated gene expression for the chemokine RANTES/CCL5 (regulated upon activation, normal T cell expressed and secreted) (Nelson et al., 2010b). Furthermore, evidence of vitamin D3 exhibiting immunomodulatory roles in cattle during exposure to mycobacterial species has been presented in recent years. Monocyte derived macrophages infected with Mycobacterium bovis (M. bovis) and treated with 1,25(OH)2D3 enhanced nitric oxide production and its corresponding NOS2 gene expression (García-Barragán et al., 2018). Additionally, peripheral blood mononuclear cells (PBMCs) from calves vaccinated with M. bovis-BCG and treated with 1,25(OH)2D3 or 25(OH)D3 observed increased NOS2 and nitric oxide, while concurrently decreasing IFN-γ responses following re-exposure to M. bovis purified protein derivative (PPD) (Nelson et al., 2011).
The objective of this study was to characterize the effects of vitamin D3 on immune responses within cattle at different stages of MAP infection while incorporating T cell and macrophage interactions in vitro. To the best of our knowledge, this is the first study to report comprehensive immune responses to MAP accompanied by vitamin D3 treatment at specific stages of Johne’s disease. Based on previous evidence of immunomodulation induced by vitamin D3, especially in cases of bacterial infection, we hypothesized in the present study that 25(OH)D3 or 1,25(OH)2D3 treatment of bovine MDM-PBMC co-cultures would elicit protective immune responses that contribute to disease resolution upon re-exposure to MAP.
2 Materials And Methods
2.1 Animals
Holstein dairy cows used in this study were housed separately on-site according to positive or negative infection status with MAP to prevent cross-contamination. All experimental procedures were approved by the IACUC (National Animal Disease Center, Ames, IA). Housing facilities are accredited by the American Association for Accreditation of Laboratory Animal Care.
Age ranges for each set of experiments are as follows: BacLight viability (2 - 11 yrs); activation markers (2.5 – 11.5 yrs); cytokine induction (3 – 14 yrs). Diagnostic tests measuring serum MAP-specific antibody levels (Herdchek; IDEXX, Westbrook, ME), bovine IFN-γ plasma levels (Bovigam; Prionics, La Vista, NE), and fecal shedding detected by culture on Herrold’s egg yolk medium (Becton Dickinson, Sparks, MD) were used to categorize cows into stage of MAP infection, as previously described (Stabel and Bannantine, 2019).
For the BacLight viability assay experiments, clinical cows (n=8) were culture positive for MAP shedding in the feces. This group was ELISA positive for MAP serum antibody having an average S/P ratio of 1.36 along with an average MAP-specific IFN-γ recall response of OD450 0.43 ± 0.22 (Abs450nmMPS-Abs450nmNS). Subclinical cows (n=8) were ELISA negative for MAP serum antibodies and IFN-γ OD450 results averaged 0.15 ± 0.05. Control animals (n=8) were negative for all MAP diagnostic tests.
Clinical cows (n=7) in the macrophage activation marker experiment were ELISA positive for MAP serum antibody having an average S/P ratio of 1.9, and had a MAP-specific IFN-γ recall response of OD450 0.90 ± 0.31 (Abs450nmMPS-Abs450nmNS). All cows but one in this group were culture positive for MAP fecal shedding, with an average of 31 CFU/g fecal matter. Subclinical cows (n=8) were ELISA negative for MAP serum antibodies and IFN-γ OD450 results averaged 0.84 ± 0.30. Two cows in this group were culture positive for MAP shedding in the feces, but shedding was low at < 9 CFU/g fecal matter. The control group (n=6) was negative for all MAP diagnostic tests.
Lastly, diagnostic values for the cytokine induction experiments included clinical cows (n=7) that were ELISA positive for MAP serum antibody, with an average S/P ratio of 1.27. The average MAP-specific IFN-γ recall response for this group was OD450 0.39 ± 0.17 (Abs450nmMPS-Abs450nmNS). Clinical cows were culture positive for MAP having an average of 189 CFU/g fecal matter. The subclinical group (n=7) was ELISA negative for MAP serum antibodies and had an average IFN-γ OD450 of 0.26 ± 0.11. Three subclinical cows were fecal culture positive for MAP and had an average shedding value of 12 CFU/g fecal matter. Control cows (n=9) were negative for all MAP diagnostic tests.
2.2 MAP 167 Culture
This study utilized a virulent strain of MAP (clinical cow 167; NADC, Ames, IA) isolated from a dairy cow in the clinical stage of Johne’s disease. MAP 167 cultures were prepared by inoculating a frozen aliquot into 450 ml of sterile Middlebrook 7H9 broth (Becton Dickinson, Franklin Lakes, NJ) at pH 5.9, supplemented with 1 mg mycobactin J (Allied Monitor Inc., Fayette, MO), 50 ml oleic acid-albumin-dextrose complex (OADC; Becton Dickinson), and 0.05% Tween 80 (Sigma, St. Louis, MO). Bacterial cultures were incubated at 39°C until they reached the logarithmic growth phase at an optical density of 0.2 to 0.4 at 540 nm (OD540). Aliquots were prepared and stored in D-PBS (Sigma-Aldrich) as described previously (Bradner et al., 2013).
2.3 Vitamin D3 Stock Preparation
25(OH)D3 and 1,25(OH)2D3 stocks were supplied in pure ethanol by Dr. T. A. Reinhardt (NADC, Ames, IA). Working stocks of 25(OH)D3 and 1,25(OH)2D3 were made by diluting in 100% fetal bovine serum to a concentration of 1000 ng/ml and 40 ng/ml, respectively. Following a final 1:10 dilution, cell culture treatment wells had a final concentration of 10% FBS with either 100 ng/ml 25(OH)D3 or 4 ng/ml 1,25(OH)2D3. Final ethanol concentrations for 25(OH)D3 and 1,25(OH)2D3 treatments did not exceed 0.11% or 0.05%, respectively. All stocks were stored in airtight glass vials at -20°C and kept protected from light during storage and experimental procedures.
2.4 PBMC Isolation and MDM Culture
PBMCs were isolated from whole blood drawn from jugular venipuncture into 2× acid-citrate-dextrose (in-house, 1:10). Whole blood diluted 1:2 in D-PBS (Sigma-Aldrich, St. Louis, MO) was centrifuged 800 × g for 30 min and the resulting buffy coat fraction was laid over Histopaque -1077 (Sigma) for density centrifugation. PBMCs underwent lysing-restoring steps to remove red blood cell contamination, washed in D-PBS, and resuspended in complete growth medium (cRPMI; RPMI-1640 with L-glutamine and HEPES [Gibco, Grand Island, NY], 1% antibiotic-antimycotic [100 U/ml penicillin, 100 μg/ml streptomycin, 250 ng/ml Amphotericin B, Gibco], 1% MEM non-essential amino acids solution [100×, Gibco], 2% MEM essential amino acids solution [50×, Gibco], 2 mM L-glutamine [200 mM, Gibco]; 1% sodium pyruvate [100mM, Gibco]; and 50 μM 2-mercaptoethanol [50 mM, Gibco]) supplemented with 10% (v/v) heat inactivated fetal bovine serum (FBS, HyClone Cytiva, Marlborough, MA). Live cells were counted using trypan blue dye exclusion and a TC20 automated cell counter (Bio-Rad, Hercules, CA). Cell densities were adjusted to 4.0 × 10⁶ cells per ml in cRPMI with 10% FBS and seeded at 1 ml onto 24 well ibi-treat μ-plates (Ibidi, Fitchburg, WI) for activation marker analysis, 4 well ibi-treat μ-slides (Ibidi) for BacLight viability staining and propidium monoazide dye (PMAxx) viability analysis, or 24 well flat-bottom plates (Becton Dickinson, Franklin Lakes, NJ) for cytokine secretion and expression assays. PBMCs were incubated 5-6 days in a 39°C humidified incubator to generate MDMs.
2.5 Vitamin D3 Treatment and MAP Inoculation
Cell cultures had their supernatants replaced on day 5 to pre-treat with 1 ml cRPMI containing 10% FBS and 100 ng/ml 25(OH)D3 for 24 hrs. Untreated control replicates also had cell culture medium replaced on this day with 1 ml cRPMI containing 10% FBS only. On day 6, another set of replicate wells were pre-treated with 4 ng/ml 1,25(OH)2D3 for 6 hrs. During this incubation, separate culture plates designated for counting MDMs were gently washed twice with 1 ml room temperature D-PBS, then incubated on ice for 15 min after addition of 1 ml cold D-PBS to promote non-mechanical detachment of adherent cells. MDMs were then removed from culture plates and counted using trypan blue dye exclusion on a TC20 automated cell counter. Completion of vitamin D3 pre-treatments were timed to intersect on day 6. At this time, all wells had fresh media replaced with their respective treatments, and those assigned for MAP infection were inoculated at a 10:1 multiplicity of infection (MOI) ± 25(OH)D3 or 1,25(OH)2D3 in 1 ml cRPMI with 10% FBS. A 10:1 MOI has previously been reported as an ideal ratio for optimal uptake of MAP by macrophages and increasing MOI does not show a significant benefit (Murphy et al., 2006; Chiang et al., 2007). All plates were then incubated 24 hrs at 39°C.
Plates assigned for capture of cell culture supernatants and RNA extraction underwent the same vitamin D3 treatments and MAP inoculation protocol as previously described, but prior to addition of in vitro treatments, plates were centrifuged 1500 RPM (491 × g) for 5 min to retain lymphocytes to allow for macrophage cross-talk with T cells.
For the MAP viability assays PBMCs were harvested from cows at two time points, therefore, separate experiments were performed for 1,25(OH)2D3 and 25(OH)D3 treatments. Cytokine induction and macrophage activation marker analysis were also two separate experiments but had 1,25(OH)2D3 and 25(OH)D3 treatments administered concurrently. Vitamin D3 treatment concentrations used in these experiments were selected based on previous work in cattle (Nelson et al., 2010b; Nelson et al., 2011).
2.6 Activation Marker Fluorescence Microscopy
MDMs cultured in coverslip-bottom 24 well plates (Ibidi) were first blocked in serum-free block buffer (X0909, Agilent Technologies, Santa Clara, CA) for 30 min at room temperature. Extracellular targets were all incubated 1 hr at room temperature in the dark, beginning with CD40 (BOV2107; Washington State University, Pullman, WA), goat anti-mouse biotin labeled secondary IgG (31802; Invitrogen), and fluorescently labeled tertiary NeutrAvidin DyLight 650 (84607, Invitrogen). MHCII primary (BOV2004; Washington State University) and goat anti-mouse IgG2a AF488 secondary antibodies (A21131; Invitrogen) were added, followed by cell fixation for 15 min with paraformaldehyde diluted to 1% (157-4; Electron Microscopy Sciences, Hatfield, PA). Cells were washed and permeabilized with 20 mM MOPS with 1mM MgCl2, 150 mM NaCl, and 0.1% Saponin (perm buffer) three times for 5 min each in preparation for labeling intracellular targets. Cells were blocked again for 30 min, incubated with pan macrophage marker CD68 primary antibody (M0718; Agilent Technologies), then AF594 goat anti-mouse IgG1 (115-585-205; Jackson Labs, West Grove, PA) for 1 hr each. Counter-staining was achieved with 1 μg/ml DAPI and approximately 250 μl of non-hardening mounting medium (50001; Ibidi) was added to each well for imaging.
Images were acquired with a 40× Nikon Plan Fluor N.A. 1.3 objective using oil immersion with 6.2 second pixel dwell time on a Nikon A1 Resonance Plus confocal microscope using NIS-Elements Advanced Research software v5.11 (Nikon, Melville, NY). The instrument contains a 4-laser gallium-arsenide-phosphide/normal photomultiplier tube (GaAsP PMT) fluorescence detector unit (A1-DU4) with two GaAsP PMTs (488 and 561 nm) and two normal PMTs (405 and 640). Fluorescent signal was detected sequentially using the following solid-state diode lasers and bandpass filters: 405 nm (450/50 nm), 488 nm (525/50 nm), 561 nm (600/50 nm), and 640 nm (685/70 nm). A minimum of 10 images were acquired per cow and treatment. Following image acquisition, binary layers for each laser channel were created with thresholds established from no stain and secondary only controls to exclude any nonspecific background. The mean fluorescence intensity (MFI) of CD40 and MHCII fluorescence signal was measured on MDMs, identified as expressing CD68. Analysis was run on unaltered images. The representative image chosen for presentation had lookup tables applied within the Nikon NIS-Elements software to brighten signal and was post-processed in Adobe Photoshop (version 22.0; San Jose, CA) to further increase brightness and reduce shadows for better print viewing. All alterations were uniformly applied to the entire image.
2.7 MAP Viability Assessment
2.7.1 BacLight
MDMs were washed with 20 mM MOPS containing 1mM MgCl2 and 150 mM NaCl (wash buffer). To label any remaining extracellular MAP for analysis exclusion, an anti-MAP rabbit polyclonal (#272, in-house) antibody was added, followed by an Alexa Fluor 647 (AF647) goat-anti rabbit secondary antibody (A21244; Invitrogen, Carlsbad, CA). SYTO 9 and propidium iodide (P.I.) dyes supplied in the BacLight viability kit (L7012; Life Technologies, Carlsbad, CA) were each diluted according to the manufacturer’s recommendations in perm buffer. Saponin detergent in this buffer facilitated intracellular staining of MAP through entry of P.I. into the live bovine MDMs, which can only enter cells in the event membrane integrity is compromised. MDMs were incubated in 0.5 ml of BacLight dye solution for 15 min at room temperature in the dark. The viability dye was removed, and 1 ml of wash buffer was added for live cell confocal imaging.
Similar to the activation marker fluorescence assay, a minimum of 10 images were taken per cow and treatment. Due to the permeabilization of live bovine MDM cell membranes previously discussed, MDM nuclei were fluorescently labeled along with MAP genomic material. P.I. exhibits a stronger binding affinity for nucleic acids than SYTO 9 (Stocks, 2004) and therefore labeled all mammalian nuclei in each sample. When binary layers were created for each laser channel during analysis with the Nikon NIS-Elements software, thresholds were established from no stain and secondary antibody only controls to exclude background fluorescence, and size limits were applied in the 488 nm and 594 nm channel to treat equally the channels measuring intracellular MAP. The utility of setting size parameters was to exclude large mammalian nuclei labeled with P.I. and allowed for quantification of MAP only. Additionally, MAP co-labeling with P.I. or SYTO 9 and AF647 secondary antibody signal were identified as extracellular and thus excluded from the intracellular MAP viability calculation (area μm2). Live and dead MAP area were calculated by the software measuring binary area pixels expressing fluorescence in the 488 nm and 594 nm channels, respectively. Lookup tables were applied to the representative image selected to brighten signal and was post-processed in Adobe Photoshop (version 22.0; San Jose, CA) to further increase brightness and reduce shadows for better print viewing. All alterations were uniformly applied to the entire image.
2.7.2 Propidium Monoazide Dye (PMAxx)
After incubation with MAP, MDMs were washed with room temperature D-PBS (Sigma-Aldrich) then permeabilized with 0.1% saponin in DNase-free dH2O (Gibco) for 30 min at 37°C in a humidified incubator. MDMs were removed by vigorously pipetting and transferred to a microcentrifuge tube. Samples were pelleted by centrifugation at 4,500 RPM for 30 min, then the supernatant was removed and cell pellet was resuspended in 1 ml DNase-free dH2O. Samples were centrifuged again at 20,000 × g for 10 min, supernatant removed, and cell pellet resuspended in 500 μl dH2O. Propidium monoazide (PMAxx) dye was added to each sample at a final concentration of 25 μM, vortexed to ensure homogeneity of the solution, and incubated 10 min in the dark at room temperature on a rocker. Cross-linking of the PMAxx dye and free nonviable MAP DNA was achieved by exposing samples to LED light for 15 min using a PMA-Lite Photolysis Unit (Biotium, Fremont, CA). Samples were then centrifuged 16,000 × g for 10 min and the supernatant was discarded. Samples were stored at -20°C until ready for further processing.
Total DNA was purified from the crude cell lysates using the Qiagen DNeasy Blood & Tissue kits according to the manufacturer’s protocol. DNA was eluted in a final volume of 100 μl and stored at -20°C until ready for qPCR. MAP-specific IS900 primers and probes were used to measure the amount of viable MAP within the harvested MDMs and their sequences are as follows: forward 5′-CCGCTAATTGAGAGATGCGATTGG-3′; reverse 5′-AATCAACTCCAGCAGCGCGGCCTCG-3′; and probe 5′-FAM-TCCACGCCCGCCCAGACAGG-TAMRA-3′. Real-time qPCR was performed on a sample volume of 25 μl using TaqMan Environmental Master Mix 2.0 and a thermal profile of 1 cycle for 2 min at 50°C, 1 cycle for 10 min at 95°C, followed by 40 cycles of denaturation at 94°C for 25 sec and 1 min at 60°C for primer annealing and extension. Each sample was plated in triplicate and viable CFUs were calculated from a standard curve ranging from 1ng/μl to 1 fg/μl stock MAP DNA.
2.8 RNA Extraction and cDNA Synthesis
On day 7, cell culture plates were centrifuged for 10 min at 500 × g. Cell supernatants were collected and stored in 1.5 ml microcentrifuge tubes (Axygen, Union City, CA) at -80°C for later cytokine secretion analysis. The cells remaining in each well were transferred to separate 1.5 ml microcentrifuge tubes (Axygen) and stored in 350 μl RNAprotect Cell Reagent (Qiagen, Hilden, Germany) at -80°C for further processing. Beginning RNA extraction, samples were thawed and centrifuged 5,000 x g for 5 min. The cell pellet was lysed in 600 μl Buffer RLT Plus (Qiagen) supplied in the RNeasy Mini kit. RNA purification was performed on columns supplied in the kit according to the manufacturer’s instructions. RNA elution was achieved using a final volume of 60 μl RNase-free water also supplied in the kit. The RNA 6000 Nano kit (Agilent, Santa Clara, CA) and 2100 Bioanalyzer instrument (Agilent) were used to quantify total RNA present. Samples were diluted to 12.5 ng/μl in 40 μl RNAse-free water and if the RNA concentration fell below 12.5 ng/μl, samples were concentrated using a SpeedVac DNA 120 and re-analyzed. Superscript IV (Invitrogen, Carlsbad, CA) was used to reverse transcribe RNA. The reaction mixture included a final concentration of ~175 ng random hexamer primers (Invitrogen), ~600 nM of each dNTP (Invitrogen), and 2,000 units of Superscript IV. Primers were annealed for 5 min at 65°C, followed by incubation with the reverse transcriptase enzyme for 10 min at 23°C, 10 min at 50°C, then 10 min at 80°C per the manufacturer instructions. Stock cDNA was diluted 1:10 in RNase and DNase-free water (Gibco) and stored at -20°C.
2.9 Cytokine Gene Expression Real-Time qPCR
TaqMan bovine gene expression assays (Applied Biosystems, Foster City, CA) listed in Table 1 were used to quantify relative expression of IL-1β (IL1B), IL-10 (IL10), IL-12A (IL12A), IL-17A (IL17A), β-defensin 7 (DEFB7), β-defensin 10 (DEFB10), CYP24A1 (CYP24A1), CYP27B1 (CYP27B1), IFN-γ (IFNG), iNOS (NOS2), RANTES (CCL5), and TNF-α (TNF) in cells from the 24 hr cytokine supernatant samples. The following protocol was optimized previously in our lab1. Samples were plated in duplicate with a reaction mixture consisting of 10 μl TaqMan Fast Advanced Master Mix (Applied Biosystems), 1 μl gene expression assay, 5 μl nuclease-free water, and 4 μl cDNA template per well. Relative quantitation (RQ) values were calculated by normalization to 18S rRNA expression (FAM/MGB probe, non-primer limited; Applied Biosystems) and calibration to the NS sample. Data were analyzed using the 2−ΔΔCT method (Livak and Schmittgen, 2001).
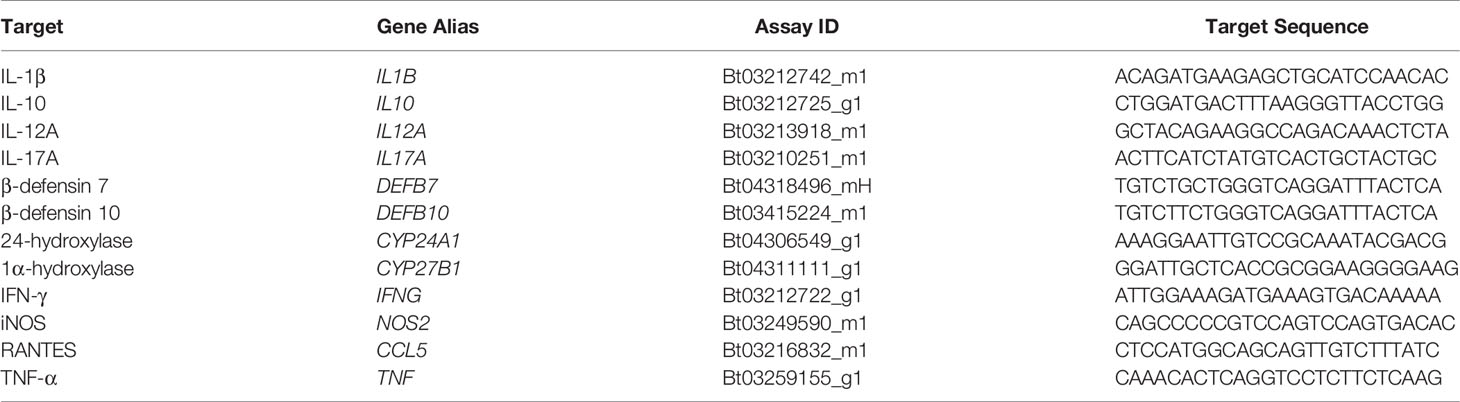
Table 1 ThermoFisher Scientific gene expression assays.
2.10 Cytokine Secretion
A custom Milliplex bovine 8-plex cytokine/chemokine magnetic bead panel was used to quantify cytokine concentrations from MDM culture supernatants and included IFN-γ, IL-1β, IL-6, IL-10, IL-17A, IL-36RA, MCP-1, and TNF-α. Samples were loaded in duplicate onto 96-well plates and incubated with beads overnight (16-18 hrs) at 4°C on a plate shaker protected from light. Biotinylated detection antibodies were added to each sample, followed by Streptavidin-Phycoerythrin. A magnetic plate was used to retain beads during manual washing. Drive Fluid was used to resuspend beads in preparation for running samples on the Luminex MAGPIX xMAP instrument. Individual cytokines were identified through fluorescent signal emitted by internal bead dye ratios pre-determined by the manufacturer. Phycoerythrin fluorescence was used to generate cytokine concentrations present in each sample by comparison to a standard curve. Data were collected and summarized using the Bio-Plex Manager software (Bio-Rad).
IL-12 concentrations were quantified by ELISA standard curve generated using a bovine IL-12/IL-23 p40 recombinant protein (RP0077B; Kingfisher). Capture antibody (MCA1782EL, Bio-Rad) and biotinylated detection antibody (MCA2173B, Bio-Rad) were used at concentrations of 1.1 μg/ml and 0.5 μg/ml, respectively. Colorimetric changes were developed through the addition of HRP bound streptavidin, followed by incubation with TMB substrate. Signal was detected at 450nm using a SpectraMax 340PC384 microplate reader (Molecular Devices, San Jose, CA). The Milliplex and IL-12 standard ELISA protocols were optimized previously in our lab (Wherry et al., 2021).
2.11 Nitrite Quantification
The Griess reagent system (Promega, Madison, WI) was used to measure nitrite production in supernatants from day 7 MDM cultures following 24 hr incubation with MAP. The reaction was performed by preparing a standard curve from 100 μM to 1.56 μM of nitrite, then incubating 50 μl sulfanilamide solution with 50 μl of experimental samples for 10 min at room temperature in the dark. Lastly, 50 μl of N-(1-napthyl)ethylenediamine dihydrochloride (NED) solution was added. After incubating for 10 min in the dark, absorbance was measured at 540nm using a SpectraMax 340PC384 microplate reader (Molecular Devices).
2.12 Statistical Analysis
The BacLight dataset was analyzed using the procedure MIXED from SAS version 9.4 (SAS Institute, Cary, NC). For all other assays, statistical analysis was performed using R Statistical Software (version 4.0.3, R Foundation for Statistical Computing, Vienna, Austria) and RStudio (version 1.3.1093, Boston, MA). Statistical models were built using the mixed model function “lme” from package “nlme” (Pinheiro et al., 2021) and post-hoc tests were performed using the package “emmeans” (Lenth, 2021) with a Tukey adjustment for multiple comparisons. Relative gene expression analysis was performed using ΔΔCt values and data were transformed using the 2-ΔΔCt method for graphical representation.
3 Results
3.1 Intracellular MAP Viability
The effects of exogenous vitamin D3 compounds on killing of MAP were assessed in MDM cultures by BacLight viability dyes following incubation with MAP (10:1 MOI) for 24 hrs. Overall, treatment with both 25(OH)D3 and 1,25(OH)2D3 resulted in significant (P < 0.001) increases in live, dead, and total MAP in MDMs from clinical cows (Figure 1). In addition, significantly (P < 0.001) higher numbers of dead MAP were found within untreated MDMs from each infection group. The amount of total MAP phagocytized by MDMs was observed to be significantly (P < 0.001) greater in clinical animals, while subclinical cows demonstrated a decrease in MAP uptake compared to noninfected controls (P < 0.001). There was no significant impact of vitamin D3 treatment on viability and total MAP in control or subclinical MDMs, except for a reduction (P < 0.05) in dead MAP for the control group that underwent 25(OH)D3 treatment (Figure 1A). Lastly, a higher number of live MAP were present in untreated MDMs from clinical animals compared to control animals for both the 25(OH)D3 (P < 0.001) and 1,25(OH)2D3 (P < 0.05; Figure 1B) experiments, an effect that contributed to the overall increase in total intracellular MAP. A representative BacLight fluorescence image is shown in Figure 2.
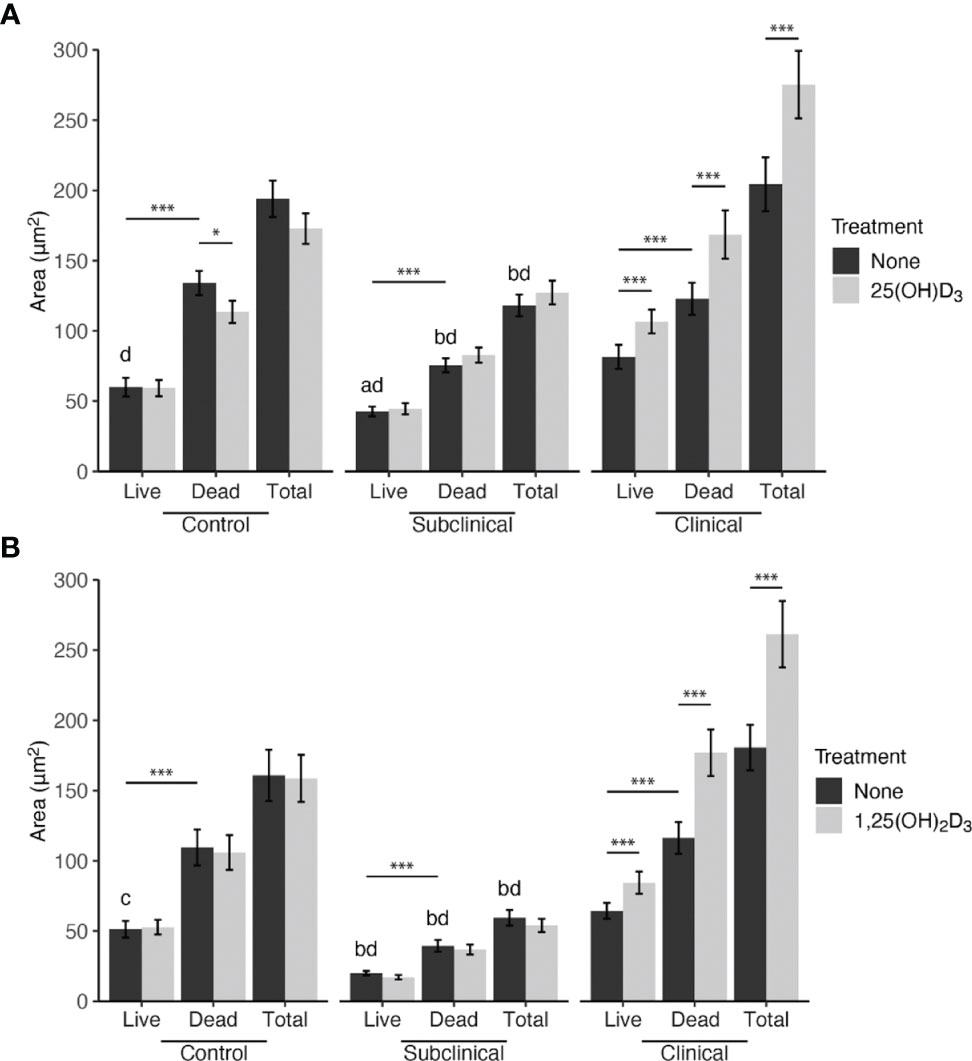
Figure 1 Mean fluorescence area of Mycobacterium avium subsp. paratuberculosis (MAP) present within monocyte-derived macrophages (MDMs) cultured from naturally infected dairy cattle (subclinical n=8, clinical n=8, and noninfected controls n=8). Peripheral blood mononuclear cells (PBMCs) were cultured 5-6 days to generate MDMs, pre-treated with vitamin D3 as detailed in methods, then incubated 24 hrs with live MAP at 10:1 MOI (A) ± 25(OH)D3 or (B) ± 1,25(OH)2D3. Live and dead MAP were determined using SYTO 9 and propidium iodide, respectively. Data are presented as the mean ± SE. Intra-status comparison significance levels are *< 0.05, **< 0.01, ***< 0.001. Intra-viability comparisons against the control group are a < 0.01, b < 0.001 and intra-viability comparisons against the clinical group are c < 0.05 and d < 0.001.
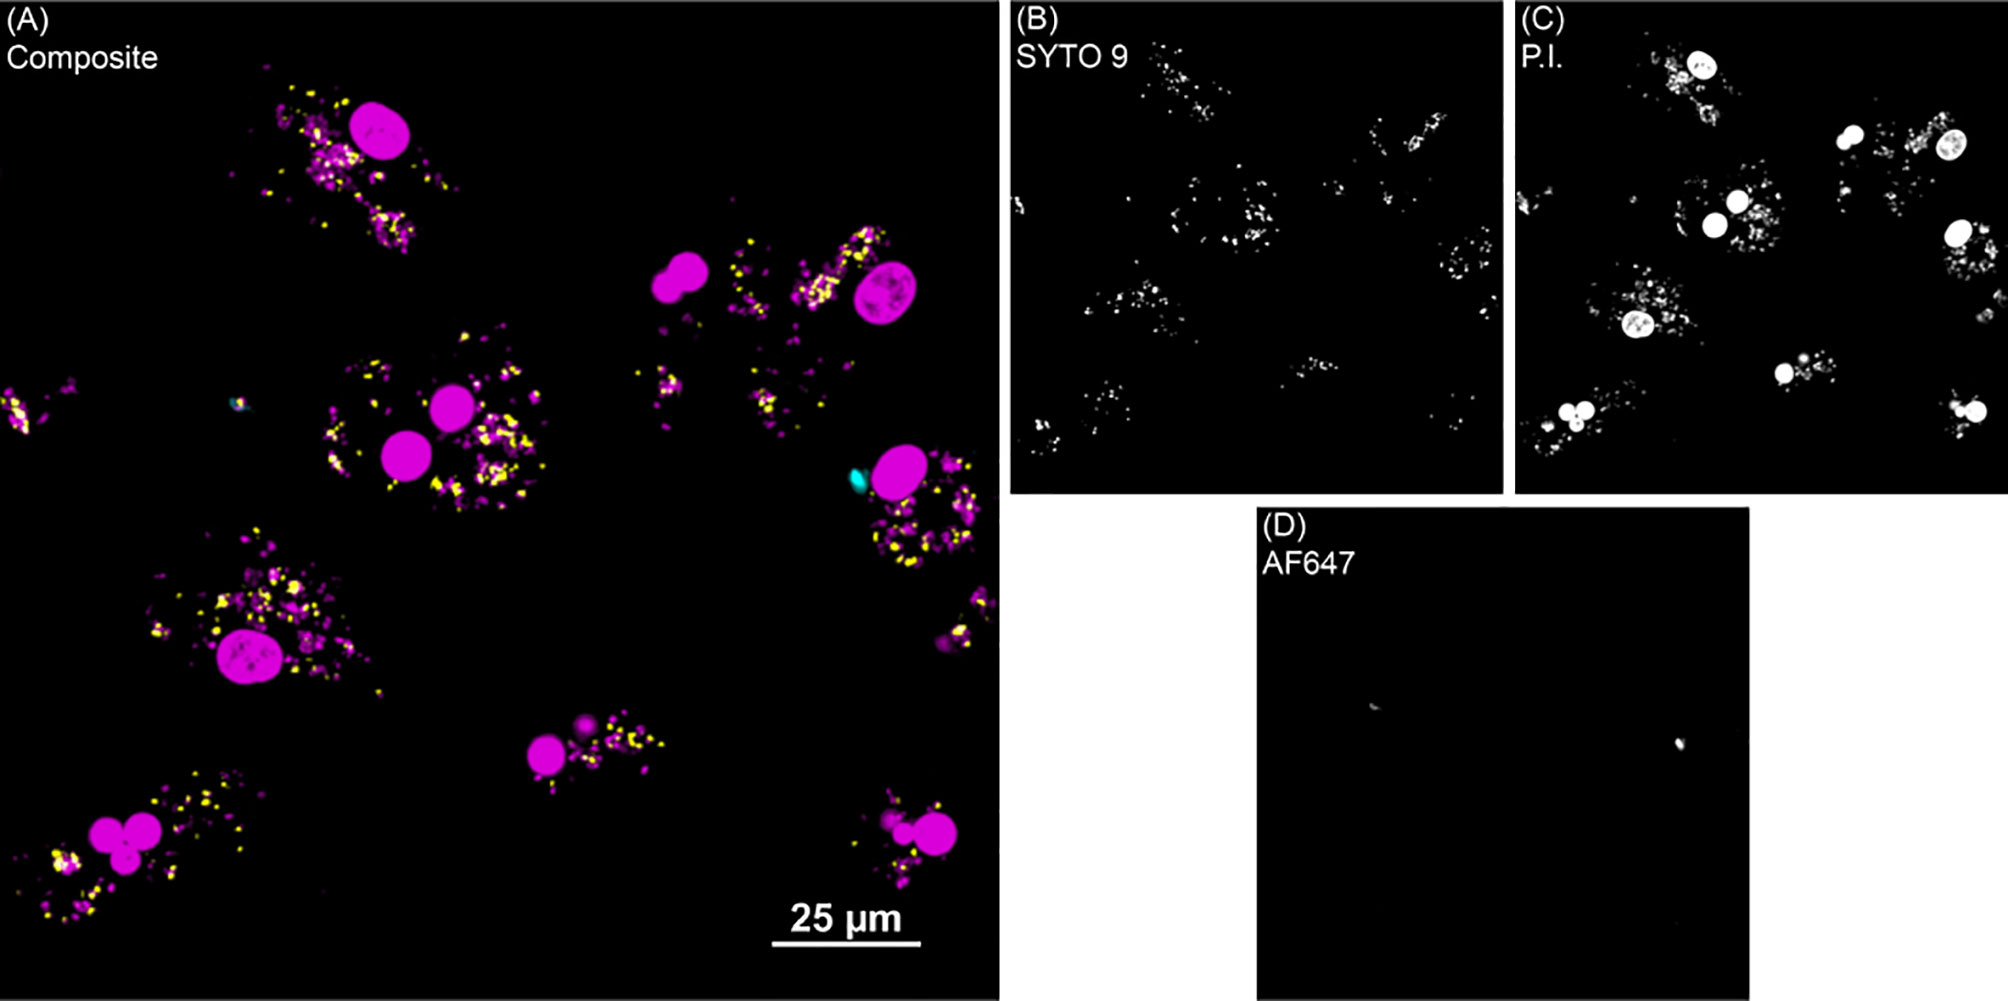
Figure 2 BacLight fluorescence to investigate intracellular MAP viability. (A) Shows one representative image of monocyte derived macrophage culture without vitamin D3 treatment from a clinical cow. (B) SYTO 9 (yellow) represents viable intracellular MAP detected in the 488 nm channel. (C) Propidium iodide (P.I.) was used to label intracellular nonviable MAP in the 561 nm channel (magenta). Large, dense magenta spheres are nuclei and were excluded from analysis based on size. (D) Extracellular MAP (cyan) that was not washed away was detected in the 640 nm channel, and its dual labeling with P.I. or SYTO 9 flagged those bacteria for exclusion from analysis.
The PMAxx assay was also used to quantify the amount of live MAP within bovine MDMs using a standard curve generated with serial dilutions of MAP DNA. The results from this assay rely upon a DNA-intercalating, PCR-inhibiting propidium monoazide dye treatment with qPCR output to define the viable population of intracellular MAP. In consensus with the BacLight data, this assay also showed increased (P < 0.05) MAP in MDMs from clinical cows in both vitamin D3 experiments (Figures 3A, B). The proportion of dead MAP in the PMAxx treated samples was extrapolated using the recovered live CFU counts and the total amount of MAP CFU inoculated into each sample to achieve a 10:1 MOI. When expressed as a percentage of viable MAP (Figures 3C, D), results suggested a significantly greater proportion of dead MAP in control (P < 0.001) and subclinical (P < 0.05) cows in the 1,25(OH)2D3 experiment.
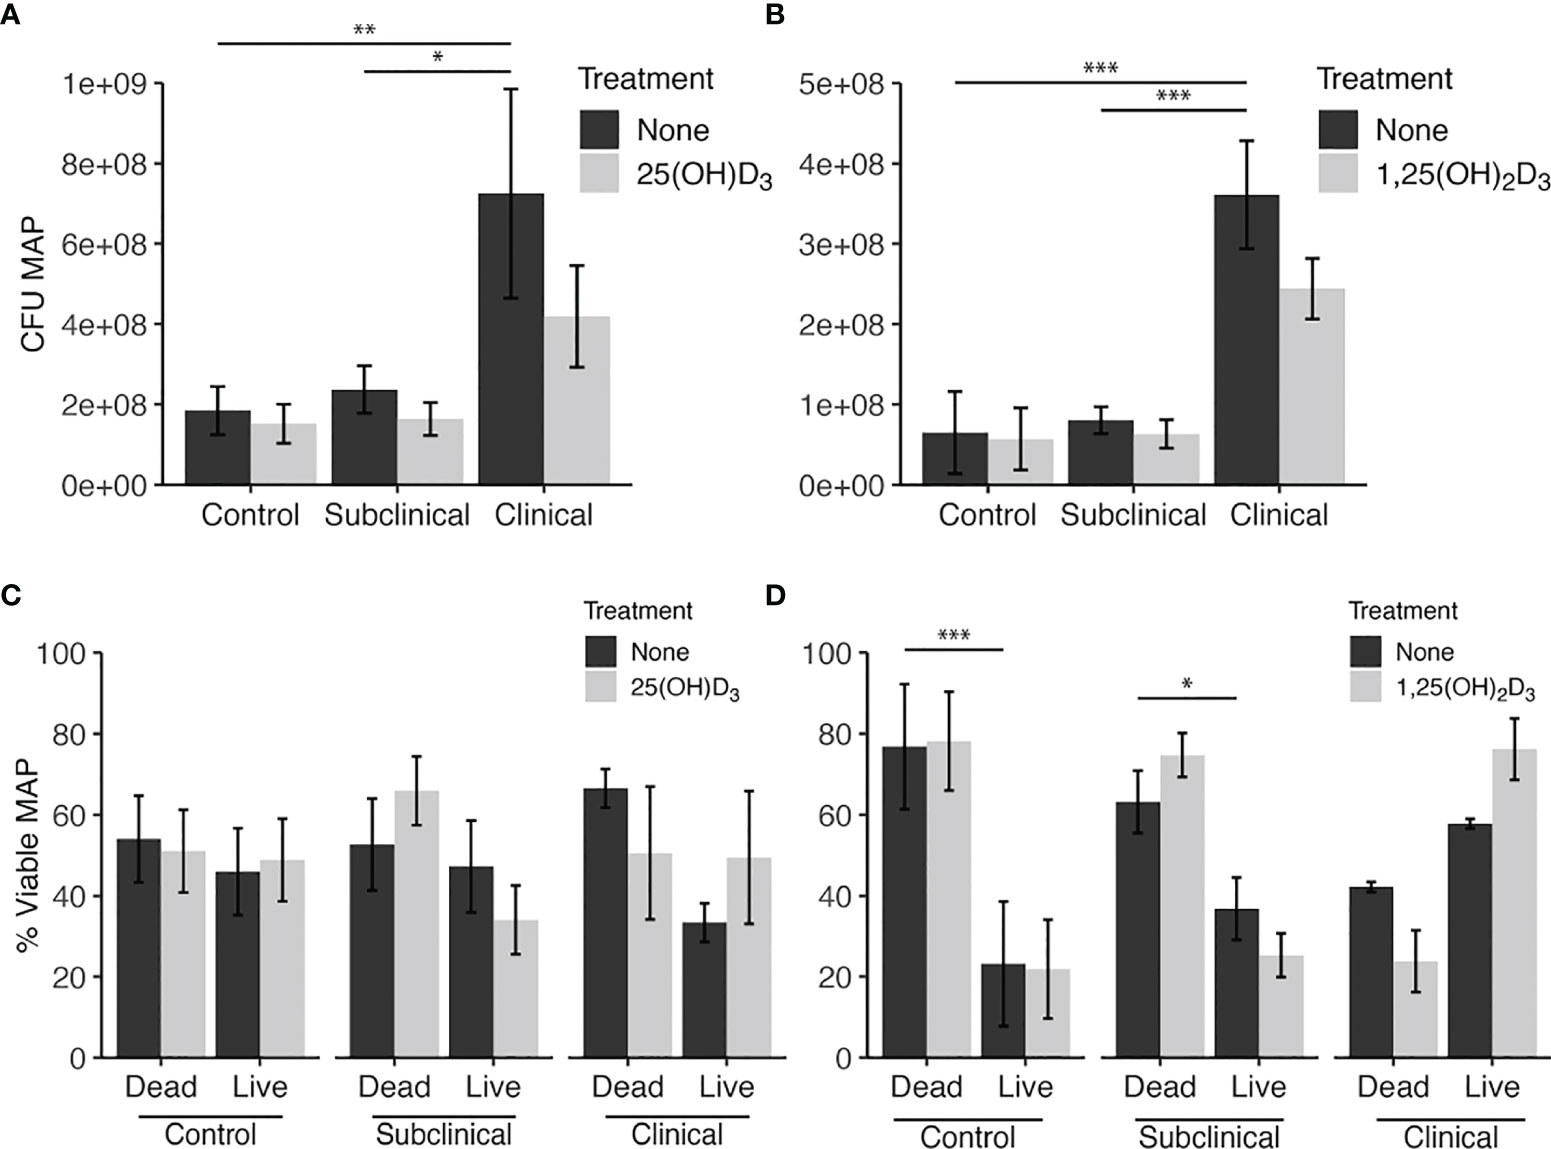
Figure 3 Quantitation of Mycobacterium avium subsp. paratuberculosis (MAP) present within monocyte-derived macrophages (MDMs) cultured from naturally infected dairy cattle (subclinical n=8, clinical n=8, and noninfected controls n=8). Viable intracellular MAP colony forming units (CFUs) were quantified using PMAxx dye and IS900 gene amplification via real time qPCR and standard curve. (A, B) show CFU recovered from samples. (C, D) show proportion of viable MAP that was calculated from PMAxx viability CFU data divided by the number of MAP inoculated in MDM cultures to achieve a 10:1 MOI. Data are presented as the mean ± SE and significance is defined as *< 0.05, **< 0.01, ***< 0.001.
3.2 MDM Activation Marker Expression and iNOS Activity
To further understand how macrophage function was impacted by infection status and vitamin D3 treatment, markers of cellular activation on MDMs were investigated. MDMs were identified through the positive labeling of CD68, a pan-macrophage marker, and then further analyzed to measure the mean fluorescence intensity (MFI) of CD40 and MHCII expression located on the cell surface.
Our results indicated that infection status influences CD40 expression, showing downregulation in untreated MDMs from clinical cows when compared to controls (P < 0.001) and subclinical cows (Figure 4A). Both 25(OH)D3 and 1,25(OH)2D3 had a significantly negative effect upon CD40 expression in noninfected controls (P < 0.05) and subclinically infected animals (P < 0.05). No significant changes in expression were observed in clinical cows following vitamin D3 treatment.
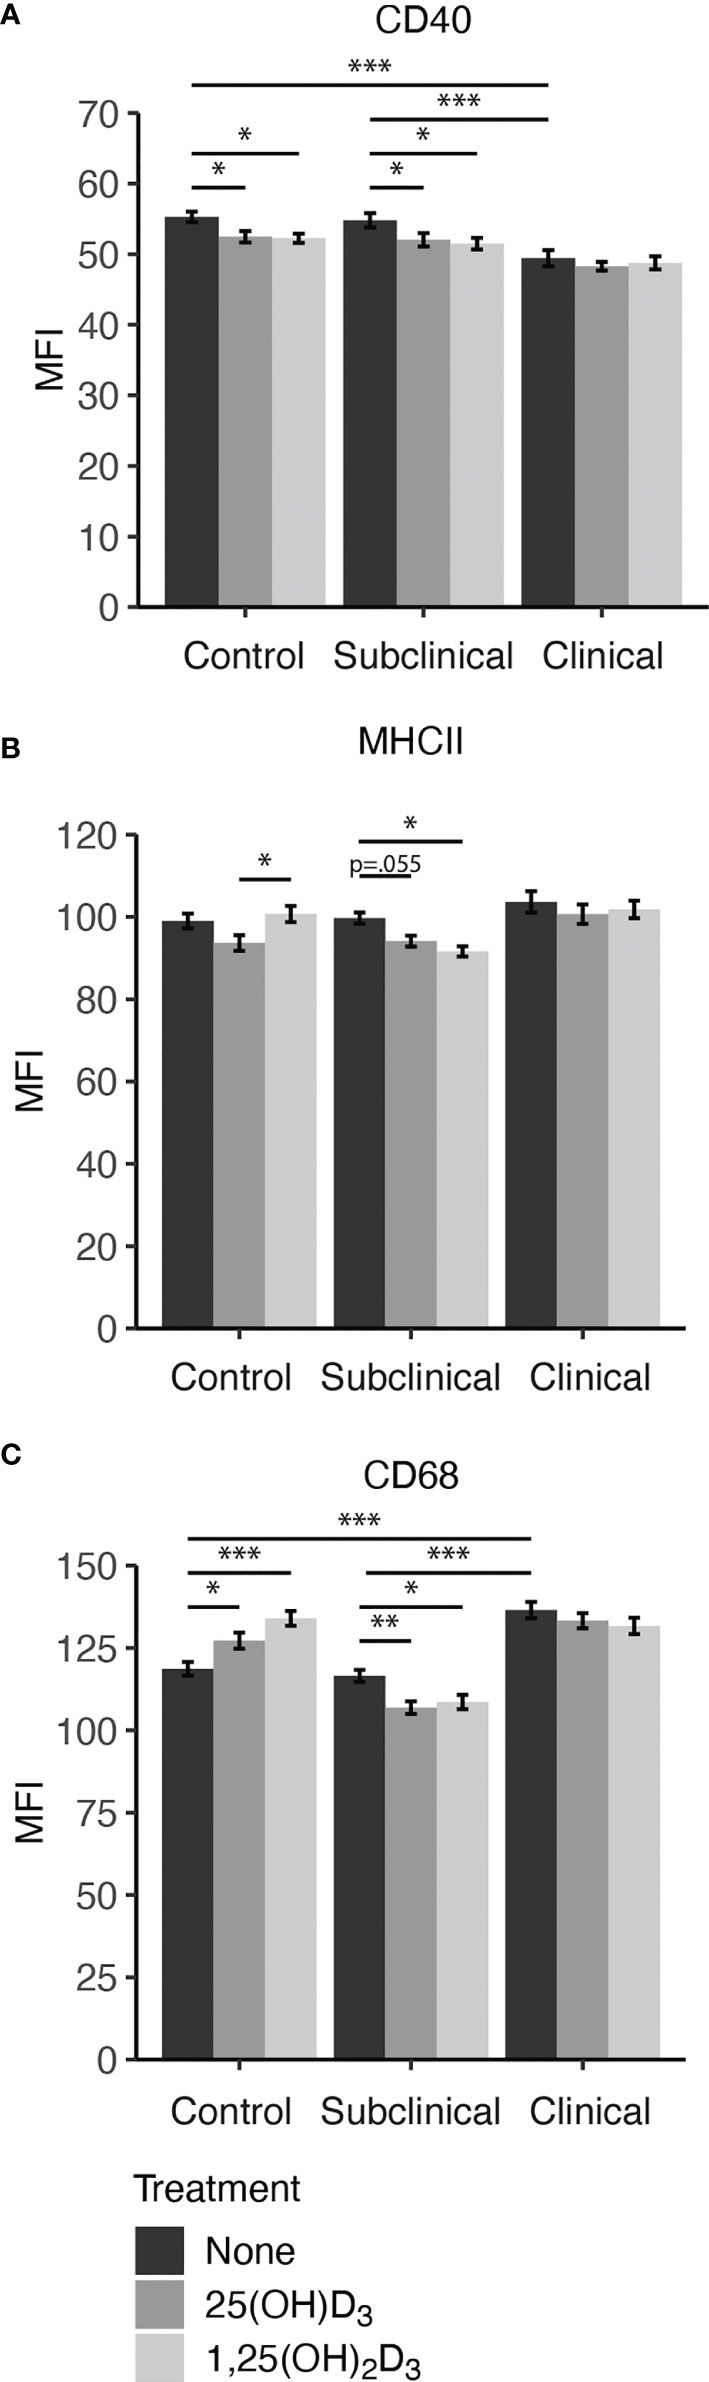
Figure 4 Macrophage expression of activation markers (A) CD40, (B) MHCII, and pan-macrophage marker (C) CD68. Peripheral blood mononuclear cells (PBMCs) were isolated from the whole blood of dairy cattle naturally infected with Mycobacterium avium subsp. paratuberculosis (MAP) (clinical n=7, subclinical n=8) or noninfected controls (n=6). Cells were cultured 5-6 days to generate monocyte-derived macrophages (MDMs), pre-treated with vitamin D3 as detailed in methods, then incubated 24 hrs with live MAP ± 25(OH)D3 or ± 1,25(OH)2D3. The mean fluorescence intensity (MFI) for each target was measured using marker specific primary antibodies coupled with an Alexa Fluor labeled secondary antibody (MHCII[AF488]; CD68[AF594]), or biotin labeled secondary and NeutrAvidin-DyLight 650 tertiary antibody (CD40). Data are presented as the MFI ± SE and significance levels are as follows: *< 0.05, **< 0.01, ***< 0.001.
Expression of MHCII (Figure 4B) was significantly decreased in subclinical cows upon treatment with 1,25(OH)2D3 (P < 0.05) or 25(OH)D3 (P = 0.055). Control cow MDMs treated with 25(OH)D3 had a significant reduction in marker expression compared to 1,25(OH)2D3 (P < 0.05) but was marginally less than untreated MDMs (P = 0.071). There was no observed difference between 1,25(OH)2D3 treatment and untreated control MDMs for this marker within the noninfected control cows. Addition of vitamin D3 did not elicit changes in MHCII expression for clinical cows.
Overall, clinical cows had higher (P < 0.001) expression of CD68 on untreated MDMs compared to both control and subclinical cows (Figure 4C). The inclusion of vitamin D3 induced notable changes, with significant increases observed in CD68 expression following treatment with 25(OH)D3 (P < 0.05) or 1,25(OH)2D3 (P < 0.001) in noninfected control cows. In contrast, cows naturally infected with MAP demonstrated lower CD68 expression upon treatment with vitamin D3. Within the MAP infected groups, only subclinical animals had a significant reduction in CD68 expression following treatment with 25(OH)D3 (P < 0.01) or 1,25(OH)2D3 (P < 0.05). Representative fluorescence images are presented in Figure 5 that show location of expression for each marker.
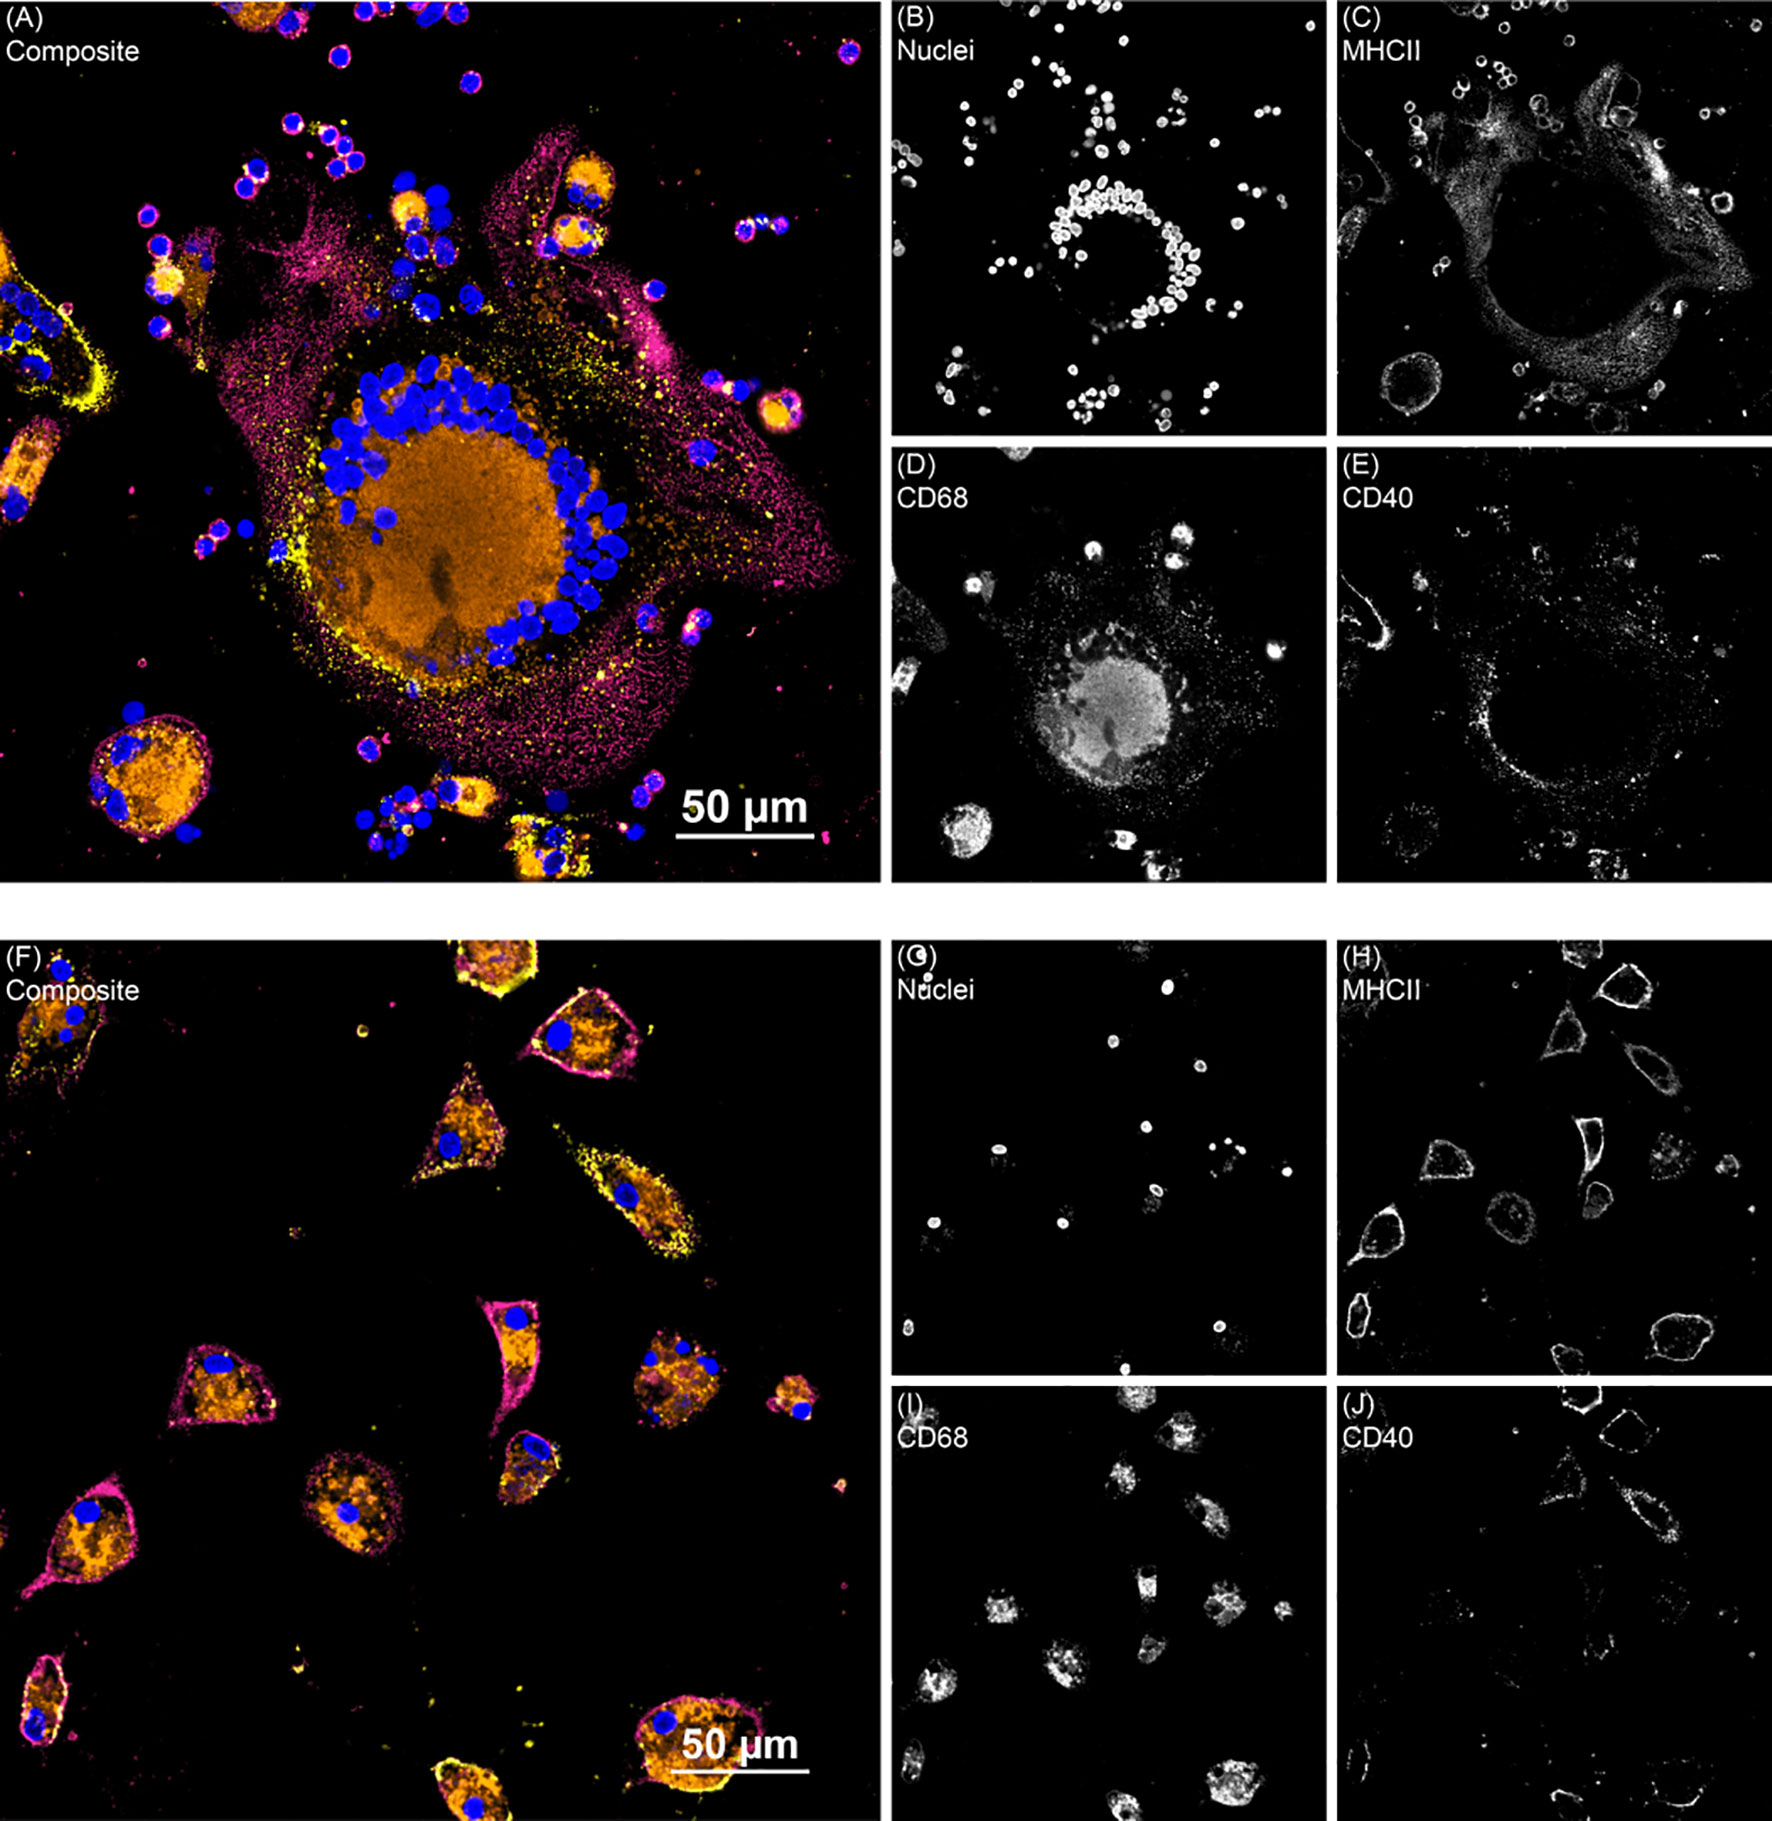
Figure 5 Two representative fluorescence images from the monocyte derived macrophage activation marker experiment. (A) Shows giant cell formation from a subclinical cow MDM sample treated with 25(OH)D3 and (F) shows clinical cow untreated MDMs. Composite images show all channels. (B, G) DAPI counterstain was used to detect nuclei (blue) and was excited on the 405 nm laser. (C, H) MHCII (magenta) was labeled with an AF488 secondary antibody and excited with the 488 nm laser. (D, I) CD68 (orange) was labeled with an AF594 secondary antibody and excited on the 561 nm laser. (E, J) CD40 (yellow) was labeled with a NeutrAvidin DyLight 650 tertiary antibody and excited on the 640 nm laser.
As an additional measure of MDM activation and function, nitrite production was measured in cell culture supernatants to indirectly assess iNOS activity (Figure 6). Cattle infected with MAP were shown to have significantly increased levels of nitrite after treatment with 1,25(OH)2D3 compared to 25(OH)D3 treated and untreated cells (subclinical, P < 0.01; clinical, (P < 0.05). Control cows followed this same trend, although treatment was not significant. There was no observable difference in any group treated with 25(OH)D3.
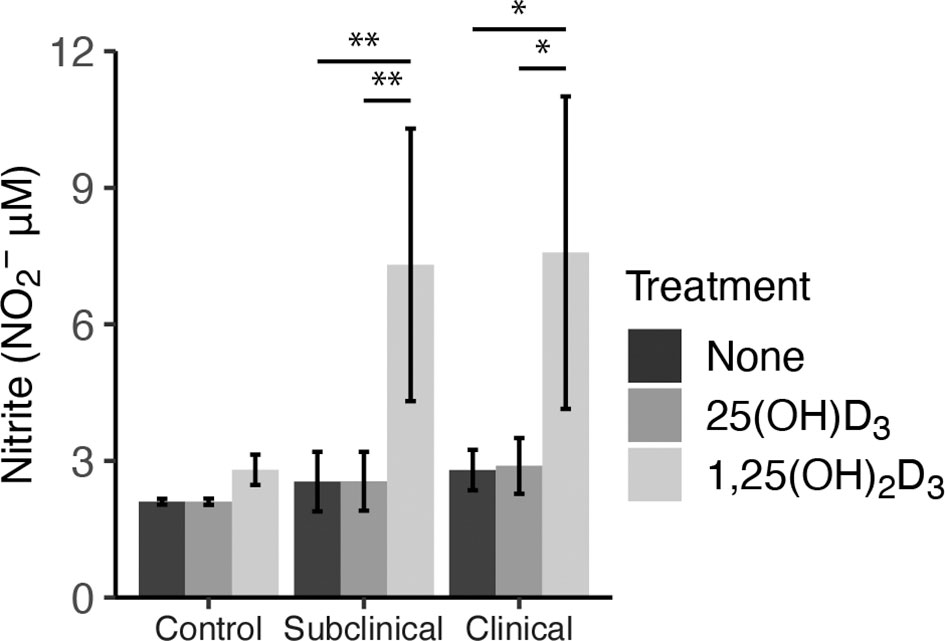
Figure 6 Nitrite production by monocyte-derived macrophages (MDMs) co-cultured with peripheral blood mononuclear cells (PBMCs) from naturally infected dairy cattle (clinical n=7, subclinical n=7) or noninfected controls (n=9). Peripheral blood mononuclear cells (PBMCs) isolated from whole blood were cultured 5-6 days to generate MDMs, pre-treated with vitamin D3 presented in methods, then incubated 24 hrs with live MAP (10:1 MOI) ± 25(OH)D3 or ± 1,25(OH)2D3. Nitrite concentrations were determined from cell culture supernatants by competitive binding of sulfanilamide and NED solutions in the Griess assay. Absorbance was measured at 540 nm on a SpectraMax microplate reader. Data are presented as the mean ± SE and significance is defined by *< 0.05, **< 0.01, ***< 0.001.
3.3 Cytokine Secretion
Secretion of cytokines in MDM culture supernatants was assessed after infection with live MAP for 24 hrs following pre-treatment with 25(OH)D3 for 24 hrs or 1,25(OH)2D3 for 4-6 hrs (Figure 7). A significant increase in IL-1β secretion was observed for control (P < 0.001), subclinical (P < 0.001), and clinical (P < 0.001) cows after addition of 1,25(OH)2D3 when compared to untreated MDMs or those treated with 25(OH)D3 (Figure 7A). A similar increase in each infection status group was observed for IL-12A secretion following addition of 1,25(OH)2D3 (Figure 7C; P < 0.01). Clinical animals produced the greatest amount of IL-12A, being significantly greater (P < 0.05) when compared to control cows and trending the same in subclinical cows (P = 0.15).
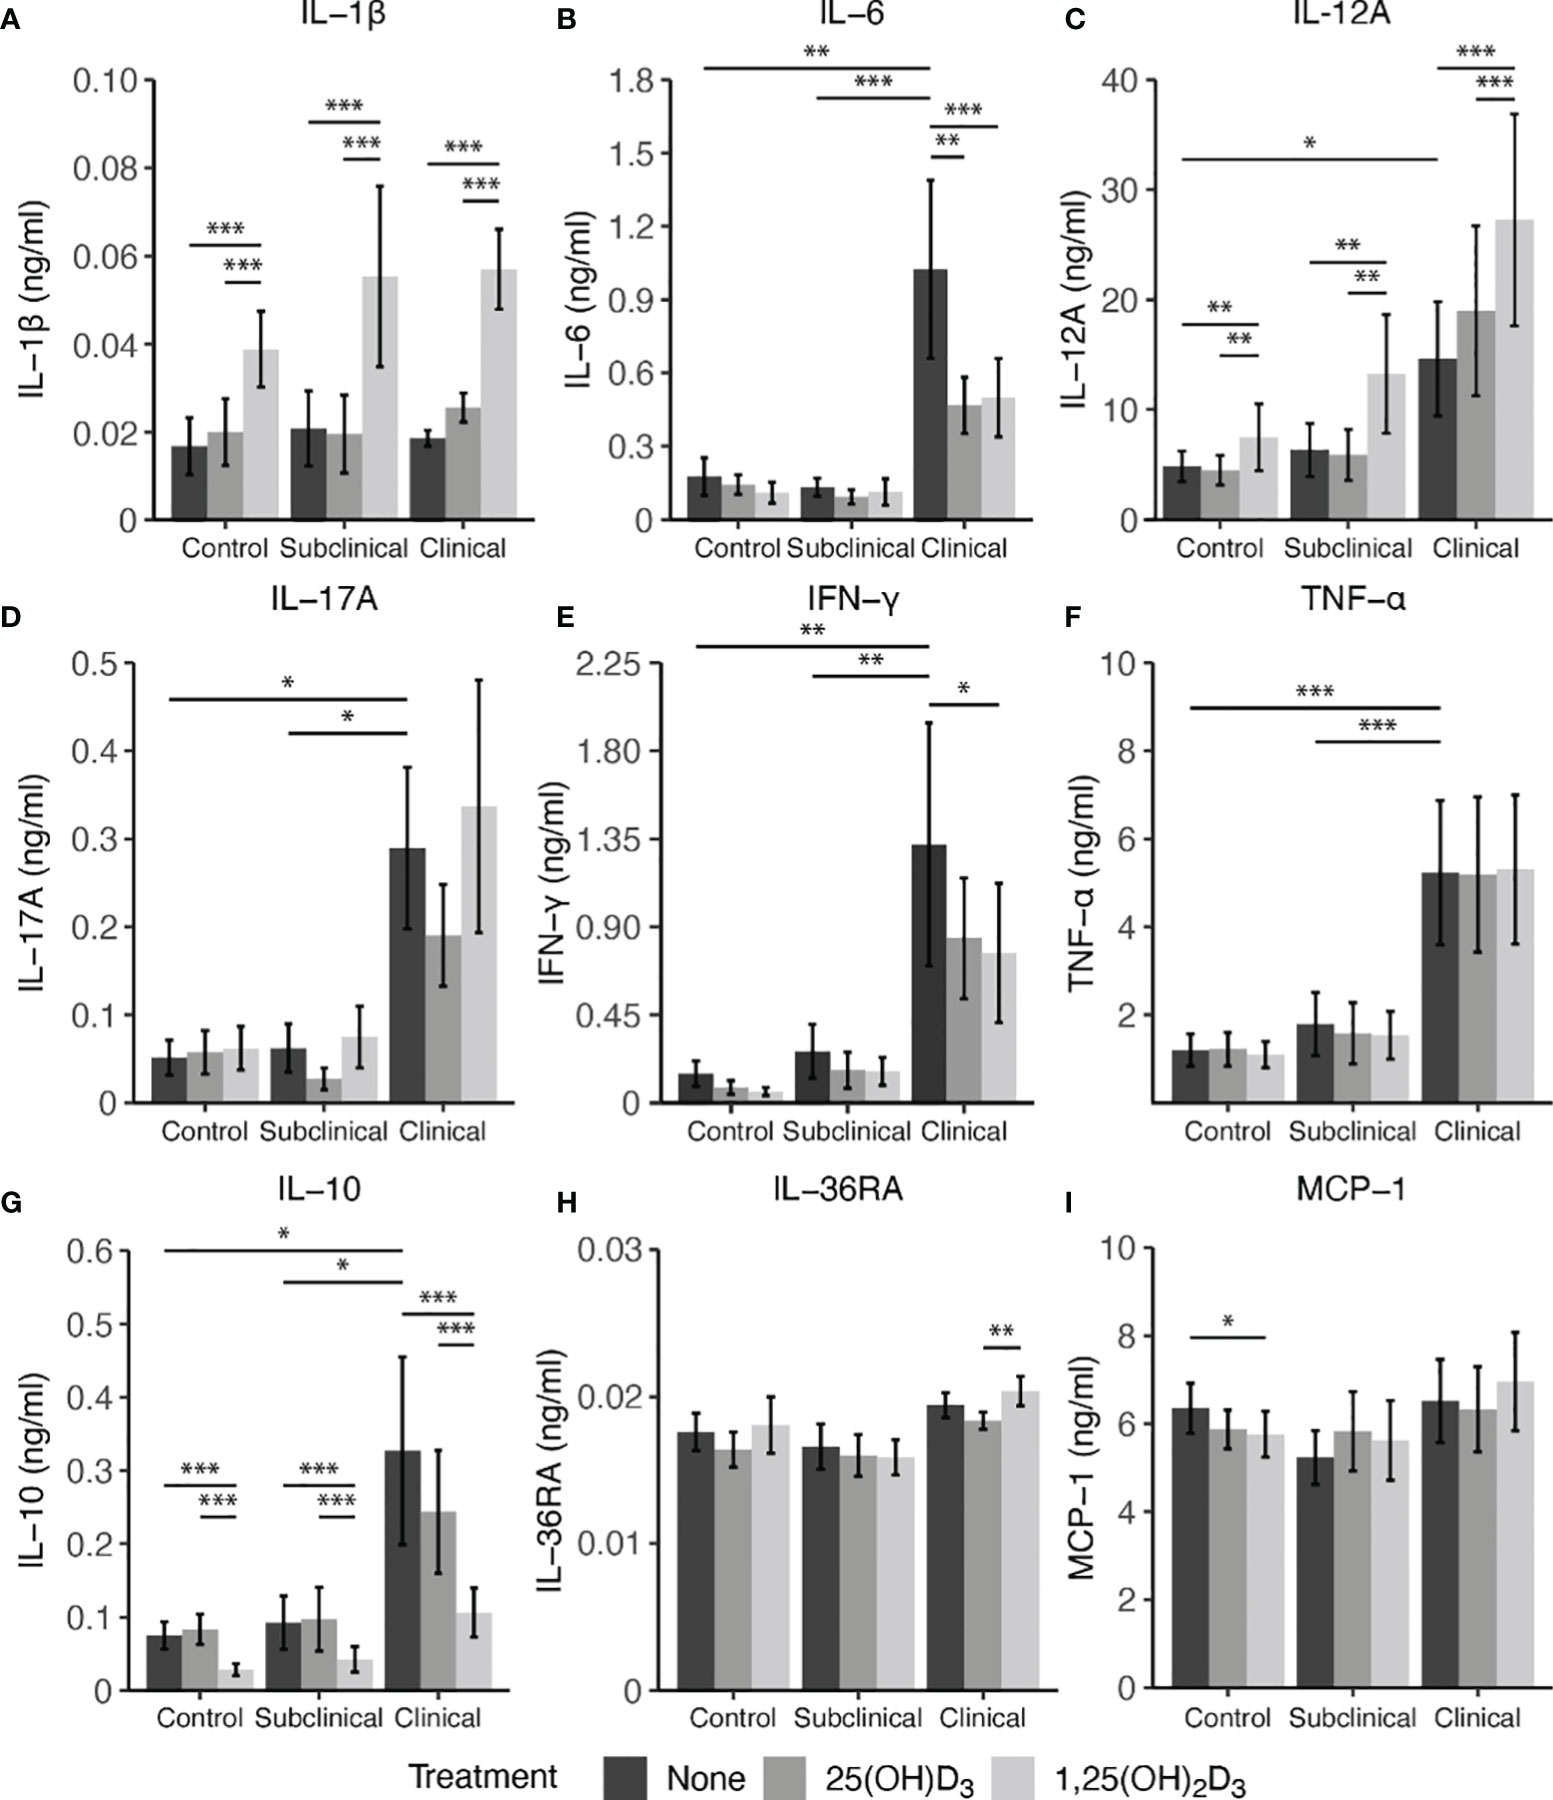
Figure 7 Cytokine expression from monocyte-derived macrophages (MDMs) co-cultured with peripheral blood mononuclear cells (PBMCs) from naturally infected dairy cattle (clinical n=7, subclinical n=7) or noninfected controls (n=9). PBMCs isolated from whole blood were cultured 5-6 days to generate MDMs, pre-treated with vitamin D3 as detailed in methods, then incubated 24 hrs with live MAP (10:1 MOI) ± 25(OH)D3 or ± 1,25(OH)2D3. Protein concentrations were determined from cell culture supernatants using Milliplex magnetic bead assay for (A) IL-1β, (B) IL-6, (D) IL-17A, (E) IFN-γ, (F) TNF-α, (G) IL-10, (H) IL-36RA, (I) MCP-1, while (C) IL-12A was measured using standard ELISA. Data are presented as the mean ± SE and significance levels are defined as * < 0.05, ** < 0.01, *** < 0.001.
In contrast, treatment of MDMs with 1,25(OH)2D3 resulted in a significant reduction in IL-10 secretion for both infected cows and noninfected controls (P < 0.001) when compared to 25(OH)D3 treated or untreated MDMs (Figure 7G). There was no difference between untreated and 25(OH)D3 treated cells. Levels of IL-10 were also found to be significantly higher (P < 0.05) in clinical animals compared to the subclinical and noninfected control groups.
Vitamin D3 treatment was also observed to have a significant impact on IL-6 secretion, but only in the clinical group (Figure 7B). Clinical cows had significantly higher levels of IL-6 compared to subclinically infected (P < 0.001) and healthy control cows (P < 0.01). Additionally, MDMs from clinical cows treated with either 25(OH)D3 or 1,25(OH)2D3 resulted in reduced IL-6 secretion (P < 0.01 and P < 0.001, respectively). IFN-γ production was also highest in clinical cows, being significantly different from both control and subclinical groups (Figure 7E; P < 0.01). Treatment with 1,25(OH)2D3 resulted in a significant reduction of IFN-γ production in clinical animals (P < 0.05). While no other notable vitamin D3 treatment effects were observed for other cytokines investigated (IL-17A, IL-36RA, MCP-1, and TNF-α), infection status did result in measurable differences, with clinical cows secreting higher levels of IL-17A (Figure 7D; P < 0.05) and TNF-α (Figure 7F; P < 0.001) compared to the subclinical and noninfected control groups.
3.4 Cytokine Gene Expression
Lastly, cytokine gene expression was investigated complementary to secreted protein levels and the resulting data are shown in Figure 8. Notable effects were seen in this experiment on expression of genes that control vitamin D hydroxylases upon vitamin D3 treatment of MDMs. Overall, infection status influenced expression of CYP24A1 (Figure 8K), also known as 24-hydroxylase, with an observable decrease in expression for clinical cows compared to controls (P = 0.12) and subclinical cows (P = 0.06). Additionally, with 1,25(OH)2D3 treatment a significant reduction in CYP24A1 expression in MDMs from control (P < 0.001), subclinical (P < 0.001), and clinical (P < 0.05) cows was noted. Similarly, 1α-hydroxylase (CYP27B1) gene transcripts were significantly reduced in control (P < 0.05) and subclinical (P < 0.05) cows with the addition of 1,25(OH)2D3 (Figure 8L). Clinical cows also followed this trend, but the reduction was not significant (P = 0.16). 25(OH)D3 treatment showed a modest reduction in CYP27B1 transcripts in control and subclinical cows.
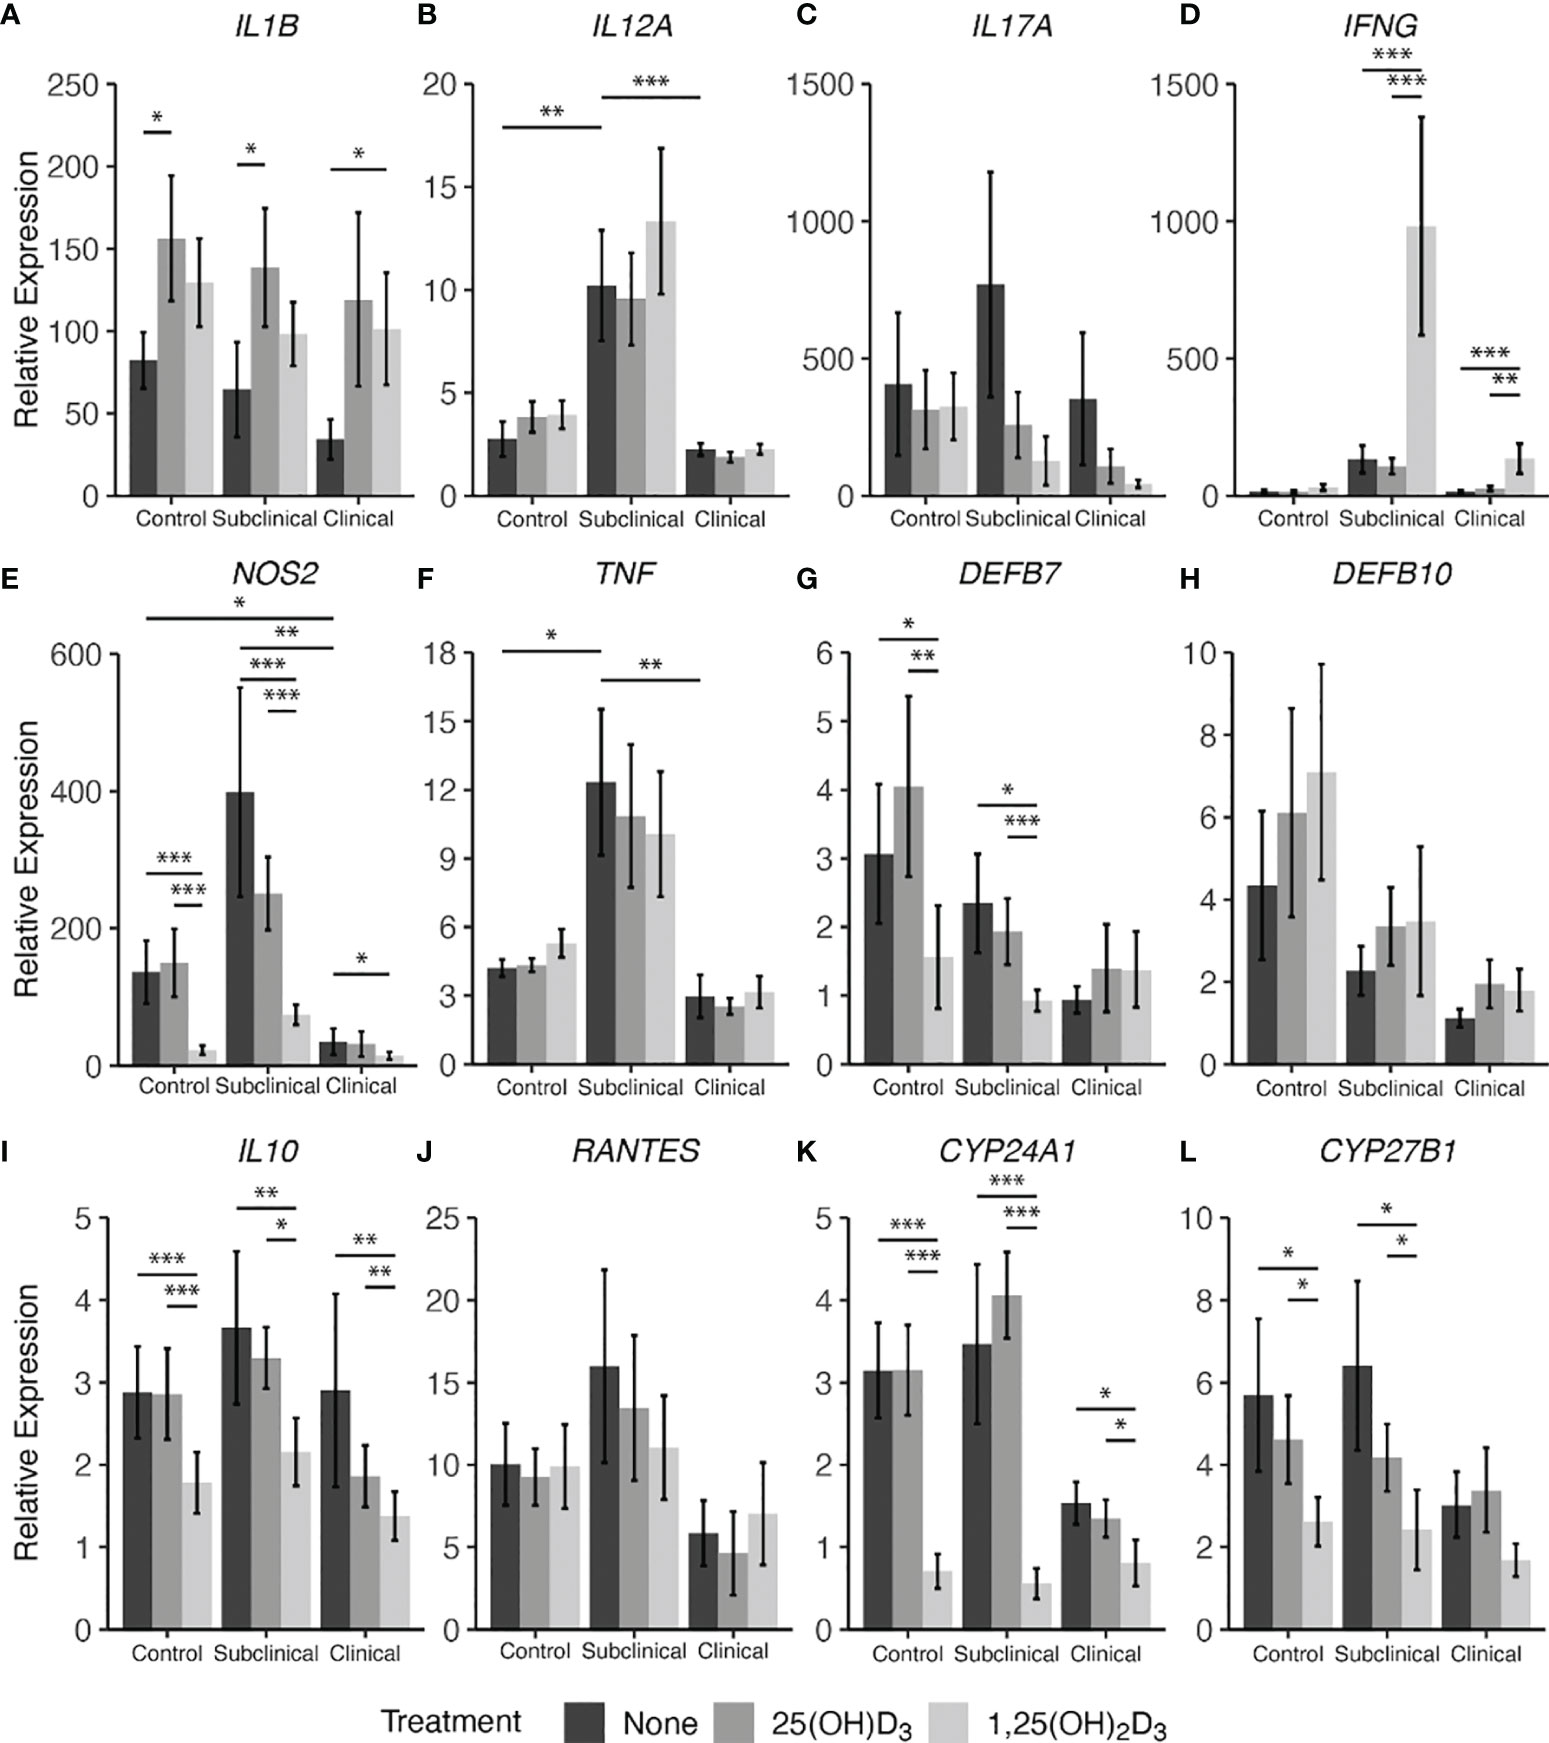
Figure 8 Cytokine gene expression from monocyte-derived macrophages (MDMs) co-cultured with peripheral blood mononuclear cells (PBMCs) from naturally infected dairy cattle (clinical n=7, subclinical n=7) or noninfected controls (n=9). PBMCs isolated from whole blood were cultured 5-6 days to generate MDMs, pre-treated with vitamin D3 as detailed in methods, then incubated 24 hrs with live MAP (10:1 MOI) ± 25(OH)D3 or ± 1,25(OH)2D3. Extraction and purification of RNA was performed using Qiagen RNeasy Mini kits and was reverse transcribed with Superscript IV. Gene expression for (A) IL1B, (B) IL12A, (C) IL17A, (D) IFNG, (E) NOS2, (F) TNF, (G) DEFB7, (H) DEFB10, (I) IL10, (J) RANTES, (K) CYP24A1, and (L) CYP27B1 were determined using TaqMan assays and was normalized to the eukaryotic 18S rRNA reference gene. Data were transformed using the 2-ΔΔCt method and are presented as the mean relative gene expression (RQ) ± SE compared to each sample’s respective non-stimulated (NS) control. Statistics were performed on ∆∆Ct values and significance levels are as follows: * < 0.05, ** < 0.01, *** < 0.001.
In parallel, 1,25(OH)2D3 treatment exhibited a downregulatory effect on β-defensin 7 (DEFB7) gene expression for control and subclinical cows compared to both untreated MDMs (Figure 8G; P < 0.05) and MDMs treated with 25(OH)D3 (P < 0.01 and P < 0.001, respectively). In contrast, treatment with vitamin D3 appeared to have an upregulatory effect on all infection status groups for β-defensin 10 gene DEFB10 (Figure 8H) and there was a gradual decrease in DEFB7 and DEFB10 transcripts with increasing disease severity, with clinical animals expressing the least amount of these gene transcripts; however, no comparisons were significant.
Key cytokine genes that were downregulated by treatment with 1,25(OH)2D3 were NOS2 (Figure 8E) and IL10 (Figure 8I), demonstrating a significant (P < 0.05 to P < 0.001) downregulation in all groups of cows. There were no significant differences between 25(OH)D3 treated and untreated MDM transcript levels for either of the two aforementioned cytokine genes in any group. Clinical cows were observed to have lower amounts of NOS2 expression compared to control (P < 0.05) and subclinical animals (P < 0.01). IL17A showed no significant differences among infection status or vitamin D3 treatment (Figure 8C).
IL-12A (IL12A; Figure 8B) and TNF-α (TNF; Figure 8F) genes were expressed at highest levels in subclinical cows, showing significant increases compared to control (P < 0.01 and P < 0.05) and clinical cows (P < 0.001 and P < 0.01, respectively). This same trend was also observed in IFN-γ (IFNG; Fig 8D) gene expression when compared to control (P = 0.06) and clinical cows (P = 0.12). The subclinical group also trended higher in RANTES (Figure 8J) expression compared to clinical animals (P = 0.14), but without significance.
Conversely, upregulation of cytokine gene transcripts was also seen for some targets after treatment with 1,25(OH)2D3. Significantly higher levels of IFNG were expressed in both groups of infected animals after treatment of MDMs with 1,25(OH)2D3 (P < 0.01 to P < 0.001), while 25(OH)D3 had no effect compared to untreated MDMs. Upregulation of IL-1β (IL1B; Figure 8A) was dependent upon the form of vitamin D3, with control and subclinical cows having increased expression of IL1B after treatment with 25(OH)D3 (P < 0.05), and clinically infected animals demonstrating significant upregulation following 1,25(OH)2D3 treatment (P < 0.05). Aggregating data for infected animals resulted in greater IL1B expression following 25(OH)D3 (P < 0.01) or 1,25(OH)2D3 (P = 0.051) treatment when compared to untreated cells.
4 Discussion
Animals at subclinical stages of MAP infection retain their ability to maintain Th1 pro-inflammatory cytokine responses that assist with bacterial destruction and clearance (Stabel, 2000; Jenvey et al., 2019). Clinically infected animals tend to be characterized by a predominantly Th2 response and this stage has prominent IL-10 secretion, which has negative regulatory effects upon pro-inflammatory responses (Hussain et al., 2016). These observations are speculated to be related to abrogation of T cell crosstalk with macrophages as a result of a persistently activated state and reduction of antigen presentation (Rathnaiah et al., 2017). Animals at this stage of disease also tend to develop MAP-specific antibodies that do not provide benefits of protection (Khalifeh and Stabel, 2004).
While vitamin D3 has its effects solidly established in human infectious disease, particularly M. tb (Crowle et al., 1987; Liu et al., 2007), interest in bovine vitamin D status and its effect on disease states has become a topic of interest in recent years. Using a bovine model for Respiratory Syncytial Virus (RSV), the addition of high levels of 25(OH)D3 to diets fed to calves increased pro-inflammatory cytokine production in lung lesions, but no lesion resolution outcomes were observed with this treatment (Sacco et al., 2012). Another study has observed protective effects of 25(OH)D3 in a dairy cattle mastitis model, with significant reductions in bacterial load and overall clinical symptoms following intramammary experimental challenge with Streptococcus uberis and concurrent 25(OH)D3 treatment (Lippolis et al., 2011). Little work has been done characterizing links between vitamin D3 status and vitamin D3 treatment on immune responses from cattle infected with MAP. Cows in the clinical stage of infection have been previously reported to have significantly reduced serum 25(OH)D3 levels, possibly due to inhibition of dietary vitamin D3 absorption from pathologic intestinal mucosal thickening (Stabel et al., 2019; Wherry et al., 2021).
Effects of vitamin D3 treatment on CYP gene expression from cows in different stages of paratuberculosis are novel data presented in this study and align similarly with previous work in healthy dairy cattle. Monocytes isolated for stimulation in vitro with LPS resulted in a decrease in the 25(OH)D3 converting enzyme 1α-hydroxylase (CYP27B1) mRNA expression following treatment with 25(OH)D3 or 1,25(OH)2D3 (Nelson et al., 2010b). Downregulation of CYP27B1 by 1,25(OH)2D3 was significantly different than LPS stimulation alone or coupled with 25(OH)D3 treatment, in agreement with observations made in the present study for treatment with either form of vitamin D3 following infection of MDMs with live MAP. These results may indicate that the presence of high levels of 1,25(OH)2D3 signal to the host cell that sufficient quantities are available for immune system utilization and more does not need to be converted from 25(OH)D3. Previous work in bovine tissue showed cows with clinical stage paratuberculosis had greater levels of CYP27B1 transcripts compared to subclinical cows, which may provide evidence of the immune system attempting to increase the amount of local 1,25(OH)2D3 available for immunomodulatory action (Stabel et al., 2019). However, the present study presented no significant differences in CYP27B1 expression between infection status groups. Furthermore, CYP24A1 is a hydroxylase that functions to regulate 1,25(OH)2D3 levels through its conversion to a biologically inactive form. The present study observed a significant reduction in expression of this hydroxylase in MDMs infected with live MAP and treated with 1,25(OH)2D3 for all infection status groups. A previous study utilizing a bovine monocyte model to investigate CYP24A1 expression following 1,25(OH)2D3 treatment showed significant upregulation, but following stimulation with LPS this increase in expression was significantly dampened. This may suggest that upon activation of the host cell during infection, 1,25(OH)2D3 may downregulate CYP24A1 inactivation of 1,25(OH)2D3 to keep active vitamin D3 concentrations high for other regulatory signaling events within the cell. Additionally, the trending decrease in CYP24A1 expression in clinical cows compared to control and subclinicals could be a compensatory mechanism to maintain adequate 1,25(OH)2D3 concentrations, and could be related to the previously mentioned reduction in 25(OH)D3 serum concentrations reported in clinical cows (Stabel et al., 2019; Wherry et al., 2021).
The present study investigated vitamin D3’s role in expression of β-defensins, which are frontline innate host antimicrobial peptides expressed in a wide variety of tissue including epithelial cells and immune cells (Meade et al., 2014). DEFB7 expression was found to be significantly decreased following 1,25(OH)2D3 treatment in control and subclinical cows, with clinical cows being unaffected. DEFB10 expression was not significantly different following treatment with either form of vitamin D3; however, a trend of decreasing expression with increasing disease severity was observed and infected animals generally had lower expression than healthy control animals (P = 0.168). These observations could indicate that DEFB10 expression does not contribute to mechanisms of control in MAP infection.
Further analysis of potential antimicrobial agents regulated by vitamin D3 showed increased nitrite production upon treatment of MAP infected MDMs with 1,25(OH)2D3 in the present study. This effect had previously been observed in PBMCs from healthy cattle stimulated with 100 ng/ml LPS (Nelson et al., 2010b), and PBMCs from cattle experimentally infected with M. bovis and stimulated in vitro with either M. bovis cell culture filtrate or M. bovis PPD (Waters et al., 2001). A recent study using a bovine monocyte derived macrophage model showed concurrent culture with 1,25(OH)2D3 and M. bovis at an MOI of 2:1 resulted in upregulation of nitric oxide production and NOS2 expression (García-Barragán et al., 2018). In comparison, the present study observed a similar 1,25(OH)2D3 dependent increase in nitric oxide production, but a disparate pattern of NOS2 expression was observed in which there was a significant decrease in all infection status groups following the same 1,25(OH)2D3 treatment. This might be explained by multiple factors, including co-culture with PBMCs, which would allow opportunities for MDM crosstalk with T cells. Additionally, the nature of the immune cell activating antigen in the present study was a whole, live mycobacterium rather than a soluble antigen, which perhaps employs mRNA expression or translational regulatory mechanisms that have not yet been investigated for MAP. Such mechanisms have been described for M. tb, which has been shown to exert alternative splicing events on GTPase Rab8B (RAB8B) transcripts in human MDMs resulting in ineffective, truncated transcripts that hinder endosomal trafficking and lysosomal maturation aiding in M. tb survival (Kalam et al., 2017).
IL-6 is known as a pleiotropic cytokine depending on the context of disease (Kishimoto, 2006) and its overproduction has been linked to inflammatory disease states. M. tb lipoarabinomannan (LAM) has been shown to induce IL-6 and TNF-α production in bovine monocytes (Adams and Czuprynski, 1994) and MAP-infected ileal tissue from cattle has higher IL-6 expression than ileal tissue from noninfected controls (Lee et al., 2001). In the present study, significantly higher IL-6 secretion was observed in clinical animals, but a reduction in IL-6 was noted following treatment with 25(OH)D3 or 1,25(OH)2D3. This is but one example of the diverse compensatory actions that vitamin D3 can elicit on the host immune system during infection.
IL-10 modulates pro-inflammatory cytokine responses to allow mycobacterial species to better survive within host cells (Weiss et al., 2005; Redford et al., 2010). The loss of inhibitory mechanisms on inflammation driven by IL-10 from regulatory T cells (Tregs) allows for increased production of pro-inflammatory IL-1β and IL-12 by activated macrophages in the presence of antigenic stimuli (Weiss et al., 2005; Ma et al., 2015; Ipseiz et al., 2020), promoting a Th1-like response. A consistent downregulation of IL-10 gene and protein expression after exposure of MDMs to live MAP and 1,25(OH)2D3 was observed herein, effects that are contradictory to a previous study showing IL-10 cytokine production increases in human monocyte-derived macrophages infected with M. tb following 1,25(OH)2D3 treatment (Eklund et al., 2013). Interestingly, the downregulation of IL-10 mRNA and protein levels could partially explain the observed increase in dead MAP in clinical cows treated with 1,25(OH)2D3 from the BacLight viability experiment and may be linked to the upregulation of pro-inflammatory cytokines observed in this study. IL-1β is secreted by monocytes, macrophages, and dendritic cells (Fields et al., 2019) and is recognized as playing a key role in mediating control of M. tb infection in humans (Mayer-Barber et al., 2010). It is also expressed at higher levels in tissue from cattle infected with MAP (Lee et al., 2001). Additional work has shown that 1,25(OH)2D3 treatment of LPS activated bovine monocytes increased IL1B mRNA expression (Nelson et al., 2010b), an effect that also aligned with our findings for both mRNA transcripts and protein levels. Complementary findings in 1,25(OH)2D3 treated human MDMs infected with M. tb also show significant upregulation of IL-1β secretion in cell culture supernatants (Eklund et al., 2013). Additional pro-inflammatory responses following 1,25(OH)2D3 treatment include increased IFNG expression in subclinical and clinical cow cell cultures, although trends for IFN-γ protein expression were inconsistent with this pattern. Elevated IFNG gene expression in the tissue of clinical cows compared to subclinically infected and noninfected controls has been observed, indicating clinical animals may be in a pro-inflammatory state (Stabel et al., 2019). While the present study showed no significant differences for IFNG expression in MDM cultures between infection status groups, patterns of IFN-γ concentrations were similar to the observations made by Stabel et al. (2019) for IFNG transcript levels, being significantly greater in clinical animals.
Furthermore, the fluorescence-based viability assay (BacLight) in the present study demonstrated a significant increase in live, dead, and total MAP present within MDMs from clinically infected cows following in vitro treatment with exogenous 1,25(OH)2D3 or 25(OH)D3. Previous work has shown the ability of 1,25(OH)2D3 to modulate immune responses resulting in a reduction of M. tb CFU within human MDMs after pre-treatment of cells with 4 μg/ml for 24 hrs, followed by M. tb infection accompanied by a second pulse with 1,25(OH)2D3 (Crowle et al., 1987). This treatment was the highest concentration tested and also conferred the most protection, which became more evident on day 4 when intracellular CFU of M. tb began to decrease, which was speculated to be a result of either killing of M. tb by the host phagocyte or inhibition of bacilli replication. More recent work has shown that vitamin D can activate antimicrobial activity in both human monocytes and macrophages through the induction of cathelicidin following TLR2/1 heterodimer activation (Liu et al., 2006; Liu et al., 2007). Phagocytic capacity has also been shown to increase in macrophages treated with 1,25(OH)2D3, perhaps through upregulation of complement receptor immunoglobulin (CRIg) (Small et al., 2021). This mechanism could support the finding in our study showing a significant increase in total MAP uptake for clinical animals, as other recent reports have described CRIg functioning as a pattern recognition receptor (PRR) for gram-negative bacteria and parasites (Zeng et al., 2016; Liu et al., 2019).
Granulomatous tissue lesions in cattle infected with M. bovis have been shown to have a greater number of CD68+ cells associated with inflammation (Wangoo et al., 2005), as well as ileal tissue from cattle naturally infected with MAP (Lee et al., 2001). In the present study, clinical animals showed a positive correlation between the total number of MAP phagocytized and CD68 expressed on untreated MDMs. This observation may be partially explained by previous reports that have shown CD68 expression is mainly localized to lysosomal and endosomal compartments within the macrophage (Holness and Simmons, 1993). While vitamin D3 treatments did not result in a correlative change between CD68 expression and phagocytosis of MAP, it is likely other cell surface receptors not investigated in this study assist in modulating this process. The current study further investigated markers of activation, represented by CD40 and MHCII, expressed on CD68+ MDMs. The CD40/CD40L signaling pathway is important in the modulation of Th1 cytokine responses (McDyer et al., 1998). The significant decrease in CD40 expression on MDMs from clinical cows is interesting and may indicate that as MAP infection progresses, macrophages play a lesser role in the induction of some key T cell mediated pro-inflammatory responses. Previous work in MAP infected cattle showed high levels of CD40 expression on CD4+ T cells, with expression also being seen on B cells, CD8+ T cells, and γδ T cells (Khalifeh and Stabel, 2013). Work in a murine model show the capacity of CD40 to serve as a co-stimulatory molecule in T cell activation and cytokine signaling (Munroe and Bishop, 2007). Other studies investigating dendritic cells in humans have shown 1,25(OH)2D3 decreases expression of CD40 and MHCII at a concentration of about 4 ng/ml (Wahono et al., 2014), consistent with the observations in this study although downregulation of MHCII was significant only in the subclinical group while expression in the clinical group trended downward. Other work in humans and cattle also showed 1,25(OH)2D3 downregulation of MHCII expression in monocytes and monocyte-derived dendritic cells, respectively (Xu et al., 1993; Corripio-Miyar et al., 2017).
Taken together, the data herein show a complex pro- and anti-inflammatory dynamic for vitamin D3 treatment of monocyte derived macrophages in the presence of PBMCs. As previously mentioned, prior work done by our group has shown clinical animals to possess significantly lower levels of circulating 25(OH)D3 (Stabel et al., 2019; Wherry et al., 2021) and while a critical threshold has not been defined for vitamin D3 deficiency and insufficiency, it is plausible for this observation to be correlated with the general pro-inflammatory cytokine profile observed in this infection status group. In the current study, 1,25(OH)2D3 appeared to be the main form of vitamin D3 that modulated significant cytokine responses and nitrite production, and its treatment appeared to elicit similar responses among all infection status groups within each marker. However, clinical animals were shown to increase their phagocytic capacity, resulting in a significantly greater proportion of dead MAP bacilli. Macrophage activation markers CD40 and MHCII were not significantly downregulated in clinical cows, contrary to control and subclinical cows, perhaps contributing to this observation in decreased intracellular MAP viability. Complementary to these results, clinically infected cows overall had a more robust pro-inflammatory cytokine profile, as previously mentioned, exhibiting significantly higher secretion of IL-6, IL-12A, IL-17A, IFN-γ, and TNF-α. Upregulation of some pro-inflammatory cytokines (IL-1β, IL-12A) and increases in iNOS activity through higher levels of nitrite following 1,25(OH)2D3 may also partially explain the increased capacity of macrophages from clinical cows to control intracellular MAP infection.
Further investigation of the multifaceted host-pathogen interactions during different stages of MAP infection and the potential role of vitamin D3 in controlling dissemination of MAP could lead to a better understanding of the timing of events that allow for progression of disease. More studies are needed to identify specific key events within the complex interplay of cytokine signaling that hinder host clearance of MAP and what role each form of vitamin D3 plays in mitigation of these host responses.
Data Availability Statement
The original contributions presented in the study are included in the article/supplementary material. Further inquiries can be directed to the corresponding author.
Ethics Statement
The animal study was reviewed and approved by NADC Animal Care and Use Committee.
Author Contributions
Experimental design was conceived by JS, TW, and RD. Experiments were performed by TW. Data analysis was performed by TW and EC. First draft manuscript was prepared by TW. JS, TW, RD, EC, JB, and SM contributed to manuscript revisions. All authors contributed to the article and approved the submitted version.
Funding
This study was funded through USDA-ARS, CRIS Project 5030-32000-221.
Conflict of Interest
The authors declare that the research was conducted in the absence of any commercial or financial relationships that could be construed as a potential conflict of interest.
Publisher’s Note
All claims expressed in this article are solely those of the authors and do not necessarily represent those of their affiliated organizations, or those of the publisher, the editors and the reviewers. Any product that may be evaluated in this article, or claim that may be made by its manufacturer, is not guaranteed or endorsed by the publisher.
Acknowledgments
We thank Adrienne Shircliff (National Animal Disease Center Histology and Microscopy Services Unit) and Amy Turner for their technical expertise and assistance in processing samples, as well as Paul Amundson, Sydney Christen, and the rest of the animal caretaker staff for their support during sample collection.
Footnotes
- ^ Wherry, T. L. T., Mooyottu, S., and Stabel, J. R. (2021). Effects of 1,25-dihydroxyvitamin D3 and 25-hydroxyvitamin D3 on PBMCs From Dairy Cattle Naturally Infected With Mycobacterium avium ssp. Paratuberculosis. Submitted for publication.
References
Adams, J. L., Czuprynski, C. J. (1994). Mycobacterial Cell Wall Components Induce the Production of TNF-α, IL-1, and IL-6 by Bovine Monocytes and the Murine Macrophage Cell Line RAW 264.7. Microb. Pathog. 16, 401–411. doi: 10.1006/mpat.1994.1040
Adams, J. S., Sharma, O. P., Gacad, M. A., Singer, F. R. (1983). Metabolism of 25-Hydroxyvitamin D3 by Cultured Pulmonary Alveolar Macrophages in Sarcoidosis. J. Clin. Invest. 72, 1856–1860. doi: 10.1172/JCI111147
Allen, S., Sotos, J., Sylte, M. J., Czuprynski, C. J. (2001). Use of Hoechst 33342 Staining to Detect Apoptotic Changes in Bovine Mononuclear Phagocytes Infected With Mycobacterium Avium Subsp. Paratuberculosis. Clin. Diagn. Lab. Immunol. 8, 460–464. doi: 10.1128/CDLI.8.2.460-464.2001
Arsenault, R. J., Li, Y., Bell, K., Doig, K., Potter, A., Griebel, P. J., et al. (2012). Mycobacterium Avium Subsp. Paratuberculosis Inhibits Gamma Interferon-Induced Signaling in Bovine Monocytes: Insights Into the Cellular Mechanisms of Johne’s Disease. Infect. Immun. 80, 3039–3048. doi: 10.1128/IAI.00406-12
Arsenault, R. J., Li, Y., Maattanen, P., Scruten, E., Doig, K., Potter, A., et al. (2013). Altered Toll-Like Receptor 9 Signaling in Mycobacterium Avium Subsp. Paratuberculosis-Infected Bovine Monocytes Reveals Potential Therapeutic Targets. Infect. Immun. 81, 226–237. doi: 10.1128/IAI.00785-12
Bafica, A., Scanga, C. A., Feng, C. G., Leifer, C., Cheever, A., Sher, A. (2005). TLR9 Regulates Th1 Responses and Cooperates With TLR2 in Mediating Optimal Resistance to Mycobacterium Tuberculosis. J. Exp. Med. 202, 1715–1724. doi: 10.1084/jem.20051782
Benoit, M., Desnues, B., Mege, J.-L. (2008). Macrophage Polarization in Bacterial Infections. J. Immunol. 181, 3733–3739. doi: 10.4049/jimmunol.181.6.3733
Bhide, M. R., Mucha, R., Mikula, I., Kisova, L., Skrabana, R., Novak, M., et al. (2009). Novel Mutations in TLR Genes Cause Hyporesponsiveness to Mycobacterium Avium Subsp. Paratuberculosis Infection. BMC Genet. 10:21. doi: 10.1186/1471-2156-10-21
Bradner, L., Robbe-Austerman, S., Beitz, D. C., Stabel, J. R. (2013). Chemical Decontamination With N-Acetyl-L-Cysteine–Sodium Hydroxide Improves Recovery of Viable Mycobacterium Avium Subsp. Paratuberculosis Organisms From Cultured Milk. J. Clin. Microbiol. 51, 2139–2146. doi: 10.1128/JCM.00508-13
Chiang, S.-K., Sommer, S., Aho, A. D., Kiupel, M., Colvin, C., Tooker, B., et al. (2007). Relationship Between Mycobacterium Avium Subspecies Paratuberculosis, IL-1α, and TRAF1 in Primary Bovine Monocyte-Derived Macrophages. Vet. Immunol. Immunopathol. 116, 131–144. doi: 10.1016/j.vetimm.2007.01.005
Corripio-Miyar, Y., Mellanby, R. J., Morrison, K., McNeilly, T. N. (2017). 1,25-Dihydroxyvitamin D3 Modulates the Phenotype and Function of Monocyte Derived Dendritic Cells in Cattle. BMC Vet. Res. 13, 390. doi: 10.1186/s12917-017-1309-8
Crowle, A. J., Ross, E. J., May, M. H. (1987). Inhibition by 1,25(OH)2-Vitamin D3 of the Multiplication of Virulent Tubercle Bacilli in Cultured Human Macrophages. Infect. Immun. 55, 2945–2950. doi: 10.1128/iai.55.12.2945-2950.1987
Eklund, D., Persson, H. L., Larsson, M., Welin, A., Idh, J., Paues, J., et al. (2013). Vitamin D Enhances IL-1β Secretion and Restricts Growth of Mycobacterium Tuberculosis in Macrophages From TB Patients. Int. J. Mycobacteriol 2, 18–25. doi: 10.1016/j.ijmyco.2012.11.001
Elgueta, R., Benson, M. J., de Vries, V. C., Wasiuk, A., Guo, Y., Noelle, R. J. (2009). Molecular Mechanism and Function of CD40/CD40L Engagement in the Immune System. Immunol. Rev. 229, 152–172. doi: 10.1111/j.1600-065X.2009.00782.x
Fields, J. K., Günther, S., Sundberg, E. J. (2019). Structural Basis of IL-1 Family Cytokine Signaling. Front. Immunol. 10, 1412. doi: 10.3389/fimmu.2019.01412
García-Barragán, Á., Gutiérrez-Pabello, J. A., Alfonseca-Silva, E. (2018). Calcitriol Increases Nitric Oxide Production and Modulates Microbicidal Capacity Against Mycobacterium Bovis in Bovine Macrophages. Comp. Immunol. Microbiol. Infect. Dis. 59, 17–23. doi: 10.1016/j.cimid.2018.09.001
Holness, C. L., Simmons, D. L. (1993). Molecular Cloning of CD68, a Human Macrophage Marker Related to Lysosomal Glycoproteins. Blood 81, 1607–1613. doi: 10.1182/blood.V81.6.1607.1607
Horst, R. L., Littledike, E. T., Riley, J. L., Napoli, J. L. (1981). Quantitation of Vitamin D and Its Metabolites and Their Plasma Concentrations in Five Species of Animals. Anal. Biochem. 116, 189–203. doi: 10.1016/0003-2697(81)90344-4
Hostetter, J. M., Steadham, E., Haynes, J. S., Bailey, T., Cheville, N. (2003). Phagosomal Maturation and Intracellular Survival of Mycobacterium Avium Subspecies Paratuberculosis in J774 Cells. Comp. Immunol. Microbiol. Infect. Dis. 26, 269–283. doi: 10.1016/S0147-9571(02)00070-X
Hussain, T., Shah, S. Z. A., Zhao, D., Sreevatsan, S., Zhou, X. (2016). The Role of IL-10 in Mycobacterium Avium Subsp. Paratuberculosis. Cell Commun. Signal. 14:29. doi: 10.1186/s12964-016-0152-z
Ipseiz, N., Pickering, R. J., Rosas, M., Tyrrell, V. J., Davies, L. C., Orr, S. J., et al. (2020). Tissue-Resident Macrophages Actively Suppress IL-1beta Release via a Reactive Prostanoid/IL-10 Pathway. EMBO J. 39, e103454. doi: 10.15252/embj.2019103454
Jenvey, C. J., Shircliff, A. L., Bannantine, J. P., Stabel, J. R. (2019). Phenotypes of Macrophages Present in the Intestine Are Impacted by Stage of Disease in Cattle Naturally Infected With Mycobacterium Avium Subsp. Paratuberculosis. PloS One 14, e0217649. doi: 10.1371/journal.pone.0217649
Jin, M. S., Kim, S. E., Heo, J. Y., Lee, M. E., Kim, H. M., Paik, S.-G., et al. (2007). Crystal Structure of the TLR1-TLR2 Heterodimer Induced by Binding of a Tri-Acylated Lipopeptide. Cell 130, 1071–1082. doi: 10.1016/j.cell.2007.09.008
Jones, G. (2008). Pharmacokinetics of Vitamin D Toxicity. Am. J. Clin. Nutr. 88, 582S–586S. doi: 10.1093/ajcn/88.2.582S
Kabara, E., Coussens, P. M. (2012). Infection of Primary Bovine Macrophages With Mycobacterium Avium Subspecies Paratuberculosis Suppresses Host Cell Apoptosis. Front. Microbiol. 3, 215. doi: 10.3389/fmicb.2012.00215
Kalam, H., Fontana, M. F., Kumar, D. (2017). Alternate Splicing of Transcripts Shape Macrophage Response to Mycobacterium Tuberculosis Infection. PloS Pathog. 13, e1006236. doi: 10.1371/journal.ppat.1006236
Kang, J. Y., Nan, X., Jin, M. S., Youn, S.-J., Ryu, Y. H., Mah, S., et al. (2009). Recognition of Lipopeptide Patterns by Toll-Like Receptor 2-Toll-Like Receptor 6 Heterodimer. Immunity 31, 873–884. doi: 10.1016/j.immuni.2009.09.018
Khalifeh, M. S., Stabel, J. R. (2004). Upregulation of Transforming Growth Factor-Beta and Interleukin-10 in Cows With Clinical Johne’s Disease. Vet. Immunol. Immunopathol. 99, 39–46. doi: 10.1016/j.vetimm.2004.01.009
Khalifeh, M. S., Stabel, J. R. (2013). Clinical Disease Upregulates Expression of CD40 and CD40 Ligand on Peripheral Blood Mononuclear Cells From Cattle Naturally Infected With Mycobacterium Avium Subsp. Paratuberculosis. Clin. Vaccine Immunol. 20, 1274–1282. doi: 10.1128/CVI.00246-13
Khare, S., Drake, K. L., Lawhon, S. D., Nunes, J. E. S., Figueiredo, J. F., Rossetti, C. A., et al. (2016). Systems Analysis of Early Host Gene Expression Provides Clues for Transient Mycobacterium Avium Ssp Avium vs. Persistent Mycobacterium Avium Ssp Paratuberculosis Intestinal Infections. PloS One 11, e0161946. doi: 10.1371/journal.pone.0161946
Kishimoto, T. (2006). Interleukin-6: Discovery of a Pleiotropic Cytokine. Arthritis Res. Ther. 8, S2. doi: 10.1186/ar1916
Lee, H., Stabel, J. R., Kehrli, M. E. (2001). Cytokine Gene Expression in Ileal Tissues of Cattle Infected With Mycobacterium Paratuberculosis. Vet. Immunol. Immunopathol. 82, 73–85. doi: 10.1016/S0165-2427(01)00340-3
Lenth, R. (2021). Emmeans: Estimated Marginal Means, Aka Least-Squares Means. Available at: https://CRAN.R-project.org/package=emmeans.
Lippolis, J. D., Reinhardt, T. A., Sacco, R. A., Nonnecke, B. J., Nelson, C. D. (2011). Treatment of an Intramammary Bacterial Infection With 25-Hydroxyvitamin D3. PloS One 6, e25479. doi: 10.1371/journal.pone.0025479
Liu, G., Fu, Y., Yosri, M., Chen, Y., Sun, P., Xu, J., et al. (2019). CRIg Plays an Essential Role in Intravascular Clearance of Bloodborne Parasites by Interacting With Complement. Proc. Natl. Acad. Sci. 116, 24214–24220. doi: 10.1073/pnas.1913443116
Liu, P. T., Stenger, S., Li, H., Wenzel, L., Tan, B. H., Krutzik, S. R., et al. (2006). Toll-Like Receptor Triggering of a Vitamin D-Mediated Human Antimicrobial Response. Science 311, 1770–1773. doi: 10.1126/science.1123933
Liu, P. T., Stenger, S., Tang, D. H., Modlin, R. L. (2007). Cutting Edge: Vitamin D-Mediated Human Antimicrobial Activity Against Mycobacterium Tuberculosis Is Dependent on the Induction of Cathelicidin. J. Immunol. 179, 2060–2063. doi: 10.4049/jimmunol.179.4.2060
Livak, K. J., Schmittgen, T. D. (2001). Analysis of Relative Gene Expression Data Using Real-Time Quantitative PCR and the 2–ΔΔct Method. Methods 25, 402–408. doi: 10.1006/meth.2001.1262
Manning, E. J., Collins, M. T. (2001). Mycobacterium Avium Subsp. Paratuberculosis: Pathogen, Pathogenesis and Diagnosis. Rev. Sci. Tech. Int. Off. Epizoot. 20, 133–150. doi: 10.20506/rst.20.1.1275
Ma, X., Yan, W., Zheng, H., Du, Q., Zhang, L., Ban, Y., et al. (2015). Regulation of IL-10 and IL-12 Production and Function in Macrophages and Dendritic Cells. F1000Research 4, F1000 Faculty Rev–1465. doi: 10.12688/f1000research.7010.1
Mayer-Barber, K. D., Barber, D. L., Shenderov, K., White, S. D., Wilson, M. S., Cheever, A., et al. (2010). Cutting Edge: Caspase-1 Independent IL-1β Production Is Critical for Host Resistance to Mycobacterium Tuberculosis and Does Not Require TLR Signaling In Vivo. J. Immunol. Baltim. Md 1950 184, 3326–3330. doi: 10.4049/jimmunol.0904189
McDyer, J. F., Goletz, T. J., Thomas, E., June, C. H., Seder, R. A. (1998). CD40 Ligand/CD40 Stimulation Regulates the Production of IFN-γ From Human Peripheral Blood Mononuclear Cells in an IL-12- and/or CD28-Dependent Manner. J. Immunol. Baltim. Md 1950 160, 1701–1707.
Meade, K. G., Cormican, P., Narciandi, F., Lloyd, A., O’Farrelly, C. (2014). Bovine β-Defensin Gene Family: Opportunities to Improve Animal Health? Physiol. Genomics 46, 17–28. doi: 10.1152/physiolgenomics.00085.2013
Mucha, R., Bhide, M. R., Chakurkar, E. B., Novak, M., Mikula, I. (2009). Toll-Like Receptors TLR1, TLR2 and TLR4 Gene Mutations and Natural Resistance to Mycobacterium Avium Subsp. Paratuberculosis Infection in Cattle. Vet. Immunol. Immunopathol. 128, 381–388. doi: 10.1016/j.vetimm.2008.12.007
Munroe, M. E., Bishop, G. A. (2007). A Costimulatory Function for T Cell CD40. J. Immunol. 178, 671–682. doi: 10.4049/jimmunol.178.2.671
Murphy, J. T., Sommer, S., Kabara, E. A., Verman, N., Kuelbs, M. A., Saama, P., et al. (2006). Gene Expression Profiling of Monocyte-Derived Macrophages Following Infection With Mycobacterium Avium Subspecies Avium and Mycobacterium Avium Subspecies Paratuberculosis. Physiol. Genomics 28, 67–75. doi: 10.1152/physiolgenomics.00098.2006
Nelson, C. D., Nonnecke, B. J., Reinhardt, T. A., Waters, W. R., Beitz, D. C., Lippolis, J. D. (2011). Regulation of Mycobacterium-Specific Mononuclear Cell Responses by 25-Hydroxyvitamin D3. PloS One 6, e21674. doi: 10.1371/journal.pone.0021674
Nelson, C. D., Reinhardt, T. A., Thacker, T. C., Beitz, D. C., Lippolis, J. D. (2010b). Modulation of the Bovine Innate Immune Response by Production of 1α,25-Dihydroxyvitamin D3 in Bovine Monocytes. J. Dairy Sci. 93, 1041–1049. doi: 10.3168/jds.2009-2663
Nelson, C. D., Reinhardt, T. A., Beitz, D. C., Lippolis, J. D. (2010a). In Vivo Activation of the Intracrine Vitamin D Pathway in Innate Immune Cells and Mammary Tissue During a Bacterial Infection. PloS One 5, e15469. doi: 10.1371/journal.pone.0015469
Ott, S. L., Wells, S. J., Wagner, B. A. (1999). Herd-Level Economic Losses Associated With Johne’s Disease on US Dairy Operations. Prev. Vet. Med. 40, 179–192. doi: 10.1016/S0167-5877(99)00037-9
Periasamy, S., Tripathi, B. N., Singh, N. (2013). Mechanisms of Mycobacterium Avium Subsp. Paratuberculosis Induced Apoptosis and Necrosis in Bovine Macrophages. Vet. Microbiol. 165, 392–401. doi: 10.1016/j.vetmic.2013.03.030
Pinheiro, J., Bates, D., Sarkar, D., R Core Team (2021) Nlme: Linear and Nonlinear Mixed Effects Models. Available at: https://CRAN.R-project.org/package=nlme.
Rathnaiah, G., Zinniel, D. K., Bannantine, J. P., Stabel, J. R., Gröhn, Y. T., Collins, M. T., et al. (2017). Pathogenesis, Molecular Genetics, and Genomics of Mycobacterium Avium Subsp. Paratuberculosis, the Etiologic Agent of Johne’s Disease. Front. Vet. Sci. 4, 187. doi: 10.3389/fvets.2017.00187
Redford, P. S., Boonstra, A., Read, S., Pitt, J., Graham, C., Stavropoulos, E., et al. (2010). Enhanced Protection to Mycobacterium Tuberculosis Infection in IL-10-Deficient Mice Is Accompanied by Early and Enhanced Th1 Responses in the Lung. Eur. J. Immunol. 40, 2200–2210. doi: 10.1002/eji.201040433
Sacco, R. E., Nonnecke, B. J., Palmer, M. V., Waters, W. R., Lippolis, J. D., Reinhardt, T. A. (2012). Differential Expression of Cytokines in Response to Respiratory Syncytial Virus Infection of Calves With High or Low Circulating 25-Hydroxyvitamin D3. PloS One 7, e33074. doi: 10.1371/journal.pone.0033074
Small, A. G., Harvey, S., Kaur, J., Putty, T., Quach, A., Munawara, U., et al. (2021). Vitamin D Upregulates the Macrophage Complement Receptor Immunoglobulin in Innate Immunity to Microbial Pathogens. Commun. Biol. 4, 401. doi: 10.1038/s42003-021-01943-3
Stabel, J. R. (1995). Temporal Effects of Tumor Necrosis Factor-α on Intracellular Survival of Mycobacterium Paratuberculosis. Vet. Immunol. Immunopathol. 45, 321–332. doi: 10.1016/0165-2427(94)05342-P
Stabel, J. R. (2000). Transitions in Immune Responses to Mycobacterium Paratuberculosis. Vet. Microbiol. 77, 465–473. doi: 10.1016/S0378-1135(00)00331-X
Stabel, J. R., Bannantine, J. P. (2019). Divergent Antigen-Specific Cellular Immune Responses During Asymptomatic Subclinical and Clinical States of Disease in Cows Naturally Infected With Mycobacterium Avium Subsp. Paratuberculosis. Infect. Immun. 88, e00650–e00619. doi: 10.1128/IAI.00650-19
Stabel, J. R., Reinhardt, T. A., Hempel, R. J. (2019). Short Communication: Vitamin D Status and Responses in Dairy Cows Naturally Infected With Mycobacterium Avium Ssp. Paratuberculosis. J. Dairy Sci. 102, 1594–1600. doi: 10.3168/jds.2018-15241
Stocks, S. M. (2004). Mechanism and Use of the Commercially Available Viability Stain, BacLight. Cytometry A 61A 61 (2), 189–195. doi: 10.1002/cyto.a.20069
Sturgill-Koszycki, S., Schlesinger, P. H., Chakraborty, P., Haddix, P. L., Collins, H. L., Fok, A. K., et al. (1994). Lack of Acidification in Mycobacterium Phagosomes Produced by Exclusion of the Vesicular Proton-ATPase. Science 263, 678–681. doi: 10.1126/science.8303277
Wahono, C. S., Rusmini, H., Soelistyoningsih, D., Hakim, R., Handono, K., Endharti, A. T., et al. (2014). Effects of 1,25(OH)2D3 in Immune Response Regulation of Systemic Lupus Erithematosus (SLE) Patient With Hypovitamin D. Int. J. Clin. Exp. Med. 7, 22–31.
Wangoo, A., Johnson, L., Gough, J., Ackbar, R., Inglut, S., Hicks, D., et al. (2005). Advanced Granulomatous Lesions in Mycobacterium Bovis-Infected Cattle Are Associated With Increased Expression of Type I Procollagen, γδ (WC1+) T Cells and CD 68+ Cells. J. Comp. Pathol. 133, 223–234. doi: 10.1016/j.jcpa.2005.05.001
Waters, W. R., Nonnecke, B. J., Rahner, T. E., Palmer, M. V., Whipple, D. L., Horst, R. L. (2001). Modulation of Mycobacterium Bovis-Specific Responses of Bovine Peripheral Blood Mononuclear Cells by 1,25-Dihydroxyvitamin D3. Clin. Diagn. Lab. Immunol. 8, 1204–1212. doi: 10.1128/CDLI.8.6.1204-1212.2001
Weiss, D. J., Evanson, O. A., Deng, M., Abrahamsen, M. S. (2004). Gene Expression and Antimicrobial Activity of Bovine Macrophages in Response to Mycobacterium Avium Subsp. Paratuberculosis. Vet. Pathol. 41, 326–337. doi: 10.1354/vp.41-4-326
Weiss, D. J., Evanson, O. A., de Souza, C., Abrahamsen, M. S. (2005). A Critical Role of Interleukin-10 in the Response of Bovine Macrophages to Infection by Mycobacterium Avium Subsp Paratuberculosis. Am. J. Vet. Res. 66, 721–726. doi: 10.2460/ajvr.2005.66.721
Weiss, D. J., Souza, C. D., Evanson, O. A., Sanders, M., Rutherford, M. (2008). Bovine Monocyte TLR2 Receptors Differentially Regulate the Intracellular Fate of Mycobacterium Avium Subsp. Paratuberculosis and Mycobacterium Avium Subsp. Avium. J. Leukoc. Biol. 83, 48–55. doi: 10.1189/jlb.0707490
Xu, H., Soruri, A., Gieseler, R. K. H., Peters, J. H. (1993). 1,25-Dihydroxyvitamin D3 Exerts Opposing Effects to IL-4 on MHC Class-II Antigen Expression, Accessory Activity, and Phagocytosis of Human Monocytes. Scand. J. Immunol. 38, 535–540. doi: 10.1111/j.1365-3083.1993.tb03237.x
Yamauchi, P. S., Bleharski, J. R., Uyemura, K., Kim, J., Sieling, P. A., Miller, A., et al. (2000). A Role for CD40-CD40 Ligand Interactions in the Generation of Type 1 Cytokine Responses in Human Leprosy. J. Immunol. 165, 1506–1512. doi: 10.4049/jimmunol.165.3.1506
Keywords: Mycobacterium avium subsp. paratuberculosis, cattle, vitamin D, macrophage, immune responses, Johne’s disease
Citation: Wherry TLT, Dassanayake RP, Casas E, Mooyottu S, Bannantine JP and Stabel JR (2022) Exogenous Vitamin D3 Modulates Response of Bovine Macrophages to Mycobacterium avium subsp. paratuberculosis Infection and Is Dependent Upon Stage of Johne’s Disease. Front. Cell. Infect. Microbiol. 11:773938. doi: 10.3389/fcimb.2021.773938
Received: 10 September 2021; Accepted: 27 December 2021;
Published: 17 January 2022.
Edited by:
Natarajaseenivasan Kalimuthusamy, Bharathidasan University, IndiaReviewed by:
Sangeeta Tiwari, The University of Texas at El Paso, United StatesDania AlQasrawi, Mayo Clinic Florida, United States
Copyright © 2022 Wherry, Dassanayake, Casas, Mooyottu, Bannantine and Stabel. This is an open-access article distributed under the terms of the Creative Commons Attribution License (CC BY). The use, distribution or reproduction in other forums is permitted, provided the original author(s) and the copyright owner(s) are credited and that the original publication in this journal is cited, in accordance with accepted academic practice. No use, distribution or reproduction is permitted which does not comply with these terms.
*Correspondence: Judith R. Stabel, Judy.Stabel@usda.gov