Dynamics of Water and Other Molecular Liquids Confined Within Voids and on Surface of Lignin Aggregates in Aging Bio Crude Oils
 Massimo Bonini
 Emiliano Fratini
 Antonio Faraone
- 1Department of Chemistry “Ugo Schiff” and CSGI, University of Florence, Sesto Fiorentino, Italy
- 2Center for Neutron Research, National Institute of Standards and Technology, Gaithersburg, MD, United States
Neutron scattering methods were employed to study the microscopic structure and dynamics of Bio Crude Oils (BCOs) and their lignin fractions. The structure of the carbonaceous aggregates was investigated using Small Angle Neutron Scattering to reveal a fractal hierarchy as well as a growth of the aggregates as the aging of the BCO proceeds. Elastic Neutron Scattering measurements indicate that BCO liquid phase, comprised of water and other hydrogenated molecular liquids, is in a state of extreme confinement. Quasi-Elastic Neutron Scattering yields information on the molecular motions, indicating that long range translational diffusion is suppressed and only localized dynamics take place on the tens of picosecond time range. The obtained results provide quantitative information on the molecular activity, as aging proceed, in these reactive materials of relevance as potential renewable energy sources.
1 Introduction
The energetic scenario depicted by most analysts and Kyoto agreement on CO2 emissions control require the development of new fuels based on renewable sources. In the last couple of decades, Bio Crude Oils (BCOs) have attracted a considerable attention as possible renewable energy from biomass (Ringer et al., 2006). These oils are obtained from the pyrolysis of biomass: i.e., by heating a feed-stock such as wood, agricultural wastes, paper, algae, animal wastes, etc., at high temperature, and rapidly quenching the obtained liquid products. Unfortunately, BCOs are poorly stable since numerous reactions take place after their production, making them very reactive and leading to several problems in their handling and final use. In particular, compared to conventional mineral fuels, pyrolysis oils show long-term instability with a strong dependency on the storage temperature (Oasmaa and Kuoppala, 2003). Therefore, the characterization of the BCOs and the way they are affected by aging represents a crucial step in order to employ these oils in practical applications and in particular as substitutes of mineral oils. In general, BCOs are formed by a large number of organic compounds, mainly carboxylic acids, carbohydrates and lignin derivatives, together with a variable amount of water. Unfortunately, some of these organic compounds are very reactive and seem to be the main responsible for the aging process (Bridgwater, 2008). During storage these components chemically react to produce larger molecules leading to changes in the physical properties, such as viscosity and density. Previous studies proposed that etherification and esterification occurring between hydroxyl, carbonyl, and carboxyl groups (Czernik et al., 1994) are the main chemical reactions taking place in pyrolysis oils and producing water as a byproduct of the condensation reactions. Lignin’s derived compounds are indicated as pyrolytic lignin and are obtained as the water-insoluble fraction of BCOs (SipiläSipila et al., 1998). Gel Permeation Chromatography and 13C-NMR measurements (Scholze et al., 2001) demonstrated that pyrolytic lignin mainly consist of trimers and tetramers, even though larger structural units remain intact during the pyrolysis. These results are in agreement with the thermal ejection theory formulated by Piskorz (Overend and Chornet, 1999), where lignin oligomers are considered to be directly expelled from wood particles as a result of a partial cracking of lignin molecules during the pyrolysis. In a previous SANS investigation, some of the Authors have verified the validity of this theory and elucidated the role of pyrolytic lignin in the aging of BCOs (Fratini et al., 2006). In particular, the possibility to correlate the aggregation between pyrolytic lignin into clusters with the evolution of the BCOs chemical and physical properties was disclosed. This is of great importance in the formulation of pyrolysis fuels with long-term stability. The investigation reported an increase of both the volume fraction of the scattering objects and the number of spherical sub-units per cluster (i.e., the aggregation number) as time passes after BCO production. The obtained fractal dimensions values range between 1.4 and 1.5, i.e., values typical of branched structures that are generated by the aggregation of small lignin units as a consequence of the chemical reactivity of this peculiar fluid (Fratini et al., 2006).
The microscopic dynamics of the liquid phases in the BCO plays a crucial role in determining the reactions taking place during aging. Dynamic neutron scattering techniques offer the unique capability to measure the single particle dynamics of the hydrogen atoms in the system over length scales of the order of the Ångstrom and time scales ranging from few picoseconds to nanoseconds. This microscopic mobility of the liquid species is indicative of the activity in the system.
Among the liquid species present in BCO, water accounts for more than 20% (see Table 1). However, the environment the water molecules experience is vastly different from the bulk: in fact, water is most reasonably confined on the surface and within the nanoscopic voids of the carbonaceous aggregates generated by the lignin units as well as intermixed and hydrogen bonded with other molecular liquids (carboxylic acids, aldehydes/ketones, ethers, esters, etc.) (Oasmaa et al., 2003). As such, water in BCO should be considered interfacial water and an exemplary case of how, in many instances of relevance, water molecules are found confined on surfaces, in microcavity, or dispersed within a different liquid phase.
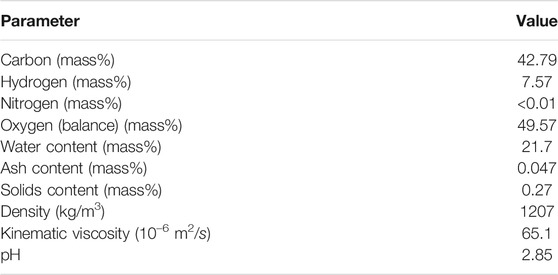
TABLE 1. Physico-chemical parameters of the BCO from BTG (Chiaramonti et al., 2011). Here mass% indicates the percentage mass fraction.
The present work reports the results of an investigation, performed using mainly Quasi-Elastic Neutron Scattering (QENS) (Bée, 1988; Gardner et al., 2020), of the microscopic mobility of the hydrogen atoms in BCO as a function of aging. In parallel, Small Angle Neutron Scattering (SANS) is employed to determine the micro-structure of the aggregates in BCO and its evolution during aging. The analysis of the temperature dependence of the mean squared displacement of the hydrogen atoms provides information on the confinement experienced by the liquid phases. The analysis of QENS data provides information on the nanoscale dynamics in terms of both time scale and length scale of the mobility. A comparison with the dynamics of the diverse lignin fractions is carried out as well.
2 Methods
2.1 Samples
Bio-crude oil was supplied by Biomass Technology Group (BTG, Netherlands) and was produced in their fast pyrolysis plant in Enschede from a batch of pine chips. Main physico-chemical properties of the investigated BCO are reported in Table 1. Additional details on this batch can be found elsewhere (Chiaramonti et al., 2011). Samples corresponding to four aging stages have been investigated and are labelled, hereinafter, as “fresh,” “12 months,” “12 months at 40°C” and “15 months.” All of the samples were stored at room temperature during the first month after their production. After the first month, “fresh” sample was frozen and taken back to the liquid state before carrying out the measurements. Similarly, “12 months” sample was stored at room temperature and frozen 13 months after production (12 months after “fresh”). Sample labeled as “15 months” was never frozen and always stored at room temperature, as the measurements were carried out exactly 16 months after production. Sample labeled as “12 months at 40°C” was stored, after the first month at room temperature, at 40°C during the next year and then frozen until measurements. Samples containing low and high molecular weight lignin fractions have been investigated as well, with the same aging times and storage conditions. The extraction procedure was conducted as reported in (Oasmaa et al., 2003). In brief, 400 g of water were added to 5 g of BCO in a Erlenmeyer flask so to separate the water insoluble fraction rich in lignin. The water-insoluble fraction was removed by filtration and further extracted with dichloromethane (i.e., CH2Cl2) so to obtain Low Molecular Mass (LMM, CH2Cl2-soluble part, about 400 Da) and High Molecular Mass (HMM, CH2Cl2-insoluble part, 1050 Da) lignin fractions. Both fractions were evaporated at 40°C overnight to remove any residue of CH2Cl2.
2.2 Neutron Scattering
In a neutron scattering measurement the experimentally determined quantity is the double differential scattering cross-section,
Because of the way the neutrons are scattered by the nuclei in the sample, the scattering can be decomposed in the sum of two contributions: the coherent component,
Neutron scattering probes the structure and dynamics at the nanoscale. The distances probed are determined by the inverse of the exchanged wavevector, Q = ki − kf, where ki and kf are the initial and final wavevector of the scattered neutron. For isotropic samples the differential scattering cross section only depends on the modulus of Q = |Q|. In general, Q is a function of the scattering angle, θ, and the energies, Ei and E, Q(θ, Ei, E); however, for small values of E, it is a function of the scattering angle and the wavelength of the incoming neutrons, λ, only:
The microstructure of the BCO was investigated using SANS, for Q values in the range from 3 × 10⁻³ Å−1 to ≈0.6 Å−1, corresponding to length-scales approximately from 1 to 500 nm. In this range, the overwhelming contribution to the scattering is coherent and the incoherent component is just a Q-independent background.
The dynamics of the bio-oils was studied using QENS measurements for Q values 0.5 Å−1 ≤ Q ≤ 2.0 Å−1. In this Q range, to a first approximation, the scattering signal originates from the incoherent dynamics of the hydrogen atoms.
2.2.1 SANS
SANS is a static scattering technique which measures the scattered intensity without any analysis of the exchanged energy. Thus, it gives access to the differential scattering cross section:
where the integration over the whole energy range is always approximated because of experimental constraints. Since in SANS the probed length-scales contain a relative large number of atoms, the scattering power can be expressed in terms of an average scattering length density:
where
Within certain approximations, the SANS intensity produced by a collection of uniform scatterers dispersed in a continuous medium (i.e., usually the dispersing medium or “solvent”) can be expressed as:
where I(Q) is the scattering intensity (i.e., the differential scattering cross section normalized by the scattering volume), np is the number density of the particles,
The BCO samples investigated in this article can be considered as lignin dispersions in a mixture of water and organic molecules (that we have referred to as “solvent” in the previous section). Several structural models have been already screened for BCOs showing that the structure of the system in the liquid state can be better described by polydisperse clusters with a certain fractal nature originated by the aggregation of smaller lignin spherical units (Fratini et al., 2006). This approach is based on the work of Liu et al. (1995) where they followed the agglomeration of asphaltene primary units in liquid dispersions as a function of the asphaltene volume fraction and temperature. In the present case, considering aggregates consisting of S elementary spherical particles with radius, R1, fractal dimension, Df, degree of polydispersity on the average cluster size, ν, and assuming a continuous distribution of cluster size or small enough unit particle, the integral form of the scattering Eq. 5 reduces to:
where ϕ and Vu are, respectively the volume fraction and molecular volume of the base units; ξ is the correlation length of the fractal object defined as
and:
with:
x = Qξ and Γ(a) and Γ(a, b) are the Gamma and incomplete Gamma function, respectively.
An additional Porod’s term with amplitude CP and Q−4 dependence is also included to take into account the low Q intensity increase present in the “fresh” sample (see Figure 1) and indicating the presence of aggregates at the upper limit of the dimensional range spanned by the SANS experiment (i.e., 2π/Qmin).
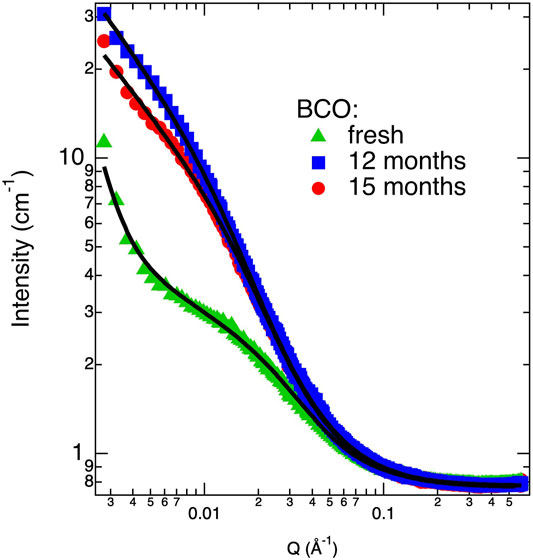
FIGURE 1. Scattering intensity profiles (markers) and correspondent best fits (lines) according to Eq. 6 for some of investigated BCO samples.
Eq. 6 has been used in this work with ϕ, S, Df and ν as adjustable parameters while R1 was kept fixed at 2.7 Å (Fratini et al., 2006). This model assumes the unit particles as monodisperse, a condition typical of the chemical nature of BCOs. The contrast between the lignin aggregates and continuous medium, (ρp − ρs) can be calculated by the mass fraction of the scattering objects and the elemental analysis of the bio-oil and lignin as already described in (Fratini et al., 2006) using the composition and density values reported in Table 1.
2.2.2 QENS
Within the approximation that the overwhelming contribution to the neutron scattering originates from the incoherent scattering of the hydrogen atoms, the double differential scattering cross section for the QENS measurement is:
where NH is the number of hydrogen atoms in the system,
where
In particular, Elastic Neutron Scattering (ENS) measurements determine the value of the differential scattering cross-section for E = 0, within the instrumental resolution:
Rt(Q, t) being the time Fourier transform of the instrumental resolution function (Fratini et al., 2013).
The position of the H atoms can be decomposed as the sum of the position of a reference point, rR, such as the center of mass of the molecule, the relative position with respect to the reference point, b, and the vector defining the vibrational displacement from the bond equilibrium position, u:
Within the decoupling approximation, the motions described by these three vectors, namely translational, reorientational and conformational, and vibrational, are statistically independent, hence:
Bond vibrational motions are too fast to fall within the instrumental energy window and only cause a reduction of the total scattering intensity in the QENS window. In terms of its ISF,
where Lor(Γl) represents a Lorentzian function with a full width half maximum equal to Γl. The reorientational and conformational dynamics is characterized by a time independent term, which in the energy domain results in the presence of a delta function, i.e., a resolution limited feature centered at E = 0. The Q dependence of this contribution, A0(Q), is referred to as the Elastic Incoherent Structure Factor (EISF) and represents the spatial Fourier transform of the volume explored by the hydrogen atoms during their motion, with respect to the reference point.
Finally, as far as the dynamics of rR is concerned, when the point of reference represents the center of mass of a molecule in the liquid phase (a common choice to model the data in liquids), the corresponding dynamics represents the translational motion of the molecule. Models corresponding for example to Fickian, jump, or confined diffusion have been developed, generally characterized by a Q dependence of the characteristic relaxation time.
In water and other liquids, the accuracy of the decoupling approximation between the translational and reorientational and conformational motions is limited to several percent and it is hard to determine a priori, therefore, even if employed very commonly, it represents a major limitation to the accurate interpretation of QENS results (Faraone et al., 2003).
2.3 Instrumentation
SANS measurements were performed on D22 at the Institute Laue Langevin (ILL), Grenoble, France. The incoming neutron wavelengths was set to 6 Å with a Δλ/λ ≈ 10%. Three sample to detector distances were employed to cover a Q range from 3 × 10⁻³ Å−1 to about 0.6 Å−1. Data were corrected for the dark counts intensity and the contribution from the empty containers and converted to 1D absolute intensity using standard routines at ILL. All the SANS measurements were carried out using Hellma quartz cells of 1 mm path length at 20.0°C ± 0.1°C.
Elastic scan measurements were performed on the High Flux Backscattering Spectrometer (HFBS) at National Institute of Standards and Technology (NIST) Center for Neutron Research (NCNR), in Gaithersburg, MD, United States. In this operation mode both the initial and final energy of the neutrons detected is determined by Bragg reflection of the neutrons by the Si(111) crystals of both the monochromator and the analyzers. To ensure minimal wavelength (i.e., energy) spread of the detected neutrons, the analyzers are arranged in such a way that only backscattered neutrons of the required energy satisfy the Bragg condition and reach the detectors. The corresponding instrumental resolution is of ≈0.8 μeV. A set of detectors records the intensity of neutrons for 16 Q values. The elastic scattered intensity is recorded as the sample temperature is changed using a cold cycle refrigerator with a temperature accuracy of ≈0.1 K. The temperature scan rate was 1/60 K/s. Samples were spread in thin annular sheets of ≈0.5 mm thickness, to minimize multiple scattering, and contained in aluminum cans sealed with indium.
QENS Time-of-Flight measurements were performed on the cold disk chopper IN5 at ILL. An incoming wavelength of 5 Å was selected. The instrumental resolution function could be well reproduced by a Gaussian function with a Full Width at Half Maximum varying from ≈82 μeV to ≈88 μeV depending on the scattering angle. Data were converted to sets of 16 constant Q spectra in the range from 0.5 Å−1 to 2.0 Å−1 using standard routines available in LAMPS.
Both ENS and QENS data were analyzed using DAVE (Azuah et al., 2009).
3 Results and Discussion
3.1 SANS Results
Figure 1 shows the SANS curves of some of the BCO samples investigated in this study. As it can be clearly depicted, the scattering signal increases passing from the “fresh” to the “12 months” sample. The “15 months” sample shows a small decrease in the scattered intensity with respect of the “12 months” sample, most reasonably due to a partial sedimentation of larger aggregates. Fitting these curves with Eq. 6 allows for a quantitative picture of the evolution of BCO structure at the nanoscale. Table 2 lists the results of the best fits done according to Eq. 6. In particular, all the samples can be modeled using the structure factor associated to a fractal assembly of spherical lignin units of about 2.7 Å. In the case of the “fresh” sample an extra term accounting for the Porod’s contribution from larger aggregates is also included (i.e., the scattering coming from the surface of the aggregate). This contribution does not provide any benefit to the final fits in all other samples probably because this fraction of larger objects precipitates out of the sample at longer times or it is covered by the scattering of the growing fractal assembly. The aggregation parameter, S, (i.e., the average number of units present in the fractal assembly) increases from 189 for the fresh sample to 886 after 12 months of aging. This value decreases to 626 after 15 months of aging, consistently with the hypothesis of sedimentation of part of the larger aggregates. The fractal dimension associated to the clusters are slightly increasing with the aging time, but they are in all cases around 1.9. More important, the polydispersity parameter ν shows a significant increase as a function of aging time from 1.2 to 1.4. Values of S and Df are greater than the ones reported in the literature on a batch of BCO produced by VTT starting from different biomass and production plant (Fratini et al., 2006) thus indicating that the lignin aggregates formed in the present case are more clustered and have a denser structure. The index ν gives information on the degree of polydispersity associated to the cluster size and more important reveals the mechanisms behind cluster formation. Smaller ν are found in the case of broader cluster size distribution with values around 1.4 typical for reaction limited aggregation (RLA) and around 1.9 in the case of diffusion limited mechanism (DLA) (Chen et al., 1992). Value of ν obtained in the present investigation are slightly lower than 1.4 showing that the clustering mechanisms is dominated by a RLA process. The high value of the incoherent background are in line with the high hydrogen content evidenced by the CHNO analysis.
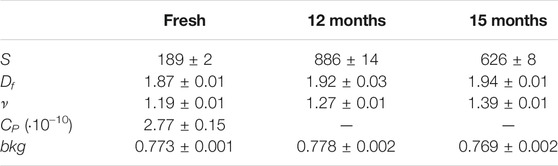
TABLE 2. Best fitting parameters obtained from SANS analysis by using Eq. 6 with R1 = 2.7 Å.
3.2 ENS Results
Within the Guassian approximation the single particle ISF is related to the mean squared displacement (msd) of the hydrogen atoms.
where
Within some approximations, from Eqs 12, 17, the msd over the timescale determined by the energy resolution of the spectrometer, ≈ 1 ns in the HFBS case, can be derived as a linear fit to the data:
where T0 is the lowest temperature measured, for which it is assumed that no significant dynamics is observable. I0 is the intercept of the linear fit in Q2, accounting for experimental errors as well as for the presence of non Gaussian contributions.
Figure 2 reports the temperature dependence of the msd of the hydrogen atoms for the present investigation. Although for BCO it is much less pronounced, all the samples display an upturn of the curves at ≈ 50 K which is associated to the activation of methyl groups rotation (Senses et al., 2018). The msd of the BCO samples is characterized by a hysteresis loop in the range from 200 to 250 K. Interestingly, BCO can be cooled without displaying a sudden drop in the msd which is the hallmark of freezing. A rather sharp change in the slope of the curve is observed at ≈ 220 K, which can be associated to a liquid to glass transition. This temperature is not far from the much discussed dynamic transition temperature in proteins (Doster et al., 1989) and other water hydrated systems (Tavagnacco et al., 2019), which is believed to be intimately related to the dynamics of interfacial water (Chen et al., 2006). This result suggests that lowering the storing temperature below this transition threshold might be a way to suppress the reactivity of the BCO. On the other hand in the hysteresis loop, on warming, a fast increase of the msd just above 225 K is followed by a drastic change of slope at 250 K, overlapping with the cooling data. This unusual pattern of the msd curves indicates the frustration of crystallization of the liquids because of confinement and interfacial interactions. As a comparison, water confined within nanoporous matrices with pores of ≈28 Å and ≈24 Å display a depression of the freezing point of more than 50°C and 70°C, respectively; whereas for pores of ≈20 Å diameter, no freezing signature can be observed even with differential scanning calorimetry (Yoshida et al., 2008).
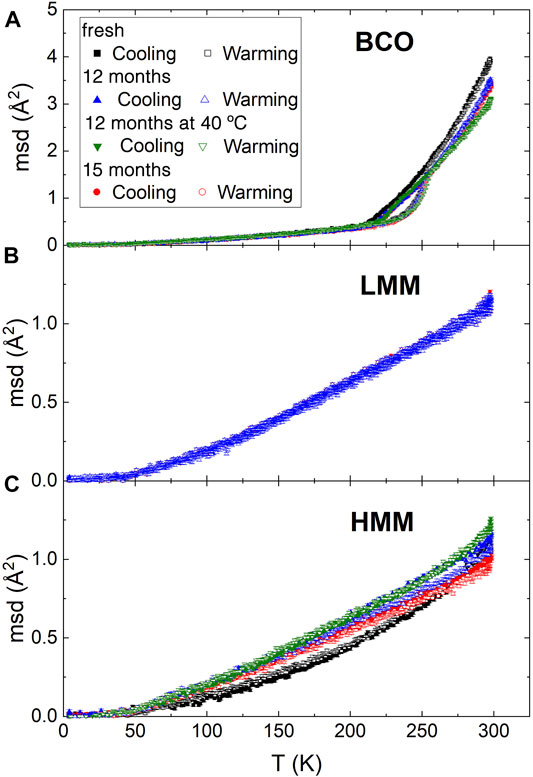
FIGURE 2. Temperature dependence of the mean squared displacement over a timescale of ≈1 ns, obtained from the elastic neutron scattering measurements on HFBS. Samples at four aging stages were tested as indicated in the legend of plot (A) [The legend applies to plot (B,C) as well]. Measurements for each sample were performed first cooling and then heating it back again to 300 K. Plot (A,B,C) report the results for BCO, low and high molecular mass lignin fractions, respectively.
Above 250 K, in the liquid phase, the msd of BCO decreases with aging. However, this reduction in mobility is not monotonic as indicated by the fact that the “12 months” and “15 months” samples show similar values of the msd. Remarkably, the “12 months at 40°C” sample displays slightly smaller msd values which could be a consequence of the greater reactivity of the sample stored at 40°C leading to an increased amount of water, as well as other liquids, in the confined and interfacial state. The increase in size of the carbonaceous aggregates supports this picture.
As a comparison, the behavior of the pyrolytic lignin fractions is quite different. The absolute value of the msd, even at the highest temperature investigated of 300 K, is of about 1 Å2; much lower than the one encountered for BCO. This is not surprising considering that lignin is a solid phase and therefore no long distance dynamics is expected. Moreover, beyond the already discussed upturn of the msd at 50 K, no other significant feature is present in the whole temperature range. The warming and cooling scans do not show any hysteresis consistently with the absence of phase changes in these matrices. Although the low molecular weight lignin display no dependence on aging, slight changes are observed in the high molecular weight case. In these samples, the mobility of the hydrogen atoms increases with aging. The chemical reactions taking place induce a rearrangement of the molecular and chemical structure of the lignin which allows for a slightly increased molecular mobility. It could be speculated, although no direct evidence can be provided, that the same changes take place in the lignin components of the BCO during aging, as a result of similar chemical reactions and structural rearrangements. The increase in size of the aggregates observed by SANS is consistent with this scenario. Interestingly, around room temperature, which is the most relevant range for the applications of these products, the increase of the msd is much larger for the sample aged at 40°C with respect to the others, confirming the higher reactivity of this sample.
3.3 QENS Results
The structure of the samples at molecular length scales was investigated by integrating the QENS spectra over the available energy range to obtain an approximation of the structure factor, as indicated in Eq. 3. The obtained results are reported in Figure 3. For BCO, as shown in panel (a) the slight decrease of S(Q) up to ≈0.70 Å−1 is likely due to the high Q tail of the SANS pattern and indicates the presence of not negligible coherent neutron scattering contributions. The further decrease at higher Q values is instead related to the limited energy range covered in the integration. Small differences can be observed among the samples differing for their aging even if the trends are not monotonic and difficult to be interpreted.
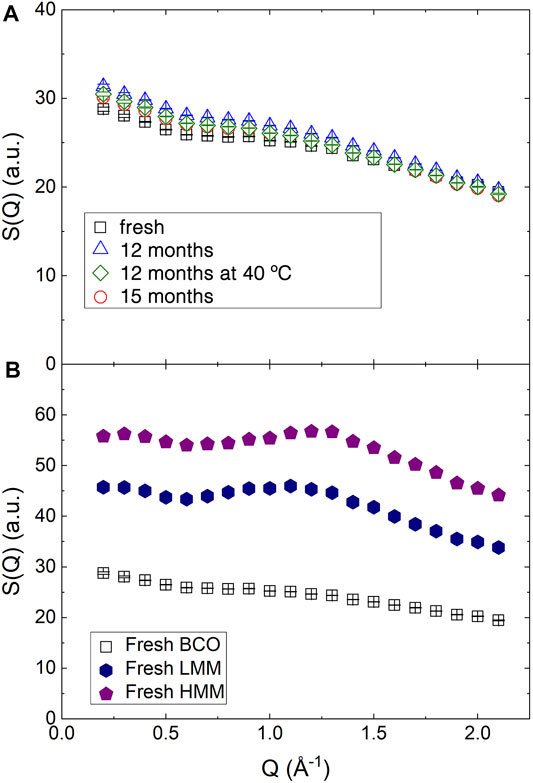
FIGURE 3. Structure factor as obtained integrating the QENS spectra collected on IN5 over E (see Eq. 3). (A) BCO at four aging stages. (B) The structure factor of fresh BCO is compared to the structure factor of the fresh low and high molecular mass lignin fractions.
Figure 3B reports the structure factor for the fresh lignin fractions. The broad peak observed in the middle of the reported Q range is similar to the one observed in amorphous cellulose using X-ray diffraction (Park et al., 2010) and Kraft lignin (Goudarzi et al., 2014). The slight increase of the peak position in the HMM sample indicates a more compact structure of the low molecular weight lignin.
The presence of structural features in the samples indicates that the interpretation of the QENS results cannot neglect the presence of residual coherent signal beside the single particle dynamics of the hydrogen atoms. Moreover, the inherent inhomogeneity of the sample and the complexity introduced by confinement prevent from developing a detailed model of the microscopic motion of the hydrogen atoms. Therefore, an empirical approach is employed to gain information on the general geometry and timescales of the motions.
Figures 4, 5 display the QENS spectra at two Q values (0.7 and 1.4 Å) for fresh BCO and for the aging stages of BCO investigated at Q = 1 Å−1, respectively. The spectra are characterized by the presence of a resolution limited component, from now on referred as delta. Therefore, the ISF of the single particle dynamics of the hydrogen atoms has been modeled as the sum of stretched exponential decay and a constant background:
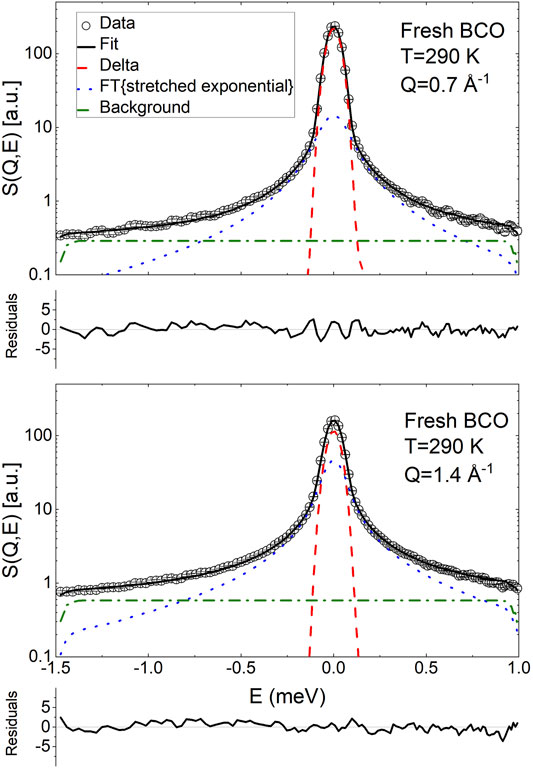
FIGURE 4. Exemplary fit of the QENS spectra of fresh BCO using Eq. 20 at two Q values. The normalized residuals (
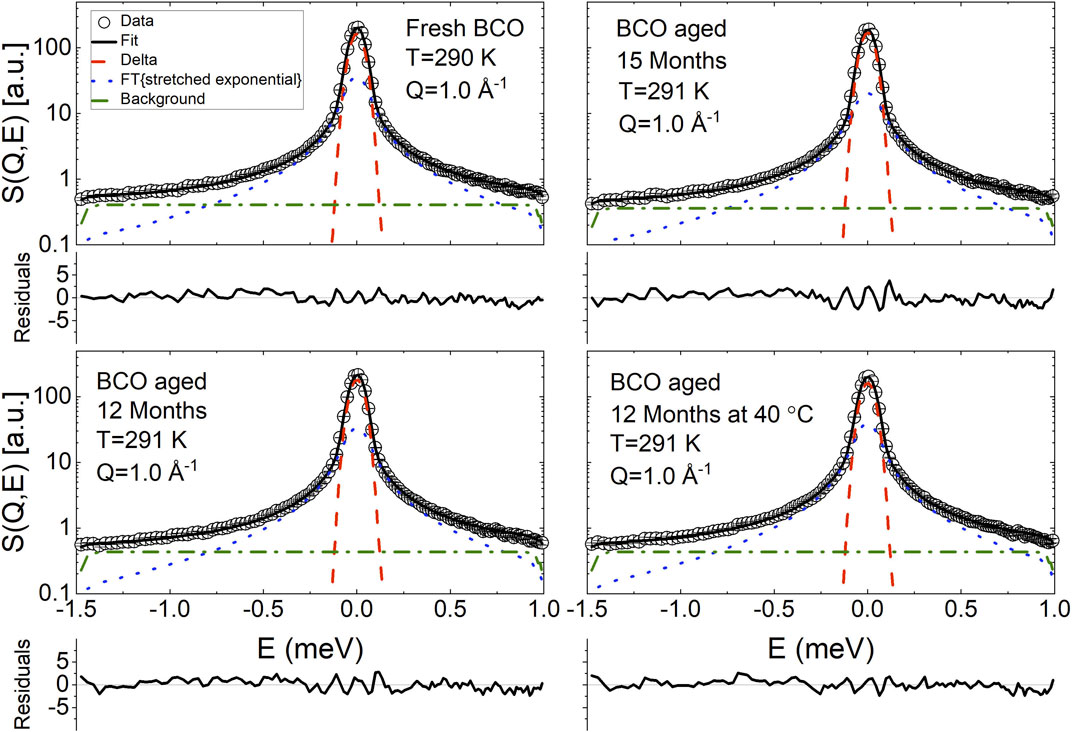
FIGURE 5. Exemplary fit of the QENS spectra of BCO at four aging stages using Eq. 20. The normalized residuals (
The time independent term, Aδ(Q), accounts for the presence of immobile1 hydrogen atoms in the aggregates. Moreover, the presence of this time independent term can be originated by a rotational and reorientational dynamics of the hydrogen atoms in a molecule, when diffusion of the point of reference, i.e., the center of mass, is too slow to be appreciated by the spectrometer employed because of its limited resolution. The stretched exponential function is commonly employed as an empirical way to describe relaxation data that do not follow a simple Debye behavior. The case β = 1 coincides with an exponential relaxation, whereas values of β increasingly smaller than one indicate higher degrees of non-exponential behaviour. A stretched behavior of the ISF can originate either from a distribution of exponential relaxations with different characteristic times or from intrinsically non exponential relaxation processes (Colmenero et al., 1999).
Therefore, considering the molecular heterogeneity of the BCOs giving rise to a distribution of exponential relaxation times, the data have been analyzed using the following fitting function:
where A(Q) represents the total spectral intensity, δ(E) is a Dirac delta function, and bkg is a background which accounts for fast dynamical processes outside the instrumental window as well as instrumental background contributions.
Besides Eq. 20, several other fitting equations have been employed. None of the models which did not contain an immobile contribution was able to describe the spectra satisfactorily or would yield nonphysical results. Using the sum of a delta function and a Lorentzian, i.e., forcing β(Q) = 1 in Eq. 20, also yielded unsatisfactory fits. Using the sum of a delta and two Lorentzian functions allowed to obtain good fitting; however, since the model of Eq. 20 has one less fitting parameter and the overall results of the models were the same, only the results of the fitting from Eq. 20 are presented. The reader is cautioned, however, to keep in mind that, given the complexity of the samples and the limited Q/E probed, the present results should be considered preliminary in the sense that, as more information on the samples are gathered from other measurements and investigations, a more refined and insightful fitting model might be developed.
Figure 6 reports the main results on the microscopic dynamics of the hydrogen atoms. Plot (a) shows the Q dependence of Aδ. As discussed before, the delta contribution to the spectra arises both from immobile hydrogen atoms (over all length scales) and from the reorientational and conformational dynamics of the hydrogen atoms with respect to a reference point immobile on the instrumental time scale. Therefore, Aδ(Q) results have been analyzed using the equation:
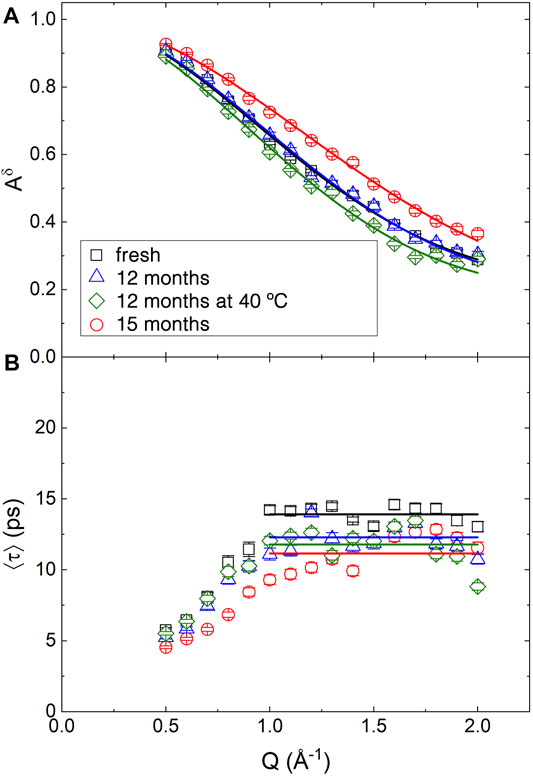
FIGURE 6. Q dependence of the best fitting parameters obtained from the QENS spectra of BCO at four aging stages using Eq. 20. (A) Continuous lines are the fitting according to Eq. 21. (B) Straight lines indicate the expected plateau value of ⟨τ⟩ for Q ≥1 Å−1.
Aimm represents the fraction of immobile atoms. The Gaussian term is analogue to the Guinier expression used to model the low-Q region of the SANS curves. Here it is used to extract a characteristic size of the region explored by the hydrogen atoms in their reorientational and conformational motion.
The stretched exponential function, often also referred to as the Kolrausch-Williams-Watts (KWW) function (Williams and Watts, 1970), can be considered as the results of the presence of a distribution of exponential relaxation. The first moment of the distribution defines the average relaxation time of the distribution, ⟨τ⟩ (Johnston, 2006):
The Q dependence of ⟨τ⟩ is reported in Figure 6B. The increase of ⟨τ⟩ with Q for Q < 1.0 Å−1 is not physical. It is probably related to the strong correlation in the fitting between the various fitting parameters. Moreover, the presence of a coherent contribution at low Q, as observed in Figure 3 might introduce some artifacts. Above Q = 1 Å−1 the data fluctuate around an average value indicated by the horizontal lines in the figure. In fact, as indicated by Eq. 15, for a reorientational and conformational (rc) type of dynamics, the timescale of the motion should be time independent. In a liquid, because of the diffusive motion, a Q2 dependence of the broadening should be observed. The absence of an appreciable diffusive contribution in the sample indicates that the long distance translational motion of the molecules in the liquid phase is too slow to be appreciated. Fresh BCO appears as a sticky substance and has a macroscopic viscosity 65 times larger than water (Chiaramonti et al., 2011); although the mobility at the atomic level might not scale with the viscosity, this occurrence explains the absence of a diffusive component in the spectra.
Table 3 reports the results of the fitting of Aδ(Q). The average value of ⟨τ⟩ as well as of the stretching exponent β, are also reported as
TABLE 3. Fitting results of the Q dependence of the parameters extracted from the QENS spectra.
The time scale of the motion is of the order of 10 ps. This can be compared with the timescale of the microscopic mobility of water: in fact, water molecules are believed to diffuse in the liquid through a sequence of random jumps. The time spent by the water molecules in between jumps, the residence time, has been measured using QENS (Teixeira et al., 1985). Even if the QENS spectra of BCO do not demonstrate a diffusive like Q2 dependence of the quasielastic broadening, the residence time is akin to the timescale measured in the present experiment, because it is related to the broadening of the QENS spectra at high Q, in a Q independent region. The values found for BCO are comparable to the ones observed in bulk water at ≈ 250 K. This confirm the extreme confinement experienced by the liquid phases in BCO: in fact, it was proposed that interfacial water displays the same dynamics of bulk water at a temperature ≈20 K lower (Chen et al., 1995). Cured cement, also provides an interesting point of comparison, since it is characterized by a significant fraction of interfacial water which plays a major role in its continuous curing. Also in QENS data from cement, the Q dependence of interfacial water dynamics is observed to increasingly deviate from the expected diffusive behavior as curing goes on (Fratini et al., 2001). Moreover, as a comparison, in cement timescales of the order of 10 ps were observed in the dynamics of the interfacial water after few days of curing (Fratini et al., 2002). Once again we observe that the 15 months sample mobile hydrogen atoms display the slower dynamics with the 12 months aged samples approaching again the values of fresh BCO. The stretching exponent
QENS measurements were also performed on samples of fresh LMM and HMM lignin fractions. The data were analyzed according to Eq. 20; however, the obtained values of β were close to unity and therefore the parameter was fixed to 1. Hence, the QENS data were essentially fitted using the sum of a delta function and a Lorentzian broadening. Examples of the fitting are shown in Figure 7.
FIGURE 7. Exemplary fit of the QENS spectra of fresh low and high molecular mass pyrolytic lignin using Eq. 20. The normalized residuals (
Figure 8 reports the Q dependence of the fitting parameters. The Aδ data were analyzed as the ones for BCO using Eq. 21; a mean relaxation time,
FIGURE 8. Q dependence of the best fitting parameters obtained from the QENS spectra of fresh low and high molecular mass pyrolytic lignin fraction using Eq. 20, with β = 1. (A) Continuous lines are the fitting according to Eq. 21. (B) Straight lines indicate the expected plateau value of τ for Q ≥1 Å−1.
4 Conclusion
BCOs hold tremendous potential as a novel renewable energy source. However, their reactivity partially limits the possibilities of their practical use. Gaining molecular insights on the properties of these systems might be the key to improve their applicability. However, from a physical chemical point of view, BCOs are extremely complex materials for their heterogeneity in molecular composition and large interface area of the diverse constituents. In this regard, they represent a practical example of widespread presence of interfacial water in nature. This paper reports the results of an investigation of the microscopic structure and dynamics of BCOs and their lignin components. The solid fraction, composed of mesoscopic carbonaceous aggregates, grows significantly with aging as evidenced by SANS. However, the changes in the microscopic dynamics of the interfacial liquid phases are more subtle. The dynamics of the hydrogen atoms, both in the solid and liquid phase, is limited to local re-orientation and conformation changes of the order of 1 to 2 Å. The timescales of the motion, around room temperature, are comparable to the ones of deeply supercooled bulk water or interfacial water in curing cement. This mobility is however required for the aging of BCO and elastic neutron scattering measurements suggest that storing the samples at ≈ 220 K might suppress its intrinsic reactivity.
Note
Throughout the paper, error bars and uncertanties of the raw data represent one standard deviation, and error bars of the fitted parameters represent one standard deviation.
Data Availability Statement
The datasets presented in this study can be found in online repositories. The names of the repository/repositories and accession number(s) can be found below: https://www.ncbi.nlm.nih.gov/, JAGFBX000000000 https://www.ncbi.nlm.nih.gov/, JAGFBW000000000. Raw data were generated at ILL and NCNR. The derived data that support the findings of this study are available from the corresponding authors.
Author Contributions
MB and EF: Prepared the samples, performed the QENS experiment, and analyzed the SANS data. AF: Performed the elastic scan measurements, and analyzed the QENS data. All authors contributed equally to the design of the experiments and overall study as well as to the writing of the manuscript.
Author Disclaimer
Certain trade names and company products are identified in order to specify adequately the experimental procedure. In no case does such identification imply recommendation or endorsement by the National Institute of Standards and Technology, nor does it imply that the products are necessarily the best for the purpose.
Conflict of Interest
The authors declare that the research was conducted in the absence of any commercial or financial relationships that could be construed as a potential conflict of interest.
Publisher’s Note
All claims expressed in this article are solely those of the authors and do not necessarily represent those of their affiliated organizations, or those of the publisher, the editors and the reviewers. Any product that may be evaluated in this article, or claim that may be made by its manufacturer, is not guaranteed or endorsed by the publisher.
Acknowledgments
Authors acknowledge Prof. Y. Liu (NCNR), Dr. L. Porcar (ILL) for their help in setting up and performing the SANS experiment. Dr. J. Olivier (ILL) and Dr. M. Tyagi (NCNR) are also acknowledged for their help in setting up QENS and elastic scan measurements, respectively. MB and EF kindly acknowledge partial financial support from Consorzio per lo Sviluppo dei Sistemi a Grande Interfase (CSGI). Access to HFBS was provided by the Center for High Resolution Neutron Scattering, a partnership between the National Institute of Standards and Technology and the National Science Foundation under Agreement No. DMR-2010792.
Footnotes
1In QENS, the term immobile is commonly used to refer to atoms whose dynamics is much slower than the instrumental time window of the instrument, in this case extending to ≈20 ps.
References
Azuah, R. T., Kneller, L. R., Qiu, Y., Tregenna-Piggott, P. L. W., Brown, C. M., Copley, J. R. D., et al. (2009). Dave: A Comprehensive Software Suite for the Reduction, Visualization, and Analysis of Low Energy Neutron Spectroscopic Data. J. Res. Natl. Inst. Stand. Technol. 114, 341–358. doi:10.6028/jres.114.025
Bée, M. (1988). Quasielastic Neutron Scattering : Principles and Applications in Solid State Chemistry, Biology and Materials Science. Bristol: Philadelphia: A. Hilger.
Chen, S. H., Rouch, J., and Tartaglia, P. (1992). Light Scattering from Polydispersed Fractal Clusters in Solution. Croatica Chemica Acta 65, 353–366.
Chen, S.-H., Gallo, P., and Bellissent-FunelBellissentFunel, M.-C. (1995). Slow Dynamics of Interfacial Water. Can. J. Phys. 73, 703–709. doi:10.1139/p95-104
Chen, S.-H., Liu, L., Fratini, E., Baglioni, P., Faraone, A., and Mamontov, E. (2006). Observation of Fragile-To-strong Dynamic Crossover in Protein Hydration Water. Proc. Natl. Acad. Sci. 103, 9012–9016. doi:10.1073/pnas.0602474103
Chiaramonti, D., Rizzo, A., Peruzzi, N., Bonini, M., Fratini, E., and Baglioni, P. (2011). Preliminary Investigation of Pyrolysis Oil Upgrading via Emulsification with Biodiesel. In Proceedings of the 19th European Biomass Conference and Exhibition 6-10 June 2011. ISBN: 9788889407554, Publisher: ETA-Florence Renewable Energies. doi:10.5071/19THEUBCE2011-VP2.5.16
Colmenero, J., Arbe, A., Alegría, A., Monkenbusch, M., and Richter, D. (1999). On the Origin of the Non-exponential Behaviour of the -relaxation in Glass-Forming Polymers: Incoherent Neutron Scattering and Dielectric Relaxation Results. J. Phys. Condens. Matter 11, A363–A370. doi:10.1088/0953-8984/11/10a/033
Czernik, S., Johnson, D. K., and Black, S. (1994). Stability of wood Fast Pyrolysis Oil. Biomass and Bioenergy 7, 187–192. doi:10.1016/0961-9534(94)00058-2
Doster, W., Cusack, S., and Petry, W. (1989). Dynamical Transition of Myoglobin Revealed by Inelastic Neutron Scattering. Nature 337, 754–756. doi:10.1038/337754a0
Faraone, A., Liu, L., and Chen, S.-H. (2003). Model for the Translation-Rotation Coupling of Molecular Motion in Water. J. Chem. Phys. 119, 6302–6313. doi:10.1063/1.1601599
Fratini, E., Chen, S.-H., Baglioni, P., and Bellissent-Funel, M.-C. (2001). Age-dependent Dynamics of Water in Hydrated Cement Paste. Phys. Rev. E 64. doi:10.1103/PhysRevE.64.020201
Fratini, E., Chen, S.-H., Baglioni, P., Cook, J. C., and Copley, J. R. D. (2002). Dynamic Scaling of Quasielastic Neutron Scattering Spectra from Interfacial Water. Phys. Rev. E 65. doi:10.1103/PhysRevE.65.010201
Fratini, E., Bonini, M., Oasmaa, A., Solantausta, Y., Teixeira, J., and Baglioni, P. (2006). Sans Analysis of the Microstructural Evolution during the Aging of Pyrolysis Oils from Biomass. Langmuir 22, 306–312. doi:10.1021/la051990a
Fratini, E., Faraone, A., Ridi, F., Chen, S.-H., and Baglioni, P. (2013). Hydration Water Dynamics in Tricalcium Silicate Pastes by Time-Resolved Incoherent Elastic Neutron Scattering. J. Phys. Chem. C 117, 7358–7364. doi:10.1021/jp312684p
Gardner, J. S., Ehlers, G., Faraone, A., and García SakaiSakai, V. (2020). High-resolution Neutron Spectroscopy Using Backscattering and Neutron Spin-echo Spectrometers in Soft and Hard Condensed Matter. Nat. Rev. Phys. 2, 103–116. doi:10.1038/s42254-019-0128-1
Goudarzi, A., Lin, L.-T., and Ko, F. K. (2014). X-ray Diffraction Analysis of Kraft Lignins and Lignin-Derived Carbon Nanofibers. J. Nanotechnol. Eng. Med. 5, 021006. doi:10.1115/1.4028300
Johnston, D. C. (2006). Stretched Exponential Relaxation Arising from a Continuous Sum of Exponential Decays. Phys. Rev. B 74. doi:10.1103/PhysRevB.74.184430
Liu, Y. C., Sheu, E. Y., Chen, S. H., and Storm, D. A. (1995). Fractal Structure of Asphaltenes in Toluene. Fuel 74, 1352–1356. doi:10.1016/0016-2361(95)00098-P
Noferini, D., Faraone, A., Rossi, M., Mamontov, E., Fratini, E., and Baglioni, P. (2019). Disentangling Polymer Network and Hydration Water Dynamics in Polyhydroxyethyl Methacrylate Physical and Chemical Hydrogels. J. Phys. Chem. C 123, 19183–19194. doi:10.1021/acs.jpcc.9b04212
Oasmaa, A., and Kuoppala, E. (2003). Fast Pyrolysis of Forestry Residue. 3. Storage Stability of Liquid Fuel. Energy Fuels 17, 1075–1084. doi:10.1021/ef030011o
Oasmaa, A., Kuoppala, E., and Solantausta, Y. (2003). Fast Pyrolysis of Forestry Residue. 2. Physicochemical Composition of Product Liquid. Energy Fuels 17, 433–443. doi:10.1021/ef020206g
R. P. Overend, and E. Chornet (Editors) (1999). Biomass, a Growth Opportunity in green Energy and Value-Added Products: Proceedings of the 4th Biomass Conference of the Americas: Oakland Marriott City Center. 1st ed edn. (Oakland, California, USAKidlington, Oxford, UK: Pergamon). Meeting Name: Biomass Conference of the Americas OCLC: ocm42458275.
Park, S., Baker, J. O., Himmel, M. E., Parilla, P. A., and Johnson, D. K. (2010). Cellulose Crystallinity index: Measurement Techniques and Their Impact on Interpreting Cellulase Performance. Biotechnol. Biofuels 3. doi:10.1186/1754-6834-3-10
Ringer, M., Putsche, V., and Scahill, J. (2006). Large-scale Pyrolysis Oil Production: A Technology Assessment and Economic Analysis. U.S. Department of Energy Office of Scientific and Technical Information. doi:10.2172/894989 Large-Scale Pyrolysis Oil Production: A Technology Assessment and Economic Analysis.
Scholze, B., Hanser, C., and Meier, D. (2001). Characterization of the Water-Insoluble Fraction from Fast Pyrolysis Liquids (Pyrolytic Lignin). J. Anal. Appl. Pyrolysis 58-59, 387–400. doi:10.1016/S0165-2370(00)00173-X
Senses, E., Tyagi, M., Pasco, M., and Faraone, A. (2018). Dynamics of Architecturally Engineered All-Polymer Nanocomposites. Acs Nano 12, 10807–10816. doi:10.1021/acsnano.8b02514
SipiläSipila, K., Kuoppala, E., FagernäsFagernas, L., and Oasmaa, A. (1998). Characterization of Biomass-Based Flash Pyrolysis Oils. Biomass and Bioenergy 14, 103–113. doi:10.1016/S0961-9534(97)10024-1
Tavagnacco, L., Chiessi, E., Zanatta, M., Orecchini, A., and Zaccarelli, E. (2019). Water-polymer Coupling Induces a Dynamical Transition in Microgels. J. Phys. Chem. Lett. 10, 870–876. doi:10.1021/acs.jpclett.9b00190
Teixeira, J., Bellissent-Funel, M.-C., Chen, S. H., and Dianoux, A. J. (1985). Experimental Determination of the Nature of Diffusive Motions of Water Molecules at Low Temperatures. Phys. Rev. A. 31, 1913–1917. doi:10.1103/PhysRevA.31.191310.1103/physreva.31.1913
Williams, G., and Watts, D. C. (1970). Non-symmetrical Dielectric Relaxation Behaviour Arising from a Simple Empirical Decay Function. Trans. Faraday Soc. 66, 80. doi:10.1039/tf9706600080
Yoshida, K., Yamaguchi, T., Kittaka, S., Bellissent-Funel, M.-C., and Fouquet, P. (2008). Thermodynamic, Structural, and Dynamic Properties of Supercooled Water Confined in Mesoporous Mcm-41 Studied with Calorimetric, Neutron Diffraction, and Neutron Spin echo Measurements. J. Chem. Phys. 129, 054702. doi:10.1063/1.2961029
Keywords: pyrolysis oil, lignin aggregation, neutron scattering, water dynamics, confined water, lignin dynamics
Citation: Bonini M, Fratini E and Faraone A (2021) Dynamics of Water and Other Molecular Liquids Confined Within Voids and on Surface of Lignin Aggregates in Aging Bio Crude Oils. Front. Chem. 9:753958. doi: 10.3389/fchem.2021.753958
Received: 05 August 2021; Accepted: 26 October 2021;
Published: 17 December 2021.
Edited by:
Hideki Seto, High Energy Accelerator Research Organization, JapanReviewed by:
Yangyang Wang, Oak Ridge National Laboratory (DOE), United StatesAlejandro Gil-Villegas, University of Guanajuato, Mexico
Copyright © 2021 Bonini, Fratini and Faraone. This is an open-access article distributed under the terms of the Creative Commons Attribution License (CC BY). The use, distribution or reproduction in other forums is permitted, provided the original author(s) and the copyright owner(s) are credited and that the original publication in this journal is cited, in accordance with accepted academic practice. No use, distribution or reproduction is permitted which does not comply with these terms.
*Correspondence: Emiliano Fratini, emiliano.fratini@unifi.it; Antonio Faraone, afaraone@nist.gov