The Rho GTPase exchange factor Vav2 promotes extensive age-dependent rewiring of the hair follicle stem cell transcriptome
 L. Francisco Lorenzo-Martín1,2,3*†
  Xosé R. Bustelo1,2,3*
- 1Molecular Mechanisms of Cancer Program, Centro de Investigación del Cáncer, Consejo Superior de Investigaciones Científicas (CSIC) and University of Salamanca, Salamanca, Spain
- 2Instituto de Biología Molecular y Celular del Cáncer, CSIC and University of Salamanca, Salamanca, Spain
- 3Centro de Investigación Biomédica en Red de Cáncer (CIBERONC), Salamanca, Spain
Both the number and regenerative activity of hair follicle stem cells (HFSCs) are regulated by Vav2, a GDP/GTP exchange factor involved in the catalytic stimulation of the GTPases Rac1 and RhoA. However, whether Vav2 signaling changes in HFSCs over the mouse lifespan is not yet known. Using a mouse knock-in mouse model, we now show that the expression of a catalytically active version of Vav2 (Vav2Onc) promotes an extensive rewiring of the overall transcriptome of HFSCs, the generation of new transcription factor hubs, and the synchronization of many transcriptional programs associated with specific HFSC states and well-defined signaling pathways. Interestingly, this transcriptome rewiring is not fixed in time, as it involves the induction of 15 gene expression waves with diverse distribution patterns during the life of the animals. These expression waves are consistent with the promotion by Vav2Onc of several functional HFSC states that differ from those normally observed in wild-type HFSCs. These results further underscore the role of Vav2 in the regulation of the functional state of HFSCs. They also indicate that, unlike other Vav2-dependent biological processes, the signaling output of this exchange factor is highly contingent on age-dependent intrinsic and/or extrinsic HFSC factors that shape the final biological readouts triggered in this cell type.
Introduction
HFSCs are essential for the homeostatic balance of the skin (Blanpain and Fuchs, 2006; Blanpain and Fuchs, 2009). They are located in the bulge area of the hair follicle, from which they migrate and progressively differentiate to give rise to the interfollicular, sebaceous, and hair follicle lineages when the skin has to be regenerated due to wounds or other traumas (Blanpain and Fuchs, 2006; Cotsarelis, 2006; Fuchs, 2008; Blanpain and Fuchs, 2009). Consequently, alterations in the number and/or normal functions of these cells contribute to skin regenerative defects, tumorigenic processes, and aging (Schober and Fuchs, 2011; Doles et al., 2012; Hsu et al., 2014). It is therefore of paramount importance to decipher the biological and molecular mechanisms that modulate their numbers, long-term stability, and functional states.
Most Rho GTPases work as molecular switches depending on the type of guanosine nucleotide bound to them (Bustelo et al., 2007). When bound to GDP, these proteins are in an inactive conformation that is not compatible with proximal downstream effector binding. In addition, Rho GTPases are sequestered in the cytosol due to their physical interaction with Rho GDP dissociation inhibitors. However, when in the GTP-bound state, Rho GTPases are unleashed from Rho GDP dissociation inhibitors, interact with a large spectrum of proximal effectors, and eventually promote the stimulation of a wide variety of intracellular functions, such as cytoskeletal remodeling, proliferation, and differentiation (Bustelo et al., 2007). The transition of Rho GTPases from the GDP-bound to the GTP-bound state is catalyzed by GDP/GTP exchange factors (GEF), while the reverse inactivation step is mediated by the GTPase activating proteins (Bustelo et al., 2007). Numerous Rho GTPase have been implicated in regulation of HFSC functions; for instance, Rac1 plays roles in the maintenance of a fully functional HFSC reservoir (Benitah et al., 2005; Chrostek et al., 2006; Castilho et al., 2007; Tscharntke et al., 2007; Chai et al., 2010), RhoA mediates the proliferation and migration of HFSCs (Zhan et al., 2016; Wang et al., 2017), and Cdc42 regulates the fate of epidermal progenitor cells (Wu et al., 2006). More recently, we demonstrated that Vav2, a GEF for Rac1 and RhoA, contributes to regulate the number, responsiveness to stimuli, and functionality of HFSCs (Lorenzo-Martín et al., 2022). This regulation is associated with transcriptional programs that impinge on the proliferation, pluripotency, and quiescence of HFSCs in early postnatal periods (e.g., in 2.5-month-old mice) (Lorenzo-Martín et al., 2022). Consistent with this, we found that the expression of a constitutively active version of Vav2 (referred to hereafter as Vav2Onc) in a knock-in mouse model leads to increased numbers of HFSCs and more potent skin regenerative responses upon wound healing or hair depilation (Lorenzo-Martín et al., 2022). The opposite effects are observed in mice lacking Vav2 or the related Vav3 protein. Vav2Onc also changes the transcriptome program of the skin cancer stem cells, including the activation of gene signatures directly associated with the undifferentiated and quiescent state of HFSCs (Lorenzo-Martín et al., 2022).
We have previously shown that the transcriptional program of HFSCs changes quite extensively from early postnatal phases to the adult period in mice (Lorenzo-Martín and Bustelo, 2020). Specifically, we have detected several age-specific gene expression waves associated with functions related to proliferation, differentiation, and aging (Lorenzo-Martín and Bustelo, 2020). These results raise several intertwined questions regarding the impact of Vav2Onc on the HFSC transcriptome: does Vav2Onc promote an age-independent transcriptional program based on its chronically activated state? Alternatively, does Vav2Onc drive a transcriptional program that is subject to age-dependent changes, analogous to those found in normal HFSCs (Lorenzo-Martín and Bustelo, 2020)? If so, does Vav2Onc only promote the amplification of the normal gene expression waves in HFSCs, or does it completely rewire them? To tackle these issues, we have now performed genome-wide expression analyses on HFSCs purified from control or Vav2Onc-expressing mice at six different time points of aging (ranging from 18 days to 12 months). By coupling this approach to the use of several in silico techniques, we obtained an in-depth overview of the age-dependent dynamics of the transcriptome of HFSCs in both genotypes.
Materials and methods
Ethics statement
All mouse experiments were performed according to protocols approved by the Bioethics Committee of the University of Salamanca and the animal experimentation authorities of the autonomous government of Castilla y León (Spain). No patients or patient-derived samples were used in this work.
Animal studies
Control and Vav2Onc/Onc mice (Fabbiano et al., 2014; Lorenzo-Martín et al., 2020a) had a C57BL/6 J genetic background. Animals were kept in ventilated rooms in a pathogen-free facility under controlled temperature (23°C), humidity (50%) and illumination (12-hour-light/12-hour-dark cycle) conditions.
Skin stem cell isolation
Hair follicle stem cells were isolated as previously described (Janich et al., 2011). Briefly, mouse back skin was digested in 0.25% trypsin (Thermo Fisher Scientific, cat. # 25200056) overnight at 4°C to collect the keratinocytes from the epidermis. This cell suspension was then filtered, resuspended in EMEM (Lonza, cat. # BE06-174G) supplemented with 15% fetal bovine serum (Thermo Fisher Scientific, cat. # 10500064) and incubated for 30 min on ice with biotin-conjugated antibodies to CD34 (1:50, eBioscience, cat. # 13-0341-85) followed by another 30 min incubation with APC-conjugated streptavidin (1:300, BD Biosciences, cat. # 554067) and PE-conjugated antibodies to CD49f (1:200, AbD Serotec, cat. # MCA699PE). Cells were stained with DAPI (4′,6-diamidino-2-phenylindole) (0.1 ng/μL, Sigma-Aldrich, cat. #D9542) for 5 min to exclude dead cells. Cells positive for CD34 and CD49f were isolated using a FACSAria III flow cytometer (BD Biosciences) and analyzed with the FlowJo software.
RNA extraction and transcriptome profiling
HFSCs were lysed in RLT buffer (QIAGEN, cat. # 74004), and RNA was extracted using the QIAGEN RNeasy Micro Kit (QIAGEN, cat. # 74004) according to the manufacturer’s instructions. Purified RNA was processed as indicated elsewhere (Menacho-Marquez et al., 2013) and hybridized to Affymetrix GeneChip Mouse Gene 1.0 ST microarrays. R (version 4.1.2). Importantly, WT and Vav2Onc/Onc HFSCs isolation, RNA extraction and transcriptome profiling were performed in parallel. Thus, even though we have already published an in-depth analysis of WT-only HFSC data (Lorenzo-Martín and Bustelo, 2020), the latter is fully comparable with the Vav2Onc dataset reported here. Perl software (version 5.26.2) was used to perform the bioinformatic analyses as previously described (Lorenzo-Martín and Bustelo, 2020). Signal intensity values were obtained from CEL files after applying the Robust Multichip Average (RMA) function from the “affy” package for background adjustment, quantile normalization and summarization (Irizarry et al., 2003).
Establishment of gene expression patterns
Both Chi–squared and fold-change (FC) thresholds were used to distinguish probe sets with dynamic and stable behavior along the time–points interrogated, as previously reported (Toufighi et al., 2015). Briefly, for each probe set, a chi–squared test with N–1 degrees of freedom were applied as follows:
where
Gene set annotation and enrichment analyses
Differentially expressed genes between genotypes were identified using linear models for microarray data (limma) (Ritchie et al., 2015), adjusting p values for multiple comparisons by applying the Benjamini–Hochberg correction method (Reiner et al., 2003). Functional annotation was performed using Metascape (Tripathi et al., 2015) for biological processes, and ToppFun (Chen et al., 2009) for molecular functions. An FDR q-value of 0.05 was set as threshold for statistical significance. Single-sample gene set enrichment analysis (ssGSEA) (Subramanian et al., 2005; Reich et al., 2006) was used to calculate the fitness of different hallmark, gene ontology, and HFSC signatures across time and genotypes. Hallmark and gene ontology signatures were obtained from the Molecular Signatures Database (Liberzon et al., 2015). The HFSC gene sets were obtained from (Lien et al., 2011). The time-course enrichment scores for these signatures were used to build the signature correlation matrix, calculated through corrplot (https://github.com/taiyun/corrplot). Correlations were considered statistically significant when the Pearson coefficient corresponded to p ≤ 0.05. Functional clusters were established when every pairwise correlation within a group of signatures was found significant.
Weighted correlation network analyses
To find the best representatives of every gene expression pattern, the WGCNA R package was used (Langfelder and Horvath, 2008). Each weighted gene network was constructed from the corresponding expression matrix using the blockwiseModules function. The pickSoftThreshold function was used to select the soft thresholding power according to network topology. Consensus module detection within each expression pattern was omitted and kept to one module, as the number of clusters had been already optimized. The heatmap plot depicting the adjacency matrix was created with the TOMplot function. To calculate the intramodular connectivity for each gene, the whole network connectivity was computed for each expression pattern through the intramodularConnectivity function. Hubs were defined as the 10% most connected genes within each expression pattern. The known functional interactions among hubs were obtained through the String tool (Szklarczyk et al., 2015) and represented using Cytoscape (Shannon et al., 2003). Transcription factor classification was performed using ToppFun (Chen et al., 2009). The iRegulon software was used to determine the transcription factor binding motifs in the promoters of the co-regulated genes (Janky et al., 2014). A collection of 9713 position weight matrices (PWMs) was applied to analyze 10 kb centered around the TSS. With a maximum false discovery rate (FDR) on motif similarity below 0.001, we performed motif detection, track discovery, motif-to-factor mapping, and target detection.
Statistics
The type of statistical tests performed, and the statistical significance, are indicated for each panel either in the figure legends or in the main text. Data normality and equality of variances were analyzed with Shapiro-Wilk and Bartlett’s tests, respectively. Parametric distributions were analyzed using Student’s t-test. Sidak’s multiple comparison test was used when comparing different sets of means. The chi-squared test was used to determine the significance of the differences between expected and observed frequencies. The Kolmogorov-Smirnov test was used to compare probability distributions. In all cases, values were considered significant when p ≤ 0.05. Data obtained are given as the mean ± SEM unless otherwise indicated.
Data availability
Microarray data corresponding to WT HFSCs were obtained from the GEO database (https://www.ncbi.nlm.nih.gov/geo/) entry GSE137176 (Lorenzo-Martín and Bustelo, 2020). The Vav2Onc data reported in this paper were merged with the former and deposited under the accession number GSE140152.
Materials availability
All relevant data are available from the corresponding author upon reasonable request. A Materials Transfer Agreement could be required in the case of potential commercial applications.
Results
Vav2Onc regulates stem cell transcriptome dynamics
To investigate the effect of the catalytic hyperactivation of Vav2 in HFSCs, we decided to monitor the time-dependent evolution of the transcriptome of HFSCs isolated from wild-type (WT) and Vav2Onc/Onc knock-in mice. The latter mouse strain, which has been described in previous publications from our lab (Fabbiano et al., 2014; Lorenzo-Martín et al., 2020a), expresses a Vav2 mutant protein (herein, Vav2Onc) that exhibits constitutive GEF activity due to the removal of the N-terminal calponin-homology (CH) and acidic (Ac) domains (Figure 1A). These two regions play critical roles in establishing the intramolecular interactions that inhibit the catalytic and most adaptor functions of Vav2 when the protein is not tyrosine-phosphorylated (Schuebel et al., 1998; Zugaza et al., 2002; Bustelo, 2014; Rodriguez-Fdez and Bustelo, 2019). Importantly, the mutant allele that encodes Vav2Onc is under the control of the endogenous Vav2 promoter, thus ensuring that the mutant protein has a tissue distribution and expression levels comparable to those found in the case of the WT counterpart as demonstrated in previous reports (Fabbiano et al., 2014; Lorenzo-Martín et al., 2020a; Rodriguez-Fdez et al., 2020). As Vav2onc maintains the adaptor functions that are mediated by the C-terminal SH3–SH2–SH3 cassette of the protein (Figure 1A), the effects elicited by its expression must be catalytic-dependent. Consistent with this, we have previously shown that Vav2Onc/Onc mice exhibit phenotypes opposite to those found in mice expressing a catalytically impaired Vav2 protein (L332A mutant) (Lorenzo-Martín et al., 2020b; Rodriguez-Fdez et al., 2020).
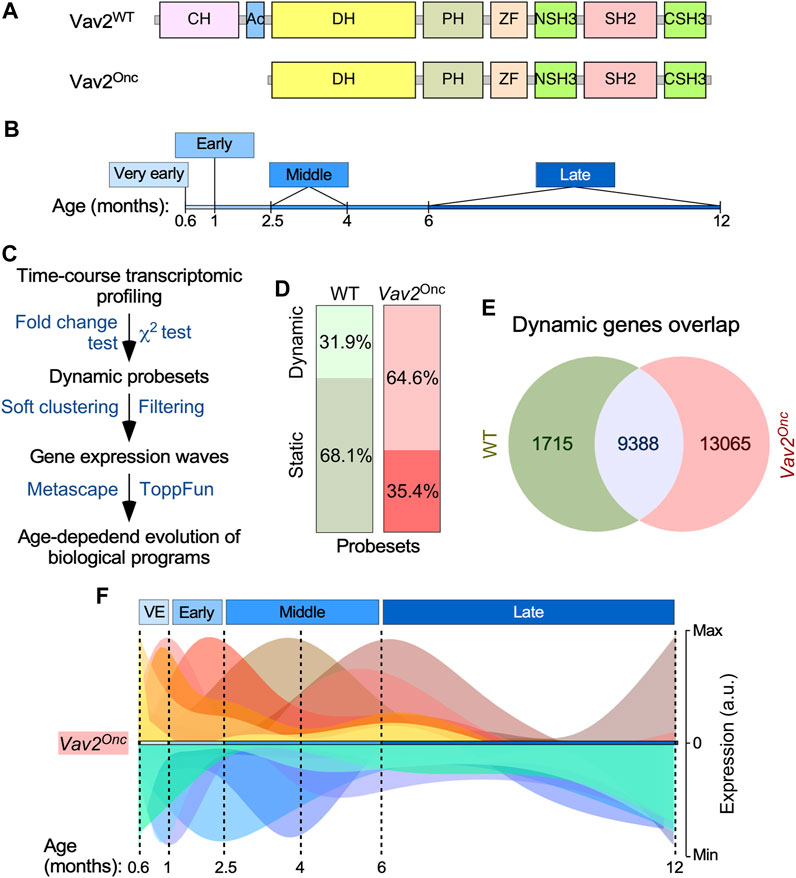
FIGURE 1. Vav2Onc regulates HFSC transcriptome dynamics (A) Scheme of the structure of full-length Vav2 and Vav2Onc. Ac, acidic; CH, calponin-homology; CSH3, C-terminal Src-homology 3; DH, Dbl-homology (catalytic domain); NSH3, most N-terminal Src-homology 3; PH, pleckstrin-homology; SH2, Src-homology 2; WT, wild-type; ZF, zinc finger of the C1 subtype. (B) Time-windows selected to carry out the microarray analysis using samples from HFSCs. (C) Wet-lab and in silico pipeline used to identify the time-dependent transcriptome of HFSCs. (D) Distribution of the probe sets of the Affymetrix Mouse Gene 1.0 ST array between the dynamic and static groups of HFSCs of indicated genotypes. (E) Venn diagram showing the overlap in the dynamic probe sets found in the transcriptome of WT and Vav2Onc/Onc HFSCs. (F) Graphical representation of the gene expression waves found in Vav2Onc/Onc HFSCs. The diagram for the gene expression waves of WT HFSCs can be found in (Lorenzo-Martín and Bustelo, 2020).
We used flow cytometry to isolate HFSCs (CD34+ Itgα6+) from mice at six time points at different ages (given in months, M), with one time point each classified as very early (0.6-M; 18 days) or early (1-M), and two time points each classified as middle (2.5-M and 4-M) or late (6-M and 12-M) (Figure 1B). The 0.6-M time point corresponds to the earliest stage at which the CD34+ Itgα6+ population can be clearly identified by flow cytometry (Lorenzo-Martín and Bustelo, 2020). Importantly, WT and Vav2Onc/Onc HFSCs isolation and downstream processing were performed in parallel. Thus, even though we have already published an in-depth analysis of WT-only HFSC data (Lorenzo-Martín and Bustelo, 2020), the latter is fully comparable with the Vav2Onc dataset reported here. In this regard, it is also relevant to note that we did not find any differences in hair cycle staging between WT and Vav2Onc/Onc mice (data not shown).
Genome-wide expression analyses of total RNA isolated from HFSCs were followed by computational approaches specifically designed to identify genes undergoing statistically significant expression changes in at least one of the six time points interrogated (Figure 1C). As previously described (Lorenzo-Martín and Bustelo, 2020), these analyses showed that 31.9% of all the mRNAs expressed in WT HFSCs display a dynamic behavior across time, according to both χ2 distribution and expression fold-change (≥2-fold) criteria (Figure 1D, left column) (Lorenzo-Martín and Bustelo, 2020). In contrast, Vav2Onc/Onc HFSCs exhibited a much higher percentage (64.6%) of dynamically regulated genes according to the same selection criteria (Figure 1D, right column). These include 85% of the dynamic transcriptome of WT HFSCs plus an additional subset of 13,065 probe sets that are specific for Vav2Onc/Onc HFSCs (Figure 1E).
We next performed soft clustering to visualize all the dynamically regulated genes that were grouped together in coherent gene expression waves (Figure 1F, see (Lorenzo-Martín and Bustelo, 2020) for WT reference). This was coupled with the use of additional in silico tools to allow the identification of the biological processes (GO terms) that were associated with each of those gene expression waves. We found that the HFSCs from WT (14 waves (Lorenzo-Martín and Bustelo, 2020)) and Vav2Onc/Onc mice (15 waves) exhibit similar numbers of time-dependent gene expression waves (Figure 1F, Supplementary Table S1, see (Lorenzo-Martín and Bustelo, 2020) for WT reference). These waves are deconvoluted in Figure 2 to better display the characteristics of each. In this figure, we present the waves classified according to the main time point at which the wave reaches the maximal expression peak value. Each wave is designated with a + or a – symbol depending on whether it contains upregulated (light red waves) or downregulated (light blue waves) genes. In addition, each wave was assigned a reference number that indicates the time point of the maximal expression peak of the wave (e.g [+6] indicates maximal upregulation of gene expression at 6 months). The reference numbers for multi-peak waves include the number of each peak, always placing the highest fold-change peak in the first position) (e.g [+1 + 2.5+6]). Finally, we have included the total number of genes and main GO terms associated with each identified wave (with the size of the letters directly related with the p-value of each identified GO term) (Figure 2, see (Lorenzo-Martín and Bustelo, 2020) for WT reference). We found that most of the identified waves in both genotypes have more than one gene expression peak (e.g., waves [+0.6+6] [+2.5+6] [+1+2.3+6] [–1–4], or [–4–12] found in WT HFSCs) (Figure 2, see (Lorenzo-Martín and Bustelo, 2020) for WT reference). The only exceptions to this trend are waves that distribute within the very early time points (e.g., waves [+0.6] and [+0.6+1] in both genotypes) and the late time point (wave [–12] in both genotypes) (Figure 2, see (Lorenzo-Martín and Bustelo, 2020) for WT reference). However, we also found that the waves in WT HFSCs or Vav2Onc/Onc HFSCs are quite different in terms of size (number of genes involved), shape (distribution in time), and encoded functions (Figure 2, see (Lorenzo-Martín and Bustelo, 2020) for WT reference). For instance, we observed that the waves in WT HFSCs contain similar gene content in the time-windows analyzed (very early phase: 3763 probe sets [34.9%]; early phase: 2455 probe sets [22%]; middle phase: 1162 probe sets [10.8%]; late phase: 3405 probe sets [31.6%]) (Figure 2, see (Lorenzo-Martín and Bustelo, 2020) for WT reference). In contrast, in the Vav2Onc/Onc HFSCs, about half of all the dynamically regulated genes are concentrated in the “late” time point (13425 probe sets, 59.6%), while the rest of phases exhibit much lower gene content (very early: 4061 probe sets [18%]; early: 2485 probe sets [11%]; middle: 2542 probe sets [11.3%]) (Figure 2, see (Lorenzo-Martín and Bustelo, 2020) for WT reference). The distribution of the up- and downregulated genes also changes depending on the genotype of the analyzed HFSCs. Accordingly, the ratio of upregulated versus downregulated probe sets at the late time point is much higher in Vav2Onc/Onc HFSCs (9913 vs. 3512, 2.8 ratio) than in WT HFSCs (1489 vs. 1916, 0.8 ratio). Inversions in the ratios of up- and downregulated genes are also seen at the very early (1.2 vs. 0.62 ratios) and early (0.82 vs. 1.3) phases between Vav2Onc/Onc HFSCs and WT HFSCs (Figure 2, see (Lorenzo-Martín and Bustelo, 2020) for WT reference). In contrast, the ratios for genes that are mainly regulated in the middle phase are more similar (0.8 and 0.7, for Vav2Onc/Onc HFSCs and WT HFSCs, respectively). Overall, the gene expression waves induced in Vav2Onc HFSCs are more enriched in upregulated genes than those in WT HFSCs. Finally, we have observed that the wave shape differs greatly between WT and Vav2Onc/Onc HFSCs (Figure 2, see (Lorenzo-Martín and Bustelo, 2020) for WT reference). This feature is most conspicuous for the waves of upregulated gene expression at the middle and late time points, which mostly follow a bimodal or a single-peak pattern for WT HFSCs or Vav2Onc/Onc HFSCs, respectively (Figure 2, see (Lorenzo-Martín and Bustelo, 2020) for WT reference). These shape changes can be illustrated by the single peak–enriched waves of Vav2Onc/Onc HFSCs at [+2.5] [+4], and [+6], which are in sharp contrast to the frequently observed bimodal waves of WT HFSCs at [+1+2.5+6] [+2.5+6], and [+6+2.5] (Figure 2, see (Lorenzo-Martín and Bustelo, 2020) for WT reference). Interestingly, this disparity in wave shape is less accentuated at the very early and the late time points (see, for example, the waves [+0.6] [+0.6+1], and [–12] from WT or Vav2Onc/Onc HFSCs; Figure 2, see (Lorenzo-Martín and Bustelo, 2020) for WT reference). The shapes of the waves of downregulated genes are also more similar in the HFSCs of both genotypes (Figure 2, see (Lorenzo-Martín and Bustelo, 2020) for WT reference).
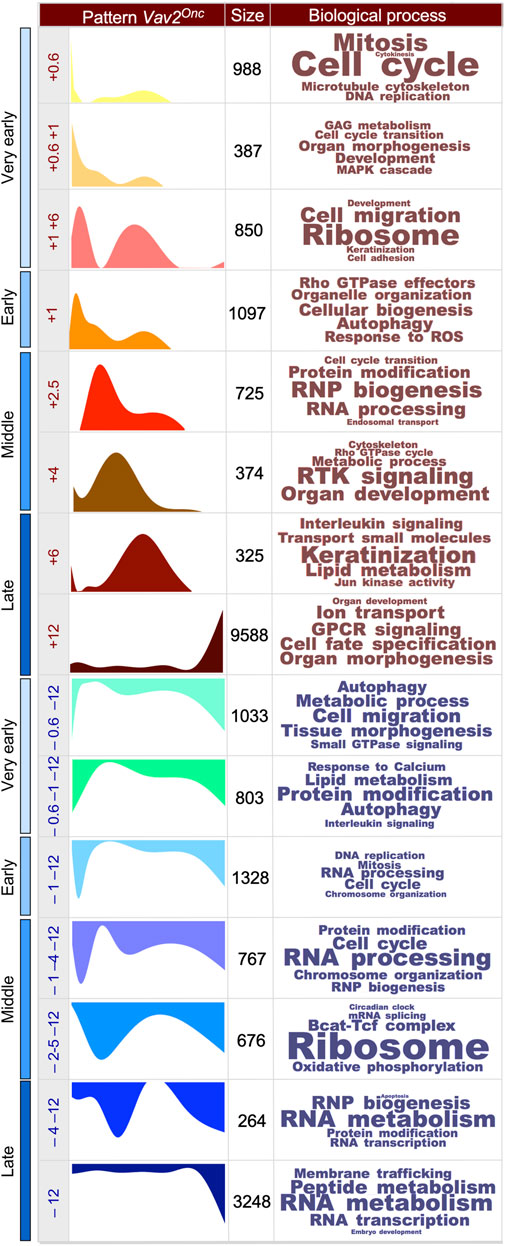
FIGURE 2. Scheme showing the expression waves found in Vav2Onc/Onc HFSCs. The following information is indicated from left to right: (i) the experimental time point (very early, early, middle, late) in which the indicated gene expression wave is detected; (ii) the time distribution of each wave, given in age of mouse in months (M), of 0.6 M (e.g., 18-days), 1 M, 2.5 M, 4 M, 6 M, and 12 M; (iii) a graphic representation of the indicated gene expression wave along the experimental time points used in this study; (iv) the number of probe sets associated with the indicated gene expression waves; and (v) the top-enriched biological and molecular processes (with font size proportional to the–log(P) obtained for each). Each wave is designated as + or − to indicate upregulated (light red waves) or downregulated (light blue waves) genes, respectively. A reference number indicating the time point at which the maximal expression peak of the wave occurs (e.g [+6] or [–12]) is given, whereby numbers for multi-peak waves indicate the highest fold-change peak in the first position (e.g [+1 + 2.5+6] shows that the highest peak was at 1 M). WT HFSCs data can be found in (Lorenzo-Martín and Bustelo, 2020).
We also observed significant differences in the functions associated with the gene expression waves in the HFSCs of each genotype. Thus, although some functional overlap is seen at specific time points (e.g., the cell growth, ribosomal biosynthesis, autophagy-related functions, and inflammatory-related functions in waves [+0.6] [+0.6+6] [+12], and [+6+2.5]) (Figure 2, see (Lorenzo-Martín and Bustelo, 2020) for WT reference), the spectrum of wave-associated functions is highly genotype-dependent (Figure 2, see (Lorenzo-Martín and Bustelo, 2020) for WT reference). In a few cases, the same functions are detected at different time windows (e.g., ion transport is in wave [+2.5+6] in WT HFSCs but in wave [+12] in Vav2Onc/Onc HFSCs; keratinocyte differentiation is in wave [+1+2.5+6] in WT HFSCs but in wave [+6] in Vav2Onc/Onc HFSCs). Collectively, these results indicate that: 1) Vav2Onc promotes a significant rewiring of the age-dependent transcriptional program of HFSCs in terms of total gene numbers, time distribution of the waves of differentially expressed genes, and overall functions targeted; and 2) even though Vav2Onc is chronically activated in a cell stimulus-independent manner, it does not engage a fixed transcriptional program in HFSCs. This suggests that, in addition to the intrinsic catalytic activity, the impact of Vav2Onc on HFSC biology is also influenced by other time-dependent intrinsic or extrinsic factors that contribute to shaping its impact on the transcriptome of HFSCs.
Analyzing the functions associated with the gene expression waves also shed further light on the impact of Vav2Onc on HFSC biology. Thus, during the very early time point, the upregulated gene expression waves of WT HFSCs encode functions related to cell growth, IGF (insulin growth factor) and mTORC signaling, extracellular matrix interaction regulators, and several metabolic routes. This spectrum of functions is probably associated with the expansion in the numbers of HFSCs that is usually observed between postnatal days 18 and 30 in mice (Lorenzo-Martín and Bustelo, 2020). In contrast, the waves associated with downregulation events contain genes encoding proteins involved in small GTPase signaling, cell adhesion, protein modification, and autophagy. This program is substituted as the animals age by the upregulation of genes involved in catabolic (e.g., autophagy, ubiquitination), cell differentiation, cell adhesion, and inflammatory processes (Figure 2, see (Lorenzo-Martín and Bustelo, 2020) for WT reference). In parallel, we observed downmodulation of genes linked to cell cycle regulation, receptor tyrosine kinase (RTK) signaling, ribogenesis, and metabolic programs (TCA cycle, sterol, and small molecule biosynthesis) (Figure 2, see (Lorenzo-Martín and Bustelo, 2020) for WT reference). This pattern can be linked to the post-mitotic telogen phase of the skin (which takes place in approx. 2.5-month-old mice) and with the subsequent acquisition of aging features by HFSCs at later stages of the time-course analyzed in this study (Doles et al., 2012; Lorenzo-Martín and Bustelo, 2020). A comprehensive description of the time-dependent evolution of all these functions can be found elsewhere (Lorenzo-Martín and Bustelo, 2020). In the case of Vav2Onc HFSCs, we find similar, significantly amplified functional features related to cell growth upregulation at the very early time point (Figure 2, see (Lorenzo-Martín and Bustelo, 2020) for WT reference). In contrast, the downregulation of cell growth-related genes that takes place at the early time point is less acute in these cells than in the controls (Figure 2, see (Lorenzo-Martín and Bustelo, 2020) for WT reference). At later time points, the upregulated waves of Vav2Onc-expressing HFSCs include a large variety of functions not seen in the WT counterparts, such as signaling pathways for MAPK [+0.6+1], RTK [+2.5+6], Rho GTPase [+2.5+6], Jun-N-terminal (JNK) [+6+2.5], G-coupled protein receptors (GPCR) [+12], and ribonucleoprotein (RNP) biogenesis [+1+2.5+6] (Figure 2, see (Lorenzo-Martín and Bustelo, 2020) for WT reference). This indicates that, from a signaling, metabolic, and developmental perspective, the Vav2Onc/Onc HFSCs fluctuate between functional states during the time-courses analyzed, and that these fluctuations are quite different from those found in WT HFSCs except at the very early time point. The functions associated with the waves of gene downregulation are also quite different between WT and Vav2Onc/Onc HFSCs (Figure 2, see (Lorenzo-Martín and Bustelo, 2020) for WT reference). The most conspicuous functional change is the downmodulation of RNA- and ribosomal-related functions in Vav2Onc/Onc HFSCs starting at the middle time points (Figure 2, see (Lorenzo-Martín and Bustelo, 2020) for WT reference). Thus, these data indicate that Vav2Onc induces a large rewiring of the gene expression waves at the level of total gene numbers, time-dependent distribution of the waves, and functions involved. They also suggest that Vav2Onc favors the stepwise engagement of different HFSC functional states that are not usually seen in WT HFSCs at most time points.
Vav2Onc reshapes the time-dependent expression waves present in skin stem cells
Based on the extensive transcriptomal rewiring observed in the foregoing experiments, we decided to build a network map to better visualize the changes in wave localization of the age-regulated genes in the case of WT and Vav2Onc/Onc HFSCs. In this map, the gene expression waves found in WT and Vav2Onc/Onc HFSCs are depicted as green and red circles, respectively (Figure 3). In both cases, the size and darkness of the color of each wave are proportional to the total number of dynamically regulated probe sets of each wave and to the level of changes in gene probe localization seen between the WT and Vav2Onc/Onc conditions, respectively (Figure 3). The change in position of gene probes is further highlighted by the thickness of the arrows connecting the indicated WT and Vav2Onc/Onc HFSC waves (Figure 3). Finally, the circles also include information on the percentage of genes that are shared with waves of the opposite genotype (white peripheral areas) or of those that are just seen in the waves of a single genotype (gray peripheral areas) (Figure 3). Importantly, we also include the reference numbers assigned to the waves in Figure 2 to facilitate their identification in Figure 3.
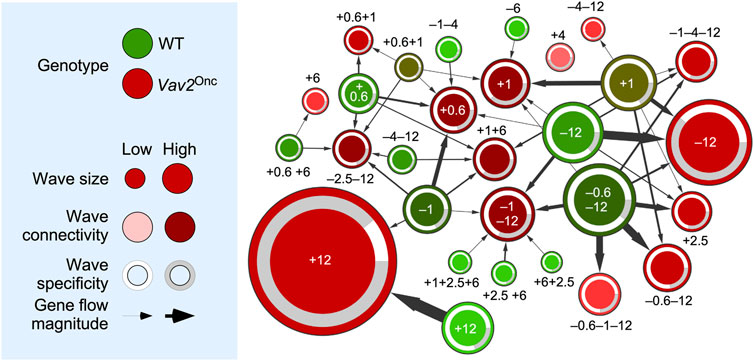
FIGURE 3. Vav2Onc reshapes the gene expression waves found in HFSCs. Left, summary of the parameters used in the network shown on the right. Right, dynamic flow network showing the relationship between WT (green) and Vav2Onc/Onc (red) gene expression waves (nodes). Each expression wave is identified by the position (0.6-to-12 months old) and orientation (upregulated [+] or downregulated [–]) of its main peak(s) indicated in Figure 2. Wave size (number of probe sets), connectivity (number of interacting clusters in terms of probe set sharing), specificity (number of probe sets that are not dynamic in the other genotype), and flow magnitude (number of probe sets that are shared between two clusters) are indicated.
These analyses revealed extensive repositioning of transcripts between the WT and Vav2Onc/Onc HFSC waves. This phenomenon is quite significant for the Vav2Onc/Onc waves at: 1) [+0.6], which also contains transcripts present in the WT waves [–1], [+0.6], [+0.6+1], [–1–4] and [+1]; 2) [+1], with transcripts present in the WT waves [+1], [+0.6+1], [–6], and [–12]; 3) [+1+6], with transcripts present in the WT waves [+0.6], [–1], [–1–4] [–12], and [–1–12]; and 4) [–1–12], with transcripts present in the WT waves [+1+2.5+6], [+2.5 +6], [+6+2.5], [–0.6–12], [–1], and [–12] (Figure 3). The Vav2Onc/Onc waves that were less affected with this reshuffling in the position of dynamically regulated genes include those at: 1) [+6], [–0.6–1–12], and [–4–12], whereby changes in position affected just one wave of each genotype; and 2) [+0.6+1] and [–0.6–12], whereby changes in position involved two waves (Figure 3). The Vav2Onc/Onc wave [+4] is the only one that does not exhibit any gene originally with respect to the WT waves (Figure 3). This wave is mainly composed of genes associated with RTK signaling, Rho GTPase signaling and functions, organ development, and metabolism (Figure 2, see (Lorenzo-Martín and Bustelo, 2020) for WT reference). Conversely, the WT waves [–0.6–12] and [+1] contained more genes that changed position in the Vav2Onc/Onc waves (with seven and six inter-wave changes in localization, respectively) (Figure 3). On the other hand, the WT waves with lower levels of gene changes include [+1+2.5+6] [+2.5+6] [+6+2.5] [–6] [–1–4], and [–12] (with a single inter-wave change in localization for each), although some content changes involved substantial numbers of transcripts (e.g., WT wave [+12]) (Figure 3). These changes in wave localization are not unidirectional, as subsets of mRNAs belonging to a specific WT wave can be found in different Vav2Onc/Onc HFSC waves (Figure 3). For example, the transcripts present in the WT wave [–1] are found in five different Vav2Onc/Onc waves ([+0.6], [+1+6], [+12], [–2.5–12], and [–1–12]) (Figure 3).
Importantly, the genes involved in this transcriptional rewiring might not necessarily keep the same expression pattern in the two genotypes (e.g., genes in the upregulated WT waves [+1+2.6+6] [+2.5+ 6] and [+6+2.5] are found in the downregulated Vav2Onc/Onc HFSC wave [–1–12], while genes in the downregulated WT HFSC wave [–6] are found in the upregulated Vav2Onc/Onc wave [+1]) (Figure 3). In other cases, different gene subsets of the same WT wave display the same and the opposite regulation in the Vav2Onc/Onc waves (e.g., genes in the WT wave [+1] that become located in Vav2Onc/Onc waves [+1], [+2.5], [+1+6], [–0.6–12], [–4–12], [–1–4–12] and [–12]) (Figure 3). We have also found that this rewiring is highly dependent on the time-window involved. Thus, most of the Vav2Onc/Onc waves that are distributed between the very early and middle time points contain genes that are also dynamically regulated under normal physiological conditions in WT HFSCs (Figure 3, see white areas in the peripheral band of each wave). In contrast, at the late time point, the Vav2Onc/Onc waves become enriched in genes that are not found dynamically regulated in the WT waves (Figure 3, see grey areas in the peripheral band of each wave). In fact, we estimated that ≈60% of all the dynamically regulated genes found in Vav2Onc/Onc HFSCs are non-dynamic in the case of WT HFSCs at this time point (e.g., see Vav2Onc/Onc HFSC waves [+12] and [–12]) (Figure 3). These data suggest that Vav2Onc first promotes an extensive rewiring of the transcriptional program of HFSCs and, subsequently, the emergence of transcriptional programs that are mostly Vav2Onc-dependent. This is associated with a total change in type and/or temporal distribution of biological processes in Vav2Onc-expressing HFSCs.
Vav2Onc promotes the synchronization of pathway-associated gene signatures
We have previously shown that the time-dependent evolution of the transcriptome of WT HFSCs is associated with specific patterns of co-regulation of genes signatures that are linked to well-defined hallmarks and HFSC-related biological and signaling processes (Lorenzo-Martín and Bustelo, 2020). This led us to: i) investigate the impact of chronic Vav2Onc signaling on the regulatory pattern of such gene signatures; and ii) focus on more specific functions rather than on those usually associated with the very generic GO terms used to classify the expression waves in Figure 2. To this end, we utilized the transcriptomal data obtained from WT and Vav2Onc/Onc HFSCs to carry out two concatenated in silico steps. First, we performed co-expression analyses to identify patterns of co-regulation of the gene elements of each interrogated gene signature throughout all time points used in our study (Lien et al., 2011; Liberzon et al., 2015) (Figure 4A, top). In these analyses, we can expect different types of distributions based on the obtained correlation coefficients r): Type 1, distributions with r centered around r ∼ 0, which indicates that the elements a gene signature do not follow stable coexpression trends; type 2 and 3, distributions skewed towards r > 0 (type 2) or r < 0 (type 3), indicating that a significant fraction of the genes is transcriptionally coregulated in one direction (positive or negative correlation); and, Type 4, bimodal distributions with r values both above and below 0, which indicate that subsets of genes of the same signature follow opposite expression patterns. The co-regulation of all gene elements of a given signature can be plotted using co-expression matrices, such as those shown in Figure 4B. Finally, we used single-sample gene set enrichment analyses (ssGSEA) for all the interrogated signatures and built co-expression matrices to pick up clusters of co-regulated or anti-regulated gene signatures in the transcriptome of WT and Vav2Onc/Onc HFSCs (Figure 4A, bottom).
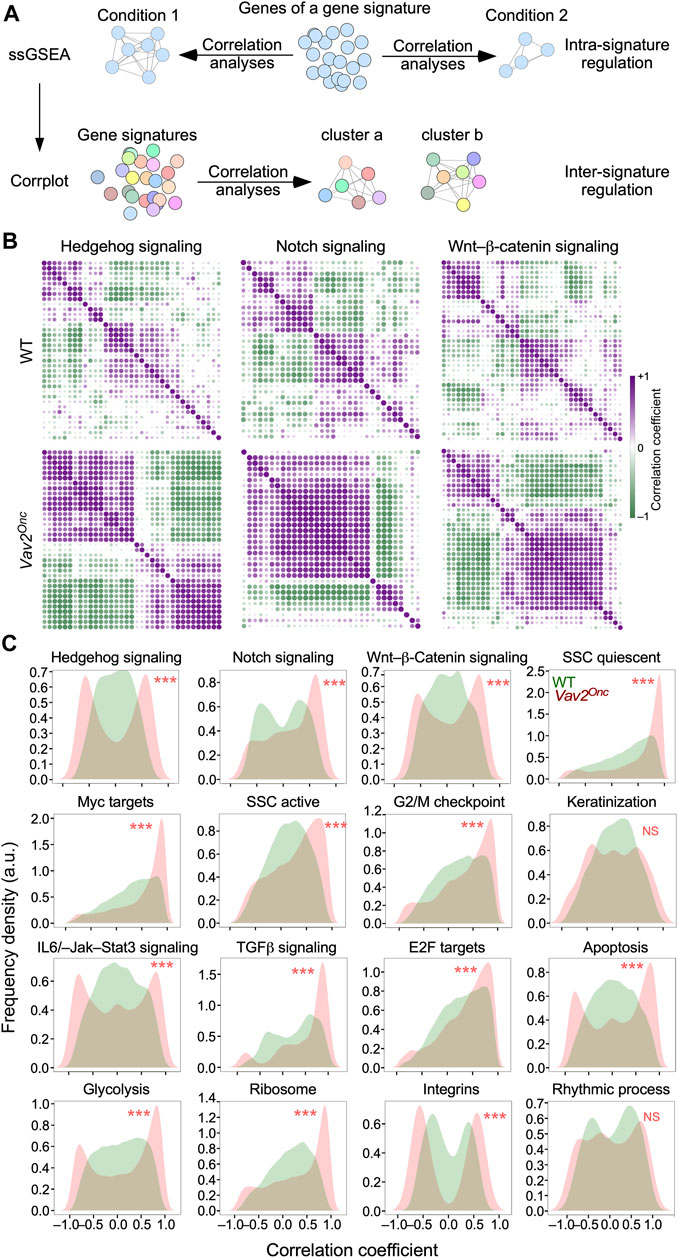
FIGURE 4. Vav2Onc promotes the synchronization of pathway-associated gene signatures (A) Scheme of the in silico analyses performed to identify intra-signature (top) and inter-signature (bottom) coregulatory events in the transcriptome of HFSCs. See main text for further details. (B) Co-expression matrices of the transcripts integrating the indicated gene signatures in WT (top) and Vav2Onc/Onc (bottom) HFSCs. The r value of a given pair of gene signature elements is shown as a purple or a green dot if the two genes are co-regulated (r > 0) or anti-regulated (r < 0), respectively. Dot size and color gradient reflects the magnitude of the Pearson correlation coefficient (r). (C) Density plots showing the distribution of r values in the coexpression matrices of indicated gene signatures in WT (green) and Vav2Onc/Onc (red) HFSCs. ***, p < 0.001 (Kolmogorov-Smirnov test). NS, not significant.
In the first step, we found that the elements (single genes) of most interrogated gene signatures follow a type 1 distribution (r ≈ 0) (Figure 4B, upper panel; Figure 4C, green graphs) and, to a lesser extent, type 4 bimodal patterns (Figure 4C, green graphs) in WT HFSCs. Examples of each of those distributions include the hedgehog and integrin gene signatures, respectively (Figure 4C, green graphs). In contrast, for Vav2Onc/Onc HFSCs, we observed a massive increase in the overall degree of co-regulation and/or anti-regulation of the elements of most gene signatures (Figure 4B, lower panels). This is due to the enhancement of either the co-regulation or anti-regulation previously seen in the time-dependent transcriptome of WT HFSCs (Figure 4B, compare the upper and lower levels). Due to this, the co-expression patterns found in Vav2Onc/Onc HFSCs show in most cases a stronger polarization towards the type 2 (r > 0) and type 4 (r ≈ ±1) distributions (Figure 4C, red graphs). Examples of each of those distributions are the elements of the epidermal stem cell quiescent signature and the hedgehog signaling signature, respectively (Figure 4C, red graphs). This is a general phenomenon, as it is observed in 14 of the 16 gene signatures interrogated in these analyses (Figure 4C, red graphs). The only exceptions to this trend are the gene signatures linked to keratinization and rhythmic processes (Figure 4C, red graphs). These data indicate that the expression of Vav2Onc increases the synchronization of gene expression of most functional gene signatures interrogated in this study.
Strikingly, using ssGSEA (Figure 4A, bottom panel), we observed that Vav2Onc also favors a very strong synchronization of the expression of several independent gene signatures (Figures 5A, B). Consistent with this, the 10 inter-gene signature clusters previously described in WT HFSCs (Lorenzo-Martín and Bustelo, 2020) become consolidated into just 3 clusters and a large macrocluster in Vav2Onc/Onc HFSCs (Figures 5A, B). As in our previous analyses (Figure 3), we observed an extensive reshuffling of the interrogated gene signatures from specific clusters of WT HFSCs to the new clusters found in Vav2Onc/Onc HFSCs (Figure 5A, see (Lorenzo-Martín and Bustelo, 2020) for WT reference). In fact, there is only one cluster of co-regulated gene signatures that is identical in the HFSCs of both genotypes (namely, clusters cWT and bOnc; Figure 5, see (Lorenzo-Martín and Bustelo, 2020) for WT reference). This cluster harbors co-regulated gene signatures associated with epidermal development, epidermal cell differentiation, and keratinization (Figure 5B). In addition to this extensive reshuffling, we have also found very limited cases of either loss or gain of new co-regulated gene signatures in the clusters found in Vav2Onc/Onc HFSCs. Those include the loss of the Wnt–β-catenin and TNFα–NFκB signaling gene signatures (Figure 5B, see (Lorenzo-Martín and Bustelo, 2020) for WT reference) and the de novo incorporation of a protein translation-associated gene signature to the cluster designated as cOnc in Vav2Onc/Onc HFSCs (Figure 5B, red font).
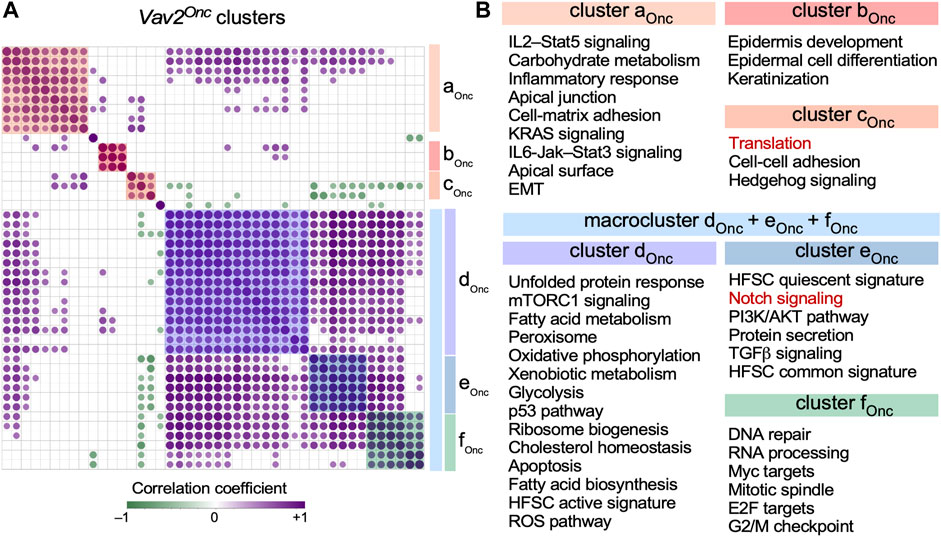
FIGURE 5. Vav2Onc promotes synchronization of multiple gene signatures in HFSCs (A) Co-expression matrix showing the correlation across time among the enrichment scores of the gene expression signatures shown in (B) in Vav2Onc/Onc HFSCs. Only correlations with p ≤ 0.05 have been considered as statistically significant. Positive and negative correlations are shown in purple and green, respectively. Dot size and color gradient reflects the magnitude of the r value obtained for each indicated pair. Pathway clusters are indicated with color shades. The co-expression matrix for the WT HFSC gene signatures can be found in (Lorenzo-Martín and Bustelo, 2020). (B) Gene signatures co-regulated in the same clusters in Vav2Onc/Onc HFSCs. Red indicates gene signatures that are not conserved in the clusters of the opposite genotype HFSCs.
Vav2Onc rewires the transcription factor landscape in skin stem cells
We assumed that the extensive age-dependent transcriptional rewiring observed in Vav2Onc/Onc HFSCs had to be associated with changes in the normal transcription factor landscape of skin stem cells. To investigate this, we next performed weighted correlation network analyses (WGCNA) to calculate hierarchical co-expression relationships among all the genes identified in the expression waves found in both WT and mutant HFSCs. This approach entailed the calculation of the adjacency and the intramodular connectivity for all the wave gene components (Figure 6A, see (Lorenzo-Martín and Bustelo, 2020) for WT reference), two parameters that are highly related to the Eigengene-based cluster membership score of each transcript. To further increase the stringency of these analyses, we defined hubs as only the 10% of the top-connected nodes in each age period-specific gene expression wave (Figure 6A, right panels). We found that only 26.5% of the transcriptomal hubs are conserved between WT and Vav2Onc/Onc HFSCs, which is consistent with the extensive transcriptomal rewiring observed in Figures 2–4. This reduced overlap is seen at the very early (23.9% of shared hub elements), early (17.7% of shared hub elements), middle (29.7% of shared hub elements), and late (6.65% of shared hub elements) experimental time points (Figure 6B, blue colors). The very low level of overlap in the hub elements between WT and Vav2Onc/Onc HFSCs seen in the late time-window is consistent with the increase of Vav2Onc-specific transcriptional programs previously observed in our in silico analyses (Figure 2; Figure 3). These findings indicate that the overall transcriptional rewiring induced by Vav2Onc in HFSCs is accompanied by a parallel reshaping of the overall transcriptomal hub landscape.
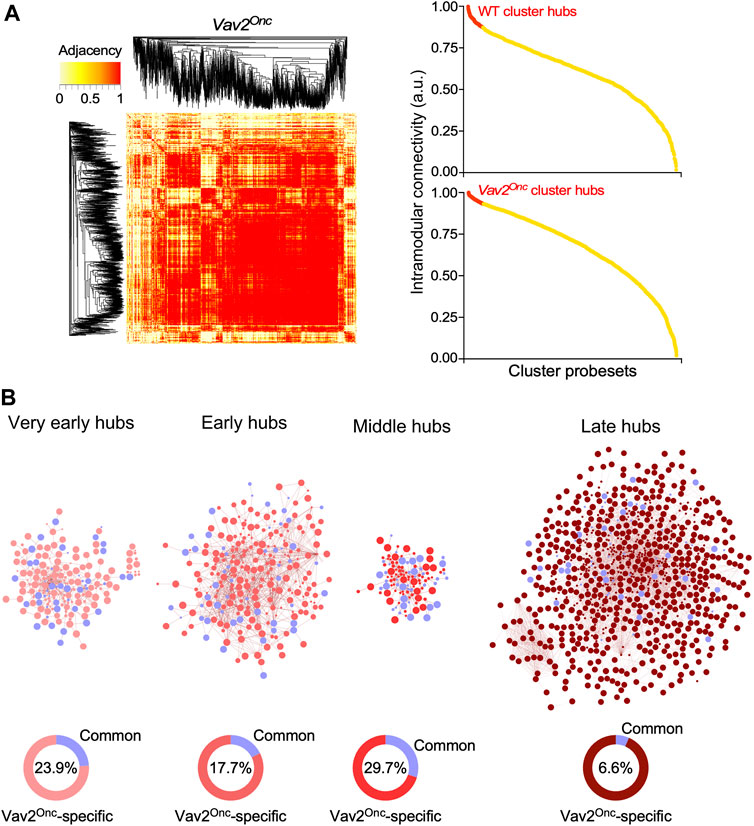
FIGURE 6. Vav2Onc promotes new transcriptomal hubs in HFSCs (A) Left, representative example of the adjacency heatmaps computed for each expression pattern applying the WGCNA algorithm to the Vav2Onc/Onc HFSC transcriptome (see (Lorenzo-Martín and Bustelo, 2020) for WT reference). Red areas indicate the presence of probe sets that are highly connected transcriptionally. Probe set clustering according to adjacency is depicted on the sides of the heatmap. Right, representative examples of dot plots showing the intramodular connectivity score for each of the probe sets belonging the coexpression clusters analyzed in the right panel. Transcriptional hubs (highlighted in red) are defined as the 10% most interconnected probe sets. (B) Top, transcriptomal hubs found in Vav2Onc/Onc HFSCs at the indicated experimental time points. The hubs shared with WT are shown in blue color. Bottom, percentage of hubs that are specific to Vav2Onc/Onc HFSCs (red) or common to both Vav2Onc/Onc and WT HFSCs (blue) (blue). The percentage of hubs shared by HFSCs of both genotypes is given inside each graph.
We hypothesized that the transcription factors responsible for the Vav2Onc-mediated transcriptomal rewiring had to be contained within the hubs described above. In line with this idea, we found that the landscape of transcription factors acting as hubs was very different between WT and Vav2Onc/Onc HFSCs (Figure 7A). In WT HFSCs, they include members of the zinc finger C2H2, HOX-like, and E2F families (Figure 7B, Supplementary Table S2). In contrast, in Vav2Onc/Onc HFSCs, they encompass specific members of the basic helix-loop-helix, Forkhead box, Gata, nuclear hormone receptor, Tcf, Ets, Nkl, Hox-like, Stat, and pluripotency-associated families (Figure 7B, Supplementary Table S2). We reasoned that if these transcription factors mediate the Vav2Onc-induced transcriptomic remodeling, they had to target many of genes present in the Vav2Onc-driven expression waves. Consistent with this idea, we found that most of the dynamically regulated genes in Vav2Onc/Onc HFSCs (Figure 2) harbor site(s) for these transcription factors (Figures 7B, C; Supplementary Table S2). This is Vav2Onc-specific, since these sites are not enriched in the case of the dynamically regulated genes in WT HFSCs (Supplementary Table S2). Indeed, our microarray data indicate that Vav2Onc transcriptionally regulates the activity of a large fraction (55%) of these transcription factors (Figure 7D, left panel). Importantly, ssGSEA analyses indicate that these Vav2Onc-driven transcription factors show high expression levels in quiescent HFSCs and become strongly downmodulated upon SCC activation and differentiation (Figure 7E, top panel). As a control, performing these analyses using equally sized random collections of transcription factors shows no significant enrichments (Figure 7E, bottom panel).
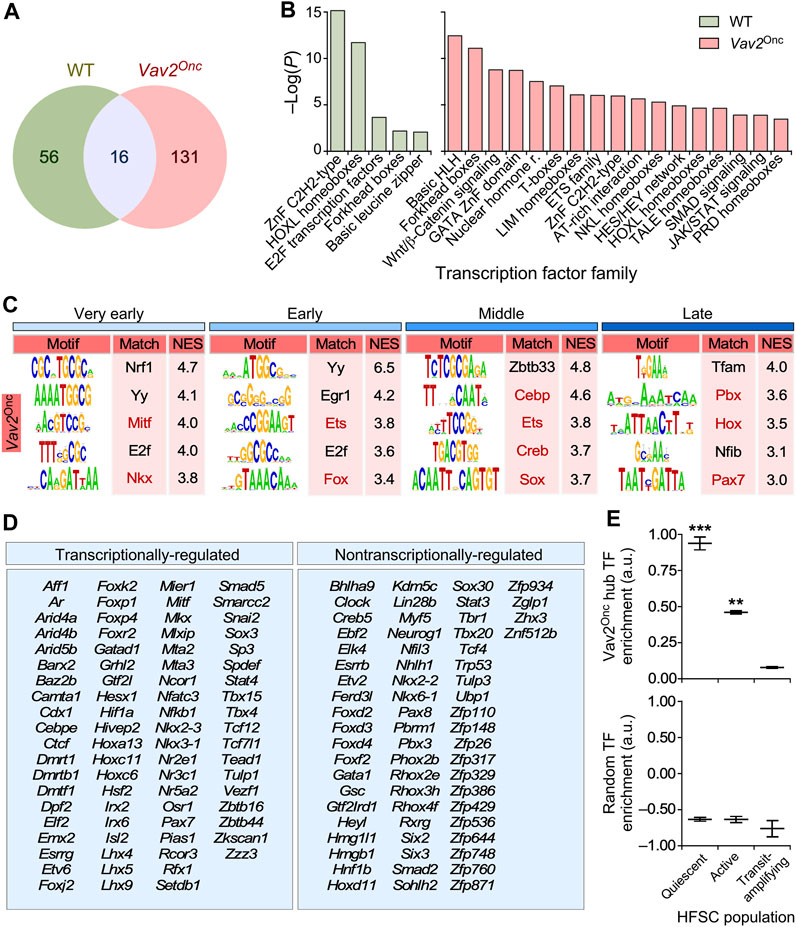
FIGURE 7. Vav2Onc rewires the transcription factor (TF) landscape in HFSCs (A) Venn diagram showing the overlap in TF identify in the transcriptomal hubs of WT or Vav2Onc/Onc HFSCs. (B) Main TF families enriched in the WT or Vav2Onc collections of TF hubs. For all, p ≤ 0.05 (Fisher’s exact test). (C) Main enriched TF binding sites in the promoters of time-regulated genes from Vav2Onc/Onc HFSCs (see (Lorenzo-Martín and Bustelo, 2020) for WT reference). Red indicates sites for which the TF is in a Vav2-regulated transcriptional hub. Normalized enrichment scores (NES) are indicated. For all, p ≤ 0.05 (iRegulon Wilcoxon rank-sum paired test). (D) List of TFs found in the transcriptomal hubs of Vav2Onc/Onc HFSCs. TFs that are differentially expressed at any time point as compared to WT HFSCs are labeled as “transcriptionally-regulated” (left column). (E) Plots showing the enrichment of the Vav2Onc hub TFs (top) and of an equally sized random collection of TFs (bottom) in the indicated epidermal cell populations. **, p < 0.01; ***, p < 0.001 against TAC population (Student’s t-test). Data represent median, minimum, and maximum values. TAC, transit-amplifying cell.
Discussion
Given their stemness condition, it could be inferred that HFSCs have to remain in a “platonic-like”, stable functional state throughout the life of an organism unless they are required for regenerative responses. However, we have recently shown that approximately one-third of the transcriptome of mouse HFSCs undergoes quite significant age-dependent variations under normal tissue homeostatic conditions. This is associated with well-defined age-dependent gene expression and functional waves (Lorenzo-Martín and Bustelo, 2020). Likewise, an independent study has demonstrated extensive changes in the transcriptome of adult (18-month-old) HFSCs (Doles et al., 2012). It is likely that these transcriptome changes are dependent on internal HFSC clocks as well as on external signals from the surrounding cells of the HFSC bulge niche. In addition to the time dimension, the functional features of HFSC are also highly influenced by the activation state of specific signal transduction proteins. Thus, we have shown in a recent study that interfering with the catalytic function of Vav2, using either a gain-of-function or a loss-of-function approach leads to extensive changes in the numbers, regenerative capacity, and the overall transcriptome of HFSCs isolated from 2.5-month-old mice. Such changes are connected to increasing proliferation while maintaining the biological programs linked to HFSC pluripotency (Lorenzo-Martín et al., 2022). However, given that these analyses have been carried out at a single age time point (Lorenzo-Martín et al., 2022), it is still unclear how Vav2 signaling influences the functional state of HFSCs throughout the lifespan of the animals. Here, we have now approached this issue by examining the effect of constitutive Vav2Onc signaling in the transcriptome of HFSCs isolated from six independent age points in mice.
Our data indicate that the constitutive signaling of Vav2Onc has a very profound impact on the overall transcriptome of HFSCs. Thus, we observed much higher numbers of age-regulated genes in Vav2Onc/Onc HFSCs (64.6%) than in WT HFSCs (31.9%) (Figure 1D). Many of these genes represent de novo regulatory events that are not found in the age-dependent transcriptome of WT HFSCs (Figure 1E). Perhaps more importantly, we have found a few interesting features of this Vav2Onc-regulated transcriptome. On the one hand, and despite the constitutively catalytic activity exhibited by Vav2Onc and the constant expression of its transcript in the time points analyzed in the present study (Supplementary Table S1), we have found that the Vav2Onc-regulated transcriptome is still organized in age-dependent waves of gene expression rather than being fixed over time (Figure 1F; Figure 2). On the other hand, we observed that Vav2onc elicits an extensive rewiring of the gene expression waves that are normally observed in HFSCs (Lorenzo-Martín and Bustelo, 2020). This rewiring involves: 1) the age-dependent expression of genes not found in HFSCs (Figure 2; Figure 3); 2) extensive changes in the time-dependent wave position of genes as compared to WT HFSCs (Figure 3); 3) in some cases, changes in the expression pattern of the dynamically regulated genes (e.g., changing from up-to downregulation) (Figure 3); 4) an increased level of co- or anti-regulation of genes belonging to gene signatures associated with hallmark biological processes and HFSC-related states (Figure 4); and 5) a further synchronization in the co- or anti-regulation of independent functional gene signatures in few co-regulated clusters (Figure 5). As a result of this extensive rewiring, very different age-dependent functional states can be recognized in the Vav2Onc/Onc HFSCs as compared to the WT counterparts (Figure 2, see (Lorenzo-Martín and Bustelo, 2020) for WT reference). In general, these states are associated with larger proliferative responses in the very early postnatal phase and more active and enriched signaling/metabolic programs in the subsequent time points analyzed. It is expected therefore that, as is the case of 2.5-month-old mice (Lorenzo-Martín et al., 2022), the HFSCs from older Vav2Onc/Onc mice would have an increased regenerative potential as compared to that of control mice.
It is difficult to decipher the master transcriptional regulators that underlie this extensive transcriptome rewiring using wet-lab approaches. To shed light on this issue, we used in silico approaches based on the identification of transcriptional hubs in the Vav2Onc-regulated gene expression program and, subsequently, the search for binding sites for those transcriptional hubs in the promoter regions of Vav2Onc-regulated genes. Using this approach, we have found that Vav2Onc promotes an extensive rewiring and amplification of the age-dependent transcription factor landscape present in HFSCs (Figure 7). This landscape includes transcription factors of the Cebp, Creb, Ets, Fox, Hox, and Sox families, many of which have been previously linked to the regulation of HFSC identity and homeostasis (Zhan et al., 2009; Lien et al., 2011). Interestingly, these Vav2Onc-engaged transcriptional hubs are specifically enriched in quiescent and to a lesser extent active HFSCs, but not in subsequent epidermal cell differentiation stages. In addition to transcriptome hubs whose expression is specifically regulated in Vav2Onc/Onc HFSCs, we have found other hubs that do not undergo statistically significant changes in expression between Vav2Onc/Onc and WT HFSCs (Figure 7D). This suggests that a significant part of the Vav2Onc-regulated transcription factor landscape could be regulated by posttranscriptional mechanisms. Future studies using wet-lab approaches will be needed to further validate this potential Vav2Onc-regulated transcription factor landscape.
Another important issue that remains unsolved is the most proximal signaling elements that work downstream of Vav2Onc in this process. In terms of the potential GTPase substrates of Vav2Onc involved, we have previously shown that endogenous Vav2Onc triggers the stimulation of Rac1 and, to a lower extent RhoA in primary keratinocytes. By contrast, it cannot stimulate Cdc42 in the same cell system (Lorenzo-Martín et al., 2020a). In agreement with these observations, we could demonstrate using organotypic 3D models that the epithelial hyperplasia induced by Vav2Onc-expressing primary keratinocytes is Rac1–Pak1-and RhoA–Rock-dependent (Lorenzo-Martín et al., 2020a). Using an alternative experimental system, we have also demonstrated before that the defective signaling, proliferation, and carcinogen-induced tumorigenesis found in primary Vav2−/−;Vav3−/− keratinocytes were connected to reduced activation levels of Rac1 (Menacho-Marquez et al., 2013). All these data suggest that the roles of Vav2 proteins in HFSCs must be Rac1-dependent and, probably, RhoA-dependent as well. As discussed before in the case of Vav2Onc, we also consider as highly unlikely that the age-dependent modulation of the Vav2Onc-regulated transcriptome would be just the consequence of changes in the expression levels of the transcripts of these two GTPases. Consistent with this idea, we have found that the expression levels of Rac1 and Rhoa mRNAs remain unchanged, with the single exception of wave −12 (in which they are partially downregulated), in most of the time points analyzed in this study (Supplementary Table S1). We cannot rule out at this moment, however, that Vav2Onc and/or the downstream GTPases could undergo cyclic changes at either the translational or posttranslational level that could explain some of the expression waves observed. Likewise, it can be also possible that adaptors functions mediated by the C-terminal Vav2 SH3–SH2–SH3 region (Figure 1A) could contribute in parallel to such functions. Further work will be required to address all these important mechanistic issues.
Data from our previous study (Lorenzo-Martín et al., 2022) and the present work suggest that Vav2Onc will promote increased numbers of HFSCs endowed with more basal regenerative potential for longer periods of time in mice. However, they also give a warning sign, since it is foreseeable that this potentially beneficial feature could represent a problem when oncogenic mutations arise in those cells. In fact, we have previously demonstrated that Vav2Onc promotes the generation of a protumorigenic, hyperplastic niche in the skin that can facilitate tumor formation upon the emergence of genetic lesions in the keratinocyte cell layer of the skin (Lorenzo-Martín et al., 2020a). On the brighter side, it is possible to envision that the Vav2Onc-associated transcriptome of HFSCs will have specific Achilles’ heels that can be targeted to hamper the fitness of cancer HFSCs. Such an avenue has been, in fact, demonstrated in the case of more differentiated epithelial components of the skin (Lorenzo-Martín et al., 2020a; Lorenzo-Martín et al., 2020c).
Data availability statement
The datasets presented in this study can be found in online repositories. The names of the repository/repositories and accession number(s) can be found below: NCBI GEO under accessions GSE140152. Publicly available datasets were also analysed and can be found at NCBI GEO under GSE137176.
Ethics statement
The animal study was approved by Bioethics Committee of the University of Salamanca. The study was conducted in accordance with the local legislation and institutional requirements.
Author contributions
LFL-M did the experimental work and the bioinformatic analyses, performed artwork design, and wrote the manuscript. XRB conceived the work and carried out the final editing of the manuscript and figures. All authors contributed to the article and approved the submitted version.
Funding
XRB’s work has been supported by Worldwide Cancer Research (14-1248); the RTI 2018-096481-B-100 and PID 2021-122666OB-I00 grants cofunded by MCIN/AEI/10.13039/501100011033 and the European Research Development Fund “A way of making Europe” of the European Union; the Spanish Association against Cancer (GC16173472GARC); the Castilla-León autonomous government (CSI145P20 and CLC-2017-01); “la Caixa” Banking Foundation (HR20-00164) and the STOP-RAS cancer program of the Spanish Association against Cancer. XRB’s institution is supported by the Programas de Apoyo a Planes Estratégicos de Investigación de Estructuras de Investigación de Excelencia of the Castilla-León government (CLC-2017-01 and CL-EI-2021-02) that were both cofounded by the European Research Development Fund. LFL-M contract has been supported by funding from the Spanish Ministry of Education, Culture and Sports (FPU13/02923) and, subsequently, by the CLC-2017-01 grant.
Acknowledgments
We thank A. Abad for animal-based work, M. Blázquez for laboratory work, A. Prieto for FACS-related technical assistance, and E. Fermiñán for microarray-hybridization procedures.
Conflict of interest
The authors declare that the research was conducted in the absence of any commercial or financial relationships that could be construed as a potential conflict of interest.
Publisher’s note
All claims expressed in this article are solely those of the authors and do not necessarily represent those of their affiliated organizations, or those of the publisher, the editors and the reviewers. Any product that may be evaluated in this article, or claim that may be made by its manufacturer, is not guaranteed or endorsed by the publisher.
Supplementary material
The Supplementary Material for this article can be found online at: https://www.frontiersin.org/articles/10.3389/fcell.2023.1252834/full#supplementary-material
References
Benitah, S. A., Frye, M., Glogauer, M., and Watt, F. M. (2005). Stem cell depletion through epidermal deletion of Rac1. Science 309, 933–935. doi:10.1126/science.1113579
Blanpain, C., and Fuchs, E. (2006). Epidermal stem cells of the skin. Annu. Rev. Cell. Dev. Biol. 22, 339–373. doi:10.1146/annurev.cellbio.22.010305.104357
Blanpain, C., and Fuchs, E. (2009). Epidermal homeostasis: A balancing act of stem cells in the skin. Nat. Rev. Mol. Cell. Biol. 10, 207–217. doi:10.1038/nrm2636
Bustelo, X. R., Sauzeau, V., and Berenjeno, I. M. (2007). GTP-Binding proteins of the rho/rac family: regulation, effectors and functions in vivo. Bioessays 29, 356–370. doi:10.1002/bies.20558
Bustelo, X. R. (2014). Vav family exchange factors: an integrated regulatory and functional view. Small GTPases 5, 9. doi:10.4161/21541248.2014.973757
Castilho, R. M., Squarize, C. H., Patel, V., Millar, S. E., Zheng, Y., Molinolo, A., et al. (2007). Requirement of Rac1 distinguishes follicular from interfollicular epithelial stem cells. Oncogene 26, 5078–5085. doi:10.1038/sj.onc.1210322
Chai, L., Cao, C., Bi, S., Dai, X., Gan, L., Guo, R., et al. (2010). Small Rho GTPase Rac1 determines human epidermal stem cell fate in vitro. Int. J. Mol. Med. 25, 723–727. doi:10.3892/ijmm_00000397
Chen, J., Bardes, E. E., Aronow, B. J., and Jegga, A. G. (2009). ToppGene Suite for gene list enrichment analysis and candidate gene prioritization. Nucleic Acids Res. 37, W305–W311. doi:10.1093/nar/gkp427
Chrostek, A., Wu, X., Quondamatteo, F., Hu, R., Sanecka, A., Niemann, C., et al. (2006). Rac1 is crucial for hair follicle integrity but is not essential for maintenance of the epidermis. Mol. Cell. Biol. 26, 6957–6970. doi:10.1128/MCB.00075-06
Cotsarelis, G. (2006). Epithelial stem cells: A folliculocentric view. J. Invest. Dermatol 126, 1459–1468. doi:10.1038/sj.jid.5700376
Doles, J., Storer, M., Cozzuto, L., Roma, G., and Keyes, W. M. (2012). Age-associated inflammation inhibits epidermal stem cell function. Genes. Dev. 26, 2144–2153. doi:10.1101/gad.192294.112
Fabbiano, S., Menacho-Márquez, M., Sevilla, M. A., Albarrán-Juárez, J., Zheng, Y., Offermanns, S., et al. (2014). Genetic dissection of the Vav2-Rac1 signaling axis in vascular smooth muscle cells. Mol. Cell. Biol. 34, 4404–4419. doi:10.1128/MCB.01066-14
Fuchs, E. (2008). Skin stem cells: rising to the surface. J. Cell. Biol. 180, 273–284. doi:10.1083/jcb.200708185
Hsu, Y. C., Li, L., and Fuchs, E. (2014). Transit-amplifying cells orchestrate stem cell activity and tissue regeneration. Cell. 157, 935–949. doi:10.1016/j.cell.2014.02.057
Irizarry, R. A., Bolstad, B. M., Collin, F., Cope, L. M., Hobbs, B., and Speed, T. P. (2003). Summaries of Affymetrix GeneChip probe level data. Nucleic Acids Res. 31, e15. doi:10.1093/nar/gng015
Janich, P., Pascual, G., Merlos-Suárez, A., Batlle, E., Ripperger, J., Albrecht, U., et al. (2011). The circadian molecular clock creates epidermal stem cell heterogeneity. Nature 480, 209–214. doi:10.1038/nature10649
Janky, R., Verfaillie, A., Imrichová, H., Van de Sande, B., Standaert, L., Christiaens, V., et al. (2014). iRegulon: from a gene list to a gene regulatory network using large motif and track collections. PLoS Comput. Biol. 10, e1003731. doi:10.1371/journal.pcbi.1003731
Kumar, L., and Futschik, M. E. (2007). Mfuzz: A software package for soft clustering of microarray data. Bioinformation 2, 5–7. doi:10.6026/97320630002005
Langfelder, P., and Horvath, S. (2008). Wgcna: an R package for weighted correlation network analysis. BMC Bioinforma. 9, 559. doi:10.1186/1471-2105-9-559
Liberzon, A., Birger, C., Thorvaldsdóttir, H., Ghandi, M., Mesirov, J. P., and Tamayo, P. (2015). The Molecular Signatures Database (MSigDB) hallmark gene set collection. Cell. Syst. 1, 417–425. doi:10.1016/j.cels.2015.12.004
Lien, W. H., Guo, X., Polak, L., Lawton, L. N., Young, R. A., Zheng, D., et al. (2011). Genome-wide maps of histone modifications unwind in vivo chromatin states of the hair follicle lineage. Cell. Stem Cell. 9, 219–232. doi:10.1016/j.stem.2011.07.015
Lorenzo-Martín, L. F., and Bustelo, X. R. (2020). In silico analysis of the age-dependent evolution of the transcriptome of mouse skin stem cells. Cells 9, 165. doi:10.3390/cells9010165
Lorenzo-Martín, L. F., Fernández-Parejo, N., Menacho-Márquez, M., Rodríguez-Fdez, S., Robles-Valero, J., Zumalave, S., et al. (2020a). VAV2 signaling promotes regenerative proliferation in both cutaneous and head and neck squamous cell carcinoma. Nat. Commun. 11, 4788. doi:10.1038/s41467-020-18524-3
Lorenzo-Martín, L. F., Rodríguez-Fdez, S., Fabbiano, S., Abad, A., García-Macías, M. C., Dosil, M., et al. (2020b). Vav2 pharmaco-mimetic mice reveal the therapeutic value and caveats of the catalytic inactivation of a Rho exchange factor. Oncogene 39, 5098–5111. doi:10.1038/s41388-020-1353-x
Lorenzo-Martín, L. F., Menacho-Márquez, M., and Bustelo, X. R. (2020c). Drug vulnerabilities and disease prognosis linked to the stem cell-like gene expression program triggered by the RHO GTPase activator VAV2 in hyperplastic keratinocytes and head and neck cancer. Cancers (Basel) 12, 2498. doi:10.3390/cancers12092498
Lorenzo-Martín, L. F., Menacho-Márquez, M., Fernández-Parejo, N., Rodríguez-Fdez, S., Pascual, G., Abad, A., et al. (2022). The Rho guanosine nucleotide exchange factors Vav2 and Vav3 modulate epidermal stem cell function. Oncogene 41, 3341–3354. doi:10.1038/s41388-022-02341-7
Menacho-Marquez, M., García-Escudero, R., Ojeda, V., Abad, A., Delgado, P., Costa, C., et al. (2013). The Rho exchange factors Vav2 and Vav3 favor skin tumor initiation and promotion by engaging extracellular signaling loops. PLoS Biol. 11, e1001615. doi:10.1371/journal.pbio.1001615
Reich, M., Liefeld, T., Gould, J., Lerner, J., Tamayo, P., and Mesirov, J. P. (2006). GenePattern 2.0. Nat. Genet. 38, 500–501. doi:10.1038/ng0506-500
Reiner, A., Yekutieli, D., and Benjamini, Y. (2003). Identifying differentially expressed genes using false discovery rate controlling procedures. Bioinformatics 19, 368–375. doi:10.1093/bioinformatics/btf877
Ritchie, M. E., Phipson, B., Wu, D., Hu, Y., Law, C. W., Shi, W., et al. (2015). Limma powers differential expression analyses for RNA-sequencing and microarray studies. Nucleic Acids Res. 43, e47. doi:10.1093/nar/gkv007
Rodriguez-Fdez, S., and Bustelo, X. R. (2019). The Vav GEF family: an evolutionary and functional perspective. Cells 8, E465. doi:10.3390/cells8050465
Rodriguez-Fdez, S., Lorenzo-Martín, L. F., Fernández-Pisonero, I., Porteiro, B., Veyrat-Durebex, C., Beiroa, D., et al. (2020). Vav2 catalysis-dependent pathways contribute to skeletal muscle growth and metabolic homeostasis. Nat. Commun. 11, 5808. doi:10.1038/s41467-020-19489-z
Schober, M., and Fuchs, E. (2011). Tumor-initiating stem cells of squamous cell carcinomas and their control by TGF-β and integrin/focal adhesion kinase (FAK) signaling. Proc. Natl. Acad. Sci. U. S. A. 108, 10544–10549. doi:10.1073/pnas.1107807108
Schuebel, K. E., Movilla, N., Rosa, J. L., and Bustelo, X. R. (1998). Phosphorylation-dependent and constitutive activation of Rho proteins by wild-type and oncogenic Vav-2. EMBO J. 17, 6608–6621. doi:10.1093/emboj/17.22.6608
Shannon, P., Markiel, A., Ozier, O., Baliga, N. S., Wang, J. T., Ramage, D., et al. (2003). Cytoscape: A software environment for integrated models of biomolecular interaction networks. Genome Res. 13, 2498–2504. doi:10.1101/gr.1239303
Subramanian, A., Tamayo, P., Mootha, V. K., Mukherjee, S., Ebert, B. L., Gillette, M. A., et al. (2005). Gene set enrichment analysis: A knowledge-based approach for interpreting genome-wide expression profiles. Proc. Natl. Acad. Sci. U. S. A. 102, 15545–15550. doi:10.1073/pnas.0506580102
Szklarczyk, D., Franceschini, A., Wyder, S., Forslund, K., Heller, D., Huerta-Cepas, J., et al. (2015). STRING v10: protein-protein interaction networks, integrated over the tree of life. Nucleic Acids Res. 43, D447–D452. doi:10.1093/nar/gku1003
Toufighi, K., Yang, J. S., Luis, N. M., Aznar Benitah, S., Lehner, B., Serrano, L., et al. (2015). Dissecting the calcium-induced differentiation of human primary keratinocytes stem cells by integrative and structural network analyses. PLoS Comput. Biol. 11, e1004256. doi:10.1371/journal.pcbi.1004256
Tripathi, S., Pohl, M. O., Zhou, Y., Rodriguez-Frandsen, A., Wang, G., Stein, D. A., et al. (2015). Meta- and orthogonal integration of influenza "OMICs" data defines a role for UBR4 in virus budding. Cell. Host Microbe 18, 723–735. doi:10.1016/j.chom.2015.11.002
Tscharntke, M., Pofahl, R., Chrostek-Grashoff, A., Smyth, N., Niessen, C., Niemann, C., et al. (2007). Impaired epidermal wound healing in vivo upon inhibition or deletion of Rac1. J. Cell. Sci. 120, 1480–1490. doi:10.1242/jcs.03426
Wang, F., Zhan, R., Chen, L., Dai, X., Wang, W., Guo, R., et al. (2017). RhoA promotes epidermal stem cell proliferation via PKN1-cyclin D1 signaling. PLoS One 12, e0172613. doi:10.1371/journal.pone.0172613
Wu, X., Quondamatteo, F., Lefever, T., Czuchra, A., Meyer, H., Chrostek, A., et al. (2006). Cdc42 controls progenitor cell differentiation and beta-catenin turnover in skin. Genes. Dev. 20, 571–585. doi:10.1101/gad.361406
Zhang, Y. V., Cheong, J., Ciapurin, N., McDermitt, D. J., and Tumbar, T. (2009). Distinct self-renewal and differentiation phases in the niche of infrequently dividing hair follicle stem cells. Cell. Stem Cell. 5, 267–278. doi:10.1016/j.stem.2009.06.004
Zhan, R., He, W., Wang, F., Yao, Z., Tan, J., Xu, R., et al. (2016). Nitric oxide promotes epidermal stem cell migration via cGMP-Rho GTPase signalling. Sci. Rep. 6, 30687. doi:10.1038/srep30687
Keywords: skin homeostasis, aging, epidermal stem cells, hair follicle, gene expression, bioinformatics
Citation: Lorenzo-Martín LF and Bustelo XR (2023) The Rho GTPase exchange factor Vav2 promotes extensive age-dependent rewiring of the hair follicle stem cell transcriptome. Front. Cell Dev. Biol. 11:1252834. doi: 10.3389/fcell.2023.1252834
Received: 04 July 2023; Accepted: 11 September 2023;
Published: 26 September 2023.
Edited by:
James T. Murray, Swansea University Medical School, United KingdomReviewed by:
Mariana Cooke, University of Pennsylvania, United StatesLalhaba Oinam, Tokyo University of Science, Japan
Copyright © 2023 Lorenzo-Martín and Bustelo. This is an open-access article distributed under the terms of the Creative Commons Attribution License (CC BY). The use, distribution or reproduction in other forums is permitted, provided the original author(s) and the copyright owner(s) are credited and that the original publication in this journal is cited, in accordance with accepted academic practice. No use, distribution or reproduction is permitted which does not comply with these terms.
*Correspondence: Xosé R. Bustelo, xbustelo@usal.es; L. Francisco Lorenzo-Martín, luis.lorenzomartin@epfl.ch
†Present Address: L. Francisco Lorenzo-Martín, Laboratory of Stem Cell Bioengineering, École Polytechnique Fédérale de Lausanne, Lausanne, Switzerland