EpCAM-Mediated Cellular Plasticity Promotes Radiation Resistance and Metastasis in Breast Cancer
 Arijit Mal1,2
  Amirali B. Bukhari1
  Ram K. Singh3
  Aastha Kapoor4 Amlan Barai4
  Ishan Deshpande1 Tabassum Wadasadawala5
  Pritha Ray2,3
  Shamik Sen4
  Abhijit De1,2*
- 1Molecular Functional Imaging Laboratory, ACTREC, Tata Memorial Centre, Navi Mumbai, India
- 2Life Science, Homi Bhabha National Institute, Mumbai, India
- 3Imaging Cell Signaling & Therapeutics Lab, ACTREC, Tata Memorial Centre, Navi Mumbai, India
- 4Department of Biosciences and Bioengineering, IIT Bombay, Mumbai, India
- 5Radiation Oncology Unit, ACTREC, Tata Memorial Centre, Navi Mumbai, India
Substantial number of breast cancer (BC) patients undergoing radiation therapy (RT) develop local recurrence over time. During RT therapy, cells can gradually acquire resistance implying adaptive radioresistance. Here we probe the mechanisms underlying this acquired resistance by first establishing radioresistant lines using ZR-75-1 and MCF-7 BC cells through repeated exposure to sub-lethal fractionated dose of 2Gy up to 15 fractions. Radioresistance was found to be associated with increased cancer stem cells (CSCs), and elevated EpCAM expression in the cell population. A retrospective analysis of TCGA dataset indicated positive correlation of high EpCAM expression with poor response to RT. Intriguingly, elevated EpCAM expression in the radioresistant CSCs raise the bigger question of how this biomarker expression contributes during radiation treatment in BC. Thereafter, we establish EpCAM overexpressing ZR-75-1 cells (ZR-75-1EpCAM), which conferred radioresistance, increased stemness through enhanced AKT activation and induced a hybrid epithelial/mesenchymal phenotype with enhanced contractility and invasiveness. In line with these observations, orthotopic implantation of ZR-75-1EpCAM cells exhibited faster growth, lesser sensitivity to radiation therapy and increased lung metastasis than baseline ZR-75-1 cells in mice. In summary, this study shows that similar to radioresistant BC cells, EpCAM overexpressing cells show high degree of plasticity and heterogeneity which ultimately induces radioresistant and metastatic behavior of cancer cells, thus aggravating the disease condition.
Introduction
Breast cancer (BC) continues to be the most common cancer diagnosed among women worldwide. Fractionated ionizing radiation is a standard treatment procedure in BC clinic, which is often used as adjuvant with surgery or chemotherapy. Therapy resistance, i.e., relapsed disease, and metastasis have remained as an unsolved clinical challenge and are major reasons of mortality across all cancers. It has been frequently observed that when subjected to a sub-lethal dose of fractionated γ-radiation, a tumor gradually acquires resistance (Pearce et al., 2001), indicating adaptive radioresistance. Such an adaptive response can be designated as an intrinsic property of a subpopulation of cells, leading to the concept of tumor heterogeneity. The intrinsically radioresistant subpopulation of BC cells are thought to be composed of cancer stem cell (CSC) in the population (Arnold et al., 2020). However, the role of CSC in the acquirement of resistance against radiotherapy (RT) load in BC can not be overlooked. Other than intrinsic radioresistant subpopulations getting selected, it is possible that a subpopulation of cells with altered molecular and phenotypic properties in the tumor mass can overcome the treatment stress, and eventually show resistance to RT. In line to this, it has been reported that radiation can reprogramme non-CSCs to radioresistant CSCs (Lagadec et al., 2012). The question that is also pertinent here is whether any specific stem cell marker/regulator can drive the potential enough to impart radioresistance. Likewise, there are reports of increased incidences of metastasis in resistant BC cases, but no evidence of unique mutation signature identified so far. Thus, the wheel tilts more toward a dynamic cellular adaptive response like radiation induced metastasis of BC cells or selection of a highly metastatic clones, as plausible reasons behind increased cases of metastasis. In this regard, the cellular plasticity concept has evolved against various therapeutic assaults (Elshamy and Duhe, 2013; Arnold et al., 2020; Kong et al., 2020). We have been investigating on aspects of BC radioresistance with an aim to resolve the dichotomy between the purpose and outcome of RT protocol (Desai et al., 2018). As targeting CSC has its own challenges (Kuhlmann et al., 2016; Dashzeveg et al., 2017), identification of a key regulator, which is also a characteristic marker of CSC, contributing to BC radioresistance may potentially provide a new therapeutic option for BC radioresistance in future. In this perspective, we thought of investigating epithelial cell adhesion molecule (EpCAM) as a potential molecule.
EpCAM is a CSC surface marker that was initially discovered as a dominant antigen in colon carcinomas (Herlyn et al., 1979; Visvader and Lindeman, 2008). Recent findings have shown the oncogenic potential of EpCAM and its link to bad prognosis in many cancer types (van der Gun et al., 2010). EpCAM is reported to have a role in radioresistance and chemoresistance in prostate cancer (Ni et al., 2013). It is also reported that EpCAM regulates stemness in nasopharyngeal carcinoma (Wang et al., 2018). EpCAM is reported to be involved in BC metastasis (Osta et al., 2004; Gao et al., 2015; Hiraga et al., 2016). EpCAM is also used as a marker for the detection of circulating tumor cells (CTCs) (Gires et al., 2020). It has been observed that EpCAM high CTCs in metastatic BC are associated with poor overall survival (de Wit et al., 2018). Further, EpCAM high CTCs have shown enhanced metastatic potential than its counterpart (Liu et al., 2019). In nasopharyngeal carcinoma role of EpCAM in metastasis is evaluated in vivo (Wang et al., 2018). Thus far, the contribution of EpCAM in BC cellular plasticity, and altered phenotypic regulations such as radioresistance, stemness and further how these phenotypes ultimately impact the metastatic property of cancer cells is not yet established. Therefore, in this study, we focus on relating the contribution of EpCAM in determining altered cellular phenotype both in vitro and in vivo using experimental radioresistant cell model as well as EpCAM overexpressing condition in BC cells.
Results
Radioresistant Breast Cancer Cell Lines Exhibit Altered Focal Adhesion and EMT Profile
RT protocol in a clinical setting treats the tumor with multiple fractions of γ-radiation, typically 2Gy fractions (Wang et al., 2019). Radioresistant BC lines (FR) were developed in vitro by exposing MCF-7 and ZR-75-1 cells to 2Gy γ-radiation for 10 and 15 fractions, respectively (accumulated dose of 20Gy and 30Gy respectively) (Figure 1A). As the cells acquire radioresistance, a morphometric alteration was noticed in MCF-7FR line, which was having a smaller surface area than its parental counterpart (Figure 1B and Supplementary Figure 1A). But in ZR-75-1FR line no such apparent morphological change was observed. The established cell lines, MCF-7FR, and ZR-75-1FR were further tested for their survival ability against bulk doses of 2Gy, 4Gy, and 8Gy γ-radiation (Figure 1C and Supplementary Figure 1B). Further, dose modifying factor (DMF) of ∼1.6 in ZR-75-1FR and MCF-7FR cells shows that cells have acquired radioresistance (Figure 1C). MCF-7FR and ZR-75-1FR cells exhibited higher survival fraction and thus represented a higher resistance index (D0 value) as 3.86 and 4.93, respectively. In comparison, the baseline MCF-7 and ZR-75-1 showed D0 value as 2.782 and 3.485, respectively (Figure 1D). Additionally, it was observed that radiation exposure induced lesser DSB (DNA double strand break), which was evident from lower numbers of γH2AX foci in the nuclei of MCF-7FR and ZR-75-1FR cells as compared to the baselines respectively (Figure 1E and Supplementary Figures 1C–E).
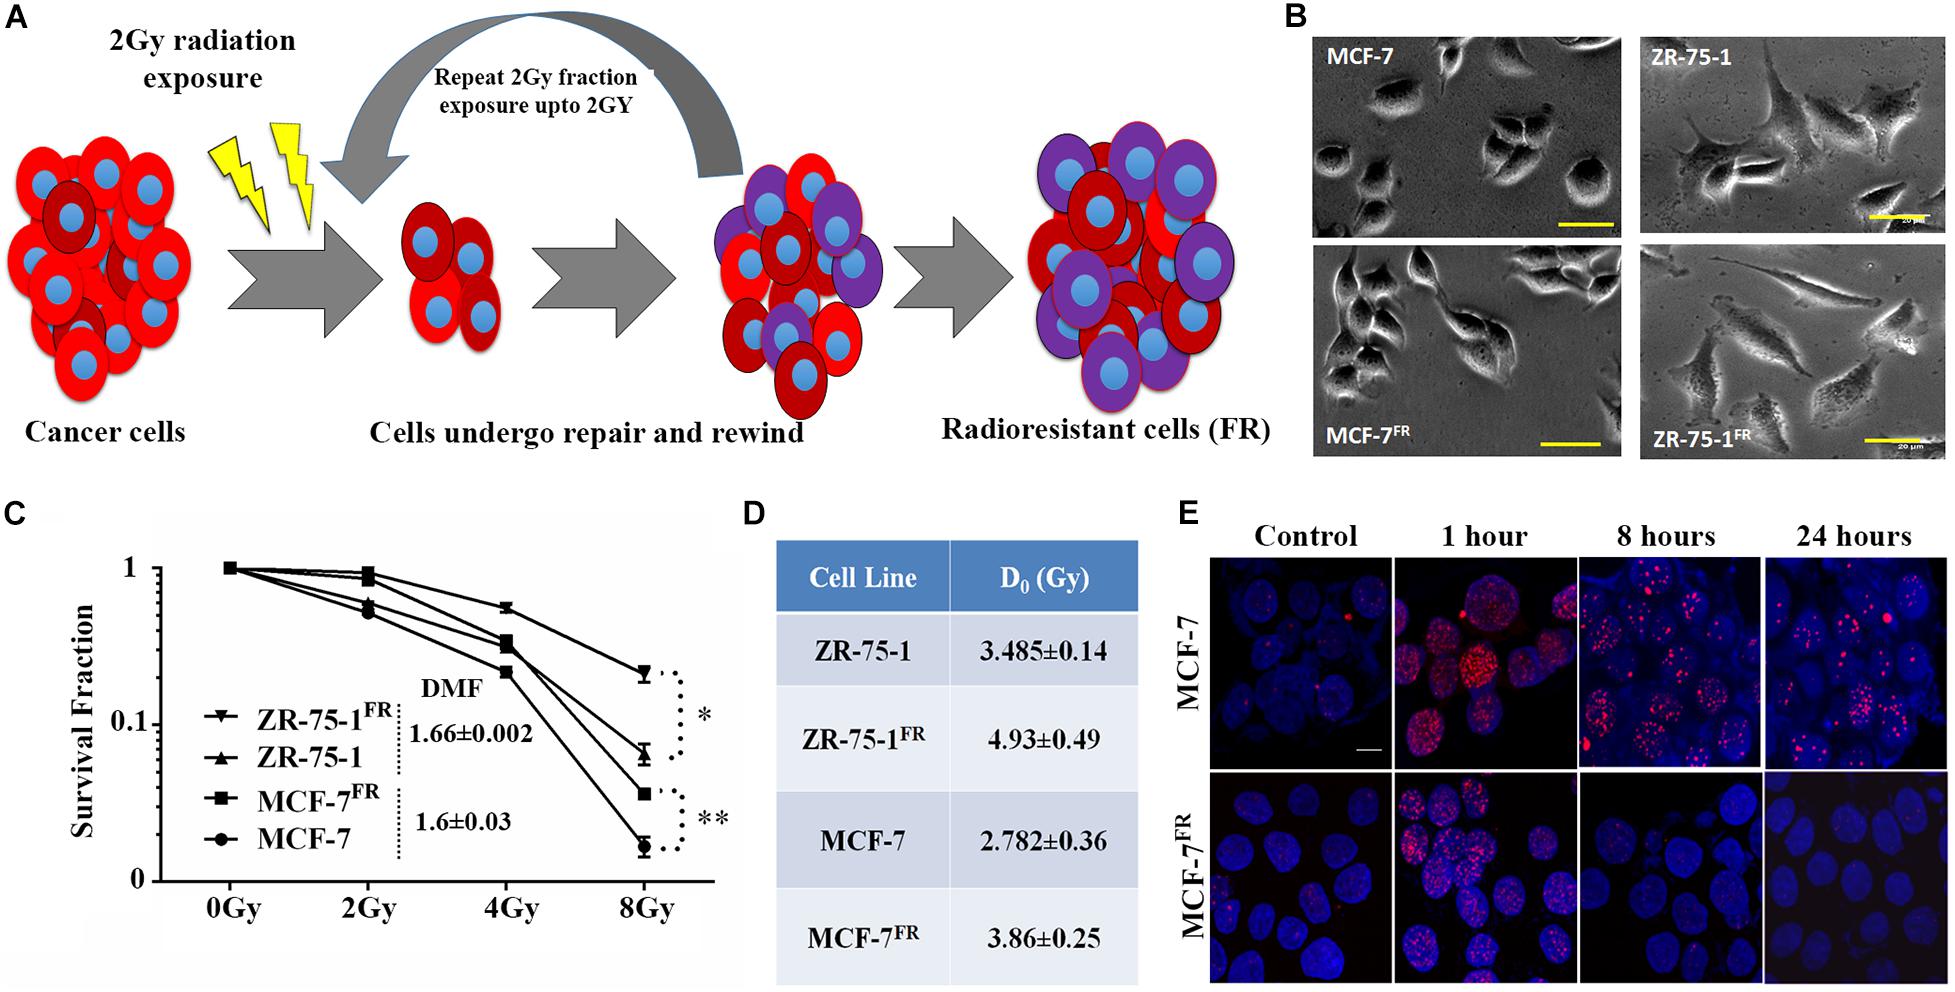
Figure 1. Establishment of radioresistant breast cancer cell model. (A) Schematic representation of the radioresistant cell model (FR) established, which shows altered phenotype. (B) Photomicrograph of MCF-7FR, ZR-75-1FR, and their parental counterpart (scale bar-50 μm). (C) Long term clonogenic cell survival assay showing the survival fraction of ZR-75-1FR, MCF-7FR, and their parental counterparts after exposure to single fraction 2Gy, 4Gy, and 8Gy radiation. Dose modifying factor for the respective celllines are mentioned in the inset. (D) Table indicates the D0 values obtained based on cell survival data. (E) Immunofluorescence of γH2AX (red) in MCF-7 and MCF-7FR at different time points (1, 8, and 24 h) after 2Gy radiation exposure. DAPI cross-staining is done to mark the nuclei (blue). *P < 0.05, **P < 0.01.
Ostensive role of focal adhesion proteins in cell migration is well implicated in the literature (Kim and Wirtz, 2013). Co-immunofluorescence staining for vinculin and F-actin showed that MCF-7FR, and ZR-75-1FR cells have significantly higher focal adhesion areas than the respective baseline cells (Figures 2A–D). Measured focal adhesion area is the area of co-localization of vinculin and F-actin/phalloidin. Previously, we have reported that radioresistant MCF-7 cells showing mesenchymal phenotype (Desai et al., 2018). Thus, we wanted to investigate the same in ZR-75-1FR cells. We measured the transcript level of important mesenchymal markers such as Twist, Snail, Slug, and epithelial marker E-cadherin in ZR-75-1FR cell and represented the relative quantity of transcript by comparing with ZR-75-1 cell (Figure 2E). A two-fold increase in Twist transcript was observed, which is a major transcriptional driver of genes expressed in mesenchymal state. We also observed increase in the Twist protein level in ZR-75-1FR cells. However, vimentin expression remain unchanged in between in ZR-75-1FR and ZR-75-1 cells (Figure 2F). These results along with a downward trend in the E-cadherin level indicates that the ZR-75-1FR cells started losing epithelial phenotypes while showing an incomplete mesenchymal phenotype. Therefore, ZR-75-1FR cells tilts toward being mesenchymal but have not completely transformed into mesenchymal cells.
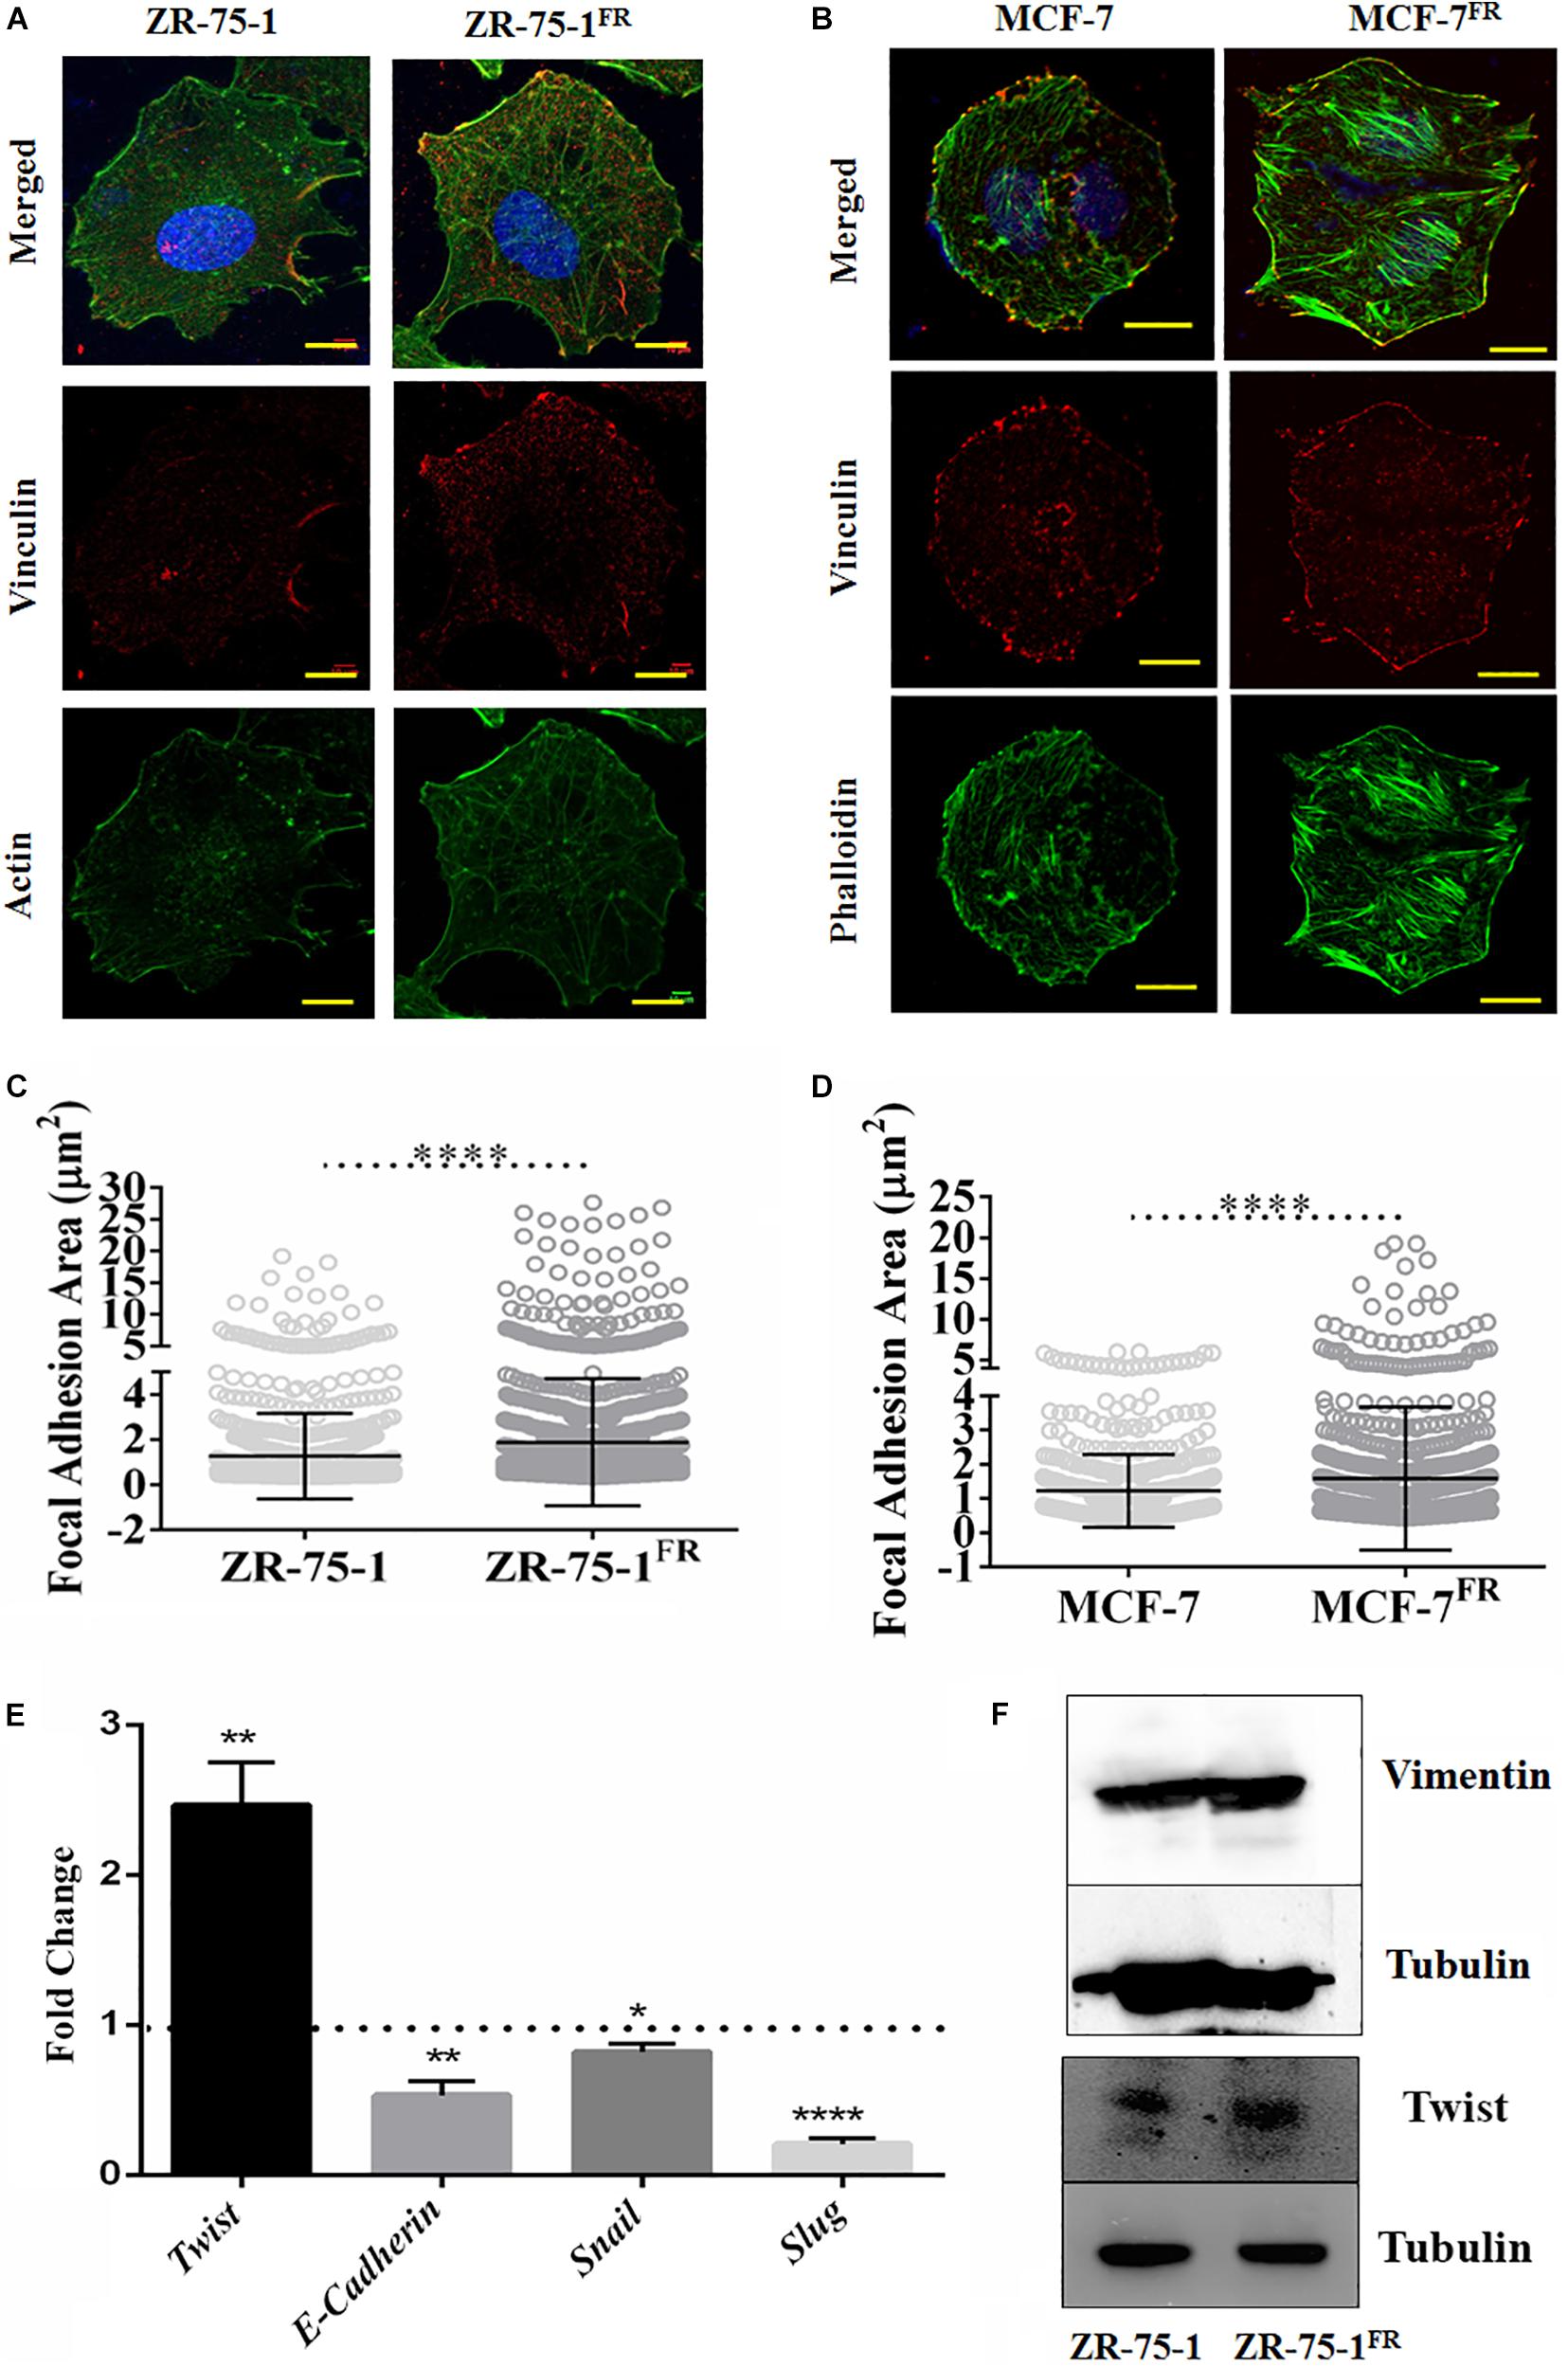
Figure 2. Effect of acquired radioresistance on the focal adhesion and EMT gene expression. (A,B) Immunofluorescence photomicrograph of ZR-75-1, MCF-7 cells as well as their radioresistant counterpart after vinculin (red) and F-actin (green) staining. scale bar-10 μm. (C,D) Graphs are representing focal adhesion area (μm2) measured in ZR-75-1, MCF-7, and their radioresistant counterparts. Focal adhesion area is the co-localization of vinculin and F-actin/phalloidin at the membrane. Each dot in the graph represents the area of individual focal adhesions. (E) Graph showing the relative fold change in the mRNA expression of Twist, E-cadherin, Snail, and Slug when compared between ZR-75-1FR and ZR-75-1 cells. Dotted line represents the level in ZR-75-1 cells. (F) Western blots showing the level of vimentin and Twist in ZR-75-1 and ZR-75-1FR cells, tubulin is used as the loading control. *P < 0.05, **P < 0.01, and ****P < 0.0001.
Cancer Stem Cell Features Are Integral to Acquired Radioresistant Phenotype of BC Cells
Published literature has shown that a shift from epithelial phenotype to mesenchymal phenotype is integral to stemness characteristics in acquired radioresistance of BC (Liao and Yang, 2020). The CSC features of established radioresistant cell lines were compared to that of the baseline cells. The radioresistant ZR-75-1FR and MCF-7FR cells showed around 2-fold and 10-fold higher CD44+/CD24– population than their baseline counterparts respectively, indicating significant enrichment of CSCs (Figures 3A,B). Additional experimental evidence such as increased number of mammosphere formation (Figure 3C) also complemented the presence of higher numbers of CSCs in radioresistant lines. CSCs can also be identified by a functional assay, called side population (SP) assay. This assay is based on the CSC’s capacity to efflux fluorescent dyes such as DCV or Hoescht at higher rate than non-CSCs. Elevated expression of ATP binding cassette transporter (ABCT) family proteins in CSCs is responsible for the efflux. These SP cells can be isolated by flow cytometry based on decreased fluorescence. Verapamil is used to validate that the decrease of fluorescence in SP cells is due to efflux only. It blocks the efflux pumps, and in turn, there is a decrease in the SP cells as the dye is retained (Wolmarans et al., 2018). We observed that as the BC cells acquired radioresistance, there is an increase in the SP cells (Supplementary Figure 2A). We also observed increased number of ALDH positive cells in the radioresistant population (Supplementary Figure 2B). Taken together these results confirm increased number of CSC when BC cells acquire radioresistance. With increased CSCs in the cell population, radioresistant BC cells showed increased heterogeneity. Further, we planned to verify if the CSCs population display higher survival against γ-radiation. By isolating the SP and non-SP (NSP) population from cell sorter (Figure 3D), we performed a clonogenic survival assay after exposing both radioresistant and baseline ZR-75-1 and MCF-7 cells to a single fraction of 2Gy and 8Gy radiation dose (Figure 3E,F and Supplementary Figures 2F,G). The SP population of both cell lines showed significantly higher survival capacity than the respective baseline or NSP population. Enhanced mammosphere forming capability of the SP cells over NSP cells validated the stemness phenotype (Supplementary Figure 2C). Survival assessment results were further supported by a lesser degree of DNA double-strand breaks (DSB) in SP cells determined by γ-H2AX foci assessment (Supplementary Figures 2D,E). Taken together these results indicate that BC cells when exposed to repeated low dose of RT, may turn heterogeneous with an increase of BCSC in the cell population, a subpopulation of cells that likely help to defy the therapeutic assault.
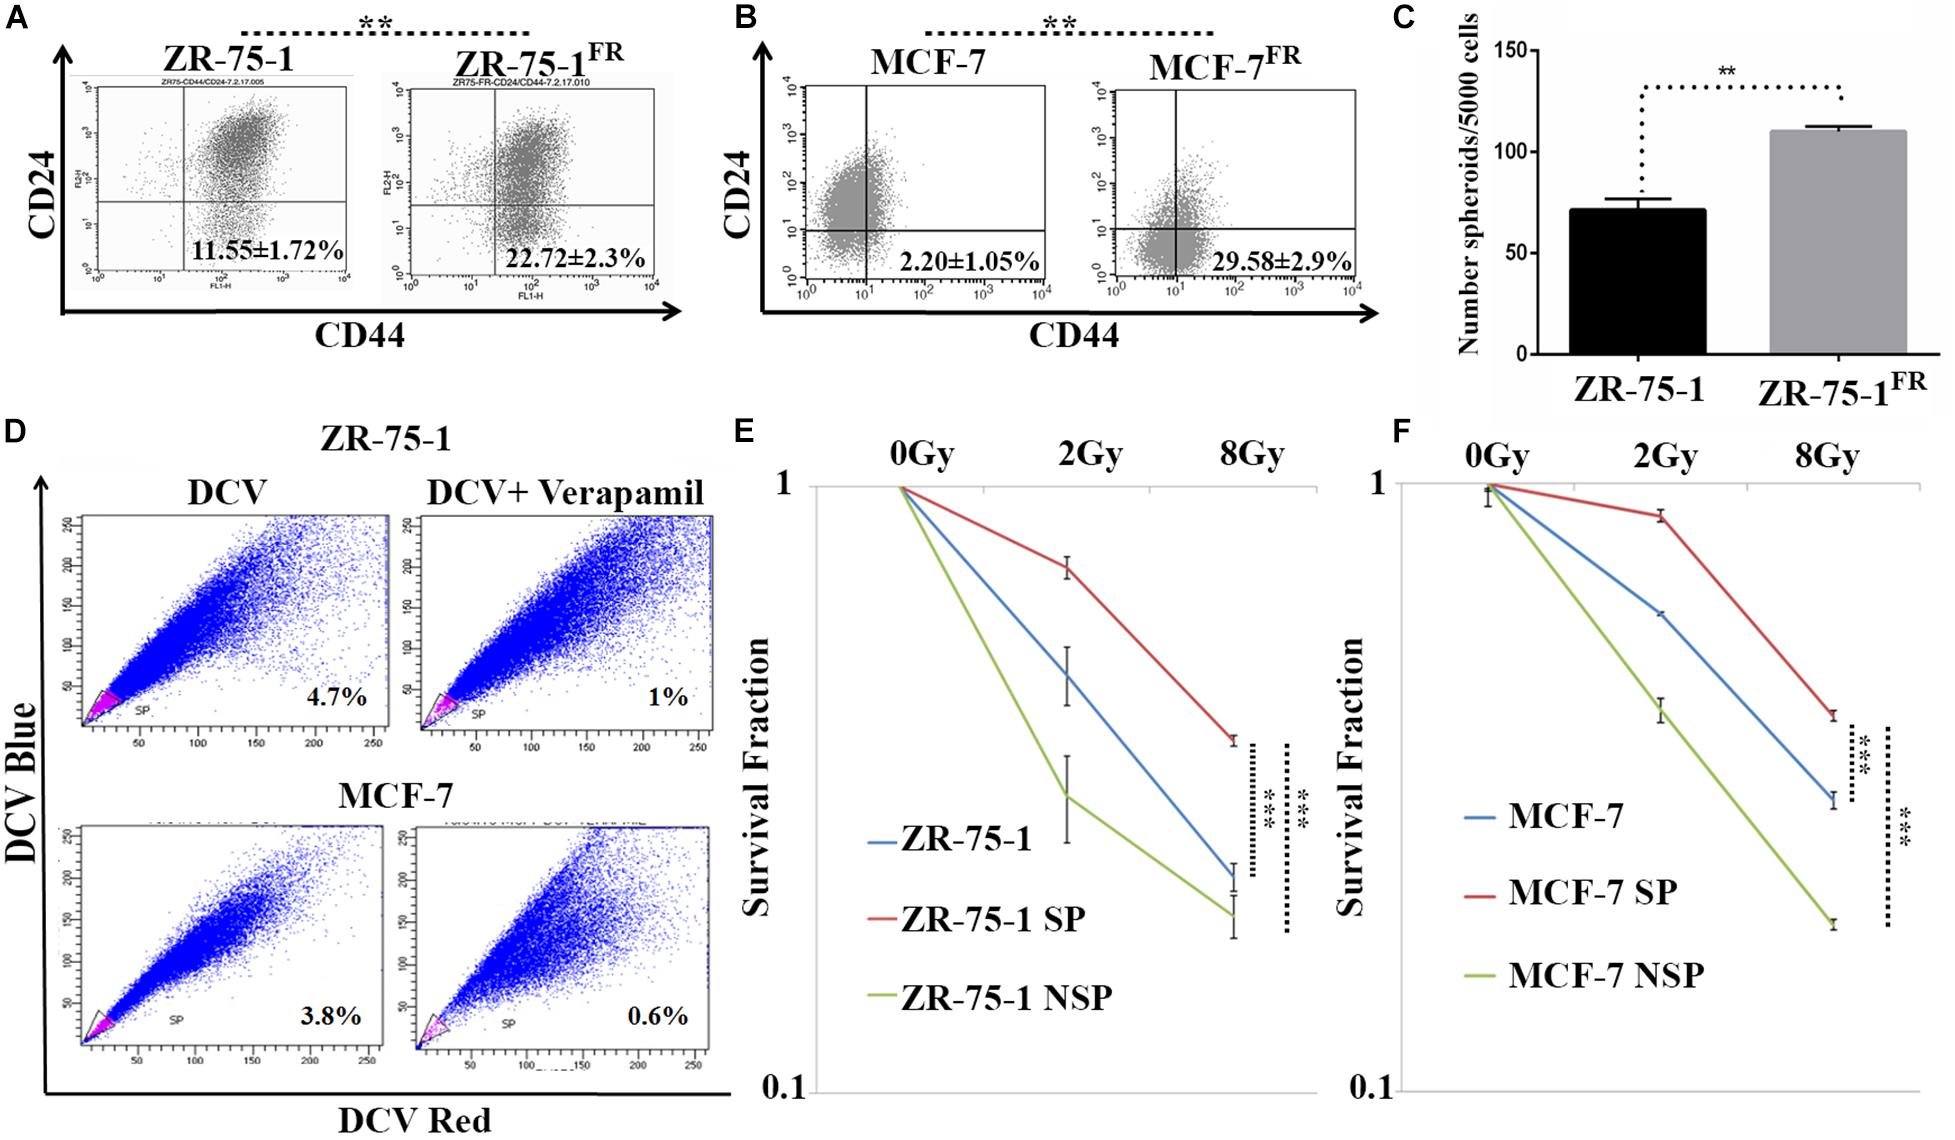
Figure 3. CSCs are closely linked with acquired radioresistance phenotype in BC cells. (A,B) Flow cytometry data represents the BCSC biomarker CD24Low and CD44High (lower right quadrant) in ZR-75-1 and MCF-7 and their radioresistant counterpart, respectively. (C) Graph represents the number of spheroids formed by ZR-75-1 and ZR-75-1FR cells during mammosphere assay. Statistical significance is calculated by Student’s t-test; **P < 0.01. (D) Charts representing the percentage of side population (SP) sorted out from ZR-75-1 and MCF-7 cell lines. SP is represented within the gated area in pink color and the non-SP (NSP) cells were in blue color. (E,F) Graphs showing survival potentials of SP, NSP and baseline population of ZR-75-1 and MCF-7 cells when exposed to 2Gy and 8Gy radiations. ***P < 0.001.
EpCAM Overexpressing BC Cells Show Enhanced Ability to Withstand Radiation Stress
So far, we observed that the established FR cell populations show altered EMT properties and increased BCSC subpopulation. We now ask whether a BCSC specific marker/regulatory protein can contribute to radioresistance in BC. Here, we took interest in the EpCAM protein, which is not only a known marker of BCSC, but is also known to be associated with cellular heterogeneity (Bhatia et al., 2019). Moreover, higher EpCAM transcript and protein was observed in sorted SP cell population than in non-SP population (Supplementary Figures 3A–C). Further, using FACS, we isolated MCF-7 cells with high or low EpCAM expression (Supplementary Figures 4A–D). It was found that EpCAMLow cells are more sensitive to radiation than EpCAMHigh cells (Supplementary Figure 4E). EpCAMHigh cells were also able to form higher numbers of mammosphere (Supplementary Figure 4F). Additionally, we have also observed moderate increase of EpCAM level in radioresistant BC cells (Figure 4C). By analyzing a cohort of 904 cancer patients from the METABRIC, TCGA database (Curtis et al., 2012), who underwent RT, it was found that patients with higher than mean value of EpCAM expression show significantly (P = 0.0307) inferior overall survival than those with lower EpCAM level (Figure 4A). This data provides an important insight on the clinical association of EpCAM with poor response to RT in BC. Thereafter, to study the functional role of EpCAM in BC radioresistance, EpCAM overexpressing ZR-75-1 (ZR-75-1EpCAM) clonal cells were established (Figures 4B,C). In comparison to the parental cells, the ZR-75-1EpCAM cells showed enhanced survival potential similar to ZR-75-1FR radioresistant cells. When ZR-75-1EpCAM cells were exposed to a bolus 8Gy γ-radiation, the survival fraction increased significantly (P < 0.001) than the baseline cell (Figure 4D and Supplementary Figure 5A). A high DMF value of 1.96 in EpCAM overexpressing cells also indicates radioresistance due to EpCAM overexpression.
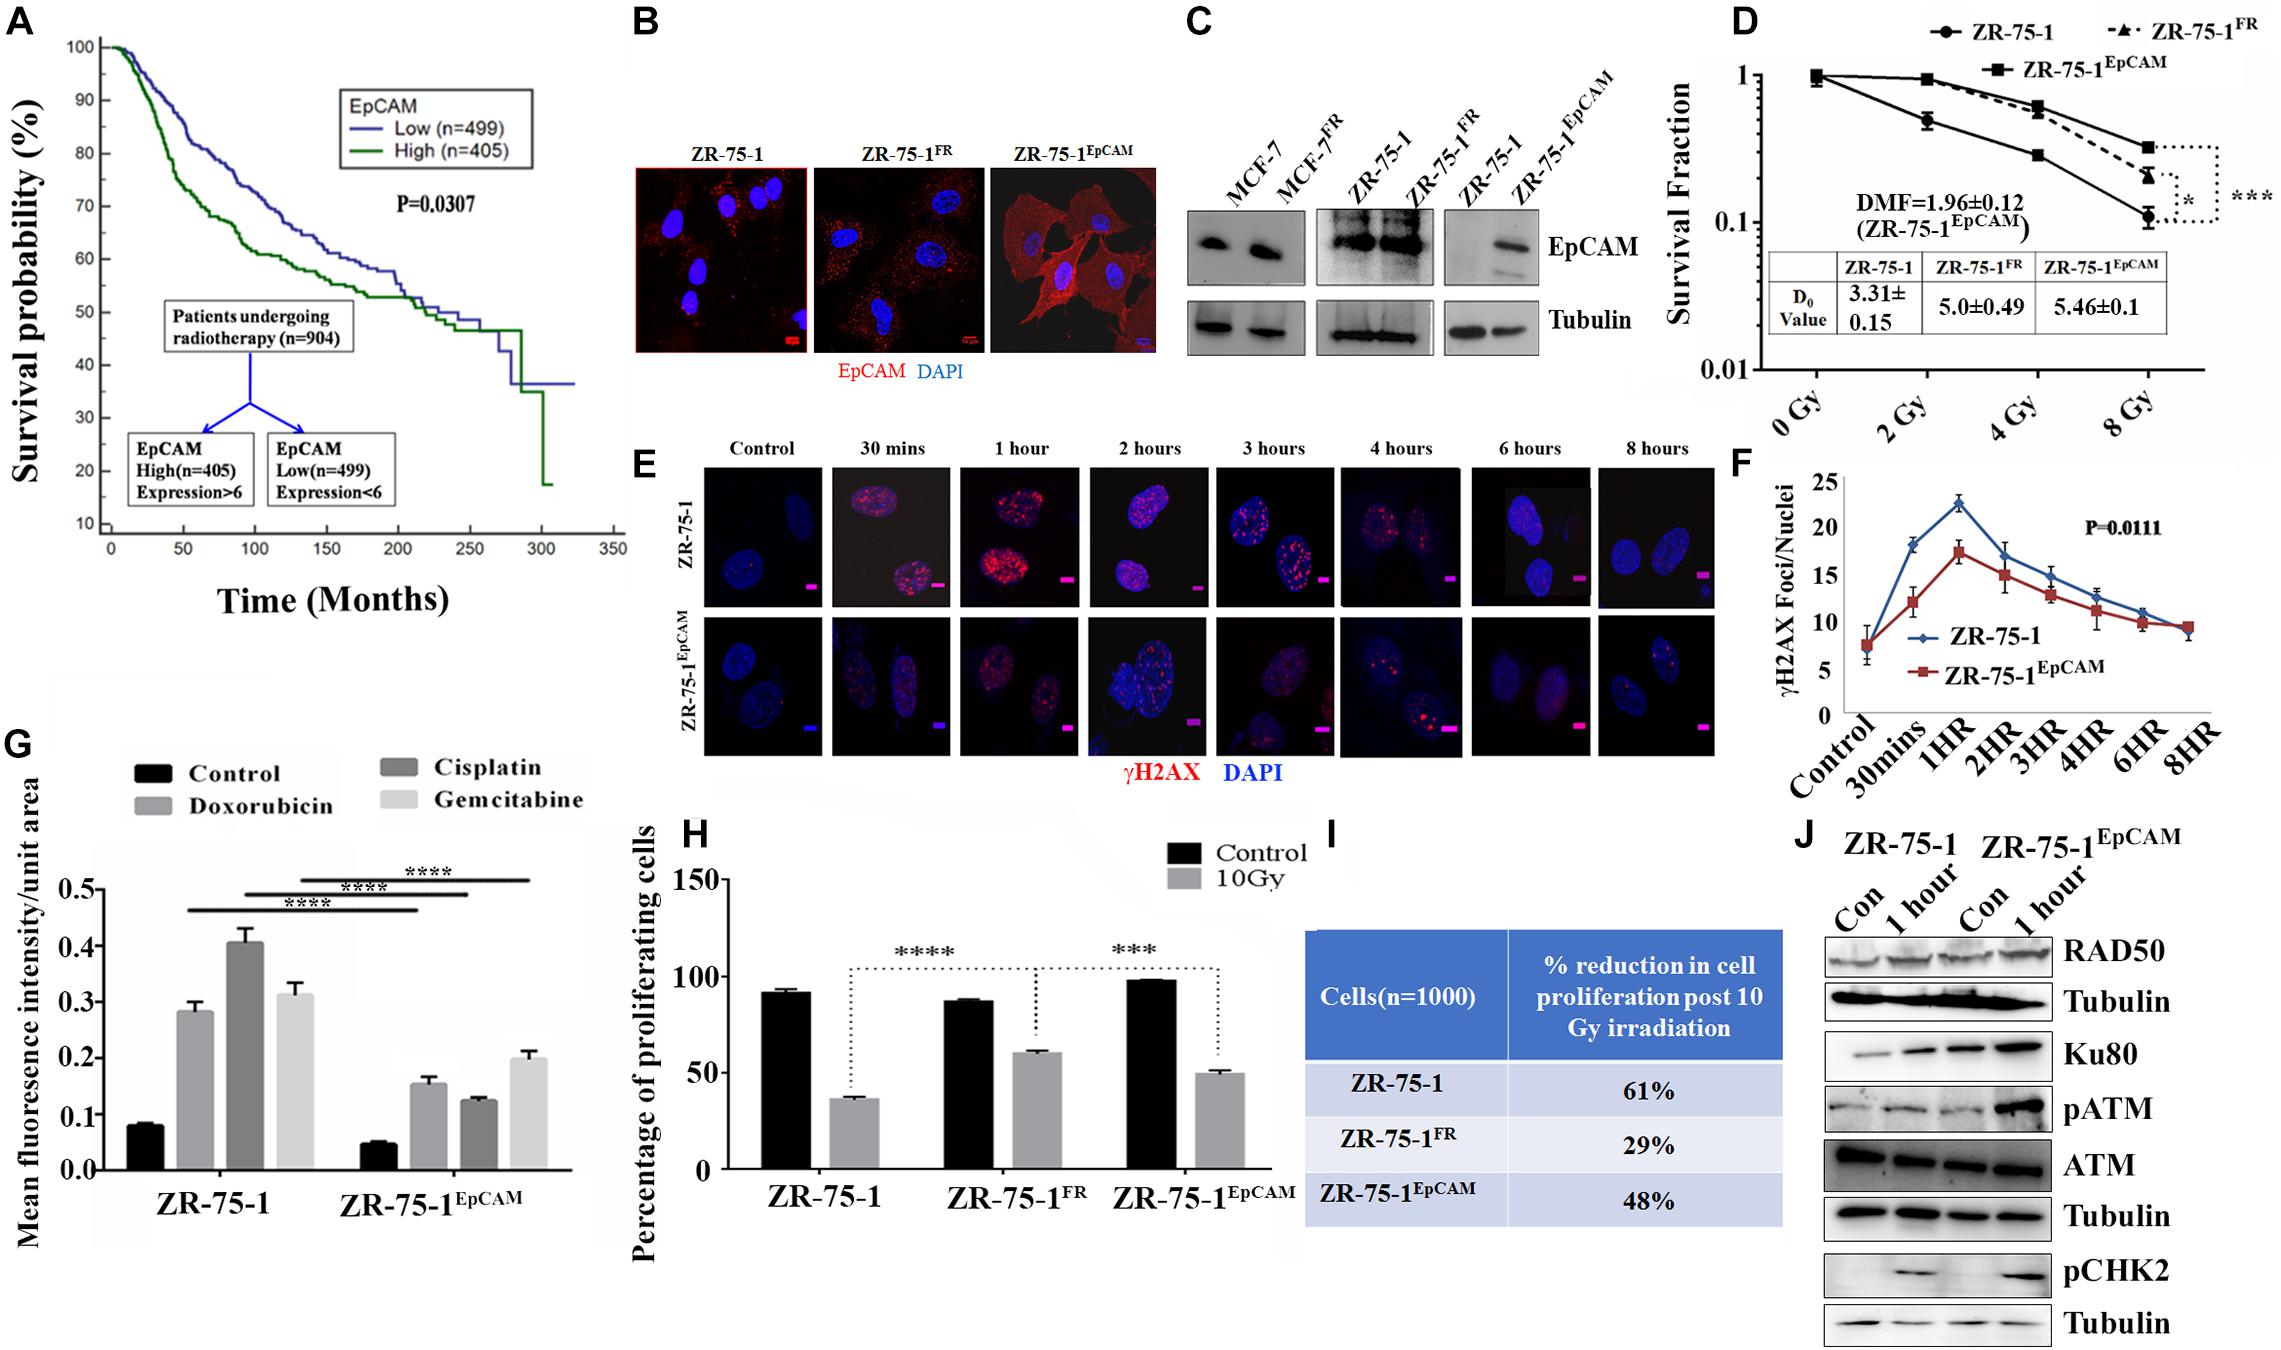
Figure 4. Association of EpCAM with BC radioresistance. (A) Kaplan Meier graph showing the overall survival difference between the EpCAM high and EpCAM low groups of 904 patients who underwent radiotherapy in the METABRIC dataset. (B) Immunofluorescence photomicrograph showing EpCAM expression (red) in ZR-75-1, ZR-75-1FR, and ZR-75-1EpCAM cells, cross-stained with DAPI (blue) (Scale bar-10 μm). (C) Semi-quantitative Western blots showing the level of EpCAM. For comparison of EpCAM level between MCF-7 and MCF-7FR as well as ZR-75-1 and ZR-75-1EpCAM, 40 μg of protein was loaded. While in case of ZR-75-1 and ZR-75-1FR 150 μg of protein was loaded. (D) Comparison of survival fraction between ZR-75-1, ZR-75-1FR, and ZR-75-1EpCAM cells against different doses of radiation. Inset table indicates radio-resistivity index (D0 value) for each. Dose modifying factor(DMF) of ZR-75-1EpCAM cells is shown in inset (E,F) Immunofluorescence photomicrograph and graphical representation of γH2AX (red) time kinetic in ZR-75-1 and ZR-75-1EpCAM cells (n = 45) after 2Gy radiation exposure. The nucleus is cross-stained with DAPI (blue) (Scale bar-5 μm). Statistical significance between the two groups in (F) is determined by Anova. (G) Graph showing mean fluorescence intensity of γH2AX foci in ZR-75-1 and ZR-75-1EpCAM cells (n = 45) 24 h after treatment with DNA damaging chemotherapeutic drugs, i.e., Doxorubicin (10 μg/ml), Cisplatin (15 μg/ml), and Gemcitabine (60 μg/ml). (H) Graph showing the proliferation fraction of ZR-75-1, ZR-75-1FR, and ZR-75-1EpCAM cells before and after 10Gy irradiation as determined by EdU proliferation assay. Statistical significance in (G,H) is determined by Student’s t-test. (I) The table represents data derived from the EdU assay as the percentage reduction in cell proliferation in 10Gy irradiated cells over unexposed control. (J) Semi-quantitative Western blot showing expression of important molecules of DNA repair pathways involved in untreated and 2Gy radiation treated ZR-75-1 and ZR-75-1EpCAM cells. *P < 0.05, ***P < 0.001, and ****P < 0.0001.
As a measure of acquired radioresistance, it was observed that the FR cell lines display lesser numbers of γH2AX foci formed than their own parental cell line when exposed to 2Gy irradiation. In radioresistant SP cells (with high EpCAM expression), we have observed that γ-radiation induces less DSB (Supplementary Figures 2D,E). Now, by comparing DSB kinetics between ZR-75-1EpCAM and parental cells it was found that the ZR-75-1EpCAM cells have 34, 23, 12, 13, 11, and 10% lower foci than in ZR-75-1 cells at 30 min, 1, 2, 3, 4, and 6 h respectively, thus suggesting that EpCAM overexpressing cells can withstand higher DNA injuries (Figures 4E,F). We have also verified γH2AX foci formation in ZR-75-1EpCAM cells after incubating with other DSB-inducing chemotherapeutic drugs like Doxorubicin (10 μg/ml), Cisplatin (15 μg/ml), and Gemcitabine (60 μg/ml). ZR-75-1EpCAM cells again showed lower numbers of γH2AX foci than parental ZR-75-1 (Figure 4G and Supplementary Figure 5B). Subsequently, it was also observed that radiation exposure have a diminishing effect on DNA synthesis and, in turn, cell proliferation in ZR-75-1EpCAM cells in comparison to its parental counterpart (P < 0.001), measured by EdU assay after 10Gy γ-radiation exposure (Figures 4H,I). The cell cycle analysis showed that higher proportions of ZR-75-1 cells are in the G0/G1 phase while the ZR-75-1FR and ZR-75-1EpCAM cells have entered either S phase or G2/M phase after 10Gy irradiation (Supplementary Figure 5G). This indicates that the ZR-75-1FR and ZR-75-1EpCAM cells are undergoing DNA synthesis and is in line with the proliferation data. Further, it was observed that in comparison to ZR-75-1 and ZR-75-1FR cells ZR-75-1EpCAM cells have faster growth rate. When cells were exposed to 2Gy, 4Gy, and 8Gy of radiation, we observed that the ZR-75-1FR and ZR-75-1EpCAM cells have enhanced proliferation rate in comparison to ZR-75-1 cells (Supplementary Figures 5C–F). This imply that radiation have diminished anti-proliferative effect on ZR-75-1FR and ZR-75-1EpCAM cells.
Additionally, we verified the change in expression of key proteins involved in DSB repair in the EpCAM overexpressing cells. Comparing the cell lysates prepared from ZR-75-1 and ZR-75-1EpCAM cells unexposed or exposed with 2Gy radiation, presence of higher Ku80, and Rad50 protein was observed in the radiation exposed ZR-75-1EpCAM cells (Figure 4J). These results indicate a key change in both NHEJ (non-homologous end joining) and HR (homologous recombination) pathway mediated enhanced DSB repair in ZR-75-1EpCAM cells. A higher level of key downstream components such as phosphoATM and its downstream target phosphoCHK2 were noticed in ZR-75-1EpCAM radiation exposed cells. Collectively, the data indicate that the ZR-75-1EpCAM cells are less susceptible to DNA damage against radiation or chemotherapeutic assaults as EpCAM overexpression empowers the DSB repair machinery.
EpCAM Overexpressing BC Cells Show Enhanced Stemness and Heterogeneity
Experimental results obtained so far have shown that radioresistance and BCSC phenotype are intermingled. We have also established that BCSC marker protein EpCAM contributes to radioresistance. These results raise a further question of whether high EpCAM expression can enhance BCSC population in BC cell lines. To address this, we have performed a comparative assessment of CSC between ZR-75-1EpCAM and ZR-75-1 cells. Assessment of CD44+/CD24– cell population by flow cytometry showed over two-fold higher CSCs in ZR-75-1EpCAM than ZR-75-1 cells (Figure 5A). This result was further supported by a two-fold higher SP cells in ZR-75-1EpCAM (Figure 5B) and significantly higher numbers of mammospheres (P < 0.001) formed in specified culture conditions (Figure 5C). As all the above results indicated a higher CSC population present in EpCAM overexpressing cell line, we further checked for total and phospho-AKT expression, as AKT is one of the key regulators of stemness genes (Rivas et al., 2018). Immunoblots indicate higher activation of AKT in ZR-75-1EpCAM compared to the ZR-75-1 cells (Figure 5D). Thereafter, by incubating ZR-75-1EpCAM cells with an AKT inhibitor, significantly lower (P < 0.05) numbers of mammospheres formation were observed in treated condition (Figure 5E). These results affirm that EpCAM overexpression mediated enhanced AKT activation may help in promoting stemness characters in BC cell population.
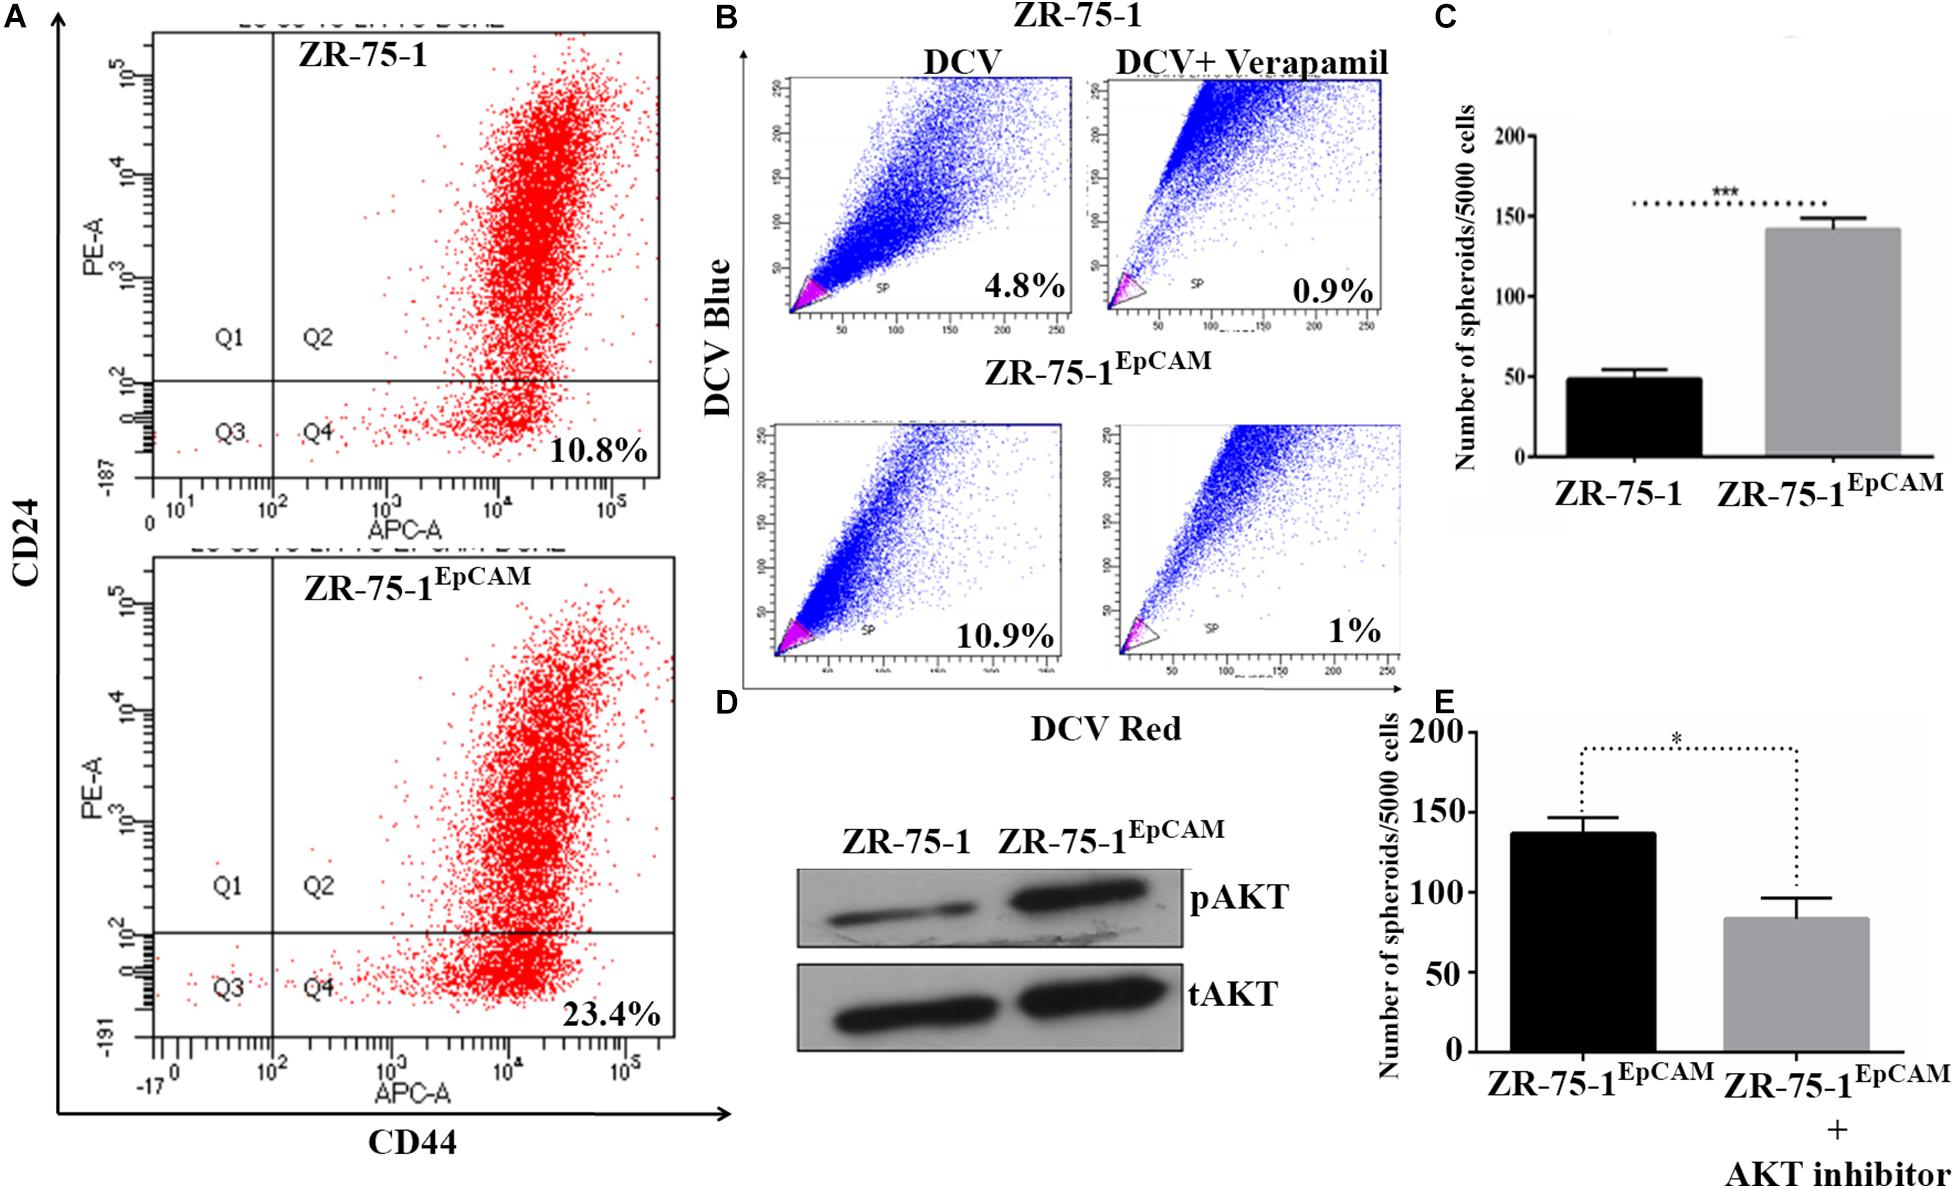
Figure 5. EpCAM overexpression lead to an increase in BCSC subpopulation. (A) Flow cytometry analysis for BCSC surface markers CD24Low and CD44High (on lower right quadrant). (B) Dot plot showing SP cells (pink) in ZR-75-1 and ZR-75-1EpCAM cell populations. (C) Graph showing the quantitative differences in mammosphere formation ability between the cells. (D) Western blots showing the level of phosphoAKT (pAKT) and total-AKT (tAKT) in ZR-75-1 and ZR-75-1EpCAM cells. (E) Number of spheroids formed in ZR-75-1EpCAM cells treated with or without AKT inhibitor(100 nM). Statistical significance of data in (C,E) is determined by Student’s t-test. *P < 0.05, ***P < 0.001.
Cancer stem cells being the tumor initiating cells, cancer cell population with enriched CSCs are expected to form tumor faster by implanting relatively lesser number of cells in vivo (Chiang et al., 2017). To verify this, only 100,000 unsorted cells of ZR-75-1EpCAM or ZR-75-1 in the mammary fat-pad were implanted in two sets of mice. By monitoring the tumor growth using non-invasive bioluminescence imaging, it was observed that 3 out of 5 mice in the ZR-75-1EpCAM group and only 1 out of 5 mice in the ZR-75-1 group developed tumor within 30 days (Supplementary Figures 6A–C).
EpCAM Overexpression Increases Cell Migration Potential in BC
Therapy resistant cancer cells are often reported as a source of metastatic relapse (Zhang et al., 2014). As compared to ZR-75-1, ZR-75-1EpCAM cells showed a significantly higher percent of wound closure (P < 0.0001) in scratch wound assay (Figures 6A,B). Further, by tracking single cell migration distance for an average of 50 cells from 3 independent experiments, results reveal that ZR-75-1EpCAM cells traveled longer distances on a 2D matrix than the baseline (Figure 6C). ZR-75-1EpCAM cells showed significantly (P < 0.001) higher rate of migration (Figures 6E,F). While the distribution of migration rate (μm/min) was asymmetric for both the cell lines, prominent increase in skewness (a measure of asymmetry) and kurtosis (a measure of peakedness) of ZR-75-1EpCAM cells compared to ZR-75-1 cells is indicative of increase in phenotypic heterogeneity (Figure 6D). Additionally, assessment of collagen-I degradation assessment also showed that ZR-75-1 cells are significantly less invasive than ZR-75-1EpCAM cells (P < 0.001) on the extracellular matrix (ECM) (Figure 6G,H). Further, important EMT gene transcripts such as Snail, Slug, Twist, and E-cadherin showed significantly higher expression in ZR-75-1EpCAM cells than ZR-75-1, indicating EpCAM overexpression might be transitioning to mesenchymal phenotype (Figure 6I). However, level of E-cadherin, an epithelial marker, in ZR-75-1EpCAM cells have not decreased indicating that these cells have still retained the epithelial features. Thus, like ZR-75-1FR cells which are in an intermediate state between epithelial and mesenchymal phenotype, the ZR-75-1EpCAM cells also show nearly similar phenotype. ZR-75-1EpCAM cells tilts toward mesenchymal trait.
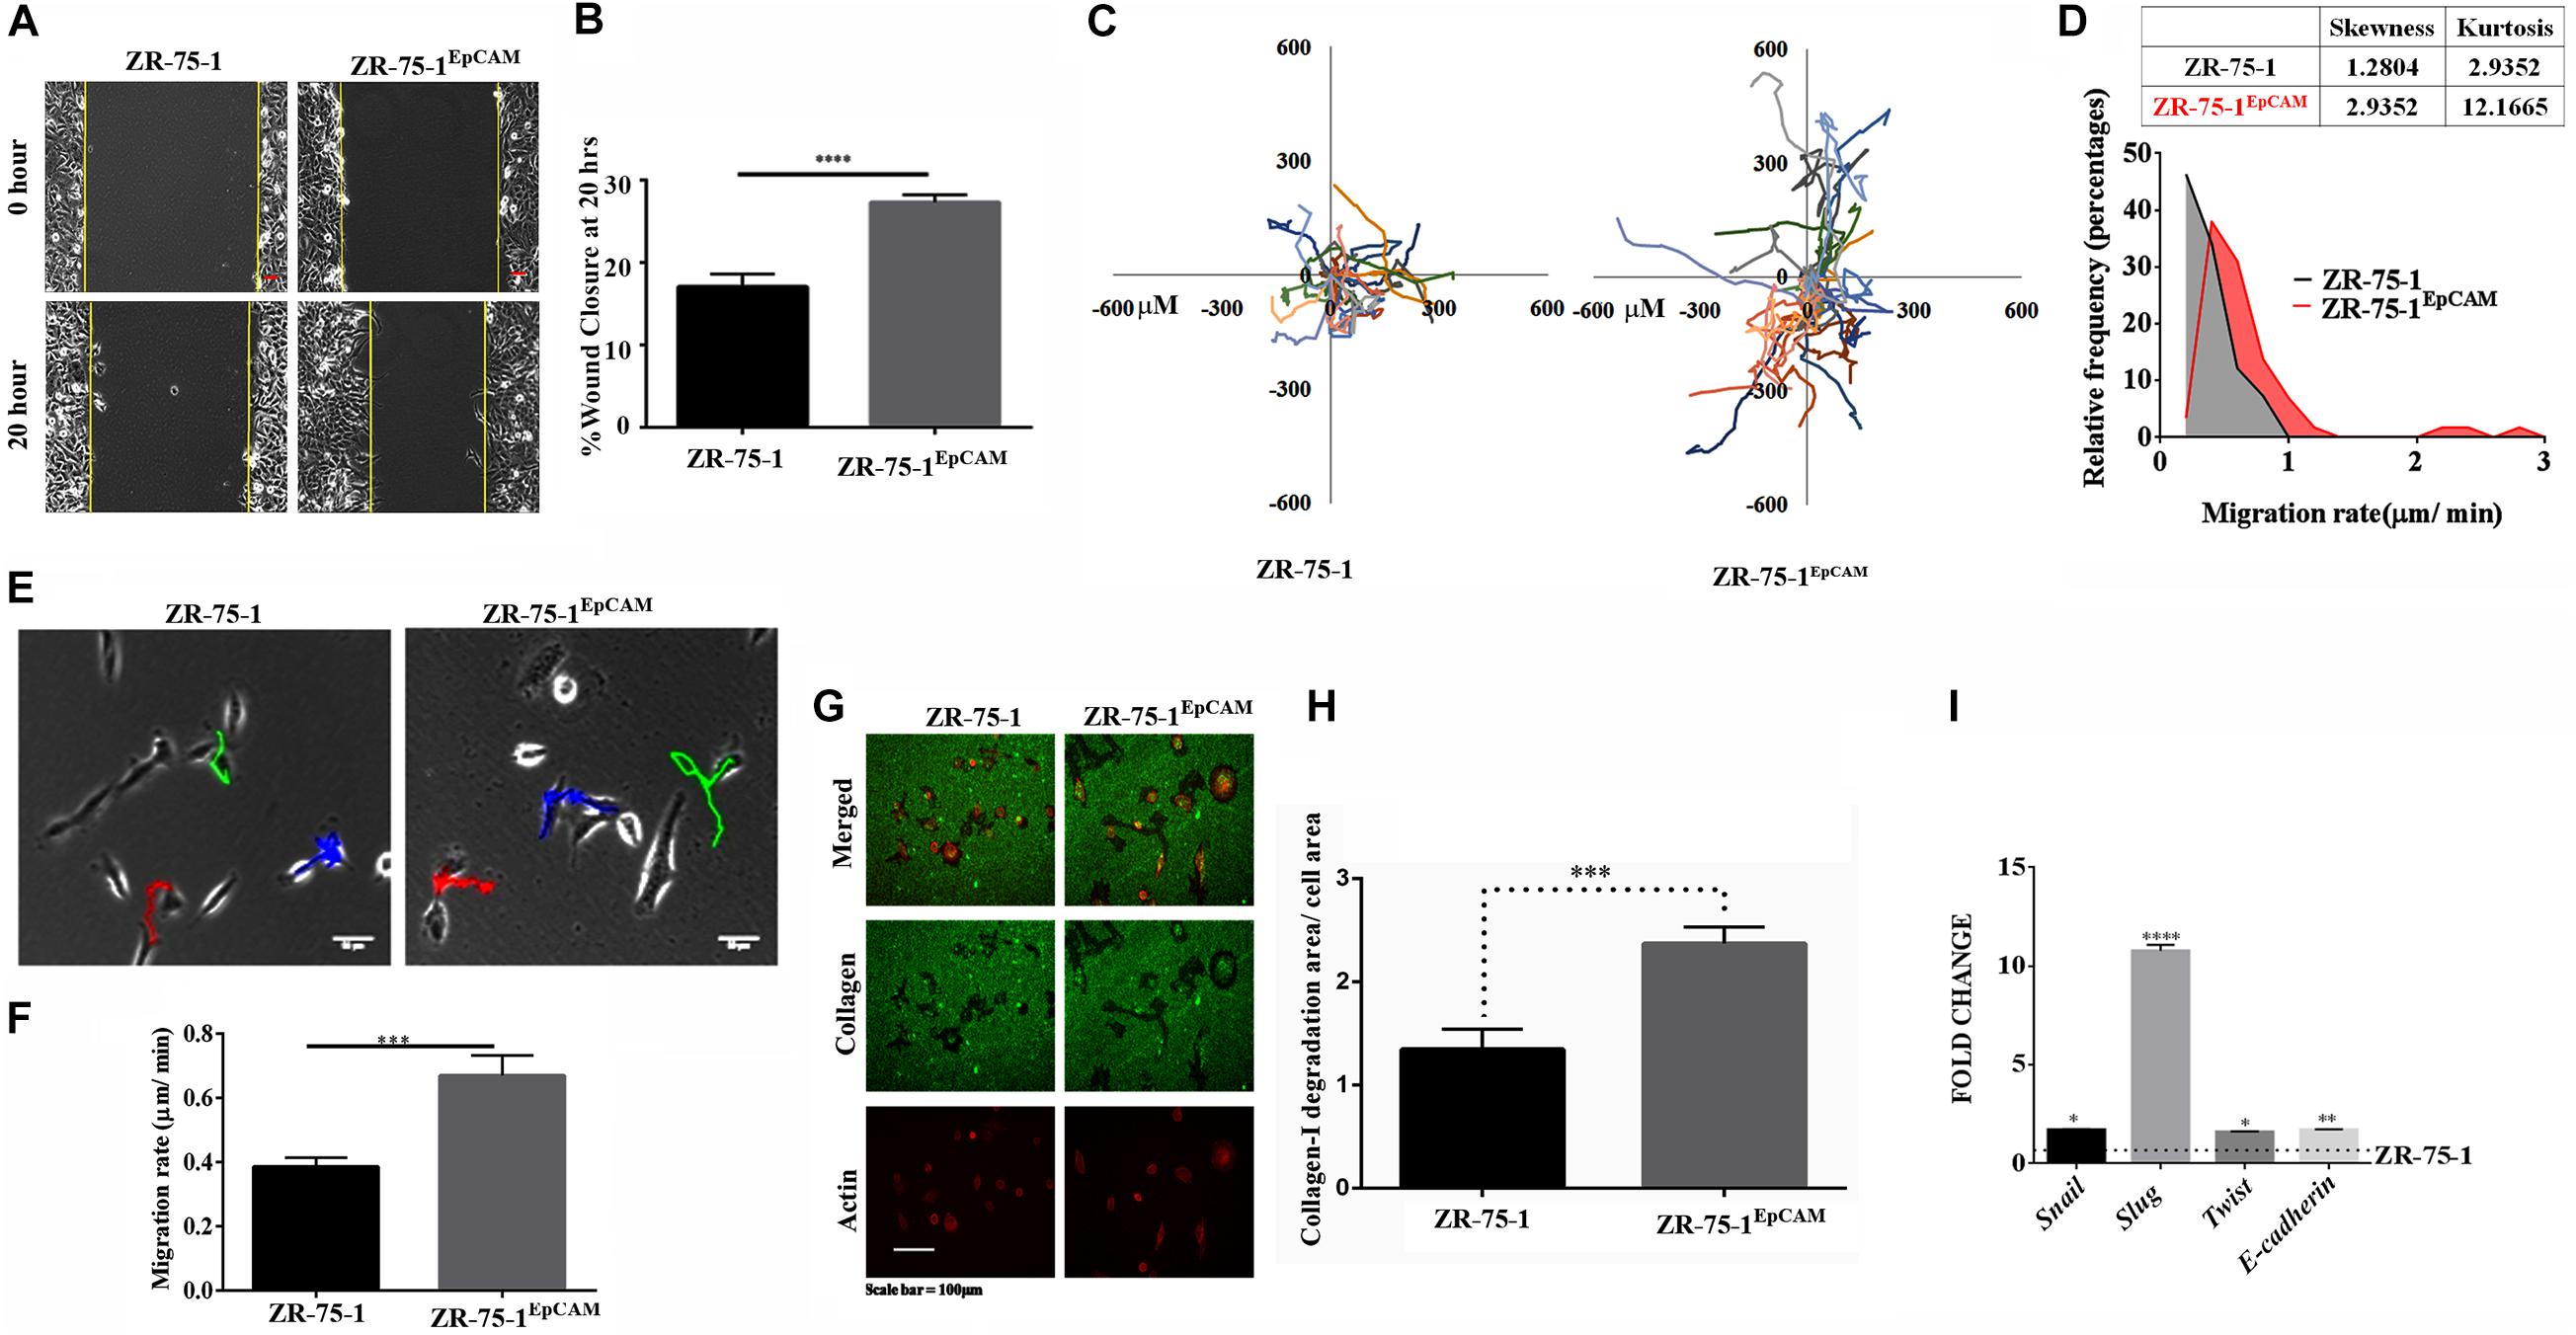
Figure 6. In vitro assessment of metastasis potential of EpCAM overexpressing BC cell. (A,B) Photomicrograph and quantitative assessment data of wound healing migration assay using ZR-75-1 and ZR-75-1EpCAM are depicting collective migration of cells within 20 h timeframe (scale bar 20 μm). (C) Rose plot showing cell migration trajectories. (D) Graph comparing the frequency distribution of ZR-75-1 and ZR-75-1EpCAM cells based on their migration rate. Inset table represents skewness and kurtosis determined from the histogram data. (E) 2D single cell migration assessment of ZR-75-1 and ZR-75-1EpCAM cells (scale bar 10 μm). (F) Graph showing mean single cell migration rate. (G) Fluorescence photomicrograph of 3D migration of the two types of cells by invading through the collagen-I ECM matrix. (H) Bar graph showing the estimated area of collagen-I matrix invaded by these cells after normalization by the area of the cells. (I) Graph showing the relative transcript expression of EMT genes-Twist, Snail, Slug and epithelial gene E-cadherin in ZR-75-1 and ZR-75-1EpCAM cells. ***P < 0.001, ****P < 0.0001.
Cell morphology also provides information on underpinning molecular mechanistics. Differences in the cellular morphology is also reflected in their metatstatic potential. Thus within a cell population tumor cells with varied morphology may have differential metastatic potential (Wu et al., 2020). We have already shown that EpCAM overexpressing cells had higher migration and invasion potential. Moreover, ZR-75-1EpCAM cells have high heterogenous migratory potential. Thus, we looked into the cellular circularity parameter of these cells, a measure of cell roundness. Morphometric analysis of the cells showed a significant difference in the circularity of the cells (Figure 7A). Intriguingly, ZR-75-1 cells showed more homogenous distribution with mean circularity around 0.4, whereas the distribution of ZR-75-1EpCAM represented a wider distribution range of mean circularity with multiple peaks (Figure 7B), which provides further support to their migration potential. Lower kurtosis value of the circularity distribution for ZR-75-1EpCAM cells compared to ZR-75-1 cells further points to the presence of multiple sub-populations in ZR-75-1EpCAM cells.
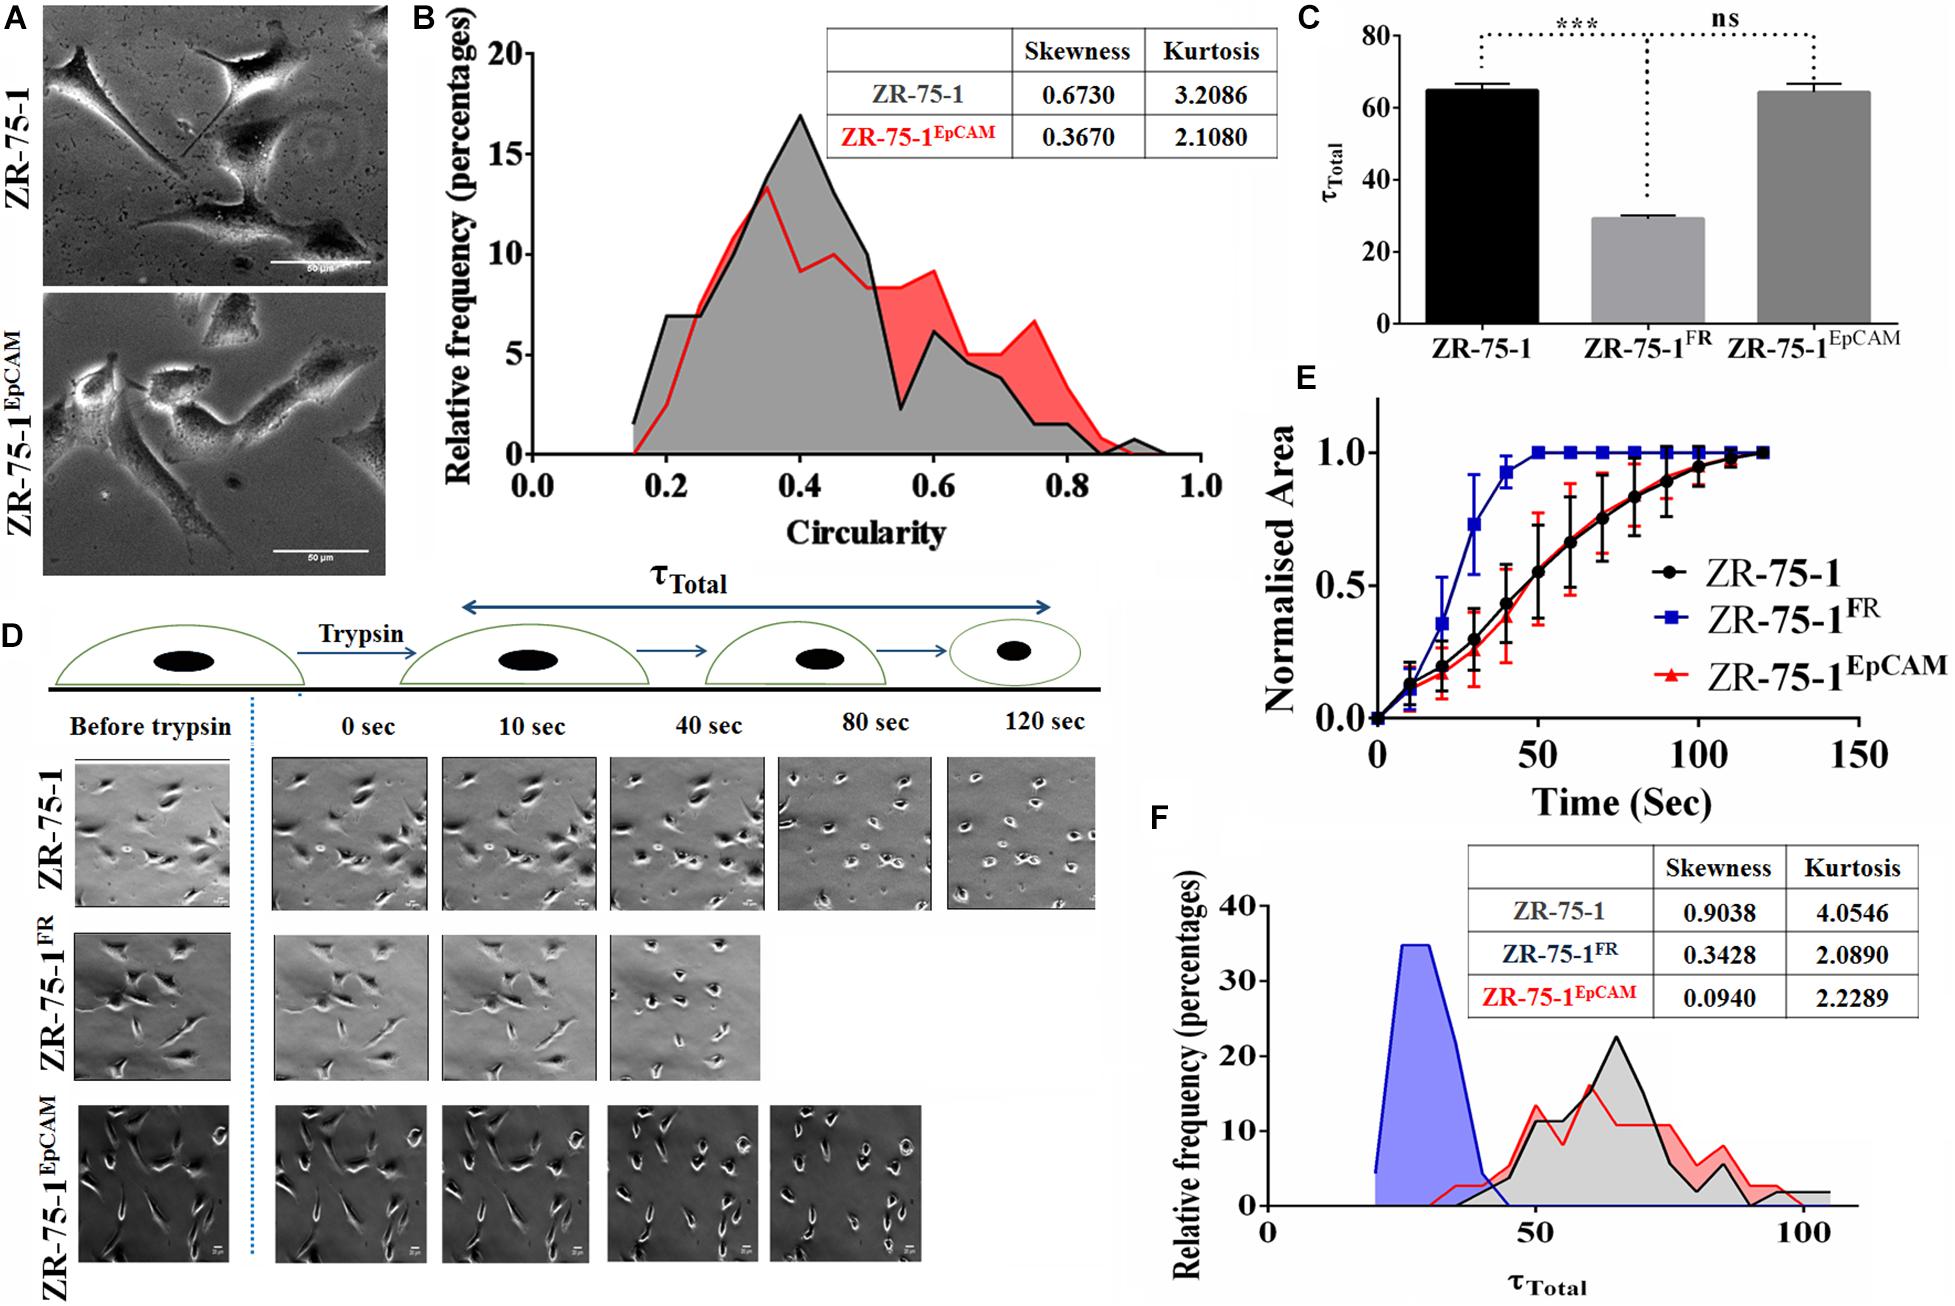
Figure 7. Measurement of cellular morphology and contractility parameters. (A) Photomicrograph showing the morphology of ZR-75-1 and ZR-75-1EpCAM cells (scale bar 20 μm). (B) Graphs showing the relative frequency distribution of ZR-75-1 and ZR-75-1EpCAM cells based on their circularity. Inset table represents skewness and kurtosis determined from the histogram data. (C) Graph representing the total de-adhesion time constant (τTotal) of ZR-75-1, ZR-75-1FR, and ZR-75-1EpCAM cells. (D) Time lapse photomicrograph of de-adhesion kinetics of ZR-75-1, ZR-75-1FR, and ZR-75-1EpCAM cells (scale bar 20 μm). (E) Graph showing the normalized area of ZR-75-1, ZR-75-1FR, and ZR-75-1EpCAM cells during the de-adhesion kinetics as a function of time. (F) Graph showing the relative frequency distribution of ZR-75-1, ZR-75-1FR, and ZR-75-1EpCAM cells based on their τTotal values. Inset table represents skewness and kurtosis determined from the histogram data. The statistical significance of (C) is determined by the Student’s t-test. ns, non-signficant, ***P < 0.001.
As actomyosin contractility is an important requirement for enabling cell migration, we have also investigated this aspect. The cellular contractility was measured by trypsin de-adhesion assay. The de-adhesion timescale (τTotal) is directly influenced by the actomyosin contractility and is inversely proportional to the cellular contractility (Kapoor et al., 2018). As expected, the ZR-75-1FR cells were found highly contractile and exhibited fastest de-adhesion. Surprisingly, there was no significant difference in de-adhesion timescales of ZR-75-1 or ZR-75-1EpCAM cells (Figures 7C–E). However, points worth noting here is that both skewness and kurtosis values for ZR-75-1EpCAM cells are much lower than ZR-75-1 cells indicating a wider variabilities on τTotal parameter (Figure 7F). EpCAM overexpressing ZR-75-1 cells and ZR-75-1FR cells behaves similarly in many aspects, they are not mirror image of each other, e.g., they show difference in terms of cellular contractility feature. The probable reason might be the acquired radioresistant BC cells consist of multiple clones. These clones might be generated due to radiation induced reprogramming and/or selection of intrinsically radioresistant clone. The established EpCAM overexpressing cell is monoclonal, this is derived from a single cell.
EpCAM Overexpression Promotes in vivo Tumor Growth, Radiation Insensitivity, and Distant Metastasis
Since EpCAM overexpression leads to enrichment of CSCs and the numbers of CSCs in the cell population positively co-relates with tumor development and growth (Chang, 2016; Papaccio et al., 2017), we investigated the effect of EpCAM expression on in vivo tumor development. Firefly luciferase reporter tagged ZR-75-1EpCAM cells exhibited faster tumor growth kinetics than their baseline counterparts over 30 days (Figure 8A). Palpable tumors were observed within 15 days after cell implantation in all 5 mice of ZR-75-1EpCAM group, but only in 3 out of 5 mice of ZR-75-1 group. The ZR-75-1EpCAM cells form a significantly larger volume of the orthotopic tumor (P < 0.001) within the timespan of the experiment, indicating EpCAM overexpression promotes in vivo tumor growth (Figure 8B).
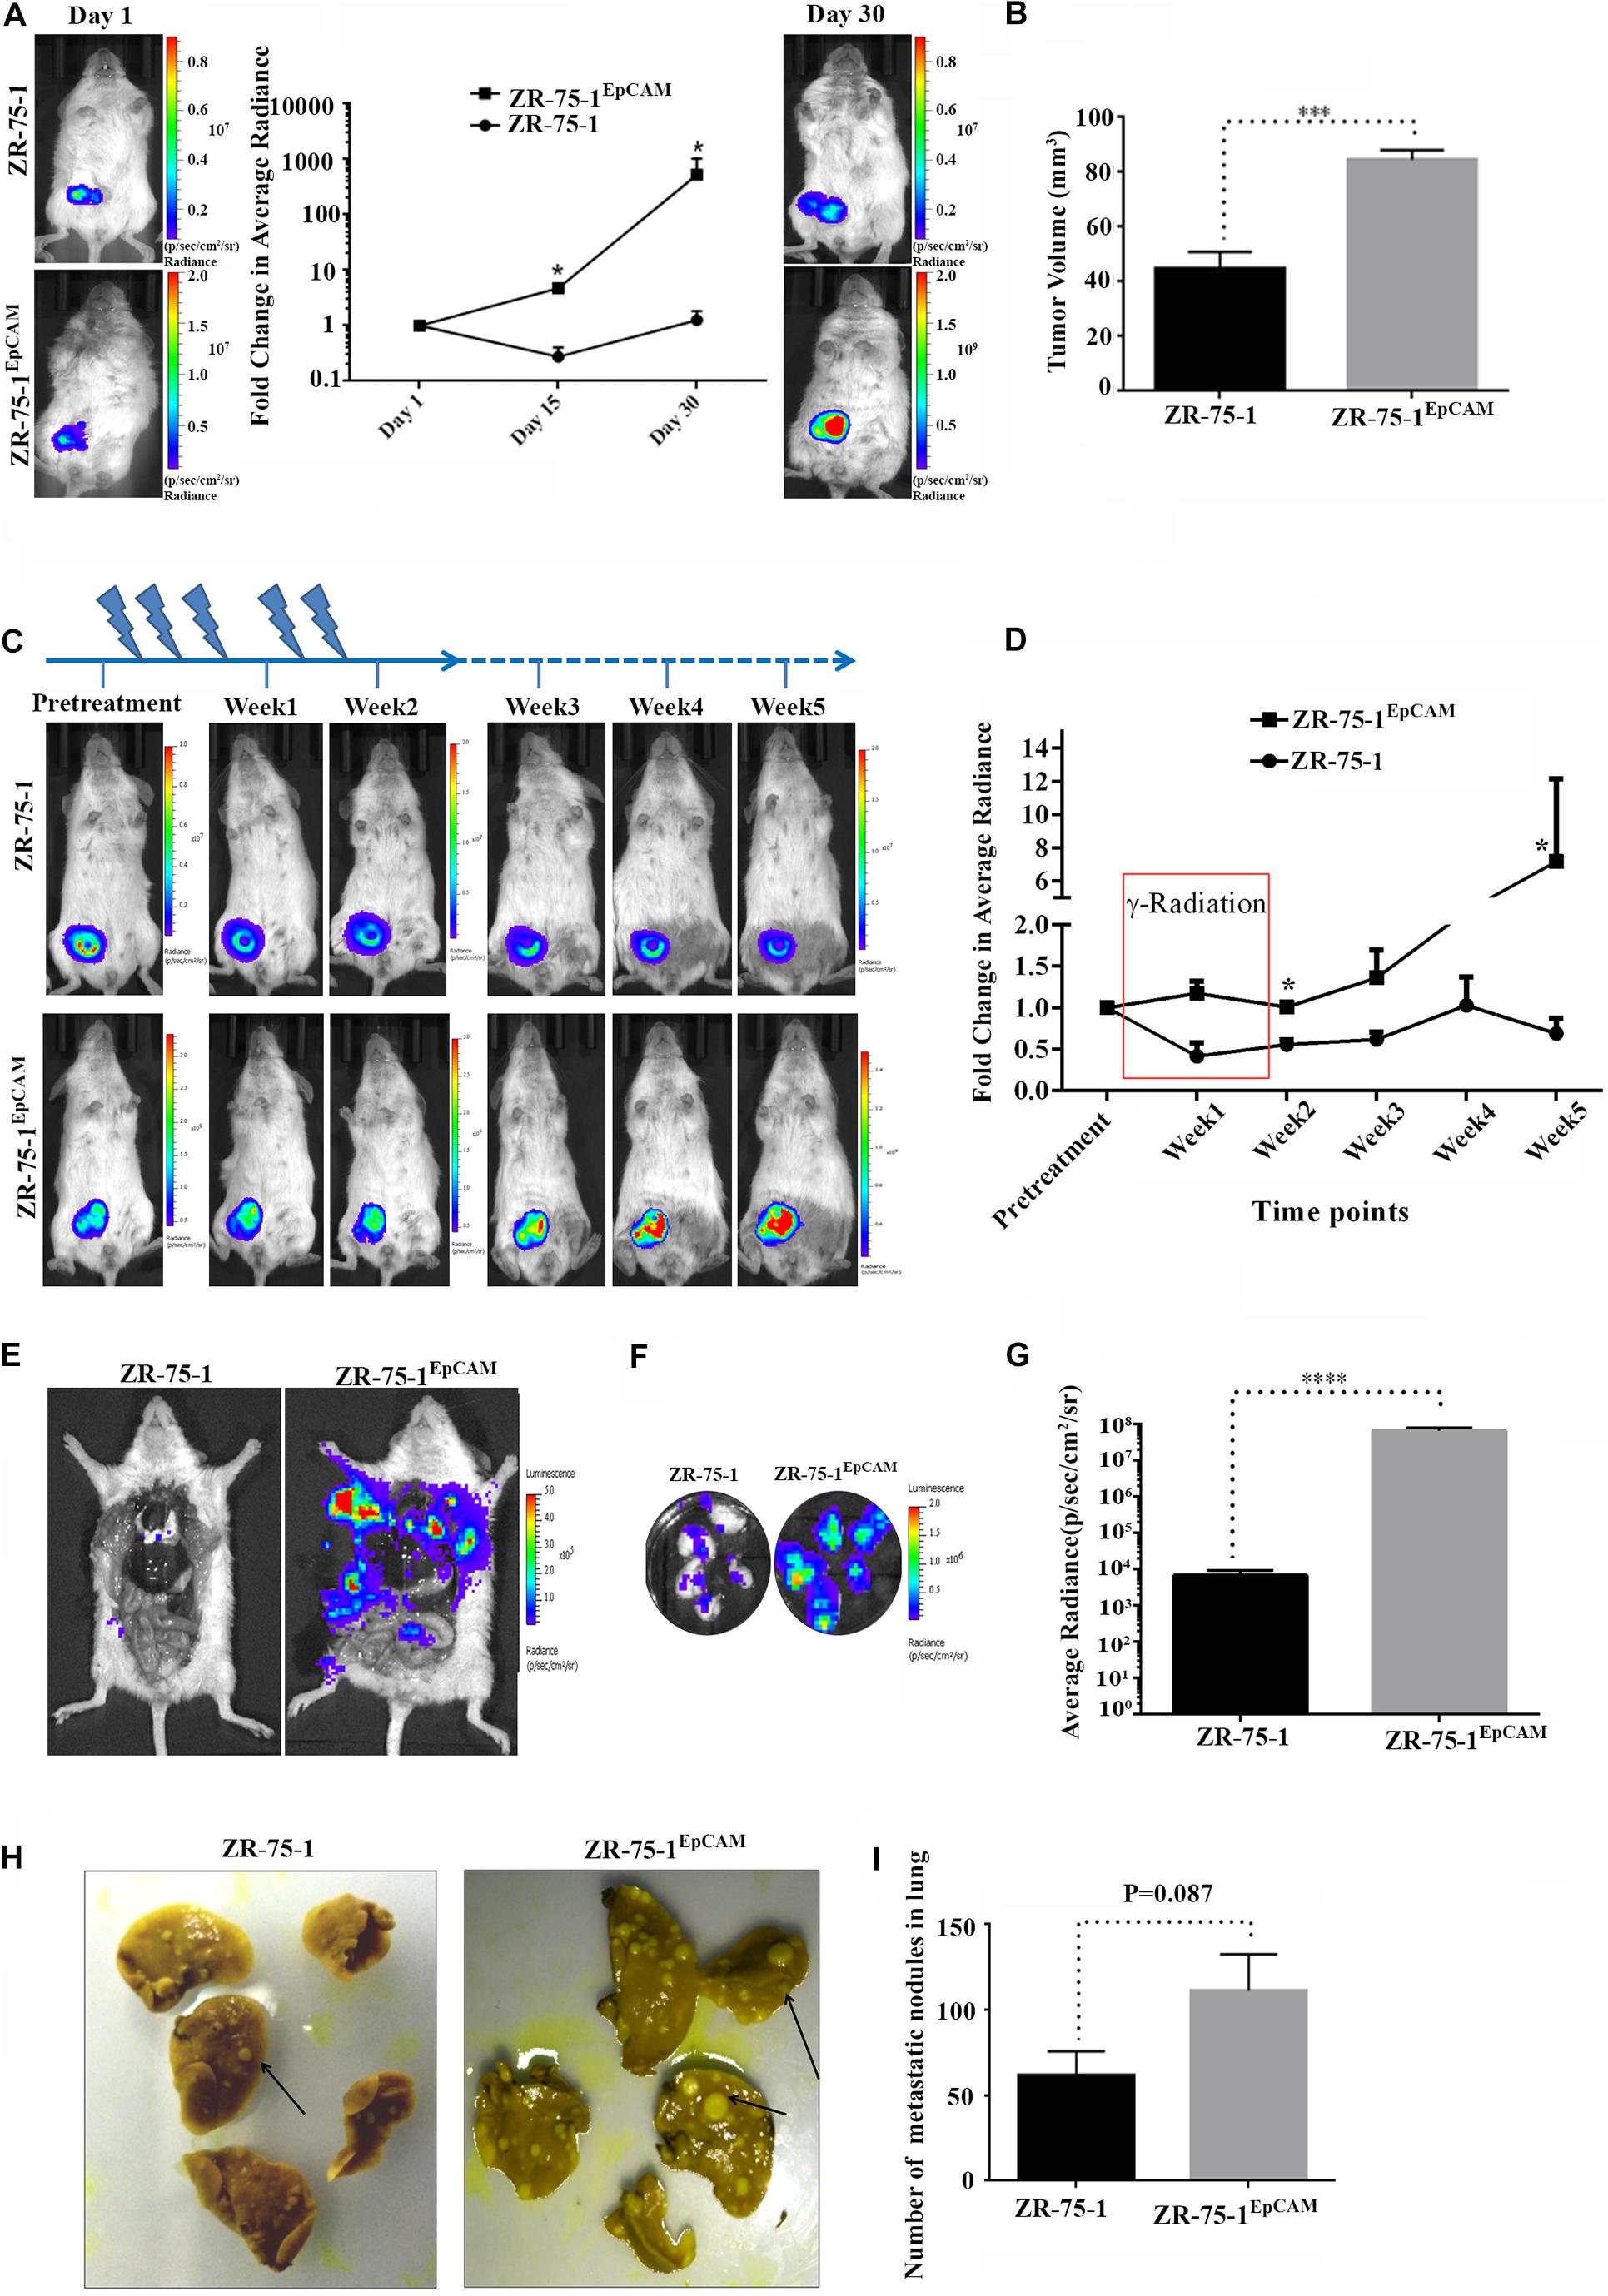
Figure 8. Effect of EpCAM overexpression on in vivo tumor growth, RT efficacy and distant metastasis. (A) Representative bioluminescence images of mice (n = 5) imaged at different time intervals after ZR-75-1 and ZR-75-1EpCAM cell implantation in the mammary fat pad. The graph represents fold change in bioluminescence signal with respect to the signal on day 1. (B) Chart showing difference in measured tumor volume on day 30. (C) Bioluminescence images showing in vivo growth kinetics of ZR-75-1 and ZR-75-1EpCAM tumors undergoing RT treatment for 2 weeks, as indicated. (D) Graph representing fold change in tumor bioluminescence signal with respect to the tumor before treatment. (E) Representative images of the ventral view of the mouse from each group dissected and scanned for luciferase signal to show the extent of distant metastasis in major organs. (F,G) Bioluminescence images of dissected lung lobes of control and EpCAM overexpressing group and chart showing quantitative photon signal measured from lungs. (H,I) Representative photographs of fixed lung tissue with metastatic nodules present at the lung surface (black arrow) and a chart showing numbers of surface nodules counted from these. *P < 0.05, ***P < 0.001, and ****P < 0.0001.
Further, to validate the in vitro findings showing EpCAM overexpression makes BC cells less sensitive to RT treatment, ZR-75-1 and ZR-75-1EpCAM orthotopic tumor bearing mice were subjected to local γ-radiation as outlined in Figure 8C. The tumors were exposed to fractionated 5Gy γ-radiation (25Gy in 5 fractions per week) for 2 weeks, and tumor growth kinetics were followed till 5th weeks using non-invasive bioluminescence imaging (BLI). RT exposure during the first 2 weeks of treatment, ZR-75-1 or ZR-75-1EpCAM tumors showed stable disease as evident from respective BLI scan results. However, the ZR-75-1EpCAM group of mice showed a vigorous tumor growth indicated by ∼8 fold higher (P < 0.05) BLI signal than the value observed in ZR-75-1 group (Figures 8C,D). Thus this result validates our in vitro finding that that the ZR-75-1EpCAM tumor are less sensitive to radiotherapy than the ZR-75-1 tumors.
Now, therapy resistant cancer cells are likely to be the source of metastatic relapse (Zhang et al., 2014). We have already shown EpCAM overexpressing cells having higher migratory and invasion potential. Moreover the EpCAM overexpression showed increase in E/M hybrid state and enhanced heterogeneity of cell morphology, which in turn is known to show higher metastatic potential as well. Therefore, we further verified the effect of EpCAM overexpression on in vivo metastatic potential. The luciferase labeled ZR-75-1EpCAM cells implanted at orthotopic location in a set of mice showed higher BLI signals primarily from the lung area of mice, indicating enhanced secondary tumor growth. Further, confirmation came from the end point, where dissected lung lobes of the ZR-75-1EpCAM group showed significantly (P < 0.0001) higher quantity of BLI photon signals than ZR-75-1 group (Figures 8E–G). The dissected lung lobes were further fixed and counted for the number of foci formed with variable size on the surface, which showed nearly two-fold higher numbers of foci in the ZR-75-1EpCAM group than the control group (Figures 8H,I). Further, H and E staining of the metastasized lung tissue showed there is increased number of secondary metastasis for ZR-75-1EpCAM group in comparison to the ZR-75-1 group (Supplementary Figures 7A,B).
Discussion
Radiotherapy being a practiced treatment modality for BC management, the resistance that develops in patients during the treatment phase is a practical challenge. Due to intra-tumoral heterogeneity in BC, distinct subpopulations of cells responding differently to a given RT load are one of the major obstacles to address this clinical challenge (Hong et al., 2018). Further, the dynamic nature of heterogeneity due to cellular plasticity at different stages of resistance development complicates the matter. The numbers of CSCs within a cell population also varies and part of this dynamicity is known to be contributed by various extrinsic and intrinsic factors (Kong et al., 2020). Here, by isolating CSC subpopulations by cell sorting, we found that they are less susceptible to the radiation (extrinsic factor) induced DNA damage and survive better. After establishing the radioresistant BC cells by repeated exposure to fractionated γ-radiation, our results showed that CSC population directly correlates with the degree of radioresistance, similar to the reported data (Qi et al., 2017). Our study showed that BCSCs subpopulation are intrinsically radioresistant in nature and their proportion goes up within the cell population during the acquirement of radioresistance as well. Further, the established radioresistant cell lines (i.e., ZR-75-1FR and MCF-7FR) showed enhanced focal adhesion. Additionally, experimental results based on the ZR-75-1FR cell line showed that BC cells which can survive fractionated γ-radiation of up to 30Gy display higher resistivity index (D0), which essentially represents a selected pool with altered focal adhesion, increased heterogeneity and CSC enriched phenotype.
Another novel aspect of this study is the role of an important BCSC marker, EpCAM, identified during BC radioresistance development. Even though the modulation of the cellular heterogeneity in BC cells leading to enhancement of CSC subpopulation occurs, developing therapeutics against CSC has its own challenges (Kuhlmann et al., 2016; Dashzeveg et al., 2017). We considered revealing the role of EpCAM as its contribution in acquired radiation resistance development in BC was unknown. Moreover, its association with cellular plasticity (Bhatia et al., 2019) and the therapeutic targeting strategies for EpCAM is also well developed (Eyvazi et al., 2018). Our results established a positive correlation between high EpCAM level and poor clinical outcome in a retrospective analysis of METABRIC trial patient data who undergone RT. In previous studies, EpCAM was established as an adverse prognostic factor for radiotherapy in head and neck squamous cell carcinoma patients (Murakami et al., 2014, 2019). In the experimental cell line, EpCAM was found to have enhanced expression in BCSCs, which are also radioresistant in nature. Thereafter, by establishing the EpCAM overexpressing ZR-75-1 cell line (ZR-75-1EpCAM), we show that its expression can modulate several key molecular features, and thus in turn directs the cells to become radioresistance. Additionally, results of ZR-75-1EpCAM cells also postulated the E/M hybrid status, as it was in ZR-75-1FR as well. Further, the D0 value of ZR-75-1EpCAM cell was found higher than the baseline ZR-75-1 cell. Extending the scope of the study, we also showed that the cell fate instated by EpCAM overexpression can significantly impact in vivo tumor growth, RT treatment efficacy, and, most importantly, increased metastasis to the distant critical organ. Observed EpCAM mediated faster tumor development and growth may be due to higher number of CSCs present in this cell population as well.
Based on the above experimental results, we see that EpCAM expression is leading to enhanced BCSC subpopulation, causing increased cellular heterogeneity in the cell lines. This made us postulate that EpCAM mediated radioresistance may be due to enhanced stemness. Therefore, we evaluated for activated AKT status and found higher phosphoAKT expression in ZR-75-1EpCAM cell indicating EpCAM regulates stemness through activated AKT as a major path. This finding is in line with a past report wherein nasopharyngeal carcinoma, EpCAM mediated stemness by upregulation AKT/mTOR was demonstrated (Wang et al., 2018). EpCAM is also reported to regulate the AKT/mTOR signaling and, in turn, to be involved in prostate cancer radioresistance (Ni et al., 2013). Findings from the current study affirm similar results for BC. Hence, it seems that EpCAM is a generic marker of radioresistance. However, it will still be worthwhile to study this in the context of various molecular sub-types of BC. With the understanding developed here, future investigation should be aimed at validating these findings in BC patient samples and aim at understanding the contribution of EpCAM during stages of development and maintenance of radioresistance in BC cells.
The ablation of cancer cells by γ-radiation is primarily due to the induction of DSBs (Vignard et al., 2013; Santivasi and Xia, 2014; Kumari et al., 2019). In accordance with the reported literature, radioresistant BC cells, BCSCs, and even the ZR-75-1EpCAM cells are found less susceptible to radiation induced DSBs. EpCAM overexpressing cells, when exposed to radiation, displayed elevated expression of key initiator molecules of the two main DSB repair pathways, i.e., Ku80 for NHEJ and Rad50 for HR pathways. We also found that when compared to the irradiated baseline cells, irradiated EpCAM overexpressing cells markedly activates both ATM and its downstream target CHK2. As per the reported evidences, the phospho-CHK2 further carryout the required signaling machinery and helps the cells to cope with the DNA damage (Jin and Oh, 2019). We also observe that ZR-75-1EpCAM cells, by virtue of its enhanced and active DSB repair machinery, are less affected by the DNA damaging chemotherapeutic agents, such as doxorubicin, cisplatin, or gemcitabine.
Now coming to the point of hybrid E/M status or heterogeneity as a linked feature to enhanced metastatic potential of radioresistant BC cells, our analysis of various EMT markers showed that the ZR-75-1FR cell population has neither completely lost their epithelial phenotype nor they showed enhanced mesenchymal phenotype. As a epithelial cell transitioned to mesenchymal phenotype, decreased expression of epithelial markers with increase in mesenchymal markers was observed. But, most of times cells are not in binary state, either being completely mesenchymal or epithelial (Kroger et al., 2019; Yang et al., 2020). Literature reports suggests occurrence of two way transition, i.e., E to M transition (EMT) and M to E transition (MET) (Liu et al., 2016; Bhatia et al., 2020). Thus, cancer cell population attains a phenotype which falls within the spectrum of epithelial to mesenchymal phenotype. Such is a hybrid state, which is essentially linked to cellular plasticity (Jolly et al., 2015) as well as enhanced survival and collective migration.
Previously, we reported that radioresistant BC cells has higher migratory potential (Desai et al., 2018). The integral part of the cancer cell metastasis process involves invasion and cell migration. Hence, we have thoroughly evaluated the EpCAM overexpressing ZR-75-1 cells for their migratory potentials and found that these cells gain the power of both collective as well as single-cell migration on 2D matrix. EpCAM overexpressing cells are found more heterogeneous than the parental cells with respect to their 2D migration rate. Heterogeneity was also apparent for other cellular phenotypes like cell morphology and cellular contractility. Cancer cells can migrate collectively or as a single cell (Friedl and Wolf, 2010), and migrating cells have to invade through the ECM (extracellular matrix) as well. Here we found that high EpCAM expression positively influences increased invasion in the collagen-I matrix. We also observed enhanced migration and invasion potential of ZR-75-1EpCAM cell subsequently leads to enhanced distant metastasis to the lung from the orthotopic primary site in the immunocompromised mouse model. While it is reported that EpCAM expression correlates to distant metastasis in different patient cohorts, including BC (Osta et al., 2004; Zeng et al., 2019), our study using non-invasive imaging method showed for the first time that EpCAM imparts in metastasis in preclinical settings.
In conclusion, this study reveals the potential of EpCAM during the development of BC radioresistance. BC cells having high expression of EpCAM gain the ability to refract the RT efficacy by promoting cellular heterogeneity, enhanced plasticity within the cancer cell population, and thus pushing the cell fate more toward the CSC phenotype. High EpCAM status can influence the cells to attain a hybrid E/M status and enhance distant metastasis in vivo. Considering all published evidence across various cancers so far, EpCAM appears to be a generic marker of radioresistance. Therefore, EpCAM mediated resistance development against RT procedure may be taken into consideration for future evaluation of local recurrence in BC patients.
Materials and Methods
Materials
The drugs used were Doxorubicin (Sigma Aldrich, D1515), Cisplatin (Sigma Aldrich PHR 1624) and Gemcitabine (Sigma Aldrich, G6423). D-luciferin imaging substrate from (Biosynth, L-8220). The inhibitor of AKT (CST9901) is obtained from Cell Signaling Technology. EdU click-IT cell proliferation kit from (Thermo Fisher Scientific, C10340). EGF-Epidermal growth factor (Sigma Aldrich E9644), FGF-Fibroblast growth factor (Sigma Aldrich F0291), Insulin (Sigma Aldrich 91077C) and LIF-Leukemia inhibitory factor (Thermo fisher PHC9481).
Cell Culture
ZR-75-1 cell line (ER+, PR+, and Her2Low) and MCF-7 cell line (ER+, PR+, and Her2Low) was cultured in RPMI 1640 media with recommended supplements and standard culture conditions. EpCAM ORF cloned in pCDNA3.1 mammalian vector is used for generation EpCAM overexpressing ZR-75-1 cells. Briefly, pCDNA3.1-EpCAM transfected ZR-75-1 cells were diluted and plated to obtain monoclonal cell colony arising from single cell. Puromycin (Sigmal Aldrich P8833) was used as a selection pressure. Monoclonal colonies arising from single cells were evaluated for EpCAM expression for multiple passages. The clone showing stable expression of EpCAM for multiple passage was selected for further study. ZR-75-1 and ZR-75-1EpCAM cell populations were further labeled using firefly luciferase by lentiviral transduction using third generation lenitiviral vectors –fluc-tdTomato cloned lentiviral vector, P-delta packaging plasmid, VSVG envelope protein plasmid.
Radioresistant ZR-75-1 and MCF-7 cell lines were generated by fractioned irradiation of 2 Gy every 2 days. After every five fraction of irradiation cells surviving cells were allowed to repopulate and then another round is started.
TCGA Analysis
From METABRIC dataset, we identified 904 patients undergoing radiotherapy. We then segregated them into two groups based on EpCAM level-EpCAM high, where EpCAM level is higher than the mean expression and EpCAM low, where EpCAM level is lower than the mean expression. Their overall survival was plotted as Kaplan-Meier curve.
Animal Imaging
All the experiments were approved by the Institutional animal ethics committee of ACTREC, TMC, India, and were performed in accordance with accepted guidelines. 5 × 10⁶ firefly luciferase reporter labeled cells were implanted in mammary fat-pad of 6–8 weeks old SCID mice. Non-invasive bioluminescence imaging (BLI) scan was performed using IVIS Spectrum (Perkin Elmer) after injecting 100 μl D-luciferin substrate (30 mg/ml). Mice were maintained under 2% isoflurane gas anesthesia during the scan. Data analysis was performed using Living Image software v4.4.
In vitro Irradiation
Breast cancer cell lines grown on cell culture plate at 70% confluency were irradiated by SSD (surface to source distance) technique for specified doses using 60Co-γ Linear Accelerator, indigenous Bhabhatron machine. D0 is the dose at which the survival is 37%. It was determined from the clonogenic assay based on the formula S = e–αD–βD2, where S is the survival percentage, D is the single dose to which cells are exposed and α and β are parameters describing the cell’s radiosensitivity. Dose modifying factor(DMF) is the ratio of dose of radioresistance cells to that of its parental counterpart at which survival is 50%.
In vivo Irradiation in Mice
Mice bearing orthotopic tumors were anesthetized and only the tumor was exposed to radiation by shielding the rest of the body using lead blocks. Exposure to accumulated dose of 25Gy was given in five fractions every 3 days over 2 weeks period by SSD technique using 60Co-γ Linear Accelerator. The radiation dose schedule chosen for this study was based on the calculation of biological effective dose and its 2 Gy (the conventional daily dose of radiation) equivalent. Mice were irradiated twice a week to allow recovery and repair of damage in adjacent normal tissues. All the mice tolerated the radiation schedule reasonably well without sign of systemic toxicity.
In vivo Metastasis Study
Mice with either ZR-75-1 or ZR-75-1EpCAM cells overexpressing luciferase reporter were implanted at mammary fat pad and monitored by performing weekly BLI scan until signal appeared outside of the primary tumor area. Mice were sacrificed after 90 days using cervical dislocation and major organs were harvested and imaged ex vivo. Boudin solution was used for fixing the lungs and the number of metastatic foci on organ surface was counted under a binocular microscope. Hematoxylin and eosin stain of lung was also carried out. The images were captured at 1X, 5X, and 10X magnification using Zeiss upright microscopy.
Immunoblotting
Cell lysates are prepared using Ripa Buffer and run in SDS-PAGE gel as per standard protocol. After the proteins are transferred in nitrocellulose membrane, blocking was done using 5% BSA. Primary and Secondary antibodies are mixed in 5% BSA. We used primary antibodies of EpCAM (Santa Cruz, sc-25308), phosphoAKT (Sigma Aldrich, SAB5600064), Total AKT (Sigma Aldrich, SAB5600066), Rad50 (Abcam, ab8913). Ku80 (Cell Signaling Technology, CST2180), phosphoATM (Cell Signaling Technology, CST D6H9), Total ATM (Cell Signaling Technology, CST2873), CHK2 (Cell Signaling Technology, CSTC13C1), Vimentin (Sigma Aldrich V6630), Twist (Santa Cruz, sc-15393) and Tubulin (Abcam, ab7291). Primary antibody of EpCAM has dilution of 1:200, while rests of the antibodies have dilution of 1:1000. We used anti-mouse HRP secondary antibody (ab6728) and anti-rabbit secondary antibody (Thermo Scientific 35512) at 1:10000 dilution.
Immunofluorescence Imaging
Cells were seeded in coverslips (10 × 25 mm). The cells washed thrice with PBS before fixing with 4% paraformaldehyde for 10 min at 37°C. Then cells were again washed thrice in PBS. For nuclear permeabilization in cells, 4% paraformaldehyde containing 0.2% triton X (incubated at room temperature for 10 min) was used. The coverslips are incubated with primary antibody at 4°C, overnight. While the coverslips is incubated with a secondary antibody, which is tagged with anti-rabbit Dylight 633 (Invitrogen 35562) (dilution 1:100) for 1 h at room temperature. The primary antibody used is γH2AX (Cell Signaling Technology, CT20E3, dilution 1:300), EpCAM(Abcam ab8601, dilution 1:50) Vinculin (Abcam ab18058, dilution 1:400) and Phalloidin (Thermo scientific 22287, dilution 1:500). The cell nuclei were stained with DAPI (Sigma Aldrich D9142, 1 mg/ml stock, working dilution 1:200). After washing thrice with PBS, the coverslips were mounted on glass slides using VECTASHEILD (Vector CB 1000). Then the images of around 45–50 cells were captured using Zeiss LSM780 confocal microscope. Images were analyzed in Zeiss LSM780 software.
Focal adhesion area is measured as the area of co-localization of vinculin and F-actin/phalloidin. The area of co-localization was measured using ImageJ.
Side Population Assay
One million cells are suspended in 1 ml cell culture medium. The negative control group is one which is treated with 50 μM verapamil (Sigma Aldrich V4629) and incubated in 37°C for 30 min. Then 1 μl DCV (Thermo Fisher Scientific V35003) was added in all the groups and incubated at 37°C for 90 min. Then the cells were washed thrice in PBS and re-suspended in PBS for acquisition in flow cytometry.
BCSC Surface Marker Assessment
1 × 10⁶ cells are harvested and washed thrice with PBS. Then cells are suspended in 50 μl PBS and incubated with CD24 (Sigma Aldrich SAB4700624), and CD44 (Sigma Aldrich SAB4700185) fluorescence tagged primary antibody for 1 h at 37°C at the company recommended at dilution. Then cells are again washed with PBS, and CD24−/CD44+ cells were analyzed by flow cytometry.
Mammosphere Formation Assay
Five thousands cells are seeded in ultra-low attachment 6 well plate (Corning #3471). The cells are grown in incomplete cell culture medium –RPMI 1640 complemented with FGF (20 ng/ml), EGF (10 ng/ml), Insulin (20 ng/ml), LIF (10 ng/ml) and 0.1% pen-strep and passaged after 8 days till three passages. The spheroids having a size of more than 50 μm are counted under a microscope.
Wound Healing Assay
Cells are grown to 90% confluency in monolayer. Then a small wound is made. The image of the wound was captured every 1 h in inverted microscopy for 20 h. Then we measured the % wound closure =
2D Cell Migration Assay
20,000–30,000 cells were seeded in six well plates. Then the cells were imaged at 20X every 20 min for 20 h. Then the distance traveled by the cell were collected by measuring the cell trajectories using the manual track plugin in ImageJ. Further determining the speed from the distance traveled.
Collagen Invasion Assay
Cells are plated on fluorescently labeled rat tail collagen I (concentration of 10 μg/cm2, Sigma, Cat # C3867) coated glass coverslips. Glass coverslips were incubated overnight with collagen I at 4°C to allow passive adsorption. The coverslips were further blocked with 1% Pluronic F127 (Sigma, P2443) for 10 min to prevent non-specific binding. Collagen is stained with mouse polyclonal primary antibodies (Merck, custom made) at 1:500 overnight and counterstained with anti-mouse secondary antibody at 1:1,000 for 2 h. Collagen degradation was assessed after culturing cells for 6 h to allow for visible degradation. Quantification of the degraded area was performed using ImageJ.
Trypsin Deadhesion Assay
Trypsin de-adhesion assay was carried out as described earlier (Sen and Kumar, 2009). Briefly, the cells were incubated with warm 1X trypsin. Then the image of cells was captured every 1-s using time-lapse microscopy. The area of the cells was measured after the addition of trypsin till the cells become round. Then the area was normalized using the formula
Where, An is normalized area, Ai is initial area of the cells just before addition of the trypsin, Af and At is the final area and area at time t of a cell. The normalized area of the cells was plotted as a function of time where the curve was fitted to
Based on the formula deadhesion time, constant τ was determined.
Spread Area Analysis
Cells were seeded on 0.1 μg/cm2 collagen-coated coverslip and imaged after 24 h incubation using an inverted microscope (Olympus IX71). Then using ImageJ, the area of the cells was measured by manually tracing the perimeter of the cells. Based on the area of the cells the circularity (C) of the cells were determined using the formula C = 4ΠA/p2, where A is the area of the cells, and p is the perimeter of the cells.
Clonogenic Survival Assay
Five hundred cells are seeded in six well plates. Then cells are irradiated at different doses. The cells are allowed to forms colonies for 10–14 days. Then the colonies are fixed with 90% methanol at room temperature for 10 min and subsequently stained with crystal violet (Sigma Aldrich C0775). Then the colonies are counted using a stereomicroscope. The surviving fractions are derived following the formula-
Where, PE = Number of colonies obtained / Number of cells seeded. *100
Real Time PCR
RNA was extracted from ZR-75-1 and ZR-75-1EpCAM cells using RNeasy kit (Qiagen-74104). cDNA was synthesized using first-strand cDNA Kit (Thermo Scientific-18080085). Real time PCR was carried out using SYBR Green (Agilent-600828). Primers for EpCAM-Forward primer 5′ GCAGCTCAGGAAGAATGTG 3′ and Reverse primer 5′ CAGCCAGCTTTGAGCAATGAC 3′. That for GAPDH– Forward primer 5′ GAAGGTCGGAGTCAACGGATT 3′ and reverse primer 5′ CCAGACTTAAAAGACCT 3′, E-cadherin-Forward primer CTTTGACGCCGAGAGCTACA and reverse primer TTTGAATCGGGTGTCGAGGG, Snail forward primer CCAGTGCCTCGACCACTATG and reverse primer CTGCTGGAAGGTAAACTCTGGA, Slug Forward primer TTCGGACCCACACATTACCT and reverse primer TTCTCCCCCGTGTGAGTTCTA and for Twist forward primer TCTACCAGGTCCTCCAGAGC and reverse primer CTCCATCCTCCAGACCGAGA.
EdU Cell Proliferation Assay
Cells were incubated for 16 h with EdU after exposure to 10Gy. Then the cells were processed as mentioned in the EdU Assay Kit (Abcam, ab219801).
Cell Cycle Analysis
Cells seeded at 60–70% confluency were harvested and fixed with 70% ethanol. Ethanol is added dropwise while slowly vortexing the cells. The cells were fixed overnight at −20°C. Then washed with PBS and resuspended in PBS solution containing 100 μg RNAase A and 25 μg propidium iodide for 30 min. Then the DNA content of the cells were analyzed in flowcytometry.
Growth Curve
Two thousands cells were seeded on day 0. Then every 24 h the cells were harvested and counted to check the growth.
ALDH Assay
The assay was carried out using AldeRed ALDH Detection Assay (Sigma-Aldrich SCR150). The cells were processed as mentioned in the assay kit.
Statistical Analysis
Histograms showing frequency distributions was calculated using Graphpad Prism. The skewness and kurtosis of frequency distributions was calculated using third moment and fourth moment tests, respectively. Unpaired Students t-test and Anova was used to calculate the statistical significance. P-value ≤ 0.05 was considered significant and indicated as ∗ ≤ 0.05, ∗∗ ≤ 0.01, ∗∗∗ ≤ 0.001, and **** ≤ 0.0001. Error bars indicate standard error mean of triplicate biological samples.
Data Availability Statement
The original contributions presented in the study are included in the article/Supplementary Material, further inquiries can be directed to the corresponding author/s.
Ethics Statement
The animal study was reviewed and approved by the Institutional Animal Ethics Committee (IAEC), ACTREC, TMC.
Author Contributions
AD and PR conceived the idea and designed the experiments. AM, AB, RS, AK, AB, and ID performed the experiments. AM, AB, TW, PR, SS, and AD analyzed the data and drafted and edited the manuscript. All the authors contributed to the article and approved the submitted version.
Conflict of Interest
The authors declare that the research was conducted in the absence of any commercial or financial relationships that could be construed as a potential conflict of interest.
Acknowledgments
We acknowledge various research facilities at ACTREC and IITB for support experiments. Graduate student (Ph.D.) fellowship from ACTREC to AM is also acknowledged. We are thankful to Dr. Milind Vaidya for lending us the primers for EMT genes used in this study.
Supplementary Material
The Supplementary Material for this article can be found online at: https://www.frontiersin.org/articles/10.3389/fcell.2020.597673/full#supplementary-material
References
Arnold, C. R., Mangesius, J., Skvortsova, I.-I., and Ganswindt, U. (2020). The role of cancer stem cells in radiation resistance. Front. Oncol. 10:164. doi: 10.3389/fonc.2020.00164
Bhatia, S., Monkman, J., Blick, T., Pinto, C., Waltham, M., Nagaraj, S. H., et al. (2019). Interrogation of phenotypic plasticity between epithelial and mesenchymal states in breast cancer. J. Clin. Med. 8:893. doi: 10.3390/jcm8060893
Bhatia, S., Wang, P., Toh, A., and Thompson, E. W. (2020). New insights into the role of phenotypic plasticity and EMT in driving cancer progression. Front. Mol. Biosci. 7:71. doi: 10.3389/fmolb.2020.00071
Chang, J. C. (2016). Cancer stem cells: role in tumor growth, recurrence, metastasis, and treatment resistance. Medicine (Baltimore) 95, S20–S25.
Chiang, K., Zielinska, A. E., Shaaban, A. M., Sanchez-Bailon, M. P., Jarrold, J., Clarke, T. L., et al. (2017). PRMT5 Is a critical regulator of breast cancer stem cell function via histone methylation and FOXP1 expression. Cell Rep. 21, 3498–3513. doi: 10.1016/j.celrep.2017.11.096
Curtis, C., Shah, S. P., Chin, S. F., Turashvili, G., Rueda, O. M., Dunning, M. J., et al. (2012). The genomic and transcriptomic architecture of 2,000 breast tumours reveals novel subgroups. Nature 486, 346–352. doi: 10.1038/nature10983
Dashzeveg, N. K., Taftaf, R., Ramos, E. K., Torre-Healy, L., Chumakova, A., Silver, D. J., et al. (2017). New advances and challenges of targeting cancer stem cells. Cancer Res. 77, 5222–5227.
de Wit, S., Manicone, M., Rossi, E., Lampignano, R., Yang, L., Zill, B., et al. (2018). EpCAM(high) and EpCAM(low) circulating tumor cells in metastatic prostate and breast cancer patients. Oncotarget 9, 35705–35716.
Desai, S., Barai, A., Bukhari, A. B., De, A., and Sen, S. (2018). alpha-Actinin-4 confers radioresistance coupled invasiveness in breast cancer cells through AKT pathway. Biochim. Biophys. Acta Mol. Cell Res. 1865, 196–208. doi: 10.1016/j.bbamcr.2017.10.006
Elshamy, W. M., and Duhe, R. J. (2013). Overview: cellular plasticity, cancer stem cells and metastasis. Cancer Lett. 341, 2–8. doi: 10.1016/j.canlet.2013.06.020
Eyvazi, S., Farajnia, S., Dastmalchi, S., Kanipour, F., Zarredar, H., and Bandehpour, M. (2018). Antibody Based EpCAM targeted therapy of cancer, review and update. Curr. Cancer Drug Targets 18, 857–868. doi: 10.2174/1568009618666180102102311
Friedl, P., and Wolf, K. (2010). Plasticity of cell migration: a multiscale tuning model. J. Cell Biol. 188, 11–19. doi: 10.1083/jcb.200909003
Gao, J., Liu, X., Yang, F., Liu, T., Yan, Q., and Yang, X. (2015). By inhibiting Ras/Raf/ERK and MMP-9, knockdown of EpCAM inhibits breast cancer cell growth and metastasis. Oncotarget 6, 27187–27198. doi: 10.18632/oncotarget.4551
Gires, O., Pan, M., Schinke, H., Canis, M., and Baeuerle, P. A. (2020). Expression and function of epithelial cell adhesion molecule EpCAM: where are we after 40 years? Cancer Metastasis Rev. 39, 969–987. doi: 10.1007/s10555-020-09898-3
Herlyn, M., Steplewski, Z., Herlyn, D., and Koprowski, H. (1979). Colorectal carcinoma-specific antigen: detection by means of monoclonal antibodies. Proc. Natl. Acad. Sci. U. S. A. 76, 1438–1442. doi: 10.1073/pnas.76.3.1438
Hiraga, T., Ito, S., and Nakamura, H. (2016). EpCAM expression in breast cancer cells is associated with enhanced bone metastasis formation. Int. J. Cancer 138, 1698–1708. doi: 10.1002/ijc.29921
Hong, D., Fritz, A. J., Zaidi, S. K., Van Wijnen, A. J., Nickerson, J. A., Imbalzano, A. N., et al. (2018). Epithelial-to-mesenchymal transition and cancer stem cells contribute to breast cancer heterogeneity. J. Cell Physiol. 233, 9136–9144. doi: 10.1002/jcp.26847
Jin, M. H., and Oh, D. Y. (2019). ATM in DNA repair in cancer. Pharmacol. Ther. 203:107391. doi: 10.1016/j.pharmthera.2019.07.002
Jolly, M. K., Boareto, M., Huang, B., Jia, D., Lu, M., Ben-Jacob, E., et al. (2015). Implications of the hybrid epithelial/mesenchymal phenotype in metastasis. Front. Oncol. 5:155. doi: 10.3389/fonc.2015.00155
Kapoor, A., Barai, A., Thakur, B., Das, A., Patwardhan, S. R., Monteiro, M., et al. (2018). Soft drug-resistant ovarian cancer cells migrate via two distinct mechanisms utilizing myosin II-based contractility. Biochim. Biophys. Acta Mol. Cell Res. 1865, 392–405. doi: 10.1016/j.bbamcr.2017.11.012
Kim, D. H., and Wirtz, D. (2013). Focal adhesion size uniquely predicts cell migration. FASEB J. 27, 1351–1361. doi: 10.1096/fj.12-220160
Kong, D., Hughes, C. J., and Ford, H. L. (2020). Cellular plasticity in breast cancer progression and therapy. Front. Mol. Biosci. 7:72. doi: 10.3389/fmolb.2020.00072
Kroger, C., Afeyan, A., Mraz, J., Eaton, E. N., Reinhardt, F., Khodor, Y. L., et al. (2019). Acquisition of a hybrid E/M state is essential for tumorigenicity of basal breast cancer cells. Proc. Natl. Acad. Sci. U. S. A. 116, 7353–7362. doi: 10.1073/pnas.1812876116
Kuhlmann, J. D., Hein, L., Kurth, I., Wimberger, P., and Dubrovska, A. (2016). Targeting cancer stem cells: promises and challenges. Anticancer Agents Med. Chem. 16, 38–58. doi: 10.2174/1871520615666150716104152
Kumari, N., Vartak, S. V., Dahal, S., Kumari, S., Desai, S. S., Gopalakrishnan, V., et al. (2019). G-quadruplex structures contribute to differential radiosensitivity of the human genome. iScience 21, 288–307. doi: 10.1016/j.isci.2019.10.033
Lagadec, C., Vlashi, E., Della Donna, L., Dekmezian, C., and Pajonk, F. (2012). Radiation-induced reprogramming of breast cancer cells. Stem Cells 30, 833–844. doi: 10.1002/stem.1058
Liao, T. T., and Yang, M. H. (2020). Hybrid epithelial/mesenchymal state in cancer metastasis: clinical significance and regulatory mechanisms. Cells 9:623. doi: 10.3390/cells9030623
Liu, F., Gu, L. N., Shan, B. E., Geng, C. Z., and Sang, M. X. (2016). Biomarkers for EMT and MET in breast cancer: an update. Oncol. Lett. 12, 4869–4876. doi: 10.3892/ol.2016.5369
Liu, X., Li, J., Cadilha, B. L., Markota, A., Voigt, C., Huang, Z., et al. (2019). Epithelial-type systemic breast carcinoma cells with a restricted mesenchymal transition are a major source of metastasis. Sci. Adv. 5:eaav4275. doi: 10.1126/sciadv.aav4275
Murakami, N., Mori, T., Nakamura, S., Yoshimoto, S., Honma, Y., Ueno, T., et al. (2019). Prognostic value of the expression of epithelial cell adhesion molecules in head and neck squamous cell carcinoma treated by definitive radiotherapy. J. Radiat. Res. 60, 803–811. doi: 10.1093/jrr/rrz053
Murakami, N., Mori, T., Yoshimoto, S., Ito, Y., Kobayashi, K., Ken, H., et al. (2014). Expression of EpCAM and prognosis in early-stage glottic cancer treated by radiotherapy. Laryngoscope 124, E431–E436.
Ni, J., Cozzi, P., Hao, J., Beretov, J., Chang, L., Duan, W., et al. (2013). Epithelial cell adhesion molecule (EpCAM) is associated with prostate cancer metastasis and chemo/radioresistance via the PI3K/Akt/mTOR signaling pathway. Int. J. Biochem. Cell Biol. 45, 2736–2748. doi: 10.1016/j.biocel.2013.09.008
Osta, W. A., Chen, Y., Mikhitarian, K., Mitas, M., Salem, M., Hannun, Y. A., et al. (2004). EpCAM is overexpressed in breast cancer and is a potential target for breast cancer gene therapy. Cancer Res. 64, 5818–5824. doi: 10.1158/0008-5472.can-04-0754
Papaccio, F., Paino, F., Regad, T., Papaccio, G., Desiderio, V., and Tirino, V. (2017). Concise review: cancer cells, cancer stem cells, and mesenchymal stem cells: influence in cancer development. Stem Cells Transl. Med. 6, 2115–2125. doi: 10.1002/sctm.17-0138
Pearce, A. G., Segura, T. M., Rintala, A. C., Rintala-Maki, N. D., and Lee, H. (2001). The generation and characterization of a radiation-resistant model system to study radioresistance in human breast cancer cells. Radiat. Res. 156, 739–750. doi: 10.1667/0033-7587(2001)156[0739:tgacoa]2.0.co;2
Qi, X. S., Pajonk, F., Mccloskey, S., Low, D. A., Kupelian, P., Steinberg, M., et al. (2017). Radioresistance of the breast tumor is highly correlated to its level of cancer stem cell and its clinical implication for breast irradiation. Radiother. Oncol. 124, 455–461. doi: 10.1016/j.radonc.2017.08.019
Rivas, S., Gomez-Oro, C., Anton, I. M., and Wandosell, F. (2018). Role of Akt Isoforms controlling cancer stem cell survival, phenotype and self-renewal. Biomedicines 6:29. doi: 10.3390/biomedicines6010029
Santivasi, W. L., and Xia, F. (2014). Ionizing radiation-induced DNA damage, response, and repair. Antioxid. Redox Signal. 21, 251–259.
Sen, S., and Kumar, S. (2009). Cell-Matrix De-Adhesion dynamics reflect contractile mechanics. Cell Mol. Bioeng. 2, 218–230. doi: 10.1007/s12195-009-0057-7
van der Gun, B. T., Melchers, L. J., Ruiters, M. H., De Leij, L. F., Mclaughlin, P. M., and Rots, M. G. (2010). EpCAM in carcinogenesis: the good, the bad or the ugly. Carcinogenesis 31, 1913–1921. doi: 10.1093/carcin/bgq187
Vignard, J., Mirey, G., and Salles, B. (2013). Ionizing-radiation induced DNA double-strand breaks: a direct and indirect lighting up. Radiother. Oncol. 108, 362–369. doi: 10.1016/j.radonc.2013.06.013
Visvader, J. E., and Lindeman, G. J. (2008). Cancer stem cells in solid tumours: accumulating evidence and unresolved questions. Nat. Rev. Cancer 8, 755–768. doi: 10.1038/nrc2499
Wang, M. H., Sun, R., Zhou, X. M., Zhang, M. Y., Lu, J. B., Yang, Y., et al. (2018). Epithelial cell adhesion molecule overexpression regulates epithelial-mesenchymal transition, stemness and metastasis of nasopharyngeal carcinoma cells via the PTEN/AKT/mTOR pathway. Cell Death Dis. 9:2.
Wang, S. L., Fang, H., Song, Y. W., Wang, W. H., Hu, C., Liu, Y. P., et al. (2019). Hypofractionated versus conventional fractionated postmastectomy radiotherapy for patients with high-risk breast cancer: a randomised, non-inferiority, open-label, phase 3 trial. Lancet Oncol. 20, 352–360. doi: 10.1016/s1470-2045(18)30813-1
Wolmarans, E., Nel, S., Durandt, C., Mellet, J., and Pepper, M. S. (2018). Side population: its use in the study of cellular heterogeneity and as a potential enrichment tool for rare cell populations. Stem Cell. Int. 2018:2472137.
Wu, P. H., Gilkes, D. M., Phillip, J. M., Narkar, A., Cheng, T. W., Marchand, J., et al. (2020). Single-cell morphology encodes metastatic potential. Sci. Adv. 6:eaaw6938. doi: 10.1126/sciadv.aaw6938
Yang, J., Antin, P., Berx, G., Blanpain, C., Brabletz, T., Bronner, M., et al. (2020). Guidelines and definitions for research on epithelial-mesenchymal transition. Nat. Rev. Mol. Cell Biol. 21, 341–352.
Zeng, L., Deng, X., Zhong, J., Yuan, L., Tao, X., Zhang, S., et al. (2019). Prognostic value of biomarkers EpCAM and alphaB-crystallin associated with lymphatic metastasis in breast cancer by iTRAQ analysis. BMC Cancer 19:831. doi: 10.1186/s12885-019-6016-3
Keywords: EpCAM, breast cancer, radiation resistance, cancer stem cell, metastasis
Citation: Mal A, Bukhari AB, Singh RK, Kapoor A, Barai A, Deshpande I, Wadasadawala T, Ray P, Sen S and De A (2021) EpCAM-Mediated Cellular Plasticity Promotes Radiation Resistance and Metastasis in Breast Cancer. Front. Cell Dev. Biol. 8:597673. doi: 10.3389/fcell.2020.597673
Received: 21 August 2020; Accepted: 30 November 2020;
Published: 06 January 2021.
Edited by:
Shilpa S. Dhar, University of Texas MD Anderson Cancer Center, United StatesReviewed by:
Fuming Li, University of Pennsylvania, United StatesClaudia Peitzsch, National Center for Tumor Diseases, Partner Site Dresden, Germany
Copyright © 2021 Mal, Bukhari, Singh, Kapoor, Barai, Deshpande, Wadasadawala, Ray, Sen and De. This is an open-access article distributed under the terms of the Creative Commons Attribution License (CC BY). The use, distribution or reproduction in other forums is permitted, provided the original author(s) and the copyright owner(s) are credited and that the original publication in this journal is cited, in accordance with accepted academic practice. No use, distribution or reproduction is permitted which does not comply with these terms.
*Correspondence: Abhijit De, ade@actrec.gov.in