Automated segmentation of vertebral cortex with 3D U-Net-based deep convolutional neural network
 Yang Li1
  Qianqian Yao1 Haitao Yu2
  Xiaofeng Xie2 Zeren Shi3 Shanshan Li1 Hui Qiu1 Changqin Li1
  Jian Qin1*
- 1The Second Affiliated Hospital of Shandong First Medical University, Tai’an, China
- 2Mechanical and Electrical Engineering College, Hainan University, Haikou, China
- 3Hangzhou Shimai Intelligent Technology Co.Ltd., Hangzho, China
Objectives: We developed a 3D U-Net-based deep convolutional neural network for the automatic segmentation of the vertebral cortex. The purpose of this study was to evaluate the accuracy of the 3D U-Net deep learning model.
Methods: In this study, a fully automated vertebral cortical segmentation method with 3D U-Net was developed, and ten-fold cross-validation was employed. Through data augmentation, we obtained 1,672 3D images of chest CT scans. Segmentation was performed using a conventional image processing method and manually corrected by a senior radiologist to create the gold standard. To compare the segmentation performance, 3D U-Net, Res U-Net, Ki U-Net, and Seg Net were used to segment the vertebral cortex in CT images. The segmentation performance of 3D U-Net and the other three deep learning algorithms was evaluated using DSC, mIoU, MPA, and FPS.
Results: The DSC, mIoU, and MPA of 3D U-Net are better than the other three strategies, reaching 0.71 ± 0.03, 0.74 ± 0.08, and 0.83 ± 0.02, respectively, indicating promising automated segmentation results. The FPS is slightly lower than that of Seg Net (23.09 ± 1.26 vs.30.42 ± 3.57).
Conclusion: Cortical bone can be effectively segmented based on 3D U-net.
1 Introduction
Osteoporosis has progressively gained public awareness as a prevalent bone disorder. It is a systemic bone disease characterized by decreased bone mass and microarchitectural degeneration, which leads to bone fragility and increased fracture risk (Cheng et al., 2020). The cortical bone accounts for a small volume in the spine, but it bears 45–75% of the load (Rockoff et al., 1969), and cortical bone is more closely related to bone strength and is more susceptible to mechanical forces than cancellous bone (Ye et al., 2020), which point to cortical bone’s role in osteoporotic fractures. The cortical shell is crucial to the vertebral body’s capacity to bear loads. As age-related bone mass loss progresses, the load-bearing role of the cortical sell increases significantly, making the cortex more prone to fracture (Cao et al., 19762001). Loss of cortical bone mass and increasing cortical porosity result from an unbalance in intracortical remodeling, which also leads to osteoporotic fractures (Shah et al., 2018). Both the pathogenesis of osteoporotic fractures and the treatment options for osteoporosis are influenced by cortical bone strength. A healthy vertebral body cortex not only maintains the stability of the vertebral body but also protects the spinal cord from injury (Wallace et al., 2017). Palepu et al. (2019) found that the thickness of the vertebral cortex varied circumferentially within a vertebra and that this variation was distinct for each level of the lumbar spine. As a result, having detailed reference data for each vertebral cortical thickness might help you comprehend bone quality better. 3D images can not only show the integrity of cortical bone but also visually display the thickness of cortical bone at different levels.
Accurate image segmentation is critical for cortical thickness measurement, regional image analysis, and surgical planning. However, accurate segmentation of cortical bone is difficult due to partial volume artifacts caused by the low spatial resolution; second, the boundary between cortical and trabecular compartments is blurred and difficult to distinguish; and third, adjacent images overlap, making cortical bone segmentation even more difficult. Manual segmentation can produce good results in clinical practice, but it comes with its disadvantages: it is time-consuming and involves inter-rater variability in practice. The automatic segmentation techniques, in contrast, are not only quicker but are also built on measures agreed upon by several raters, thus improving consistency and reducing inter-rater variability.
Due to the rapid development of deep neural networks, it has shown satisfactory performance in many medical images processing such as classification, segmentation, detection, localization, and registration (Chan et al., 2020; Fu et al., 2020; Kalmet et al., 2020; Krishnan et al., 2020; Yan et al., 2020; Hassanzadeh et al., 2021; Li et al., 2021; van Sloun et al., 2021; Li et al., 2022), and has been widely used in many fields (Zaharchuk et al., 2018; Jiang et al., 2020; Chandra et al., 2021). Numerous studies have shown that high-precision results that may be used in clinics can be achieved when segmenting medical images. Andre et al. (Mastmeyer et al., 2006) suggested a hierarchical 3D technique for segmenting vertebral bodies that combines traditional morphological procedures with more complicated processes to allow for a rough segmentation of vertebral bodies. Huang SH et al. (Huang et al., 2009) created a fully automatic vertebra recognition and segmentation system for spine MRI that includes three stages: AdaBoost-based vertebra detection, detection refinement by robust curve fitting, and vertebra segmentation via an iterative normalized cut approach. For automatic vertebra segmentation and identification, Lessmann et al. suggested an iterative full convolutional neural network combining deep learning with CT and MRI. Using a fully convolutional neural network to segment and label vertebrae one by one, regardless of the number of visible vertebrae, the method achieves great segmentation accuracy (Lessmann et al., 2019). Kolarik et al. (2019) discovered a high-resolution 3D Dense-U-Net network capable of segmenting the spine in the input image at native resolution and processing 3D image data. Although the foregoing research has proven that segmentation of the complete spine or single vertebrae can yield good results, few studies have focused on cortical segmentation of the vertebrae. Helen et al. (Buie et al., 2007) proposed the dual threshold technique, which involved two required threshold inputs for extracting the cortex’s periosteal and endosteal surfaces. Some morphological parameters of segmentation measured by the proposed method were in good agreement with the gold standard, while others were in poor agreement. A structure-based algorithm for differentiating cortical and trabecular bone had been presented by Ang et al. (2020). Bone connected to the cortex within a spatially local threshold value is identified and segregated from the remaining bone using the thickness of the cortex as a seed value, however, the algorithm has only been tested on the long bones of four species. Zebaze et al. (2013) described an automated method for segmenting bone into its compact-appearing cortex, transitional zone, and trabecular compartment from background and bone, but it was mainly used to quantify cortical porosity. Cheng et al. (Li et al., 2013)offered an automated cortical bone segmentation system for MD-CT imaging of the distal tibia in vivo. Using a modified fuzzy distance transform and connectivity analysis, it made use of more contextual and topologic information from the bone. For the segmentation of cortical and trabecular bone, Alexander et al. (Valentinitsch et al., 2012) described a novel, totally automated, threshold-independent technique. The program selected textural features with high distinguishing power automatically and trained a classifier to distinguish between cortical and trabecular bone. This literature had only performed experiments on a small number of cadaveric bones and was insufficient to cover the high variability introduced by normal anatomy and/or pathological skeletal processes. Deep learning algorithms are more and more widely used in image processing and segmentation, but few people have applied them to the segmentation of cortical bone, especially the vertebral cortex. Our proposed accurate vertebral cortical image segmentation method will help to provide quantitative information for the diagnosis, treatment, and surgical planning.
Based on the above, our objective was to propose a 3D-UNet deep learning model to segment the vertebral cortex automatically. Then, the segmentation abilities of the proposed model are evaluated for the vertebral cortex.
2 Materials and methods
2.1 Datasets
From March to October 2020, a total of 316 consecutive patients who had undergone thoracic CT spinal imaging in our hospital were collected retrospectively in our study. The inclusion criteria of the research subject were as follows: 1) 20–37 years old; 2) 18.5–24.0 BMI (body mass index); 3) complete clinical and imaging data. Exclusion criteria: 1) osteoporosis; 2) vertebral lesions 3) endocrine diseases and other diseases that affect the thickness of cortical bone, such as diabetes, parathyroid disease, rheumatoid disease, etc.; 4) long-term use of bisphosphonates, glucocorticoids, estrogens, and other drugs; 5) incomplete imaging examination. According to the inclusion and exclusion criteria, a total of 105 patients were enrolled in this study (71males, 34 females, age range 20–37 years). This study was reviewed and approved by the local ethics committee (2020–035). Written informed consent was not required in this retrospective study by the institutional requirements.
Our flowchart for vertebral cortex segmentation is shown in Figure 1. All the participants were performed on a 256-slice CT scanner (GE Healthcare), with image acquisition parameters listed in Table 1. The same protocol was used to process all of the scans.
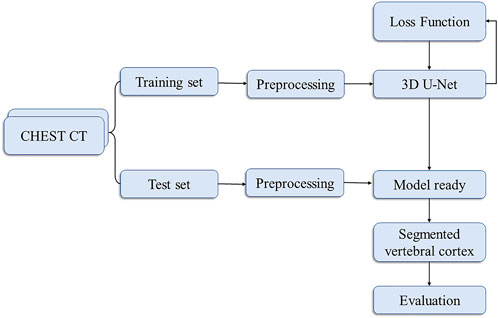
FIGURE 1. Flowchart of the proposed vertebral cortex segmentation method.
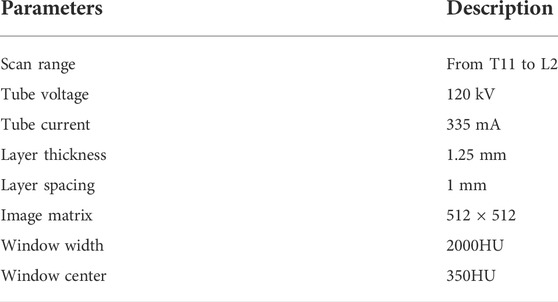
TABLE 1. Image parameters of the dataset in our study.
T11, T12, L1, and L2 were chosen from 105 participants who had CT scans. Each vertebral body was approximately 25–35 slices of axial images. The AW4.7 post-processing workstation (GE Healthcare) was used to perform vertical cross-section segmentation of the four vertebrae to obtain a more accurate and complete cortical morphology. A senior radiologist with more than 10 years of professional experience performed the delineation of the vertebral cortex with ITK-SNAP software, which was subsequently peer-reviewed by two other specialists. These vertebral cortex contours delineated by radiologists were referred to as the ground truth. Finally, both data and labels were converted into NIFTI format. Figure 2 shows the axial, coronal, sagittal, and 3D views of a single vertebral body, where the red area outside the vertebral body is the cortical bone we want to segment.
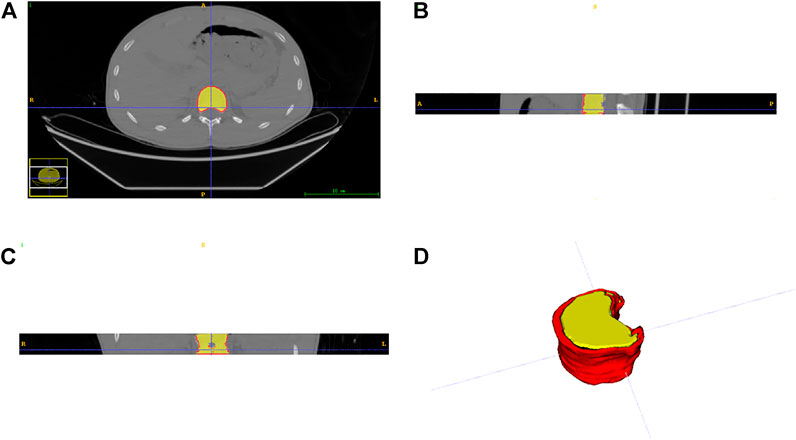
FIGURE 2. Three views and a 3D display of data. (A) axial plane; (B) coronal plane; (C) sagittal plane; (D) three-dimensional representation.
2.2 Data preprocessing
The image size is in the format (w, h, s), where w and h are the width and height of the image, respectively, w = h, s is the number of layers of the image, and s is between 30 and 40.
The data must be preprocessed due to the varying sizes of the images in the dataset and the limited fraction of cortical bone in the overall image. Figure 3 depicts the preprocessing flowchart. First, select the CT value range of 100–800HU, then crop out the relevant area containing the cortical bone and resize the cropped image (256,256). In addition, since the voxel spacing of 3D images is not fixed, to facilitate subsequent processing, the voxel size is unified into (1, 1, 1) mm, and finally normalized. Supplementary Material gives a comprehensive explanation.
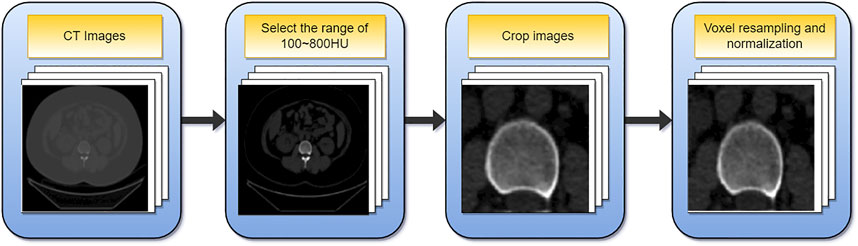
FIGURE 3. The flowchart of data preprocessing.
2.3 Fully automatic vertebral cortical segmentation based on 3D U-net
2.3.1 Automatic segmentation
The deep learning network used in this paper is the 3D U-Net network proposed by Çiçek et al. (Cicek et al., 20162016). The network was created to address the issue of medical image segmentation. U-Net (Ronneberger et al., 2015), which is a conventional “encoder-decoder” structure, is the foundation for the full 3D U-Net architecture. The encoder part is used to analyze the entire image and perform feature extraction and analysis, while the decoder creates a segmented block map (Figure 4). The entire 3D U-Net architecture is created based on U-Net, which is a typical “encoder-decoder” structure, the part of its change is to use 3D data in the processing process. 3D U-Net consists of the “encoder-decoder” structure. In the encoder structure, each layer of the neural network consists of two convolutions, each convolution followed by a batch normalization (BN) and a rectified linear unit (ReLU), and finally a 2 × 2 × 2 maximum pooling with strides of two in each dimension. In the decoder structure, each layer consists of a 2 × 2×2 up-convolution with strides of two in each dimension, followed by two 3 × 3 × 3 convolutions, each followed by a BN and a ReLU. At the same time, the result of the corresponding network layer on the encoder is used as part of the input of the decoder, so that the high-pixel feature information retained in the feature analysis can be collected, so that the image can be better synthesized.
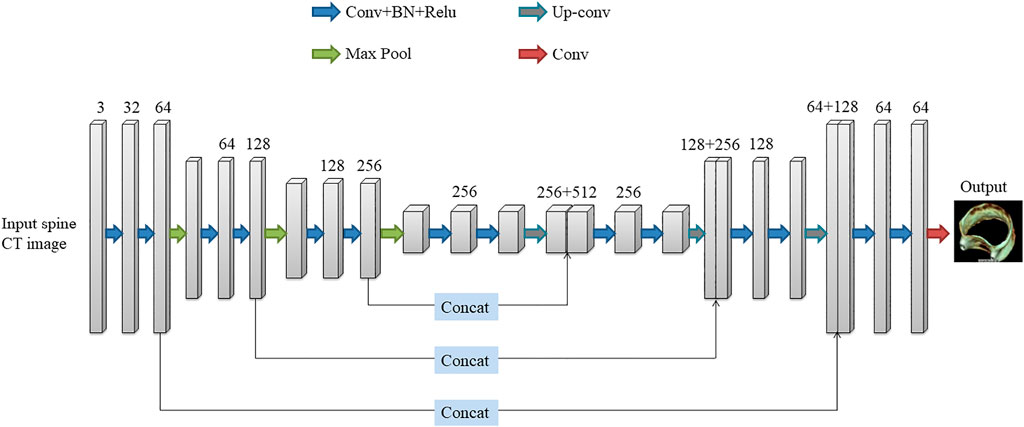
FIGURE 4. The architecture of 3D U-Net.
2.3.2 Loss function
A loss function is needed to quantify the error between the network output and the ground truth to evaluate the predictions and adjust the network parameters. In this study, we used three loss functions (DiceLoss, Weighted Cross-entropy, HybridLoss) to train and test the 3D U-Net network, and compared the effects of the three loss functions on the experimental results. The definition of DiceLoss, Weighted Cross-entropy, and HybridLoss are as follows:
DiceLoss:
p represents the predicted value; g represents the true value; n represents the number of voxel points in the 3D image. It can be seen from the formula that the background area will not be calculated for the loss, so the network focuses on the division of the cortex, which is conducive to the convergence of the network, and improves the segmentation accuracy.
Weighted Cross-entropy:
In the above formula, N and C are the numbers of pixels and data categories respectively, gi is the true label, and si is the predicted value.
Hybrid-Loss:
Hybrid-Loss is the sum of the binary cross-entropy loss and the Dice loss, where N is the number of pixels, gi is the true label, si is the predicted value, and ϵ is the smoothing factor to avoid the divisor being 0.
2.3.3 Parameter setting
The original image was flipped horizontally and rotated 45° clockwise and counterclockwise, and the data was expanded by 4 times. Three patch sizes were tested: (96, 96, 16), (128, 128, 16), (256, 256, 16). The network training epochs were set to 100, the Adam optimizer was selected, the initial learning rate was 0.0001, and the batch size was set to 6. Deep supervision was adopted to avoid the problem of gradient vanishing, and the initial value of the deep supervision attenuation coefficient was set to 0.4. During the training process, the learning rate and deep supervision coefficient decreased with the increase in training times, ensuring that the training tended to be stable.
2.3.4 Device configuration
The experimental environment was as follows: CPU Intel(R) Core(TM) i7-9700F at 3.00GHz, GPU NVIDIA GeForce RTX 2070 SUPER, Windows10 operating system, Pytorch deep learning framework + python3.6.
2.4 Evaluation and statistical analysis
Each segmentation result was assessed and compared to the gold standard in this paper. We used four evaluation indicators, Dice Similarity Coefficient (DSC), mean Intersection over Union (mIoU), Mean Pixel Accuracy (MPA), and Frames Per Second (FPS), to evaluate the segmentation effect and inference speed of the model. Defined as follows:
P is the set of predicted mask pixel locations, and T is the set of ground truth annotated pixel locations. P∩T represents the overlapping part of the two. The DSC value range from 1 to 0, with 1 being the best and 0 being the worst. The higher the value, the more accurate the segmentation is compared to the gold standard of radiologist segmentation.
k is the number of categories, i is the true value, j is the predicted value, and pij is the number of pixels that predict i as j.
t is the time taken by the model to infer an image, in seconds (s).
To better evaluate the segmentation accuracy of 3D U-Net, it is compared with Res U-Net (Xiao et al., 2018), Seg Net (Badrinarayanan et al., 2017), and Ki U-Net (Valanarasu et al., 2021) deep learning algorithms, respectively.
3 Result
3.1 Dataset
105 patients participated in the study, and a total of 420 thoracolumbar spine CT images were obtained. Among them, 2 images were excluded due to images being incomplete or images being of such low resolution for the radiologist to accurately annotate the ground truth. Finally, a total of 418 thoracolumbar spine CT images were obtained. The original images of 418 cases were horizontally flipped and rotated 45° clockwise and counterclockwise for data enhancement, and 1,672 cases were obtained.
3.2 Patch size and loss function
In this experiment, three patch sizes and three loss functions were used for the 3D U-Net network respectively (Table 2,3), and Eq. 4 was used for evaluation. From Table 2,3, it can be seen that the optimum segmentation effect was achieved with a patch size of (256, 256, 16) using the DiceLoss function. This also proved that for the segmentation of small target areas, the training effect of sending the entire image to the network was better. At the same time, DiceLoss was more suitable for this experiment than other commonly used loss functions, and the segmentation effect was also the best.
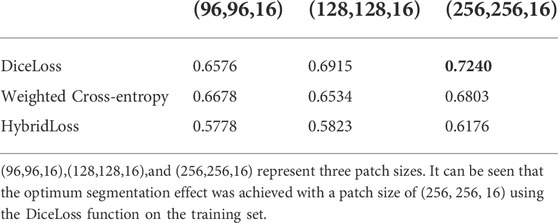
TABLE 2. DSC values for different patch sizes and loss functions of the training set.
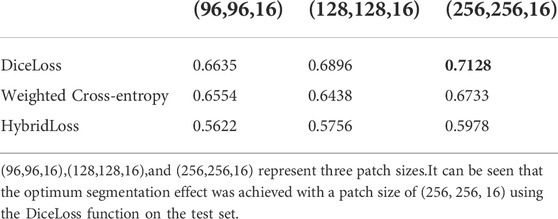
TABLE 3. DSC values for different patch sizes and loss functions of the test set.
3.3 Segmentation evaluation and comparison with other different algorithms
A comparative analysis was performed on the Res U-Net, Seg Net, Ki U-Net, and our proposed 3D U-Net. On the training set for 3D U-Net and the other three methods, we conducted a ten-fold cross-validation to determine which approach works the best. The test set was then tested using DSC, mIoU, MPA, and FPS (Table 4, 5). It can be seen that the DSC, mIoU, and MPA of 3D U-Net were higher than those of the other three methods, indicating that the segmentation effect of this method is the best. The FPS is slightly lower than that of Seg Net, but since the main purpose of this experiment is not real-time, it is acceptable. Figure 5 represents the loss drop and Dice value of different algorithms on the training set, respectively. It can be seen from the above figures that the overall performance of the 3D U-Net algorithm is better than the other three methods, and the segmentation accuracy is higher. The Loss value of the 3D-Unet algorithm is lower than the other three algorithms, while the Dice value is higher than the other three algorithms. Figure 6 compares the difference between the ground truth and the segmentation results of 3D U-Net, Ki U-Net, Res U-Net, and Seg Net. The 3D U-Net segmentation effect is found to be the best, and the overall shape is the closest to the ground truth; Seg Net and Res U-Net will incorrectly segment surrounding tissue; The segmentation result of Ki U-Net is the worst, the shape is far from the gold standard and it will segment irrelevant tissues.
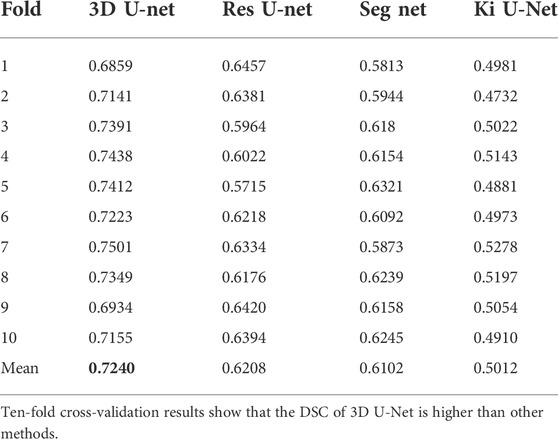
TABLE 4. DSC of the four methods on the training set.
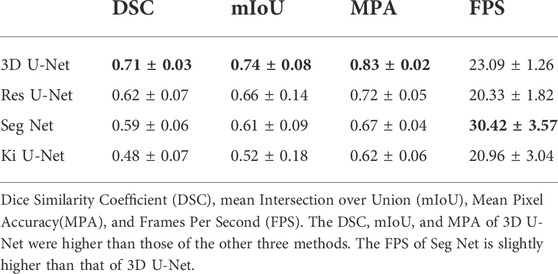
TABLE 5. Comparison of experimental results of different algorithms on the test set.
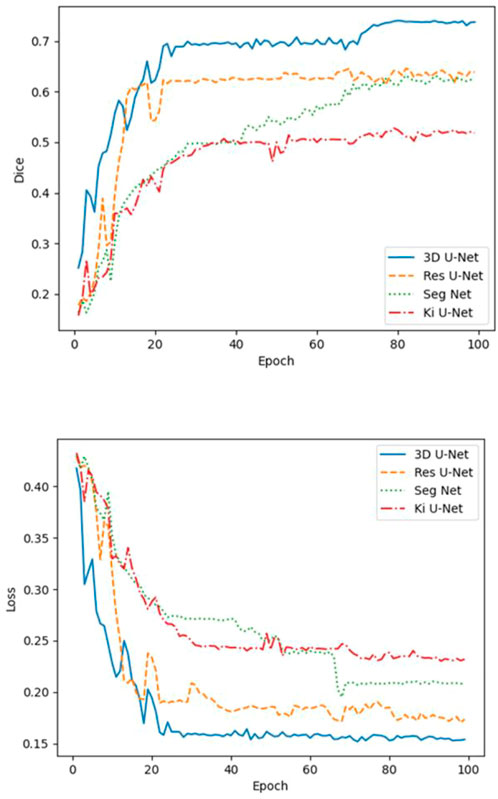
FIGURE 5. Loss and Dice values of 3D-Unet, Ki U-Net, Res U-Net, and Seg Net on the training set. The Loss value of the 3D-Unet algorithm is lower than the other three algorithms, while the Dice value is higher than the other three algorithms.
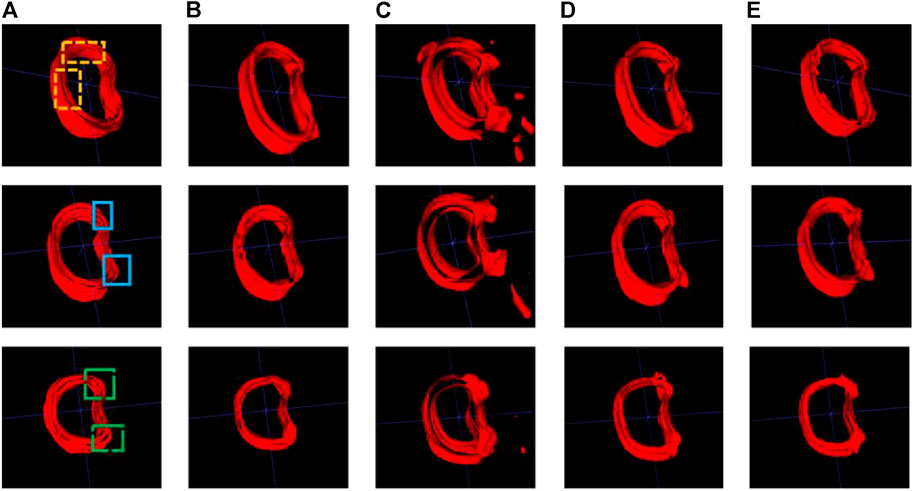
FIGURE 6. Cortical bone segmentation results (each row from left to right are the gold standard and segmentation results of the different algorithms). (A) Ground-truth; (B) 3D U-Net; (C) Ki U-Net; (D) Res U-Net; (E) Seg Net.
4 Discussion
In this study, we proposed a fully automated segmentation method based on 3D U-Net, which could obtain highly accurate results and reduce the workload of radiologists. The initial step in using finite element analysis, individualized surgical planning, and bone repair are to segment the cortical compartment. Manual segmentation is time-consuming and laborious, which is an obstacle to clinical application. Our skeletal functions are supported and protected by cortical bone, which is also vital in determining bone strength and fracture risk. This is the first time when 3D U-Net deep learning model was applied to vertebral cortex segmentation.
Since 3D images are very common in the medical field, most previous literature focused on 2D images (Malinda et al., 2019; Cho et al., 2020). If we want to train these models to solve tasks, we need to convert 3D images into 2D slices layer by layer for labeling. However, using 2D slice data to train a model is not only time-consuming and laborious but also may ignore the connection between layers. In addition, training with all the data of the entire 3D volume is inefficient and likely to cause overfitting, and it is impossible to create a large amount of data to optimize training. Therefore, based on the above discussion, the 3D U-Net was selected in this study, which was suitable for 3D medical images, and the experiment also showed that the network had a good segmentation effect on vertebral cortical bones.
At the beginning of this study, 3 different patch sizes and different loss functions were first considered. After testing, it was found that while dicing the data into little pieces might speed up the model convergence and reduce training time, it sacrifices some segmentation accuracy, therefore this study chose the patch size (256, 256, 16). In addition, compared with the Weighted Cross-entropy and HybridLoss loss functions, DiceLoss does not calculate the background area in the loss, that is, it focuses more on the segmentation of the cortical bone, which is more suitable for the task of this study. This experiment demonstrated that selecting the optimal patch size and loss function for a certain segmentation job can significantly increase the segmentation effect.
From the performance of the evaluation indicators listed in Table 5, it could be seen that the segmentation effect of 3D U-Net was superior to the other three methods. 3D U-Net had the advantage of utilizing the spatial information of 3D images, not ignoring the relationship between layers in the image, and using stitching procedures to merge low-level and high-level semantic features, allowing it to better restore the tissue’s structure and overall contours. In terms of inference speed, 3D U-Net was slightly lower than Seg Net, because the data used by 3D U-Net was three-dimensional, which consumed more computer memory than two-dimensional images. This outcome was acceptable because the segmentation job in this study was more concerned with accuracy than inference speed. The benefits of 3D U-Net resulted in a considerable improvement in segmentation accuracy, proving the method’s rationality in this study.
From Figure 6, we can see that for the 3 randomly selected test images, compared to the ground truth, Ki U-Net has the worst segmentation effect. It will not only incorrectly segment other tissues around the cortical bone, but also the overall shape is incomplete. The cortical bone region has obvious separation, which is far from the ground truth, and the segmentation performance of 3D U-Net is the closest. In the two yellow areas marked in the first image, it can be seen that the inner side of the cortical bone segmented by Res U-Net and Seg Net is relatively smooth, while the gold standard has obvious texture. At the same time, there are missing breaks in the segmentation of Seg Net, and the overall shape of the segmentation of 3D U-Net and Res U-Net is relatively complete. In the two blue regions marked in the second image, Res U-Net and Seg Net segment other surrounding tissues that do not belong to cortical bone, while 3D U-Net does not. In the two green areas marked in the third image, Res U-Net and Seg Net also have over-segmentation, and the middle area of Res U-Net segmentation is particularly obvious. Due to the fusion of cortical bone and cancellous bone or the incomplete shape of cortical bone in the adjacent layers of the 3D images in the dataset, the other three methods cannot achieve good segmentation results in this case. The input of the 3D U-Net is a three-dimensional image, which considers the connection between layers and makes better use of spatial information, so the best segmentation effect can be obtained.
To further improve the accuracy of cortical bone segmentation, there is still a lot of work to be done. First, modify the network structure to improve the segmentation ability for the fine structure. Second, further data collection is needed to increase the number of training samples. Third, since the cortical bone regions are difficult to capture and the manual calibration is time-consuming and laborious, consider using fewer and high-quality labels in combination with other methods to delineate the cortical bone.
5 Conclusion
In this work, we proposed a fully automated cortical bone segmentation method based on 3D U-Net. The obtained results were quantitatively evaluated on the entire dataset. Our proposed model not only achieved satisfactory segmentation accuracy, but it was also computationally efficient at inference time. Our results also showed that 3D U-Net significantly improved segmentation results compared to other deep learning algorithms.
Data availability statement
The raw data supporting the conclusions of this article will be made available by the authors, without undue reservation.
Ethics statement
The studies involving human participants were reviewed and approved by Ethics Committee of the Second Affiliated Hospital of Shandong First Medical University (NO.2020-035). Written informed consent for participation was not required for this study in accordance with the national legislation and the institutional requirements.
Author contributions
YL, CL, and JQ contributed to conception and design of the study. YL, HY, SL, QY, and HQ organized the database. YL, ZS and XX performed the statistical analysis. YL wrote the manuscript. All authors contributed to manuscript revision, read, and approved the submitted version.
Acknowledgments
This work was supported by the Academic Promotion Program of Shandong First Medical University [grant number 2019QL017] and Taian Science and Technology Development Program [grant number 2021NS254].
Conflict of interest
ZS, was employed by Hangzhou Shimai Intelligent Technology Co.Ltd.
The remaining authors declare that the research was conducted in the absence of any commercial or financial relationships that could be construed as a potential conflict of interest.
Publisher’s note
All claims expressed in this article are solely those of the authors and do not necessarily represent those of their affiliated organizations, or those of the publisher, the editors and the reviewers. Any product that may be evaluated in this article, or claim that may be made by its manufacturer, is not guaranteed or endorsed by the publisher.
Supplementary material
The Supplementary Material for this article can be found online at: https://www.frontiersin.org/articles/10.3389/fbioe.2022.996723/full#supplementary-material
References
Ang, I. C., Fox, M., and Polk, J. D. (2020). An an Algorithm for Automated Separation of Trabecular Bone from Variably Thick Cortices in High-Resolution Computed Tomography Data.lgorithm for automated separation of trabecular bone from variably thick cortices in high-resolution computed tomography data. IEEE TransIEEE Trans. Biomed. Eng. Biomed. Eng. 67 (3), 924–930. doi:10.1109/TBME.2019.2924398
Badrinarayanan, V., Kendall, A., and Cipolla, R. (2017). SegNet: A SegNet: A deep convolutional encoder-decoder architecture for image segmentationeep convolutional encoder-decoder architecture for image segmentation. IEEE TransIEEE Trans. Pattern Anal. Mach. Intell. Pattern Anal. Mach. Intell. 39 (12), 2481–2495. doi:10.1109/tpami.2016.2644615
Buie, H. R., Campbell, G. M., and Klinck, R. J. (2007). Automatic segmentation of cortical and trabecular compartments based on a dual threshold technique for in vivo micro-CT bone analysis. Bone 41 (4), 505–51515. doi:10.1016/j.bone.2007.07.007
Cao, K. D., Grimm, M. J., and Yang, K. H. (19762001). Load sharing within a human lumbar vertebral body using the finite element method. Spine 26 (12), E253–E260. doi:10.1097/00007632-200106150-00011
Chan, H. P., Samala, R. K., and Hadjiiski, L. M. (2020). Deep deep learning in medical image Analysis.earning in medical image analysis. AdvAdv. Exp. Med. Biol. Exp. Med. Biol. 1213, 3–21. doi:10.1007/978-3-030-33128-3_1
Chandra, S. S., Bran Lorenzana, M., and Liu, X. (2021). Deep learning in magnetic resonance image reconstruction. Jj. Med. Imaging Radiat. Oncol. Med. Imaging Radiat. Oncol. 65 (5), 564–577. doi:10.1111/1754-9485.13276
Cheng, X., Yuan, H., Cheng, J., Weng, X., Xu, H., Gao, J., et al. (2020). Chinese expert consensus on the diagnosis of osteoporosis by imaging and bone mineral density. Quant. imaging Quant. Imaging Med. Surg. Surg. 10 (10), 2066–2077. doi:10.21037/qims-2020-16
Cho, B. H., Kaji, D., and Cheung, Z. B. (2020). Automated automated measurement of lumbar lordosis on radiographs using machine learning and computer visioneasurement of lumbar lordosis on radiographs using machine learning and computer vision. GlobGlobal Spine J. Spine J. 10 (5), 611–618. doi:10.1177/2192568219868190
Cicek, O., Abdulkadir, A., and Lienkamp, S. S., (20162016). 3D U-net: Learning dense volumetric segmentation from sparse annotation. Med. Image Comput. Computer-Assisted Intervention-MICCAI, 1. 424–432.
Fu, Y., Lei, Y., and Wang, T. (2020). Deep learning in medical image registration: Deep learning in medical image registration: A review review. PhysPhys. Med. Biol. Med. Biol. 65 (20), 20TR01. doi:10.1088/1361-6560/ab843e
Hassanzadeh, T., Essam, D., and Sarker, R. (2021). 2D to 3D 2D to 3D evolutionary deep convolutional neural networks for medical image segmentationvolutionary deep convolutional neural networks for medical image segmentation. IEEE TransIEEE Trans. Med. Imaging Med. Imaging 40 (2), 712–721. doi:10.1109/tmi.2020.3035555
Huang, S. H., Chu, Y. H., and Lai, S. H. (2009). Learning-based vertebra detection and iterative normalized-cut segmentation for spinal MRI. IEEE TransIEEE Trans. Med. Imaging Med. Imaging 28 (10), 1595–1605605. doi:10.1109/tmi.2009.2023362
Jiang, Y., Yang, M., and Wang, S. (2020). Emerging role of deep learning-based artificial intelligence in tumor pathology. Cancer CommunCancer Commun. (Lond). (Lond). 40 (4), 154–166. doi:10.1002/cac2.12012
Kalmet, P. H. S., Sanduleanu, S., and Primakov, S. (2020). Deep learning in fracture detection: Deep learning in fracture detection: A narrative review narrative review. Acta OrthopActa Orthop. 91 (2), 215–220. doi:10.1080/17453674.2019.1711323
Kolarik, M., Burget, R., and Uher, V. (2019). Optimized optimized high resolution 3D dense-U-net network for brain and spine segmentationigh resolution 3D dense-U-net network for brain and spine segmentation. Appl. Sci. (Basel). Sciences-Basel 9 (03), 404. doi:10.3390/app9030404
Krishnan, P. T., Balasubramanian, P., and Umapathy, S. (2020). Automated heart sound classification system from unsegmented phonocardiogram (PCG) using deep neural network. PhysPhys. Eng. Sci. Med. Eng. Sci. Med. 43 (2), 505–515. doi:10.1007/s13246-020-00851-w
Lessmann, N., van Ginneken, B., and de Jong, P. A. (2019). Iterative fully convolutional neural networks for automatic vertebra segmentation and identification. MedMed. Image Anal. Image Anal. 53, 142–155. doi:10.1016/j.media.2019.02.005
Li, C., Jin, D., and Burns, T. L. (2013). A A New Algorithm for Cortical Bone Segmentation with its Validation and Applications to in Vivo Imaging.ew algorithm for cortical bone segmentation with its validation and applications to in vivo imaging. ProcProc. Int. Conf. Image Anal. Process. Int. Conf. Image Anal. Process 8157, 349–358. doi:10.1007/978-3-642-41184-7_36
Li, J., Wang, P., and Zhou, Y. (2021). Different different machine learning and deep learning methods for the classification of colorectal cancer lymph node metastasis Images.achine learning and deep learning methods for the classification of colorectal cancer lymph node metastasis images. Front. Bioeng. Biotechnol. Bioeng. Biotechnol. 8. 620257. doi:10.3389/fbioe.2020.620257
Li, Y., Qian, R., and Li, K. (2022). Inter-patient arrhythmia classification with improved deep residual convolutional neural network. Comput. Methods Programs Biomed. Methods Programs Biomed. 214. doi:10.1016/j.cmpb.2021.106582doi:106582
Malinda, V., Dawit, M., and Deukhee, L. (2019). Automatic spine segmentation from CT images using Convolutional Neural Network via redundant generation of class labels[J]. J. Comput. Des. Eng. 1(6), 224–232.
Mastmeyer, A., Engelke, K., and Fuchs, C., (2006). A hierarchical 3D segmentation method and the definition of vertebral body coordinate systems for QCT of the lumbar spine. MedMed. Image Anal. Image Anal. 10 (4), 560–577. doi:10.1016/j.media.2006.05.005
Palepu, V., Rayaprolu, S. D., and Nagaraja, S. (2019). Differences in differences in trabecular bone, cortical shell, and endplate microstructure across the lumbar spinerabecular bone, cortical shell, and endplate microstructure across the lumbar spine. IntInt. J. Spine Surg. J. Spine Surg. 13 (4), 361–370. doi:10.14444/6049
Rockoff, S. D., Sweet, E., and Bleustein, J. (1969). The relative contribution of trabecular and cortical bone to the strength of human lumbar vertebrae. CalcifCalcif. Tissue Res. Tissue Res. 3 (2), 163–175. doi:10.1007/bf02058659
Ronneberger, O., Fischer, P., and Brox, T. (2015). Medical image computing and computer-assisted intervention - miccai 2015. U-net convolutional Netw. Biomed. image segmentation 1, 234–241.
Shah, F. A., Adrian, S., and Carina, C. (2018). Multiscale characterization of cortical bone composition, microstructure, and nanomechanical properties in experimentally induced osteoporosis. BiomedJ. Biomed. Mater. Res. A Mater Res. A 106 (4), 997–1007. doi:10.1002/jbm.a.36294
Valanarasu, J. M. J., Sindagi, V. A., and Hacihaliloglu, I. (2021). KiU-Net: Overcomplete convolutional architectures for biomedical image and volumetric segmentation. IEEE Trans. Med. Imaging 1, 1.
Valentinitsch, A., Patsch, J. M., and Deutschmann, J. (2012). Automated threshold-independent cortex segmentation by 3D-texture analysis of HR-pQCT scans. Bone 51 (3), 480–4877. doi:10.1016/j.bone.2012.06.005
van Sloun, R. J. G., Solomon, O., and Bruce, M. (2021). Super-super-resolution ultrasound localization microscopy through deep learningesolution ultrasound localization microscopy through deep learning. IEEE TransIEEE Trans. Med. Imaging Med. Imaging 40 (3), 829–839. doi:10.1109/tmi.2020.3037790
Wallace, A. N., Hillen, T. J., and Friedman, M. V. (2017). Percutaneous percutaneous spinal ablation in a sheep model: Protective capacity of an intact cortex, correlation of ablation parameters with ablation zone size, and correlation of postablation MRI and pathologic findingspinal ablation in a sheep model: Protective capacity of an intact cortex, correlation of ablation parameters with ablation zone size, and correlation of postablation MRI and pathologic findings. AJNR AmAJNR. Am. J. Neuroradiol. J. Neuroradiol. 38 (8), 1653–1659. doi:10.3174/ajnr.a5228
Xiao, X., Lian, S., and Luo, Z. M. (2018). “Weighted res-UNet for high-quality retina vessel segmentation,” in Proceedings of the Ninth international conference on information Technology in medcine and education, Hangzhou, China, October 2018, 327–331.
Yan, R., Ren, F., and Wang, Z. (2020). Breast cancer histopathological image classification using a hybrid deep neural network. Methods 173, 52–60. doi:10.1016/j.ymeth.2019.06.014
Ye, C., Guo, Y., Zheng, Y., Wu, Z., Chen, K., Zhang, X., et al. (2020). Distal radial cortical bone thickness correlates with bone mineral density and can predict osteoporosis: Distal radial cortical bone thickness correlates with bone mineral density and can predict osteoporosis: A cohort study cohort study. Injury 51 (11), 2617–2621. doi:10.1016/j.injury.2020.08.018
Zaharchuk, G., Gong, E., and Wintermark, M. (2018). Deep deep learning in neuroradiologyearning in neuroradiology. AJNR AmAJNR. Am. J. Neuroradiol. J. Neuroradiol. 39 (10), 1776–1784. doi:10.3174/ajnr.a5543
Zebaze, R., Ghasem-Zadeh, A., and Mbala, A. (2013). A new method of segmentation of compact-appearing, transitional and trabecular compartments and quantification of cortical porosity from high resolution peripheral quantitative computed tomographic images. Bone 54 (1), 8–20. doi:10.1016/j.bone.2013.01.007
Keywords: cortical separation, 3D U-Net, deep learning, segmentation, artificial intelligence, AI
Citation: Li Y, Yao Q, Yu H, Xie X, Shi Z, Li S, Qiu H, Li C and Qin J (2022) Automated segmentation of vertebral cortex with 3D U-Net-based deep convolutional neural network. Front. Bioeng. Biotechnol. 10:996723. doi: 10.3389/fbioe.2022.996723
Received: 18 July 2022; Accepted: 02 September 2022;
Published: 27 September 2022.
Edited by:
Mengxing Li, University of Nebraska-Lincoln, United StatesReviewed by:
Sree Aurovindh Viswanathan, The Home depot, GeorgiaYe Wang, Facebook, United States
Fengyuan Zhao, Peking University Third Hospital, China
Shiqiang Jin, Bristol Myers Squibb, United States
Sreecharan Sankaranarayanan, Amazon, United States
Weichuan Xu, Huaiyin Institute of Technology, China
Vicky Yau, Columbia University Irving Medical Center, United States
Copyright © 2022 Li, Yao, Yu, Xie, Shi, Li, Qiu, Li and Qin. This is an open-access article distributed under the terms of the Creative Commons Attribution License (CC BY). The use, distribution or reproduction in other forums is permitted, provided the original author(s) and the copyright owner(s) are credited and that the original publication in this journal is cited, in accordance with accepted academic practice. No use, distribution or reproduction is permitted which does not comply with these terms.
*Correspondence: Jian Qin, sdqinjian@126.com