Modeling cartilage pathology in mucopolysaccharidosis VI using iPSCs reveals early dysregulation of chondrogenic and metabolic gene expression
 M. Broeders1,2,3
  Jgj van Rooij4 E. Oussoren1,3 Tjm van Gestel1,2,3 Ca Smith5 Sj Kimber5
  Rm Verdijk6 Maem Wagenmakers3,4
  Jmp van den Hout1,3 At van der Ploeg1,3
  R. Narcisi7
  Wwmp Pijnappel1,2,3*
- 1Department of Pediatrics, Erasmus MC University Medical Center, Rotterdam, Netherlands
- 2Department of Clinical Genetics, Erasmus MC University Medical Center, Rotterdam, Netherlands
- 3Center for Lysosomal and Metabolic Diseases, Erasmus MC University Medical Center, Rotterdam, Netherlands
- 4Department of Internal Medicine, Erasmus MC Medical Center, Rotterdam, Netherlands
- 5Division of Cell Matrix Biology and Regenerative Medicine, School of Biological Sciences, Faculty of Biology Medicine and Health, University of Manchester, Manchester, United Kingdom
- 6Department of Pathology, Erasmus MC University Medical Center, Rotterdam, Netherlands
- 7Department of Orthopaedics and Sports Medicine, Erasmus MC University Medical Center, Rotterdam, Netherlands
Mucopolysaccharidosis type VI (MPS VI) is a metabolic disorder caused by disease-associated variants in the Arylsulfatase B (ARSB) gene, resulting in ARSB enzyme deficiency, lysosomal glycosaminoglycan accumulation, and cartilage and bone pathology. The molecular response to MPS VI that results in cartilage pathology in human patients is largely unknown. Here, we generated a disease model to study the early stages of cartilage pathology in MPS VI. We generated iPSCs from four patients and isogenic controls by inserting the ARSB cDNA in the AAVS1 safe harbor locus using CRISPR/Cas9. Using an optimized chondrogenic differentiation protocol, we found Periodic acid–Schiff positive inclusions in hiPSC-derived chondrogenic cells with MPS VI. Genome-wide mRNA expression analysis showed that hiPSC-derived chondrogenic cells with MPS VI downregulated expression of genes involved in TGF-β/BMP signalling, and upregulated expression of inhibitors of the Wnt/β-catenin signalling pathway. Expression of genes involved in apoptosis and growth was upregulated, while expression of genes involved in glycosaminoglycan metabolism was dysregulated in hiPSC-derived chondrogenic cells with MPS VI. These results suggest that human ARSB deficiency in MPS VI causes changes in the transcriptional program underlying the early stages of chondrogenic differentiation and metabolism.
1 Introduction
Mucopolysaccharidoses type VI (MPS VI) is an autosomal recessive disorder caused by Arylsulfatase B (ARSB) enzyme deficiency leading to intralysosomal accumulation of the glycosaminoglycans (GAGs) dermatan sulfate (DS) and chondroitin sulfate (CS). MPS VI is a multisystemic disease with GAG accumulation in connective tissues and organs which ultimately leads to a cascade of symptoms such as corneal clouding, hepatosplenomegaly and bone and cartilage pathology. In all MPS VI patients the hips are frequently and severely affected resulting in limitations in mobility and pain with impact on quality of life (Oussoren et al., 2017).
Currently, treatment of MPS VI consists of enzyme replacement therapy (ERT) with intravenous administration of recombinant ARSB enzyme. Although ERT attenuates disease progression and resolves hepatosplenomegaly, the therapeutic effect on bone and cartilage pathology is limited. Cartilage in particular is nonresponsive to ERT, likely due to the poor vascularization of cartilage resulting in impaired delivery of the enzyme from the circulation to chondrocytes. In a pre-clinical setting, monthly intra-articular injection of ERT reduced storage material in articular cartilage of MPS VI cats (Auclair et al., 2006; Auclair et al., 2007). However, it is not feasible to inject individual joints monthly in every patient. Therefore, the cartilage pathology in MPS VI and other forms of MPS remains an unmet medical need to date.
The development of cartilage pathology in patients with MPS VI remains poorly understood. Several studies in animal models for MPS VI and related types of MPS have been performed, and have provided insight in the cascade of events resulting in cartilage pathology. This has shown that chrondrocytes in MPS VI are abnormal with a swollen appearance and containing membrane-bound inclusions/vacuoles (Haskins et al., 1980). In the growth plate, there is loss of columnar structure and excess of calcified cartilage (Abreu et al., 1995). In newborn mice abnormal anlagen of tracheal and articular cartilage was reported, indicating that cartilage pathology can already start during development (Evers et al., 1996). Studies from human cartilage biopsies of MPS I, II and III patients showed severe cartilage damage and abnormal chondrocytes (Oussoren et al., 2011; Oussoren et al., 2021), but limited information is available on the development of cartilage pathology in human patients with MPS VI.
At the molecular level, primary lysosomal accumulation of GAGs can result in secondary accumulation of cholesterol and the gangliosides GM2 and GM3, indicating cross talk between metabolic pathways in MPS and other lysosomal diseases (Ballabio and Gieselmann, 2009). GAGs can also function as receptor ligands to activate Toll like receptors, resulting in inflammation. In addition GAGs can also activate growth factors such as BMPs, involved in cartilage and bone development (Oussoren et al., 2011). In mice with the related disorder MPS VII, the growth plate was enlarged, disorganized, and contained fewer chondrocytes. It was suggested that chondrocytes displayed a delayed exit from G1 into M and a delayed terminal differentiation, possibly mediated by elevated expression of PTHrP and Wnt5a (Jiang et al., 2020). How these processes operate in human chondrocytes with MPS VI remains largely unknown.
In humans, the high variability of genetic background between individuals complicates the downstream analysis of disease progression (Soldner et al., 2011; Hockemeyer and Jaenisch, 2016). It has become clear that differences in gene expression and functional parameters can be considerable between individuals, which introduces a large amount of (seemingly random) variation to the analyses. Recent advancements in gene editing using CRISPR/Cas9 enable the generation of isogenic controls to reduce these effects and to decipher molecular mechanisms of disease by generating isogenic controls, i.e. diseased and healthy versions with the same genetic background (Broeders et al., 2019; Ernst et al., 2020). In contrast to mesenchymal stem cells (Kolf et al., 2007), hiPSCs have high capacity for self-renewal and are suitable for gene editing, which makes hiPSCs attractive for disease modeling of cartilage pathology.
Here, we generated isogenic pairs from four patient-derived hiPSC lines using CRISPR-Cas9 to generate a model for the cartilage pathology in MPS VI. We improved the protocol for chondrogenic differentiation of hiPSCs, and applied this to characterize the pathology and molecular changes in human chondrogenic cells with MPS VI.
2 Materials and methods
2.1 Ethics approval and consent to participate
The Institutional Review Board approved the study protocol, and all patients provided written informed consent.
2.2 LV-OSKM lentivirus production
HEK293T cells were cultured in 10 cm culture dishes with DMEM high glucose (Gibco) supplemented with 10% fetal bovine serum (Thermo Scientific) and 100 U/ml Penicillin/Streptomycin/Glutamine (Gibco). At 80% confluency, cells were transfected with 3 µg LV-OSKM reprogramming vector, 2 µg psPAX2 and 1 µg pVSV using Fugene 6 transfection reagent according to manufacturer’s protocol (Promega). Medium was filtered with 0.45 µm PDFV filters (Millipore) 72 h post transfection and concentrated by centrifugation for 2 h at 20 k rpm with a Beckman Coulter Ultracentrifuge with SW32 Ti rotor. The virus was dissolved in 100 µL concentration in DMEM low glucose (Gibco) and stored at −80°C.
2.3 hiPSC generation and culturing
HiPSCs were generated from patient-derived primary fibroblasts as described before (van der Wal et al., 2018). Fibroblast cells from four patients with a rapid disease progression were reprogrammed using a polycistronic lentiviral vector of Oct4, Sox2, Klf4, and c-Myc (LV-OSKM). hiPSCs were cultured on γ-irradiated mouse embryonic feeder (MEF) cells with hiPSC culture medium consisting of DMEM/F12 medium (Invitrogen), 20% knock-out serum replacement (Invitrogen), 1% non-essential amino acids (Gibco), 1% penicillin/streptomycin/L-glutamine (100x, Gibco), 2 mM β-mercaptoethanol (Invitrogen) and 20 ng/ml basic fibroblast growth factor 2 (Peprotech). After gene correction, the hiPSCs were transferred to a feeder free culture with Vitronectin XF (Stem Cell) as coating and mTeSR™ Plus (Stem Cell) as media. Healthy control hiPSCs were obtained from the HIPSCI database and cultured with Vitronectin XF (Stem Cell) as coating and mTeSR™ Plus (Stem Cell) as media. Mycoplasma tests were routinely performed on all cell lines using the MycoAlert™ Mycoplasma Detection Kit (Lonza) and were found negative.
2.4 Gene correction
The donor construct to express the healthy copy of the ARSB gene was generated as described previously (van der Wal et al., 2018; in ’t Groen et al., 2021), with the ARSB cDNA (from Sino biological, HG13674-G) instead of the GAA cDNA. CRISPR/Cas9 was used to insert the transgene into the AAVS1 locus. Gene editing was performed as described previously (van der Wal et al., 2018; in ’t Groen et al., 2021). In short, optimal target sites for the AAVS1 locus were selected using the CRISPRscan program (Moreno-Mateos et al., 2015). The 5′-GTCACCAATCCTGTCCCTAG-3′ sgRNA was selected and in silico analysis showed no potential off-targets with less than 4 mismatches (Supplementary Table S1). A vector containing the U6 promoter (addgene: 41,824) was used to express the sgRNA. hiPSCs on feeders were pretreated with RevitaCell (Thermo Fisher Scientific) 4 h prior nucleofection. Single cells were generated from hiPSC colonies by incubating with TrypLE (Thermo Fisher Scientific). A DNA mix was prepared consisting of 8.9 µg of pCAG-hCAS9-GFP (addgene: 44,719), 6.7 µg of TOPO-sgRNA, and 4.4 µg of donor vector. 2 × 10⁶ cells were nucleofected with the DNA mix using Amaxa Human Stem Cell Nucleofector Kit2 (VPH-5022, Lonza) with program B-016. Cells were plated in hiPSC-conditioned medium (hiPSC medium incubated for 24 h on feeder cells) supplemented with 20 ng/ml FGF2 (Prepotech) and RevitaCell to improve survival. 100 mg/mL G-418 (Invivogen) selection was initiated 48 h after nucleofection. Approximately 14 days after initiation of selection, single iPS colonies were picked and genotyped. Primers used for the cloning of the ARSB cDNA and genotyping of gene edited hiPSCs can be found in Supplementary Table S2.
2.5 Chondrogenic differentiation
HiPSCs were differentiated into chondrogenic cells using a 14-day differentiation protocol that was modified from Oldershaw et al. (Oldershaw et al., 2010). Single cells were generated from hiPSC colonies by incubation with TrypLE (Thermo Fisher Scientific), and 5 × 10⁵ cells were plated on a Vitronectin XF (Stem cell) coated plate. This protocol consists of activation of the WNT signaling using 2 µM CHIR99021 (R & D Systems) and 50 to 10 ng/ml Activin-A (Peprotech) from day 1–3.40 ng/ml FGF2 (Peprotech) was added from day 2 and sustained during the whole differentiation. 5 ng/ml BMP2 (R&D Systems) was added from day 3–10.1 µM SB431542 (Torcis) was sustained from day 5–8. GDF5 was added in increasing concentrations from day 9 onwards: 20 ng/ml on day 9 and 10, 40 ng/ml from day 11 until day 14. Cells were split on day 5 in a 1/5 to 1/8 ratio and on day 8 in a 1/4 to 1/6 ratio. Medium was supplemented with Revitacell on the day of splitting. Cell culture plates were coated with Vitronectin XF on days 1–7 and from day 8–14 with a Vitronectin XF and 0.1% gelatin mix (Sigma-Aldrich).
2.6 Periodic acid–Schiff staining
Day 14 chondrogenic cells were replated in 4 independent cultures on Cell culture plates that were coated with Vitronectin XF and 0.1% gelatin. After 48 h, cells were harvested by incubating with TrypLE (Thermo Fisher Scientific) and single cells were centrifuged on a slide using the Cytospin. The samples were fixed in a formaldehyde ethanol solution for 5 min and rinsed with water. Samples were then incubated in 1% Periodic acid (Supelco) for 10 min and rinsed with water for 10 min. The samples were placed in Schiffs reagent (Sigma-Aldrich) for 15 min at 37°C and rinsed with water for 15 min. The samples were then placed in Mayer’s hemalum solution (Sigma-Aldrich) for 5 min and rinsed with water. They were air-dried and mounted with Entellan (Sigma-Aldrich). Images were obtained using a NanoZoomer 2.0HT C9600-12 (Hamamatsu) and quantified by two independent observers.
2.7 ARSB enzyme assay
The ARSB enzyme activity was measured as described previously (Baum et al., 1959). In short, cells were lysed in TNE-1% (50 mM Tris-HCl pH 8.0, 150 mM NaCl, 50 mM NaF, and 1% Triton X100, containing a protease inhibitor cocktail (Roche) and added to the paranitrocatecholdisulfate substrate. The conversion of paranitrocatecholdisulfate to paranitrocatechol was measured on a spectrophotometer. A primary human skin fibroblast cell line from a healthy control was used as a reference.
2.8 RNA isolation and sequencing
RNA was isolated using the RNAeasy miniprep kit with on-column DNase treatment (Qiagen) according to manufacturer’s protocol. Sequencing was performed after poly-A selection and TruSeq library prep at the Human Genomics facility (www.glimdna.org) on a HiSeq2000 at paired-end 150 bp. Data were processed per sample using STAR (v2.3.0) (Dobin et al., 2013; Bolger et al., 2014), picard (v1.90), and GATK (v2.8). Transcript quantification was performed using featureCounts (v1.4.3) against all 57,820 gene features in GENCODE (version date; 2013-12-05) (Harrow et al., 2012; Liao et al., 2014).
2.9 Data analysis
Raw counts per gene were normalized using the edgeR (v3.8.6) trimmed mean of M-values method to counts per million values. Principal components (PCs) were calculated using “prcomp” in R, and then plotted to visually identify sample outliers. Statistical analysis was performed per gene using the glmFit function in edgeR, correcting stratifying for the four cell lines. Selected groups of genes are clustered and visualized using z-transformation per gene set and subsequent euclidean hierarchical clustering in the TIBCO Spotfire package (v7.14).
2.10 GO analysis
Differential expressed genes among isogenic controls were analyzed by the PANTHER Classification System (Mi et al., 2019). Selection for genes was based on a CPM of >0 for all samples and replicates, a log2 FC of 0.59 or -0.59 for upregulated and downregulated genes, respectively, and an FDR of ≤0.05. The flowchart for the selection of genes is shown in Supplementary Figure S4.
2.11 Western blot analysis
Total protein fractions were isolated using Mammalian Protein Extraction Reagent (M-PER) (#78501, Thermo Scientific) with 1X protease inhibitor (78,430, Thermo Scientific) and 1X phosphatase inhibitor (78,428, Thermo Scientific). Protein concentration was determined using the Pierce BCA Protein Assay Kit (23,225, Thermo Scientific). A total of 8 mg of total protein fraction for each sample was separated by a 4–15% precast polyacrylamide gel (5,671,084, Bio-Rad) and transferred to a nitrocellulose membrane (1,704,159, Bio-Rad) using the Trans-Blot Turbo Transfer System. Membranes were blocked in 5% dry milk powder in 0.1% tris-buffered saline-tween (TBS-T) for 2 h, washed three times in 0.1% TBS-T and incubated with primary antibodies against Cleaved Caspase-3, Non-phospho (Active) β-Catenin, α-Tubulin, or GAPDH (all diluted 1:1000; respectively 9,661, 8,814, 2,125 and 7,074, Cell Signaling Technology) overnight at 4°C following the manufacturer’s protocol. An anti-rabbit horseradish peroxidase (HPR)-linked secondary antibody (1:1000; 7,074, Cell Signaling Technology) was added and incubated for 1 h at room temperature. The blots were visualized with SuperSignal Chemiluminescent detection kit (34,077, Thermo Scientific) using the manufacturer’s instruction. Image analysis and quantification were performed using the National Institute of Health ImageJ freeware (release 1.53; http://rsb.info.nih.gov/ij/).
3 Results
3.1 Cartilage pathology in an MPS VI patient
To study cartilage pathology in MPS VI, a femoral head and acetabulum were obtained by autopsy of a 25-year-old MPS VI patient that died from disease-related symptoms. This patient (Patient #1) had a homozygous ARSB c.937C>T disease-associated variant that lead to a rapid MPS VI disease progression. X-ray and CT analysis of the hip showed severe osteoarthritis of the femoral head with total destruction and abnormal ossification, and with an abnormal steep and dysplastic acetabulum, which is also shown in the macroscopic pictures (Figures 1A–D). The vertebrae were abnormal shaped, with an abnormal degenerative cartilage endplate (Figures 1E, F). Chondrocytes within the vertebrae cartilage showed multiple proliferative clones, which reflects the pathological response, and vacuolar changes in HE stained sections (Figures 1G,H). Electron microscopy analysis of the same cartilage showed examples of chondrocytes with different types of vacuoles and in addition lipid storage (Figures 1I,J). These results illustrate the joint pathology in MPS VI, and they show that chondrocytes are affected by very severe vacuolization and lipid storage.
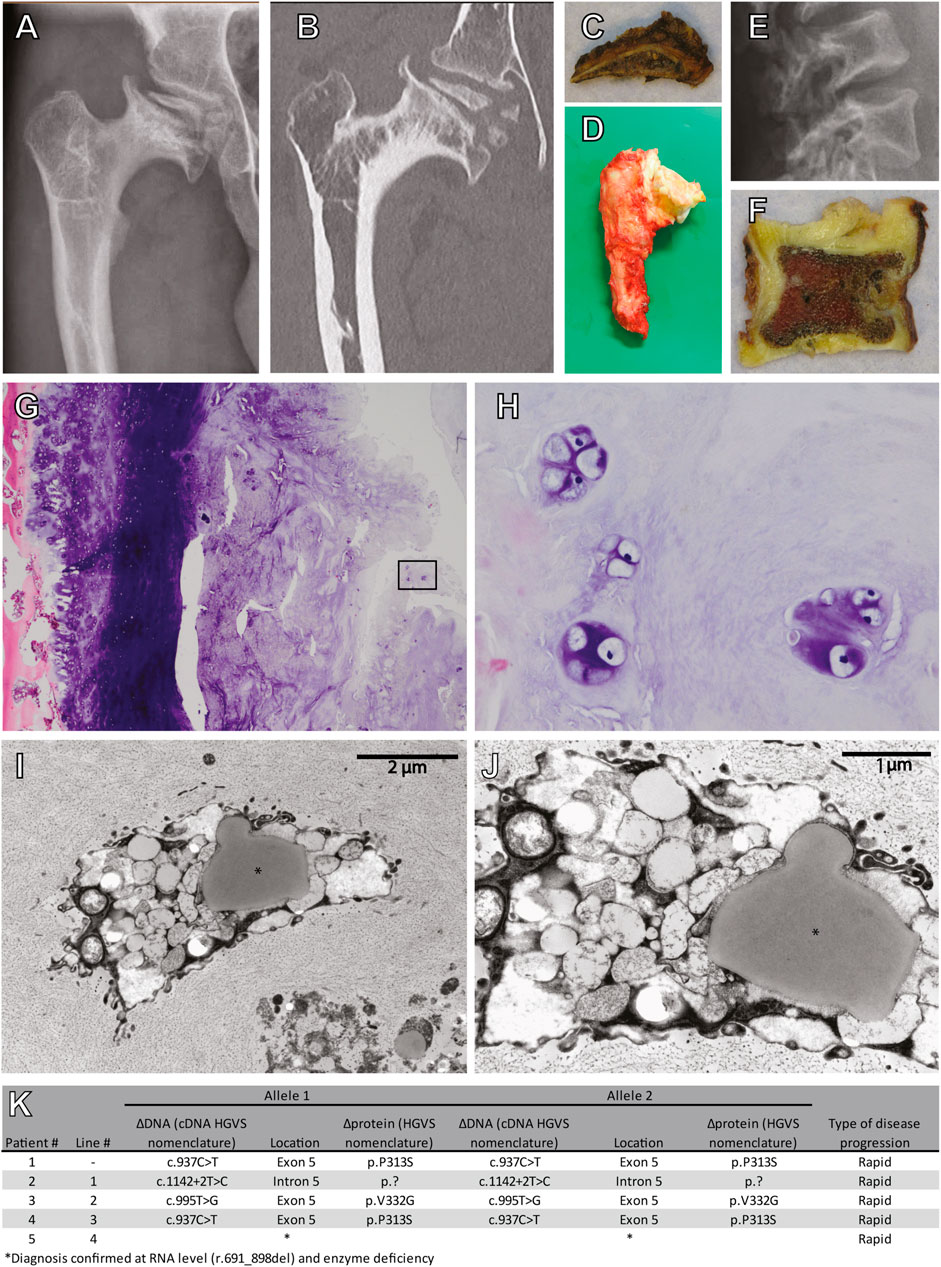
FIGURE 1. Cartilage pathology in a 25 year old diseased MPS VI patient. (A) X-ray and (B) CT scan of the right hip. Macroscopic pictures from autopsy of the (C) right acetabulum and (D) femoral head. (E) X-ray of the lumbar vertebrae. (F) A macroscopic picture from autopsy of one vertebra. (G) HE stain of cartilage from this vertebra (Magnification ×100), (H) details from the inset in G (Magnification ×400). (I,J) Electron microscopy analysis showing examples of chondroyctes with different types of vacuoles and in addition lipid storage (indicated with *). (K) Characteristics of included patients.
3.2 Generation of patient-derived hiPSCs and gene editing to generate isogenic controls
To model cartilage pathology in human MPS VI, we selected four patients with a rapid disease progression. Diagnosis was based on ARSB enzyme activity, accumulation of urinary GAGs (uGAGs), the presence of disease-associated variants in the ARSB gene, and clinical symptoms (Figure 1K). Patient #2, and #3 were homozygous for ARSB c.1142+2T>C and c.995T>G, respectively. Patient #4 was homozygous for ARSB c.937C>T, and a sibling of patient #1. No disease-associated variant for patient #5 had been identified, but we recently confirmed the molecular diagnosis at the RNA level (Broeders et al., 2020). hiPSC lines were generated from primary fibroblasts using lentiviral expression of Oct4, Sox2, Klf-4, and C-Myc as described (van der Wal et al., 2018).
To restore expression of ARSB, a healthy copy was introduced into a safe location of the genome, also known as a safe harbor. This provides a generic and efficient method, which contrasts with correcting individual mutations. We chose the widely used PPP1R12C gene in the AAVS1 locus located on chromosome 19 (Figure 2A). A donor construct previously described by us (van der Wal et al., 2018; in ’t Groen et al., 2021) was adapted to introduce a healthy copy of the ARSB gene using CRISPR/cas9 via the homology directed repair (HDR) pathway. This construct (Figure 2B) contained the ARSB cDNA driven by the constitutively active EF1α promoter, and the neomycin resistance gene to enable selection for successful integrations, which is required due to the highly inefficient HDR pathway. To validate ARSB expression by the donor construct, HeLa TK- cells were transfected and selection was started 24 h after transfection. After selection, the cells showed an ARSB enzyme activity of ∼1400 nmol/mg/hr, which was above the range seen in healthy control fibroblasts (Supplementary Figure S2). No ARSB enzyme activity was detected in HeLa TK- cells transfected with a pCAG-NEO control vector. This confirmed that the ARSB donor construct was functional.
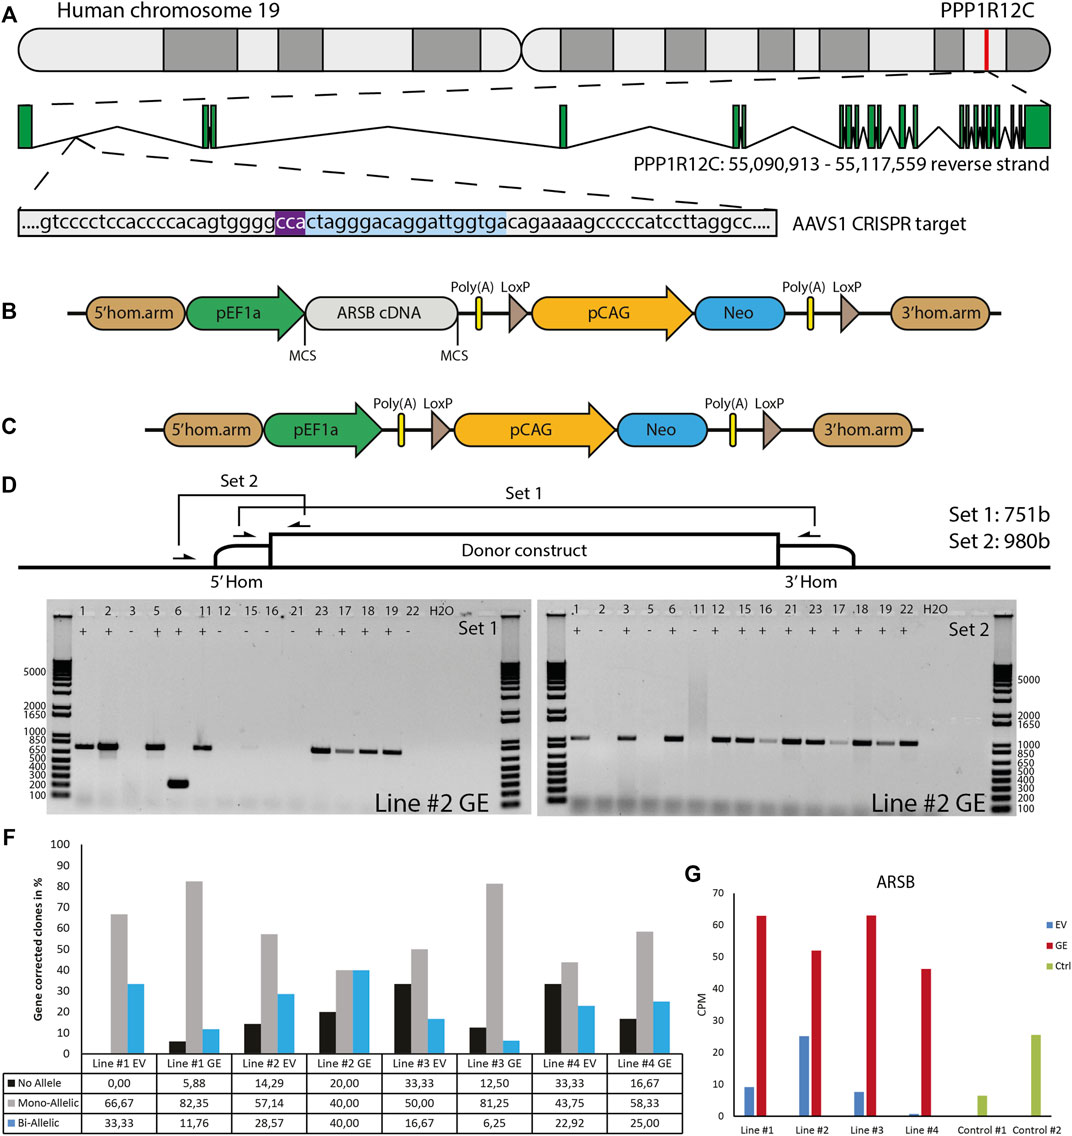
FIGURE 2. Gene editing in hiPSCs. (A) The gene editing strategy was designed to express ARSB from the AAVS1 locus. PAM sequence indicated in purple, gRNA target indicated in blue. (B) The donor construct generated for insertion of the ARSB cDNA in the AAVS1 safe harbor by CRISPR/Cas9-mediated gene editing. The neomycin cassette enables G418 selection of targeted colonies. (C) The empty vector construct used to generate isogenic controls. (D) Strategy for the PCR based genotyping of targeted colonies, primer set 1 spans the insertion site and only gives a product in the absence of targeting, primer set 2 amplifies a product only in the presence of the construct at the target site. (E) Typical genotyping result of picked colonies. With primer set 2, 12/15 colonies show successful mono-allelic or bi-allelic targeting. With primer set 1, 6/15 lack a PCR product, indicating a loss of the endogenous sequence. In combination colonies 3, 12, 15, 16, 21 and 22 show bi-allelic insertion of the construct. DNA Ladder: 1 Kb Plus DNA Ladder (Invitrogen) (F) Quantification of mono-allelic, bi-allelic and unsuccessfully targeted colonies. (G) ARSB mRNA expression in the selected bi-allelic targeted clones, determined using RNAseq. GE: Gene edited with ARSB cDNA, EV: Gene edited with empty vector control.
To generate a control for the gene targeting procedure that did not change ARSB expression, we deleted the ARSB cDNA from the targeting vector (Figure 2C). hiPSCs were gene edited using either the ARSB cDNA vector (GE) or the empty targeting vector (EV) by co-transfection with an expression vector for human codon-optimized Cas9 nuclease, an expression vector for the guide RNA targeting the AAVS1 locus, and either targeting vector. After selection with G418, colonies were picked and genotyped using two PCR strategies; set 1 yields a product of 749 bp from the untargeted allele and 7,132 bp from the targeted allele. This 7,132 bp product is too large to be detected under the PCR conditions employed. Set 2 only yields a product of 980 bp if the ARSB cDNA is inserted in the targeted site (Figure 2D). A typical result is shown in Figure 2E, where the results of set 1 show that 8 out of 15 colonies still have the endogenous sequence at target site on one or both alleles. The results of set 2 show that 12 out of 15 colonies have the ARSB insertion at the targeted site. From these results we conclude that 6 colonies have both alleles targeted, 6 colonies have 1 allele targeted and 3 colonies have no insertion of the ARSB cDNA at the target site. The gene editing results of all the targeted patient-derived hiPSCs are shown in Figure 2F, with a mono-allelic insertion ranging from 40 to 80% and a bi-allelic insertion ranging from 6 to 40%, depending on the hiPSC line. Quantitative RNA expression analysis showed that ARSB mRNA expression after gene editing was 4-5-fold above the average expression in healthy controls (Figure 2G).
3.3 Differentiation of hiPSC to chondrogenic cells
Gene edited hiPSCs (GE and EV) were differentiated into chondrogenic cells using a novel 14-day differentiation protocol. This protocol uses a chemically defined culture media and matrix-coated substrates, and is based on the sequential activation of signaling pathways that operate during development of cartilage (Figure 3A, Supplementary Table S3). With this modified protocol we achieved successful chondrogenic differentiation in every hiPSC tested (data not shown). Genome-wide mRNA expression analysis was performed using RNA sequencing to compare expression of genes involve in pluripotency and chondrogenic differentiation between hiPSCs and chondrogenic cells. High expression of pluripotency genes was observed in hiPSC cells, while these genes were not expressed at day 14 of differentiation. Conversely, chondrogenic genes were not expressed at the hiPSC stage but were upregulated at day 14 of differentiation (Figure 3B). Key chondrogenic genes that were expressed after 14 days of differentiation included COL2A1, and SOX9. ARSB RNA expression in chondrogenic cells was 2 to 12-fold increased in the GE compared to the EV cells (Figure 3C). Immunostaining showed that SOX9 was expressed with nuclear localization, while thionin staining showed production of extracellular GAGs after differentiation, confirming chondrogenic differentiation (Supplementary Figure S1).
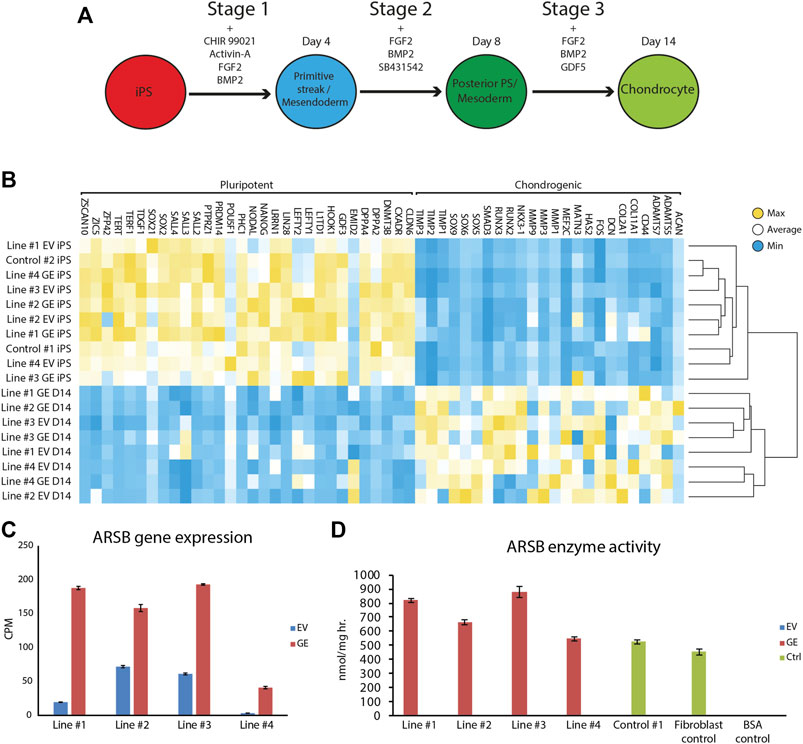
FIGURE 3. Differentiation of hiPSCs into chondrogenic cells. (A) Schematic representation of the refined 14-day differentiation protocol. Different factors are added to the media during the three stages. Cells are passaged at the end of stage 1 and 2 at day 4 and 8, respectively. (B) Expression analysis of pluripotent and chondrogenic genes show a loss of pluripotency and an increase in expression of chondrogenic genes after the chondrogenic differentiation. Expression of POU5F1 was very high in hiPSC Line #3 EV relative to all other hiPSC lines, resulting in a shift of the mean expression value for this gene used to generated the heat map. However, all hiPSC lines showed downregulation of POU5F1 upon differentiation. (C) ARSB gene expression remained high after chondrogenic differentiation (n = 3). (D) Biochemical analysis showed a rescue of ARSB enzyme activity in chondrogenic cells (n = 3). GE: Gene edited with ARSB cDNA, EV: Gene edited with empty vector control. Data are expressed as means ± SE.
3.4 Chondrogenic cells from MPS VI patients accumulate PAS+ material
To assess whether hiPSC-derived chondrogenic cells accumulated carbohydrate macromolecules, we analyzed cytospins of GE and EV gene edited patient-derived cells using periodic acid–Schiff (PAS) staining (Figure 4). In EV cells, PAS-positive extranuclear areas were observed in the form of small to larger dots that in some cases seemed fused (see insets in Figure 4A. These PAS-positive areas were rare or absent in GE cells and in cells from a healthy control (Figure 4A). Quantification of the number of PAS positive cells confirmed this (Figure 4B). We conclude that hiPSC-derived chondrogenic cells generated from MPS VI patients store PAS-reactive material.
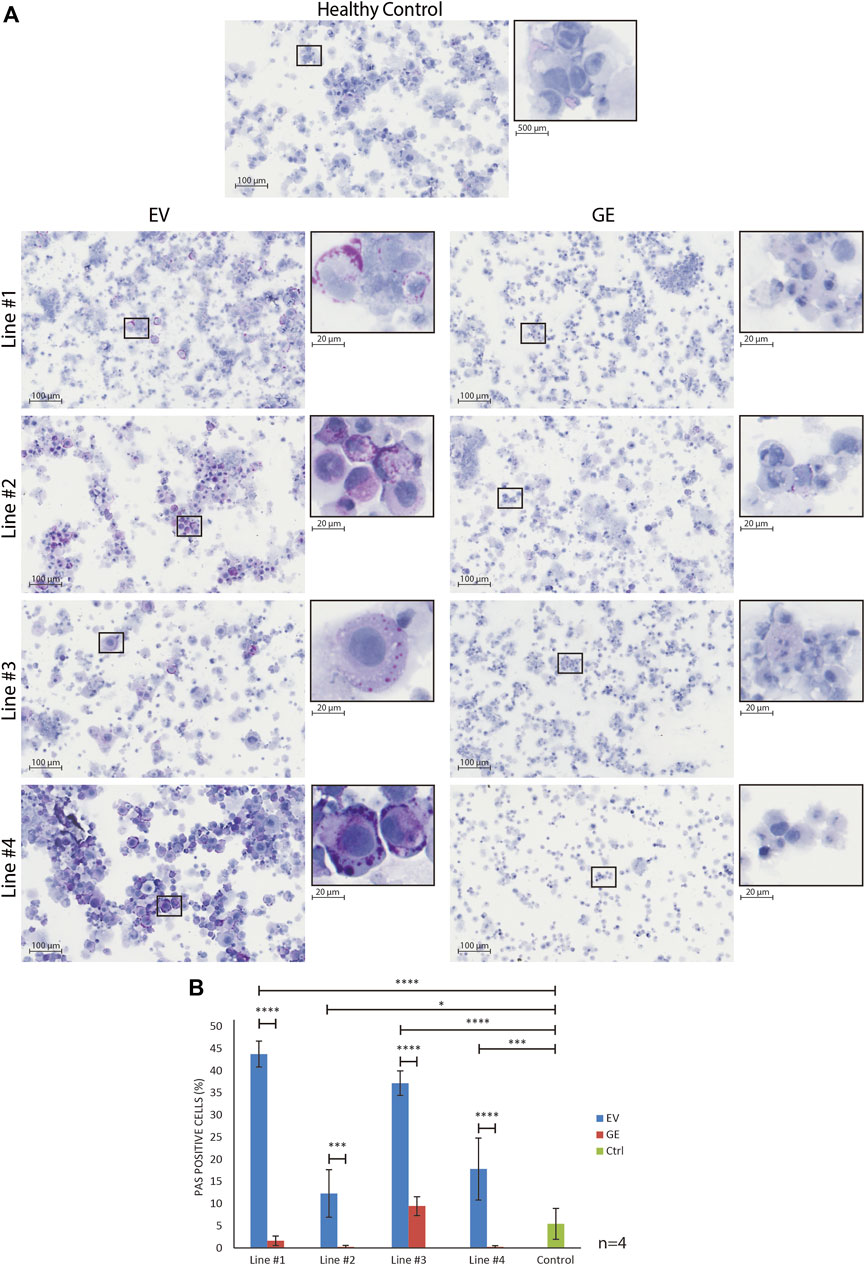
FIGURE 4. Normalization of inclusions after gene correction. (A) periodic acid–Schiff (PAS) staining of day 14 differentiated chondrogenic cells showed the accumulation of inclusions in EV cells, indicated by the increase of purple signal. The insert shows a higher magnification of selected cells to visualize the inclusions. (B) Quantification of PAS positive cells showed the normalization of inclusions after gene correction. Data represent means ± SD of 4 cytospins of independent cultures of chondrogenic cells. GE: Gene edited with ARSB cDNA, EV: Gene edited with empty vector control. Data are expressed as means ± SE. Statistical tests were performed with two-way ANOVA and Šídák multiple comparisons correction, *p ≤ 0.05, ***p ≤ 0.001, ****p ≤ 0.0001.
3.5 Genome-wide mRNA expression analysis of isogenic pairs
RNA sequence analysis was used in an unbiased approach to compare genome-wide changes in mRNA expression between chondrogenic cells from all 4 isogenic pairs. Biological triplicates clustered together (with one exception) and in general the differences between patients were larger than differences caused by gene correction, highlighting the need for isogenic controls (Supplementary Figure S3). This showed a total number of 703 differentially expressed genes when all 4 GE cells were compared to all 4 EV cells based on a fold change (FC) of >1.5, false discovery rate (FDR) of <0.05 and counts per million (CPM) > 0 (Supplementary Figure S4-S5). The subsets of upregulated genes in GE (420) and EV (283) were analyzed for enrichment of gene ontology (GO) terms using PANTHER (pantherdb.org). Analysis of biological processes revealed that 120 biological processes were upregulated in GE and 99 were upregulated in EV cells. The 25 most significant terms are shown for the upregulated genes of both sets in Figure 5A. Five over- or underrepresented biological processes were interesting in the light of cartilage and lysosomal homeostasis: cell growth and apoptosis, bone and cartilage development, Wnt signaling pathway, ion transport and regulation of metabolic processes. Some GO terms appeared high in the list, but upon inspection contained genes that had a function in cartilage (e.g. NOG, BMP6 and IGFBP5 in the category “osteoblast differentiation”) or had general roles (most genes in the category “germ cells/sexual reproduction”). Analysis of GO terms for molecular function showed that 9 groups were upregulated in GE and 12 that were upregulated in EV cells, mainly related to enzyme activity and ion channels (Figure 5B). Analysis of the GO terms for cellular component showed an upregulation of 12 components in GE cells, related to the Golgi apparatus and nuclear membrane, and 16 in EV cells, related to the spindle and vesicles (Figure 5C).
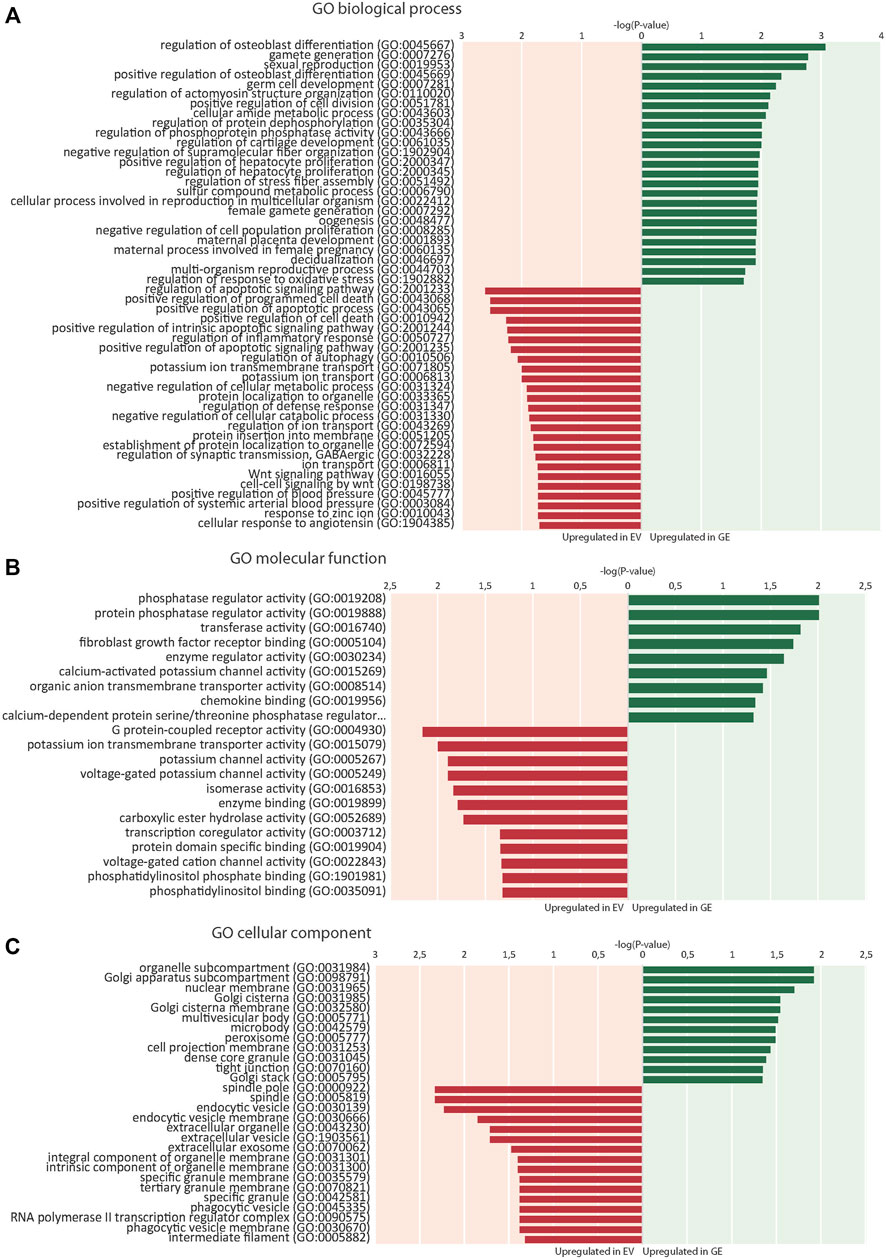
FIGURE 5. Enrichment of gene ontology (GO) terms. (A) 25 top dysregulated GO biological processes in EV and GE cells. (B) Significantly dysregulated GO molecular functions. (C) Significantly dysregulated GO cellular components. Upregulated processes in GE cells are indicated in green. Upregulated processes in EV cells are indicated in red. GE: Gene edited with ARSB cDNA, EV: Gene edited with empty vector control.
3.5.1 Bone and cartilage development
Several key genes involved in bone and cartilage development were differently expressed between GE and EV cells (Figure 6A): 28 genes were upregulated in GE and 6 in EV cells. Fold changes ranged from 1.5 for IGFBP5 to 7,6 for ACAN (Figure 7A). Genes such as TGFB2, BMP6, GDF6, PTN and members of the CCN family CYR61, NOV and CTGF are all involved in the BMP/TGF-β signaling pathway and important in bone and cartilage development (Chang, 2016). CTGF, a BMP-7 inhibitor, was highly expressed in GE cells, and may explain the decreased expression of BMP7 in EV cells. In addition, other proteins involved in extracellular matrix formation such as ACAN, COMP (Acharya et al., 2014; Coustry et al., 2018), FBLN5 (Timpl et al., 2003; de Vega et al., 2009), and SULF1 were upregulated in GE cells. These results suggest a dysregulated development of chondrogenic cells and extracellular matrix formation in MPS VI.
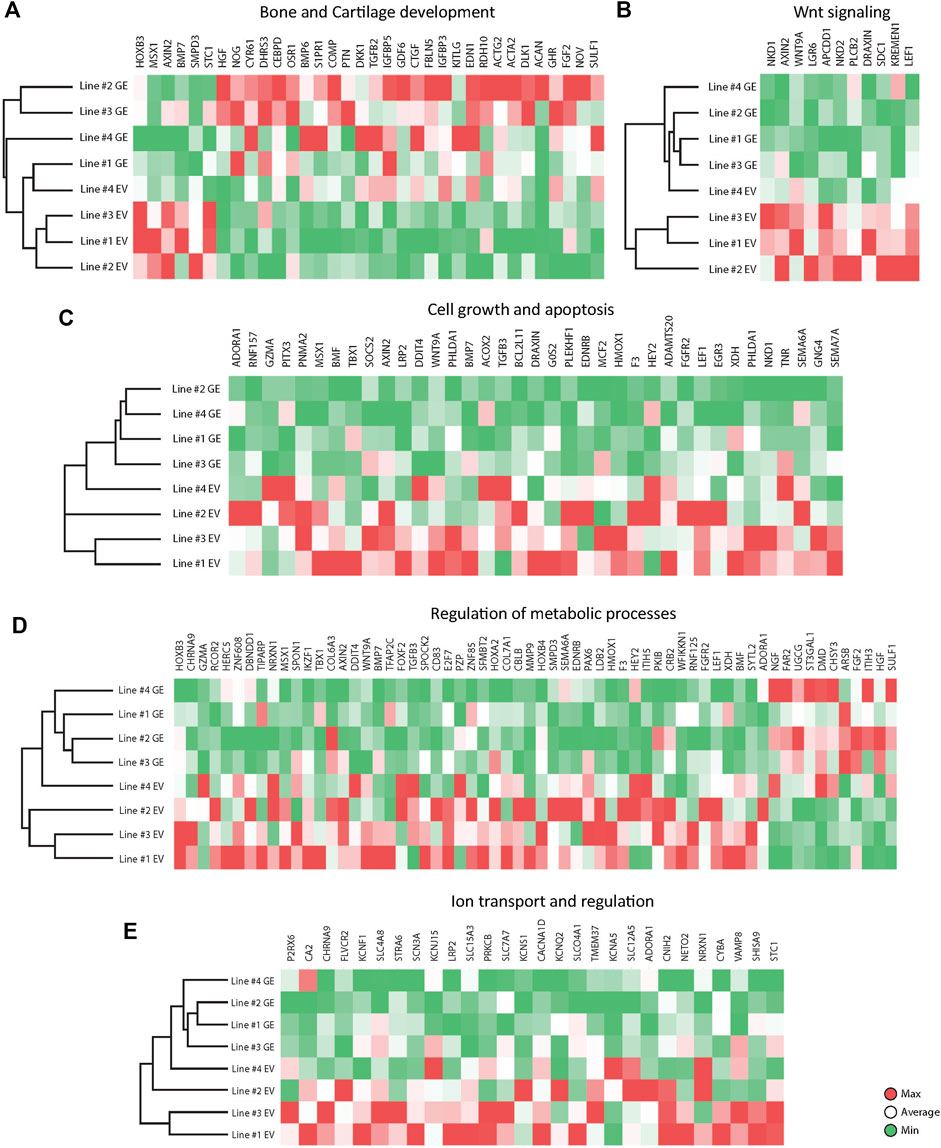
FIGURE 6. Expression analysis of differentially expressed genes between GE and EV. Expression analysis of differentially expressed genes involved in (A) Bone and Cartilage development, (B) WNT signaling, (C) Cell growth and apoptosis, (D) Metabolic processes, (E) Ion transport and regulation. GE: Gene edited with ARSB cDNA, EV: Gene edited with empty vector control.
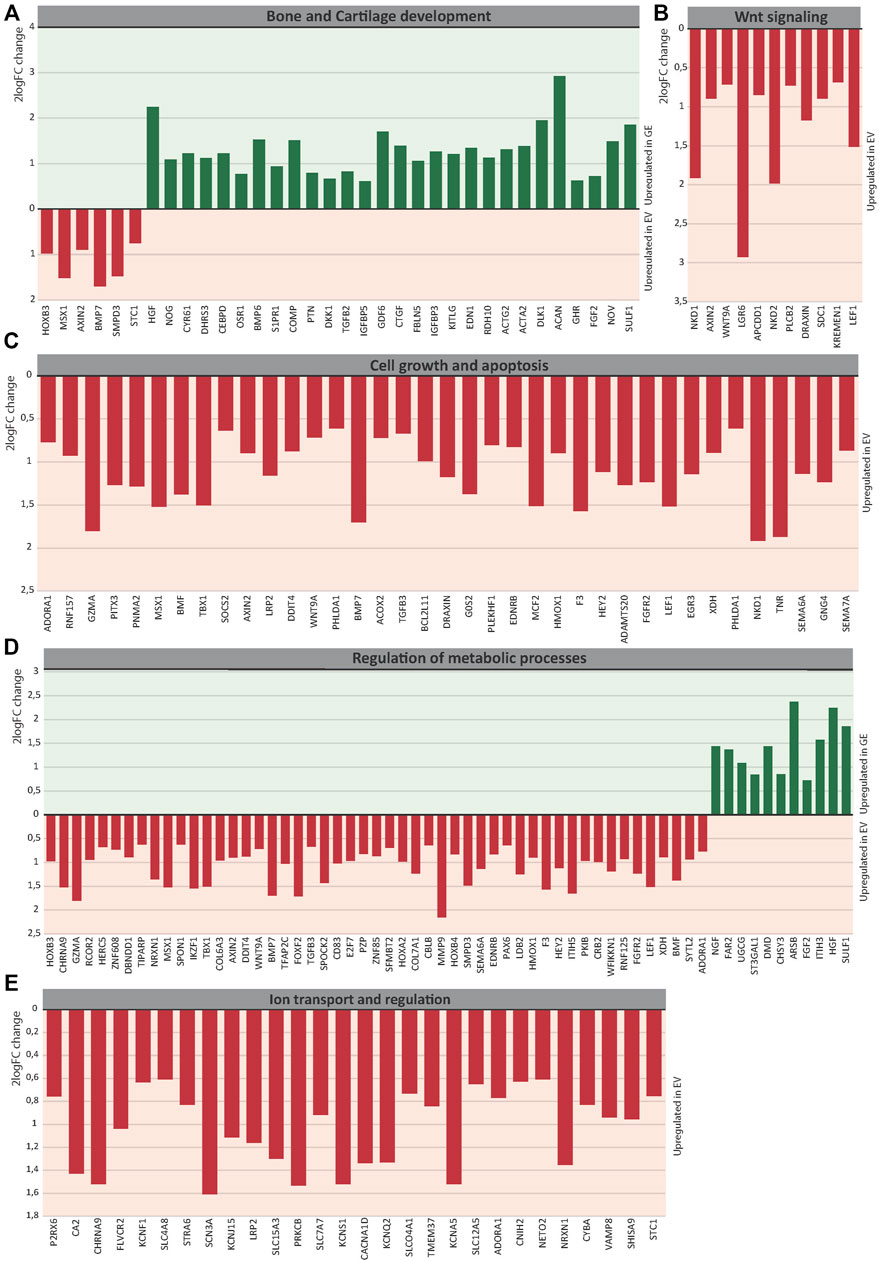
FIGURE 7. The 2logFC of genes involved in (A) Bone and Cartilage development, (B) WNT signaling, (C) Cell growth and apoptosis, (D) Metabolic processes, (E) Ion transport and regulation. GE: Gene edited with ARSB cDNA, EV: Gene edited with empty vector control.
3.5.2 Wnt signaling pathway
GO analysis indicated a dysregulation of the canonical Wnt pathway as several signaling inhibitors such as AXIN2 (Kikuchi, 1999; Jho et al., 2002; Katoh and Katoh, 2007; Larraguibel et al., 2015), NKD1 (Katoh and Katoh, 2007; Angonin and Van Raay, 2013; Larraguibel et al., 2015), NKD2 (Katoh and Katoh, 2007; Zhao et al., 2015), APCDD1 (Shimomura et al., 2010; Cruciat and Niehrs, 2013), DRAXIN (Hutchins and Bronner, 2018), KREMEN1 (Mao et al., 2002; Causeret et al., 2016), WNT9A (Ali et al., 2016) and LEF1 (Steinke and Xue, 2014) were upregulated in EV (Figure 6B). Fold changes ranged from 1,6 for KREMEN1 to 3,9 and 3.7 for NKD2 and NKD1, respectively (Figure 7B). Apart from WNT9A, all other Wnt genes were either too lowly expressed or did not show a fold change above 1.5. WNT2B did show a >1.5-fold change upregulation in GE cells, but this was not significant with an FDR of 0.24 (data not shown). Upregulation of inhibitory genes may either indicate low Wnt levels and inactive β-catenin, or active Wnt signaling as inhibitors can be part of a feedback inhibition following pathway activation. Protein analysis showed an upregulation of active β-catenin in all three tested EV lines when compared to a healthy control (Supplementary Figure S6), which was normalized in line #4 after gene correction. These data suggest that the upregulation of Wnt inhibitors in MPS VI cells reflects a feedback inhibition mechanism following activation of the Wnt pathway.
3.5.3 Cell growth and apoptosis
GO analysis further indicated a dysregulation of cell growth and apoptosis in EV cells: 37 genes associated with negative regulation of cell growth and positive regulation of apoptosis were upregulated in EV cells (Figure 6C). Genes upregulated in EV cells that inhibit cell growth and promote apoptosis included: MSX1 (Lallemand et al., 2009; Yue et al., 2018a; Yue et al., 2018b), HMOX1 (Hill et al., 2005), PHLDA1 (Zimnicka et al., 2017), BMP7 (Piscione et al., 2001), EGR3 (Zhang et al., 2017). SEMA6A (Shen et al., 2018), BCL2L11 (Pinon et al., 2008; Koenig et al., 2014), BMF (Pinon et al., 2008), and G0S2 (Welch et al., 2009). Fold changes ranged from 1.5 for PHLDA1 to 3.7 for NKD1 (Figure 7C). Protein analysis did not show the presence of cleaved Caspase 3 in any of the lines (Supplementary Figure S7), suggesting that dysregulation of gene expression did not lead to an induction of apoptosis at this stage.
3.5.4 Metabolic processes
The category metabolic processes contained 52 genes that were upregulated in EV cells and 11 that were upregulated in GE cells (Figure 6D). Fold changes ranged from 1.5 for TIPARP to 5.1 for ARSB itself (Figure 7D). Although most genes found in the analysis are factors indirectly involved in metabolic processes, several genes upregulated in EV cells are of particular interest. These include genes linked to the ECM such as SPOCK2, MMP9, ITIH5 and the collagens COL6A3 and COL7A1. Several genes related to GAG metabolism were upregulated in GE cells, including SULF1, ITIH3, CHSY3, involved in synthesis of CS, and ST3GAL1, involved in the synthesis of gangliosides including GM2 and GM3. Two E3 ubiquitin ligases, RNF125 and CBLB, were upregulated in EV cells and are involved in proteasome-mediated protein degradation. Other genes upregulated in EV cells included HEY2, SMPD3 and XDH. HEY2 represses transcription by interaction with a histone deacetylase complex and is induced by the Notch signaling pathway (Weber et al., 2014). SMPD3 catalyzes sphingomyelin hydrolysis. XDH catalyzes oxidative metabolism of purines. Other genes of interest upregulated in GE cells include UGCG and FAR2, involved in biosynthesis of glycosphingolipids and reduction of saturated fatty acids to fatty alcohols, respectively. These results indicate that ARSB deficiency may indirectly deregulate other metabolic processes besides GAG degradation.
3.5.5 Ion transport
GO analysis showed upregulation of 28 genes in EV cells that are involved in ion transport or regulation of ion transport (Figure 6E). Fold changes ranged from 1.5 for SLC4A8 to 3 for SCN3A (Figure 7E). In addition, GO terms for molecular function analysis indicated the upregulation of potassium ion channel activity in EV cells (Figure 5B). Calcium-activated potassium channel activity was found to be upregulated in GE cells based on the molecular function analysis.
4 Discussion
In this study, we have generated a patient-derived in vitro disease model for MPS VI with isogenic controls, and used this to obtain insight in early stages of pathology in chondrogenic cells. We have applied this model to four patients and characterized cell biological and gene expression changes. This confirmed clinical information and previous reports using animal models, and provided novel insight in the early molecular changes in chondrocytes that are associated with MPS VI.
We used PAS to assess whether chondrocytes accumulated glycoprotein macromolecules. PAS positive vesicles were detected at day 14 of differentiation in disease chondrogenic cells relative to their isogenic controls. At present, the identity of the PAS positive material is unknown. We used a short protocol for PAS staining of cytospins that is unlikely capable of detecting charged GAGs such as DS and CS. Additional analysis using red oil staining ruled out that these were lipid droplets (Supplementary Figure S8). We hypothesize that they might represent secondary storage products, possibly GM2 or GM3, which are known to accumulate in MPS VI (Ballabio and Gieselmann, 2009). This would be compatible with the increased expression of ST3GAL1 in MPS VI chondrocytes, as discussed below. Interestingly, the EM analysis of a cartilage biopsy from an MPS VI patient (see Figure 1) showed very heterogeneous shapes and forms of vesicles, suggesting that they might contain a mixture of storage products, which should be confirmed in future experiments. The fact that PAS positive material was already detected at day 14 of chondrogenic differentiation suggests that chondrogenic cells have an early onset pathology, which is in line with clinical information on hip abnormalities in MPS VI that likely develop before the age of 1 year (Oussoren et al., 2011; Oussoren et al., 2017).
Early disease onset in chondrogenic cells was also suggested by RNAseq analysis. Although gene expression of line #4 EV is closer to the transcriptional signature of GE cells than other EV lines, it was clearly distinct when compared to its isogenic gene edited counterpart. This highlights the power of using isogenic controls to correct for differences between individual cell lines. Key genes in bone and cartilage development were differentially expressed between EV and GE cells. Notably, genes involved in the TGF-β/BMP signaling, which plays a fundamental role in cartilage homeostasis, were downregulated in EV cells, including BMP6 and GDF6 (see also supplemental text). The TGF-β/BMP signaling pathway is known to be influenced by GAGs, but it is not fully understood how GAG accumulation in MPS influences its activity (Oussoren et al., 2011). Heparan sulfate containing proteoglycans (HSPG) can modulate BMPs and their antagonists (Khan et al., 2008) and chondroitin sulfate is linked to BMPs and TGF-β activity and intracellular localization (Kluppel et al., 2005; Alliston, 2010). TGF-β2 is one of the members of the TGF-β superfamily and was downregulated in EV cells. Downregulated members of the BMP family in EV cells included BMP6 and GDF6 (Chang, 2016; Xu et al., 2018; Tan Timur et al., 2019). BMP6 stimulates differentiation of MSCs into chondrocytes and promotes the synthesis of chondrocytes (Rahman et al., 2015; Thielen et al., 2019; Ye et al., 2019). In addition, BMP6 induces proteoglycan synthesis, which is particularly interesting in the context of the GAG accumulation in MPS VI (Bobacz et al., 2003; Chubinskaya et al., 2008; Thielen et al., 2019). GDF6 is a member of the BMP family and a regulatory protein associated with the growth and differentiation of cartilaginous tissue (Wei et al., 2016). PTN is a TGF-β dependent heparin-binding growth-associated molecule and downregulated in EV cells, it is involved in a variety of processes in bone formation and stimulates chondrocyte proliferation (Tare et al., 2002; Pufe et al., 2007). The CCN family members CYR61, NOV and CTGF were upregulated in GE cells and are known to induce the expression of chondrogenic markers and to regulate TGF-β and BMP (Abreu et al., 2002; Holbourn et al., 2008; Nguyen et al., 2008; Maeda et al., 2009). CYR61 is a direct target of canonical Wnt/beta-catenin signaling and is involved in osteogenic differentiation and bone healing (Si et al., 2006). NOV is involved in the maintenance of articular cartilage and may inhibit osteoarthritis (Janune et al., 2017; Huang et al., 2019). CTGF is involved in the regulation of chondrogenesis and is a BMP-7 inhibitor, possibly mediating the downregulation of BMP7 in GE cells (Abreu et al., 2002; Nguyen et al., 2008; Maeda et al., 2009). COMP was downregulated in EV and encodes an extracellular matrix protein which plays an important role in cartilage matrix organization through interaction with other extracellular matrix proteins (Acharya et al., 2014; Coustry et al., 2018; Maly et al., 2021). Disease-associated variants in COMP cause impaired cartilage development leading to skeletal abnormalities such as short stature and skeletal dysplasias (Briggs et al., 1995; Hecht et al., 1995; McKeand et al., 1996; Hecht et al., 1998; Unger and Hecht, 2001; Hecht et al., 2005; Posey and Hecht, 2008). These results suggest that the accumulation of intralysosomal GAGs in MPS VI impairs early chondrogenic development by interfering with TGF-β/BMP signaling.
Several Wnt inhibitors of the Wnt/β-catenin signaling pathway were upregulated in EV cells including AXIN2, NKD1, NKD2, APCDD1, DRAXIN, KREMEN1, WNT9A and LEF1. AXIN2 is a scaffold protein of the β-catenin destruction complex and promotes phosphorylation of β-catenin and its consequent degradation. NKD1 and NKD2 interact with AXIN2 to inhibit β-catenin in the canonical Wnt signaling pathway (Miller et al., 2009). APCDD1 can co-precipitate with Wnt3A and LRP5 and likely inhibits Wnt/β-catenin signaling by preventing formation of the Wnt receptor complex (Shimomura et al., 2010). The zebrafish homologue of DRAXIN, Neucrin, has been suggested to inhibit the stabilization of β-catenin during canonical Wnt signalling (Miyake et al., 2009). KREMEN1 is a transmembrane protein that acts as a receptor for Dickkopf-1 with which it functionally cooperates to inhibit the Wnt/β-catenin signaling. WNT9A has been suggested as a non-canonical ligand to inhibit β-catenin (Ali et al., 2016). LEF1 is a key target in the Wnt signaling pathway and can negatively regulate the expression of Wnt signaling genes by binding to Groucho-related corepressors (Steinke and Xue, 2014). This upregulation of Wnt inhibitors and the upregulation of active β-catenin on protein level, suggests that the Wnt signaling pathway is dysregulated in chondrogenic cells with MPS VI. Interestingly, a link between GAGs and Wnt signaling has been made previously: biglycan, a protein core with two CS or DS GAG chains, affects the Wnt signaling pathway through a direct interaction of the core protein with the LRP6 receptor and its Wnt ligand (Berendsen et al., 2011). The Wnt signaling pathway plays a crucial role in bone and cartilage development (Narcisi et al., 2015; Kobayashi et al., 2016; Usami et al., 2016), and downregulation of Wnt2 and beta-catenin can inhibit cell proliferation and induce apoptosis (You et al., 2004; Pu et al., 2009; Zimmerman et al., 2013), suggesting that chondrogenic cells with MPS VI undergo impaired chondrogenic development and reduced cell proliferation via intereference with Wnt signalling.
Evidence for increased apoptotic stimuli and decreased cell growth in MPS VI was obtained by upregulation of 37 genes associated with these processes in EV cells. These included MSX1, HMOX1, PHLDA1, BMP7, EGR3, SEMA6A, BCL2L11, BMF and G0S2. MSX1 has been shown to inhibit cell growth and induce apoptosis by inhibiting the Notch signaling pathway and maintaining cyclin D1 expression (Hu et al., 2001; Lallemand et al., 2009; Yue et al., 2018a; Yue et al., 2018b). Upregulation of PHLDA1 expression leads to reduced cell growth and increased apoptosis (Neef et al., 2002; Nagai, 2016; Zimnicka et al., 2017). BMP7 contributes to cell cycle arrest at the G1/S checkpoint and stimulates apoptosis via Smad1-dependent and Smad1-independent pathways (Piscione et al., 2001; Klose et al., 2011). SEMA6A induces apoptosis via the cytosolic region of the SEMA domain through association with Fas-associated protein with death domain (FADD) (Shen et al., 2018). EGR3 inhibits cell proliferation and induces apoptosis via upregulation of Fas ligand (Zhang et al., 2017). BCL2L11, also known as BIM, BMF and G0S2 interact together to promote apoptosis (Ramjaun et al., 2007). Increased apoptotic stimuli in MPS VI chondrocytes is likely due to the GAG accumulation, which is consistent with findings from Simonaro et al. (Simonaro et al., 2008) who showed that GAG accumulation leads to apoptosis of articular chondrocytes. However, in this case chondrocyte apoptosis was due to the activation of the TLR-4 signaling pathway followed by the release of proinflammatory cytokines. In contrast, we showed increased apoptotic stimuli in the absence of proinflammatory cytokines, suggesting the existence of an intrinsic non-inflammatory mechanism.
Interestingly, several genes linked to GAG metabolism were dysregulated in EV cells. SPOCK2, MMP9 and ITIH5 were upregulated and SULF1, ITIH3, CHSY3 and ST3GAL1 were downregulated compared to GE cells. SPOCK2 encodes the protein Testican-2, a proteoglycan that binds to glycosaminoglycans and forms part of the extracellular matrix. MMP9 encodes an enzyme belonging to the matrix metalloproteinase family with substrates including aggrecan and collagen and non-ECM substrates such TGF-β1 (Ma et al., 2015). ITIH5 is involved in extracellular matrix stabilization. SULF1 encodes a heparan sulfate endosulfatase which removes sulfate groups from chains of heparan sulfate proteoglycans. ITIH3 encodes a subunit of the pre-alpha-trypsin inhibitor complex which binds to bind hyaluronic acid and stabilizes the extracellular matrix. CHSY3, also known as CSS3 or chondroitin sulfate synthase, is a glycosyltransferase that is involved in transferring GlcUA and GalNAc to the nonreducing terminus of chondroitin sulfate. Its downregulation in MPS VI may indicate a feedback mechanism induced by CS accumulation to reduce the synthesis of CS. ST3GAL1 encodes a sialyltransferase that catalyzes the transfer of sialic acid from cytidine monophosphate-sialic acid to galactose-containing substrates such as GAGs (Wu et al., 2018). It is also involved in the synthesis of GM2 and GM3, known secondary storage products in many lysosomal storage disorders including MPS VI (Ballabio and Gieselmann, 2009). These findings indicate that MPS VI chondrogenic cells have disturbed metabolism of GAGs and other ECM components, including feedback inhibition of CS synthesis and disturbed ganglioside metabolism.
Genes involved in ion transport of calcium and potassium and encoding other ion channels were upregulated in EV cells. Genes involved in potassium transport included KCNF1, KCNJ15, KCNS1, KCNA5, KCNQ2 and SLC12A5. Genes linked to calcium transport include FLVCR2, CACNA1D, TMEM37 and STC1. Other genes upregulated in EV cells included CHRNA9, SCN3A, and P2RX6, a ligand-gated ionic channel, a voltage-gated sodium channels and ATP-gated ion, respectively. Changes in ion channels have been linked previously to osteoarthritic cartilage (Lewis and Barrett-Jolley, 2015; Bertram et al., 2016). In addition, extracellular GAG deposits in tissue causes increased absorption of water which results in inflated tissue (Hampe et al., 2020). The intralysosomal accumulation of GAGs in EV cells might cause osmotic stress as GAGs can retain water up to 100 times up to its weight. The dysregulation of ion channels might be a regulatory mechanism to compensate for the difference in cell osmolarity (Erickson et al., 2001; Erickson et al., 2003; Kurita et al., 2015). In addition, accumulation of GAGs is suggested to compromise the integrity of lysosomal membranes (Hampe et al., 2020), which can lead to a dysregulation of ion content in the lysosome.
In summary, we have generated a disease model for the cartilage pathology in MPS VI based on hiPSCs and isogenic controls using CRISPR/Cas9. This has proven to be a powerful approach to detect the early cellular and molecular changes in chondrogenic cells that ultimately lead to the severe cartilage pathology in MPS VI patients. As the approach is generic, it should be generally applicable to model genetic disorders that affect cartilage. Future work should focus on further development of the model into actual cartilage that is subject to mechanical loading that mimics natural loading of weight bearing joints that occurs in human individuals.
Data availability statement
The data discussed in this publication have been deposited in NCBI’s Gene Expression Omnibus and are accessible through GEO Series accession number GSE218101 (https://www.ncbi.nlm.nih.gov/geo/query/acc.cgi?acc=GSE218101).
Ethics statement
The studies involving human participants were reviewed and approved by Medisch Etische Toetsings Comissie (METC) of the Erasmus MC University Medical Center. Written informed consent to participate in this study was provided by the participants and legal guardian/next of kin.
Author contributions
MB and WP conceived and designed the study and drafted the manuscript. MB and TvG performed the experiments. WP supervised the study. MB, JvR, TvG, CS, SK, EO, MW, JvdH, AvdP, RN, and WP were involved in data interpretation and approved the final manuscript.
Funding
This work has received funding from Zeldzame Ziekten Fonds/WE Foundation, Metakids (project number 2018-082), and Stofwisselkracht. RN is part of the Erasmus Postgraduate School Molecular Medicine and Medical Delta Regenerative Medicine 4D program.
Acknowledgments
We thank Prof. GJVM van Osch (Erasmus MC Medical Center) for discussion.
Conflict of interest
The authors declare that the research was conducted in the absence of any commercial or financial relationships that could be construed as a potential conflict of interest.
Publisher’s note
All claims expressed in this article are solely those of the authors and do not necessarily represent those of their affiliated organizations, or those of the publisher, the editors and the reviewers. Any product that may be evaluated in this article, or claim that may be made by its manufacturer, is not guaranteed or endorsed by the publisher.
Supplementary material
The Supplementary Material for this article can be found online at: https://www.frontiersin.org/articles/10.3389/fbioe.2022.949063/full#supplementary-material
References
Abreu, J. G., Ketpura, N. I., Reversade, B., and De Robertis, E. M. (2002). Connective-tissue growth factor (CTGF) modulates cell signalling by BMP and TGF-β. Nat. Cell Biol. 4 (8), 599–604. doi:10.1038/ncb826
Abreu, S., Hayden, J., Berthold, P., Shapiro, I. M., Decker, S., Patterson, D., et al. (1995). Growth plate pathology in feline mucopolysaccharidosis VI. Calcif. Tissue Int. 57 (3), 185–190. doi:10.1007/BF00310256
Acharya, C., Yik, J. H., Kishore, A., Van Dinh, V., Di Cesare, P. E., and Haudenschild, D. R. (2014). Cartilage oligomeric matrix protein and its binding partners in the cartilage extracellular matrix: Interaction, regulation and role in chondrogenesis. Matrix Biol. 37, 102–111. doi:10.1016/j.matbio.2014.06.001
Ali, I., Medegan, B., and Braun, D. P. (2016). Wnt9A induction linked to suppression of human colorectal cancer cell proliferation. Int. J. Mol. Sci. 17 (4), 495. doi:10.3390/ijms17040495
Alliston, T. (2010). Chondroitin sulfate and growth factor signaling in the skeleton: Possible links to MPS VI. J. Pediatr. Rehabil. Med. 3 (2), 129–138. doi:10.3233/PRM-2010-0117
Angonin, D., and Van Raay, T. J. (2013). Nkd1 functions as a passive antagonist of Wnt signaling. PLoS One 8 (8), e74666. doi:10.1371/journal.pone.0074666
Auclair, D., Hein, L. K., Hopwood, J. J., and Byers, S. (2006). Intra-articular enzyme administration for joint disease in feline mucopolysaccharidosis VI: Enzyme dose and interval. Pediatr. Res. 59 (1), 538–543. doi:10.1203/01.pdr.0000203090.41012.a6
Auclair, D., Hopwood, J. J., Lemontt, J. F., Chen, L., and Byers, S. (2007). Long-term intra-articular administration of recombinant human N-acetylgalactosamine-4-sulfatase in feline mucopolysaccharidosis VI. Mol. Genet. Metab. 91 (4), 352–361. doi:10.1016/j.ymgme.2007.04.009
Ballabio, A., and Gieselmann, V. (2009). Lysosomal disorders: From storage to cellular damage. Biochimica Biophysica Acta - Mol. Cell Res. 1793 (4), 684–696. doi:10.1016/j.bbamcr.2008.12.001
Baum, H., Dodgson, K. S., and Spencer, B. (1959). The assay of arylsulphatases A and B in human urine. Clin. Chim. Acta 4 (3), 453–455. doi:10.1016/0009-8981(59)90119-6
Berendsen, A. D., Fisher, L. W., Kilts, T. M., Owens, R. T., Robey, P. G., Gutkind, J. S., et al. (2011). Modulation of canonical Wnt signaling by the extracellular matrix component biglycan. Proc. Natl. Acad. Sci. U. S. A. 108 (41), 17022–17027. doi:10.1073/pnas.1110629108
Bertram, K. L., Banderali, U., Tailor, P., and Krawetz, R. J. (2016). Ion channel expression and function in normal and osteoarthritic human synovial fluid progenitor cells. Channels (Austin) 10 (2), 148–157. doi:10.1080/19336950.2015.1116652
Bobacz, K., Gruber, R., Soleiman, A., Erlacher, L., Smolen, J. S., and Graninger, W. B. (2003). Expression of bone morphogenetic protein 6 in healthy and osteoarthritic human articular chondrocytes and stimulation of matrix synthesis in vitro. Arthritis Rheum. 48 (9), 2501–2508. doi:10.1002/art.11248
Bolger, A. M., Lohse, M., and Usadel, B. (2014). Trimmomatic: A flexible trimmer for illumina sequence data. Bioinformatics 30 (15), 2114–2120. doi:10.1093/bioinformatics/btu170
Briggs, M. D., Hoffman, S. M., King, L. M., Olsen, A. S., Mohrenweiser, H., Leroy, J. G., et al. (1995). Pseudoachondroplasia and multiple epiphyseal dysplasia due to mutations in the cartilage oligomeric matrix protein gene. Nat. Genet. 10 (3), 330–336. doi:10.1038/ng0795-330
Broeders, M., Herrero-Hernandez, P., Ernst, M. P. T., van der Ploeg, A. T., and Pijnappel, W. (2019). Sharpening the molecular scissors: Advances in gene-editing Technology. iScience 23 (1), 100789. doi:10.1016/j.isci.2019.100789
Broeders, M., Smits, K., Goynuk, B., Oussoren, E., van den Hout, H. J. M. P., Bergsma, A. J., et al. (2020). A generic assay to detect aberrant ARSB splicing and mRNA degradation for the molecular diagnosis of MPS VI. Mol. Ther. - Methods & Clin. Dev. 19, 174–185. doi:10.1016/j.omtm.2020.09.004
Causeret, F., Sumia, I., and Pierani, A. (2016). Kremen1 and Dickkopf1 control cell survival in a Wnt-independent manner. Cell Death Differ. 23 (2), 323–332. doi:10.1038/cdd.2015.100
Chang, C. (2016). Agonists and antagonists of TGF-beta family ligands. Cold Spring Harb. Perspect. Biol. 8 (8), a021923. doi:10.1101/cshperspect.a021923
Chubinskaya, S., Segalite, D., Pikovsky, D., Hakimiyan, A. A., and Rueger, D. C. (2008). Effects induced by BMPS in cultures of human articular chondrocytes: Comparative studies. Growth factors. 26 (5), 275–283. doi:10.1080/08977190802291733
Coustry, F., Posey, K. L., Maerz, T., Baker, K., Abraham, A. M., Ambrose, C. G., et al. (2018). Mutant cartilage oligomeric matrix protein (COMP) compromises bone integrity, joint function and the balance between adipogenesis and osteogenesis. Matrix Biol. 67, 75–89. doi:10.1016/j.matbio.2017.12.014
Cruciat, C. M., and Niehrs, C. (2013). Secreted and transmembrane wnt inhibitors and activators. Cold Spring Harb. Perspect. Biol. 5 (3), a015081. doi:10.1101/cshperspect.a015081
de Vega, S., Iwamoto, T., and Yamada, Y. (2009). Fibulins: Multiple roles in matrix structures and tissue functions. Cell. Mol. Life Sci. 66 (11-12), 1890–1902. doi:10.1007/s00018-009-8632-6
Dobin, A., Davis, C. A., Schlesinger, F., Drenkow, J., Zaleski, C., Jha, S., et al. (2013). Star: Ultrafast universal RNA-seq aligner. Bioinformatics 29 (1), 15–21. doi:10.1093/bioinformatics/bts635
Erickson, G. R., Alexopoulos, L. G., and Guilak, F. (2001). Hyper-osmotic stress induces volume change and calcium transients in chondrocytes by transmembrane, phospholipid, and G-protein pathways. J. Biomech. 34 (12), 1527–1535. doi:10.1016/s0021-9290(01)00156-7
Erickson, G. R., Northrup, D. L., and Guilak, F. (2003). Hypo-osmotic stress induces calcium-dependent actin reorganization in articular chondrocytes. Osteoarthr. Cartil. 11 (3), 187–197. doi:10.1053/s1063-4584(02)00347-3
Ernst, M. P. T., Broeders, M., Herrero-Hernandez, P., Oussoren, E., van der Ploeg, A. T., and Pijnappel, W. (2020). Ready for repair? Gene editing enters the clinic for the treatment of human disease. Mol. Ther. - Methods & Clin. Dev. 18, 532–557. doi:10.1016/j.omtm.2020.06.022
Evers, M., Saftig, P., Schmidt, P., Hafner, A., McLoghlin, D. B., Schmahl, W., et al. (1996). Targeted disruption of the arylsulfatase B gene results in mice resembling the phenotype of mucopolysaccharidosis VI. Proc. Natl. Acad. Sci. U. S. A. 93 (16), 8214–8219. doi:10.1073/pnas.93.16.8214
Hampe, C. S., Eisengart, J. B., Lund, T. C., Orchard, P. J., Swietlicka, M., Wesley, J., et al. (2020). Mucopolysaccharidosis type I: A review of the natural history and molecular pathology. Cells 9 (8), 1838. doi:10.3390/cells9081838
Harrow, J., Frankish, A., Gonzalez, J. M., Tapanari, E., Diekhans, M., Kokocinski, F., et al. (2012). Gencode: The reference human genome annotation for the ENCODE project. Genome Res. 22 (9), 1760–1774. doi:10.1101/gr.135350.111
Haskins, M. E., Aguirre, G. D., Jezyk, P. F., and Patterson, D. F. (1980). The pathology of the feline model of mucopolysaccharidosis VI. Am. J. Pathol. 101 (3), 657–674.
Hecht, J. T., Deere, M., Putnam, E., Cole, W., Vertel, B., Chen, H., et al. (1998). Characterization of cartilage oligomeric matrix protein (COMP) in human normal and pseudochondroplasia musculoskeletal tissues. Matrix Biol. 17 (4), 269–278. doi:10.1016/s0945-053x(98)90080-4
Hecht, J. T., Hayes, E., Haynes, R., and Cole, W. G. (2005). COMP mutations, chondrocyte function and cartilage matrix. Matrix Biol. 23 (8), 525–533. doi:10.1016/j.matbio.2004.09.006
Hecht, J. T., Nelson, L. D., Crowder, E., Wang, Y., Elder, F. F., Harrison, W. R., et al. (1995). Mutations in exon 17B of cartilage oligomeric matrix protein (COMP) cause pseudoachondroplasia. Nat. Genet. 10 (3), 325–329. doi:10.1038/ng0795-325
Hill, M., Pereira, V., Chauveau, C., Zagani, R., Remy, S., Tesson, L., et al. (2005). Heme oxygenase-1 inhibits rat and human breast cancer cell proliferation: Mutual cross inhibition with indoleamine 2, 3-dioxygenase. FASEB J. 19 (14), 1957–1968. doi:10.1096/fj.05-3875com
Hockemeyer, D., and Jaenisch, R. (2016). Induced pluripotent stem cells meet genome editing. Cell Stem Cell 18 (5), 573–586. doi:10.1016/j.stem.2016.04.013
Holbourn, K. P., Acharya, K. R., and Perbal, B. (2008). The CCN family of proteins: Structure-function relationships. Trends biochem. Sci. 33 (10), 461–473. doi:10.1016/j.tibs.2008.07.006
Hu, G., Lee, H., Price, S. M., Shen, M. M., and Abate-Shen, C. (2001). Msx homeobox genes inhibit differentiation through upregulation of cyclin D1. Development 128 (12), 2373–2384. doi:10.1242/dev.128.12.2373
Huang, X., Ni, B., Mao, Z., Xi, Y., Chu, X., Zhang, R., et al. (2019). NOV/CCN3 induces cartilage protection by inhibiting PI3K/AKT/mTOR pathway. J. Cell. Mol. Med. 23 (11), 7525–7534. doi:10.1111/jcmm.14621
Hutchins, E. J., and Bronner, M. E. (2018). Draxin acts as a molecular rheostat of canonical Wnt signaling to control cranial neural crest EMT. J. Cell Biol. 217 (10), 3683–3697. doi:10.1083/jcb.201709149
in ’t Groen, S. L. M., Broeders, M., and Pijnappel, W. W. M. P. (2021). “CRISPR-Cas9-Mediated gene editing in human induced pluripotent stem cells,” in CRISPR-cas methods: Volume 2. Editors M. T. Islam, and K. A. Molla (New York, NY: Springer US), 235–264.
Janune, D., Abd El Kader, T., Aoyama, E., Nishida, T., Tabata, Y., Kubota, S., et al. (2017). Novel role of CCN3 that maintains the differentiated phenotype of articular cartilage. J. Bone Min. Metab. 35 (6), 582–597. doi:10.1007/s00774-016-0793-4
Jho, E. H., Zhang, T., Domon, C., Joo, C. K., Freund, J. N., and Costantini, F. (2002). Wnt/β-Catenin/Tcf signaling induces the transcription of Axin2, a negative regulator of the signaling pathway. Mol. Cell. Biol. 22 (4), 1172–1183. doi:10.1128/mcb.22.4.1172-1183
Jiang, Z., Derrick-Roberts, A. L. K., Reichstein, C., and Byers, S. (2020). Cell cycle progression is disrupted in murine MPS VII growth plate leading to reduced chondrocyte proliferation and transition to hypertrophy. Bone 132, 115195. doi:10.1016/j.bone.2019.115195
Katoh, M., and Katoh, M. (2007). WNT signaling pathway and stem cell signaling network. Clin. Cancer Res. 13 (14), 4042–4045. doi:10.1158/1078-0432.CCR-06-2316
Khan, S. A., Nelson, M. S., Pan, C., Gaffney, P. M., and Gupta, P. (2008). Endogenous heparan sulfate and heparin modulate bone morphogenetic protein-4 signaling and activity. Am. J. Physiology-Cell Physiology 294 (6), C1387–C1397. doi:10.1152/ajpcell.00346.2007
Kikuchi, A. (1999). Roles of axin in the wnt signalling pathway. Cell. Signal. 11 (11), 777–788. doi:10.1016/s0898-6568(99)00054-6
Klose, A., Waerzeggers, Y., Monfared, P., Vukicevic, S., Kaijzel, E. L., Winkeler, A., et al. (2011). Imaging bone morphogenetic protein 7 induced cell cycle arrest in experimental gliomas. Neoplasia 13 (3), 276–IN22. doi:10.1593/neo.101540
Kluppel, M., Wight, T. N., Chan, C., Hinek, A., and Wrana, J. L. (2005). Maintenance of chondroitin sulfation balance by chondroitin-4-sulfotransferase 1 is required for chondrocyte development and growth factor signaling during cartilage morphogenesis. Development 132 (17), 3989–4003. doi:10.1242/dev.01948
Kobayashi, Y., Uehara, S., Udagawa, N., and Takahashi, N. (2016). Regulation of bone metabolism by Wnt signals. J. Biochem. 159 (4), 387–392. doi:10.1093/jb/mvv124
Koenig, M. N., Naik, E., Rohrbeck, L., Herold, M. J., Trounson, E., Bouillet, P., et al. (2014). Pro-apoptotic BIM is an essential initiator of physiological endothelial cell death independent of regulation by FOXO3. Cell Death Differ. 21 (11), 1687–1695. doi:10.1038/cdd.2014.90
Kolf, C. M., Cho, E., and Tuan, R. S. (2007). Mesenchymal stromal cells. Biology of adult mesenchymal stem cells: Regulation of niche, self-renewal and differentiation. Arthritis Res. Ther. 9 (1), 204. doi:10.1186/ar2116
Kurita, T., Yamamura, H., Suzuki, Y., Giles, W. R., and Imaizumi, Y. (2015). The ClC-7 chloride channel is downregulated by hypoosmotic stress in human chondrocytes. Mol. Pharmacol. 88 (1), 113–120. doi:10.1124/mol.115.098160
Lallemand, Y., Bensoussan, V., Cloment, C. S., and Robert, B. (2009). Msx genes are important apoptosis effectors downstream of the Shh/Gli3 pathway in the limb. Dev. Biol. 331 (2), 189–198. doi:10.1016/j.ydbio.2009.04.038
Larraguibel, J., Weiss, A. R., Pasula, D. J., Dhaliwal, R. S., Kondra, R., and Van Raay, T. J. (2015). Wnt ligand-dependent activation of the negative feedback regulator Nkd1. Mol. Biol. Cell 26 (12), 2375–2384. doi:10.1091/mbc.E14-12-1648
Lewis, R., and Barrett-Jolley, R. (2015). Changes in membrane receptors and ion channels as potential biomarkers for osteoarthritis. Front. Physiol. 6, 357. doi:10.3389/fphys.2015.00357
Liao, Y., Smyth, G. K., and Shi, W. (2014). featureCounts: an efficient general purpose program for assigning sequence reads to genomic features. Bioinformatics 30 (7), 923–930. doi:10.1093/bioinformatics/btt656
Ma, Y., Iyer, R. P., de Castro Brás, L. E., Toba, H., Yabluchanskiy, A., Deleon-Pennell, K. Y., et al. (2015). “Chapter 4 - cross talk between inflammation and extracellular matrix following myocardial infarction,” in Inflammation in heart failure. Editors W. M. Blankesteijn, and R. Altara (Boston: Academic Press), 67–79.
Maeda, A., Nishida, T., Aoyama, E., Kubota, S., Lyons, K. M., Kuboki, T., et al. (2009). CCN family 2/connective tissue growth factor modulates BMP signalling as a signal conductor, which action regulates the proliferation and differentiation of chondrocytes. J. Biochem. 145 (2), 207–216. doi:10.1093/jb/mvn159
Maly, K., Andres Sastre, E., Farrell, E., Meurer, A., and Zaucke, F. (2021). COMP and TSP-4: Functional roles in articular cartilage and relevance in osteoarthritis. Int. J. Mol. Sci. 22 (5), 2242. doi:10.3390/ijms22052242
Mao, B., Wu, W., Davidson, G., Marhold, J., Li, M., Mechler, B. M., et al. (2002). Kremen proteins are Dickkopf receptors that regulate Wnt/β-catenin signalling. Nature 417 (6889), 664–667. [pii]. doi:10.1038/nature756
McKeand, J., Rotta, J., and Hecht, J. T. (1996). Natural history study of pseudoachondroplasia. Am. J. Med. Genet. 63 (2), 406–410. doi:10.1002/(sici)1096-8628(19960517)63:2<406::aid-ajmg16>3.0.co;2-o
Mi, H., Muruganujan, A., Huang, X., Ebert, D., Mills, C., Guo, X., et al. (2019). Protocol Update for large-scale genome and gene function analysis with the PANTHER classification system (v.14.0). Nat. Protoc. 14 (3), 703–721. doi:10.1038/s41596-019-0128-8
Miller, B. W., Lau, G., Grouios, C., Mollica, E., Barrios-Rodiles, M., Liu, Y., et al. (2009). Application of an integrated physical and functional screening approach to identify inhibitors of the Wnt pathway. Mol. Syst. Biol. 5, 315. doi:10.1038/msb.2009.72
Miyake, A., Takahashi, Y., Miwa, H., Shimada, A., Konishi, M., and Itoh, N. (2009). Neucrin is a novel neural-specific secreted antagonist to canonical Wnt signaling. Biochem. Biophys. Res. Commun. 390 (3), 1051–1055. doi:10.1016/j.bbrc.2009.10.113
Nagai, M. A. (2016). Pleckstrin homology-like domain, family A, member 1 (PHLDA1) and cancer. Biomed. Rep. 4 (3), 275–281. doi:10.3892/br.2016.580
Narcisi, R., Cleary, M. A., Brama, P. A., Hoogduijn, M. J., Tuysuz, N., ten Berge, D., et al. (2015). Long-term expansion, enhanced chondrogenic potential, and suppression of endochondral ossification of adult human MSCs via WNT signaling modulation. Stem Cell Rep. 4 (3), 459–472. doi:10.1016/j.stemcr.2015.01.017
Neef, R., Kuske, M. A., Prols, E., and Johnson, J. P. (2002). Identification of the human PHLDA1/TDAG51 gene: Down-regulation in metastatic melanoma contributes to apoptosis resistance and growth deregulation. Cancer Res. 62 (20), 5920–5929.
Nguyen, T. Q., Roestenberg, P., van Nieuwenhoven, F. A., Bovenschen, N., Li, Z., Xu, L., et al. (2008). CTGF inhibits BMP-7 signaling in diabetic nephropathy. J. Am. Soc. Nephrol. 19 (11), 2098–2107. doi:10.1681/asn.2007111261
Oldershaw, R. A., Baxter, M. A., Lowe, E. T., Bates, N., Grady, L. M., Soncin, F., et al. (2010). Directed differentiation of human embryonic stem cells toward chondrocytes. Nat. Biotechnol. 28 (11), 1187–1194. doi:10.1038/nbt.1683
Oussoren, E., Bessems, J., Pollet, V., van der Meijden, J. C., van der Giessen, L. J., Plug, I., et al. (2017). A long term follow-up study of the development of hip disease in Mucopolysaccharidosis type VI. Mol. Genet. Metab. 121 (3), 241–251. doi:10.1016/j.ymgme.2017.05.008
Oussoren, E., Brands, M. M., Ruijter, G. J., der Ploeg, A. T., and Reuser, A. J. (2011). Bone, joint and tooth development in mucopolysaccharidoses: Relevance to therapeutic options. Biochimica Biophysica Acta - Mol. Basis Dis. 1812 (11), 1542–1556. doi:10.1016/j.bbadis.2011.07.013
Oussoren, E., Wagenmakers, M., Link, B., van der Meijden, J. C., Pijnappel, W., Ruijter, G. J. G., et al. (2021). Hip disease in mucopolysaccharidoses and mucolipidoses: A review of mechanisms, interventions and future perspectives. Bone 143, 115729. doi:10.1016/j.bone.2020.115729
Pinon, J. D., Labi, V., Egle, A., and Villunger, A. (2008). Bim and Bmf in tissue homeostasis and malignant disease. Oncogene 27 (1), S41–S52. doi:10.1038/onc.2009.42
Piscione, T. D., Phan, T., and Rosenblum, N. D. (2001). BMP7 controls collecting tubule cell proliferation and apoptosis via Smad1-dependent and -independent pathways. Am. J. Physiology-Renal Physiology 280 (1), F19–F33. doi:10.1152/ajprenal.2001.280.1.F19
Posey, K. L., and Hecht, J. T. (2008). The role of cartilage oligomeric matrix protein (COMP) in skeletal disease. Curr. Drug Targets 9 (10), 869–877. doi:10.2174/138945008785909293
Pu, P., Zhang, Z., Kang, C., Jiang, R., Jia, Z., Wang, G., et al. (2009). Downregulation of Wnt2 and beta-catenin by siRNA suppresses malignant glioma cell growth. Cancer Gene Ther. 16 (4), 351–361. doi:10.1038/cgt.2008.78
Pufe, T., Groth, G., Goldring, M. B., Tillmann, B., and Mentlein, R. (2007). Effects of pleiotrophin, a heparin-binding growth factor, on human primary and immortalized chondrocytes. Osteoarthr. Cartil. 15 (2), 155–162. doi:10.1016/j.joca.2006.07.005
Rahman, M. S., Akhtar, N., Jamil, H. M., Banik, R. S., and Asaduzzaman, S. M. (2015). TGF-β/BMP signaling and other molecular events: Regulation of osteoblastogenesis and bone formation. Bone Res. 3, 15005. doi:10.1038/boneres.2015.5
Ramjaun, A. R., Tomlinson, S., Eddaoudi, A., and Downward, J. (2007). Upregulation of two BH3-only proteins, Bmf and Bim, during TGF beta-induced apoptosis. Oncogene 26 (7), 970–981. doi:10.1038/sj.onc.1209852
Shen, C. Y., Chang, Y. C., Chen, L. H., Lin, W. C., Lee, Y. H., Yeh, S. T., et al. (2018). The extracellular SEMA domain attenuates intracellular apoptotic signaling of semaphorin 6A in lung cancer cells. Oncogenesis 7 (12), 95. doi:10.1038/s41389-018-0105-z
Shimomura, Y., Agalliu, D., Vonica, A., Luria, V., Wajid, M., Baumer, A., et al. (2010). APCDD1 is a novel Wnt inhibitor mutated in hereditary hypotrichosis simplex. Nature 464 (7291), 1043–1047. doi:10.1038/nature08875
Si, W., Kang, Q., Luu, H. H., Park, J. K., Luo, Q., Song, W. X., et al. (2006). CCN1/Cyr61 is regulated by the canonical Wnt signal and plays an important role in Wnt3A-induced osteoblast differentiation of mesenchymal stem cells. Mol. Cell. Biol. 26 (8), 2955–2964. doi:10.1128/MCB.26.8.2955-2964.2006
Simonaro, C. M., D'Angelo, M., He, X., Eliyahu, E., Shtraizent, N., Haskins, M. E., et al. (2008). Mechanism of glycosaminoglycan-mediated bone and joint disease: Implications for the mucopolysaccharidoses and other connective tissue diseases. Am. J. Pathol. 172 (1), 112–122. doi:10.2353/ajpath.2008.070564
Soldner, F., Laganiere, J., Cheng, A. W., Hockemeyer, D., Gao, Q., Alagappan, R., et al. (2011). Generation of isogenic pluripotent stem cells differing exclusively at two early onset Parkinson point mutations. Cell 146 (2), 318–331. doi:10.1016/j.cell.2011.06.019
Steinke, F. C., and Xue, H. H. (2014). From inception to output, Tcf1 and Lef1 safeguard development of T cells and innate immune cells. Immunol. Res. 59 (1-3), 45–55. doi:10.1007/s12026-014-8545-9
Tan Timur, U., Caron, M., van den Akker, G., van der Windt, A., Visser, J., van Rhijn, L., et al. (2019). Increased TGF-beta and BMP levels and improved chondrocyte-specific marker expression in vitro under cartilage-specific physiological osmolarity. Int. J. Mol. Sci. 20 (4), 795. doi:10.3390/ijms20040795
Tare, R. S., Oreffo, R. O., Clarke, N. M., and Roach, H. I. (2002). Pleiotrophin/Osteoblast-stimulating factor 1: Dissecting its diverse functions in bone formation. J. Bone Min. Res. 17 (11), 2009–2020. doi:10.1359/jbmr.2002.17.11.2009
Thielen, N. G. M., van der Kraan, P. M., and van Caam, A. P. M. (2019). TGFβ/BMP signaling pathway in cartilage homeostasis. Cells 8 (9), 969. doi:10.3390/cells8090969
Timpl, R., Sasaki, T., Kostka, G., and Chu, M. L. (2003). Fibulins: A versatile family of extracellular matrix proteins. Nat. Rev. Mol. Cell Biol. 4 (6), 479–489. doi:10.1038/nrm1130
Unger, S., and Hecht, J. T. (2001). Pseudoachondroplasia and multiple epiphyseal dysplasia: New etiologic developments. Am. J. Med. Genet. 106 (4), 244–250. doi:10.1002/ajmg.10234
Usami, Y., Gunawardena, A. T., Iwamoto, M., and Enomoto-Iwamoto, M. (2016). Wnt signaling in cartilage development and diseases: Lessons from animal studies. Lab. Invest. 96 (2), 186–196. doi:10.1038/labinvest.2015.142
van der Wal, E., Herrero-Hernandez, P., Wan, R., Broeders, M., In 't Groen, S. L. M., van Gestel, T. J. M., et al. (2018). Large-Scale expansion of human iPSC-derived skeletal muscle cells for disease modeling and cell-based therapeutic strategies. Stem Cell Rep. 10 (6), 1975–1990. doi:10.1016/j.stemcr.2018.04.002
Weber, D., Wiese, C., and Gessler, M. (2014). Hey bHLH transcription factors. Curr. Top. Dev. Biol. 110, 285–315. doi:10.1016/B978-0-12-405943-6.00008-7
Wei, A., Shen, B., Williams, L. A., Bhargav, D., Gulati, T., Fang, Z., et al. (2016). Expression of growth differentiation factor 6 in the human developing fetal spine retreats from vertebral ossifying regions and is restricted to cartilaginous tissues. J. Orthop. Res. 34 (2), 279–289. doi:10.1002/jor.22983
Welch, C., Santra, M. K., El-Assaad, W., Zhu, X., Huber, W. E., Keys, R. A., et al. (2009). Identification of a protein, G0S2, that lacks Bcl-2 homology domains and interacts with and antagonizes Bcl-2. Cancer Res. 69 (17), 6782–6789. doi:10.1158/0008-5472.CAN-09-0128
Wu, X., Zhao, J., Ruan, Y., Sun, L., Xu, C., and Jiang, H. (2018). Sialyltransferase ST3GAL1 promotes cell migration, invasion, and TGF-β1-induced EMT and confers paclitaxel resistance in ovarian cancer. Cell Death Dis. 9 (11), 1102. doi:10.1038/s41419-018-1101-0
Xu, X., Zheng, L., Yuan, Q., Zhen, G., Crane, J. L., Zhou, X., et al. (2018). Transforming growth factor-beta in stem cells and tissue homeostasis. Bone Res. 6, 2. doi:10.1038/s41413-017-0005-4
Ye, F., Xu, H., Yin, H., Zhao, X., Li, D., Zhu, Q., et al. (2019). The role of BMP6 in the proliferation and differentiation of chicken cartilage cells. PLoS One 14 (7), e0204384. doi:10.1371/journal.pone.0204384
You, L., He, B., Xu, Z., Uematsu, K., Mazieres, J., Mikami, I., et al. (2004). Inhibition of Wnt-2-mediated signaling induces programmed cell death in non-small-cell lung cancer cells. Oncogene 23 (36), 6170–6174. doi:10.1038/sj.onc.1207844
Yue, Y., Yuan, Y., Li, L., Fan, J., Li, C., Peng, W., et al. (2018a). Homeobox protein MSX1 inhibits the growth and metastasis of breast cancer cells and is frequently silenced by promoter methylation. Int. J. Mol. Med. 41 (5), 2986–2996. doi:10.3892/ijmm.2018.3468
Yue, Y., Zhou, K., Li, J., Jiang, S., Li, C., and Men, H. (2018b). <em>MSX1</em> induces G0/G1 arrest and apoptosis by suppressing Notch signaling and is frequently methylated in cervical cancer. Onco. Targets. Ther. 11, 4769–4780. doi:10.2147/OTT.S165144
Zhang, S., Xia, C., Xu, C., Liu, J., Zhu, H., Yang, Y., et al. (2017). Early growth response 3 inhibits growth of hepatocellular carcinoma cells via upregulation of Fas ligand. Int. J. Oncol. 50 (3), 805–814. doi:10.3892/ijo.2017.3855
Zhao, S., Kurenbekova, L., Gao, Y., Roos, A., Creighton, C. J., Rao, P., et al. (2015). NKD2, a negative regulator of Wnt signaling, suppresses tumor growth and metastasis in osteosarcoma. Oncogene 34 (39), 5069–5079. doi:10.1038/onc.2014.429
Zimmerman, Z. F., Kulikauskas, R. M., Bomsztyk, K., Moon, R. T., and Chien, A. J. (2013). Activation of wnt/β-catenin signaling increases apoptosis in melanoma cells treated with trail. PLoS One 8 (7), e69593. doi:10.1371/journal.pone.0069593
Keywords: mucopolysaccharidosis type VI, lysosomal storage disease, disease modeling, induced pluripotent stem cells, cartilage
Citation: Broeders M, van Rooij J, Oussoren E, van Gestel T, Smith C, Kimber S, Verdijk R, Wagenmakers M, van den Hout J, van der Ploeg A, Narcisi R and Pijnappel W (2022) Modeling cartilage pathology in mucopolysaccharidosis VI using iPSCs reveals early dysregulation of chondrogenic and metabolic gene expression. Front. Bioeng. Biotechnol. 10:949063. doi: 10.3389/fbioe.2022.949063
Received: 20 May 2022; Accepted: 09 November 2022;
Published: 06 December 2022.
Edited by:
Magali Cucchiarini, Saarland University Medical Center, GermanyReviewed by:
Eric Schoger, University Medical Center, GermanyKeiichi Fukuda, Keio University School of Medicine, Japan
Copyright © 2022 Broeders, van Rooij, Oussoren, van Gestel, Smith, Kimber, Verdijk, Wagenmakers, van den Hout, van der Ploeg, Narcisi and Pijnappel. This is an open-access article distributed under the terms of the Creative Commons Attribution License (CC BY). The use, distribution or reproduction in other forums is permitted, provided the original author(s) and the copyright owner(s) are credited and that the original publication in this journal is cited, in accordance with accepted academic practice. No use, distribution or reproduction is permitted which does not comply with these terms.
*Correspondence: Wwmp Pijnappel, w.pijnappel@erasmusmc.nl