Pharmacokinetic Parameters and Estimated Milk Withdrawal Intervals for Domestic Goats (Capra Aegagrus Hircus) After Administration of Single and Multiple Intravenous and Subcutaneous Doses of Flunixin Meglumine
 Joe S. Smith1*†
  Tara L. Marmulak2† John A. Angelos2
  Zhoumeng Lin3
  Joan D. Rowe4 Jan L. Carlson5
  Weilin L. Shelver6
  Elizabeth A. Lee2
  Lisa A. Tell2*
- 1School of Veterinary Medicine, William R. Pritchard Veterinary Medical Teaching Hospital (VMTH), University of California, Davis, Davis, CA, United States
- 2Department of Medicine and Epidemiology, School of Veterinary Medicine, University of California, Davis, Davis, CA, United States
- 3Department of Anatomy and Physiology, Institute of Computational Comparative Medicine (ICCM), College of Veterinary Medicine, Kansas State University, Manhattan, KS, United States
- 4Department of Population Health and Reproduction, School of Veterinary Medicine, University of California, Davis, Davis, CA, United States
- 5Department of Animal Science, College of Agricultural and Environmental Sciences, University of California, Davis, Davis, CA, United States
- 6USDA-ARS Biosciences Research Laboratory, Fargo, ND, United States
Introduction: The study objectives were to estimate plasma flunixin (FLU) pharmacokinetic parameters and milk depletion profiles for FLU and its metabolite (5-hydroxy flunixin; 5-OH) after subcutaneous (SC) and intravenous (IV) administration of single and multiple flunixin meglumine (FM) doses to non-lactating (nulliparous and pregnant does) and lactating dairy goats. Analytical methods (ELISA and UPLC-MS/MS) for quantifying plasma FLU concentrations were compared. The final objective was to use regulatory (FDA and EMA) methods to estimate milk withdrawal intervals following extra-label drug use in goats.
Methods: FM was administered IV and SC to commercial dairy goats at 1.1 mg/kg for single and multiple doses. Plasma and milk samples were analyzed for FLU and 5-OH via UPLC-MS/MS. Plasma samples were also analyzed for FLU concentrations via ELISA. Using statistical approaches recommended by regulatory agencies, milk withdrawal intervals were estimated following FM extra-label use.
Results: Following IV administration of a single FM dose, clearances were 127, 199, and 365 ml/kg/h for non-lactating (NL) pregnant does, NL nulliparous does, and lactating dairy does, respectively. Following multiple SC doses, clearance/F was 199 ml/kg/h for lactating does. After IV administration of a single FM dose, terminal elimination half-lives were 4.08, 2.87, and 3.77 h for NL pregnant does, NL nulliparous does, and lactating dairy does, respectively. After multiple SC doses, the terminal elimination half-life was 3.03 h for lactating dairy does. No significant differences were noted for samples analyzed by UPLC-MS/MS or ELISA. Milk withdrawal intervals ranged from 36 to 60 h depending on the regulatory statistical method and dosage regimen.
Conclusions: Subcutaneous administration of FM to goats results in similar plasma pharmacokinetic parameters as IV administration. ELISA analysis is an alternative method to UPLC-MS/MS for quantifying FLU concentrations in caprine plasma samples. Following FM extra-label administration to dairy goats, clinicians could consider 36–60 h milk withdrawal intervals.
Introduction
According to the United States Department of Agriculture (USDA), there are ~2.62 million goats used for meat, milk, and mohair production in the USA (1). Simultaneously, the demand for goat products is increasing as evidenced by the 19% increase in the number of dairy goats from 2011 to 2019 (2, 3). Despite this rapid growth of the US goat industry, there are currently no non-steroidal anti-inflammatory drugs (NSAIDs) approved by the FDA for goats. Instead, NSAIDs, such as flunixin meglumine (FM), are often used in an extra-label manner in the USA, as allowed by the Animal Medicinal Drug Use Clarification Act (4) and its implementing regulations published at Title 21, Code of Federal Regulations, Part 530 (5).
The use of NSAIDs is common in livestock species for treatment and/or control of endotoxemia, pyrexia, inflammation, and pain. These medications act by inhibiting the cyclooxygenase enzyme and the arachidonic acid cascade resulting in decreased production of prostaglandins and thromboxanes (6). As one of the most commonly used NSAIDs in food animal practice in the USA, FM has FDA approval for the treatment of endotoxemia and inflammation in cattle and swine when administered by IV (cattle) or intramuscular (IM; swine) routes. Examples of extra-label indications for administration of FM to goats include the treatment of pain, pyrexia, mastitis, and endotoxemia (7–12). Practical use of FM becomes problematic for veterinarians treating minor food-producing species (such as dairy goats) as they must often extrapolate milk withholding intervals based on cattle data in order to avoid drug residues in caprine milk. The extra-label use of FM can result in prolonged detectable drug residues in animal-derived food products such as veal destined for human consumption (13). Drug residue problems are not limited to meat, as FLU metabolite residues found in bovine milk are some of the most common violations (4). The problematic nature of this situation is furthered as there are no published goat studies that have evaluated the pharmacokinetics (PK) of subcutaneously (SC) administered FM, despite its common use. Additionally, no studies have performed preliminary investigations of tissue reactions when FM is administered SC to goats. Administration routes other than IV may be problematic in some species, as evidenced by the potential adverse effects of clostridial myositis linked to when FM is administered intramuscularly to horses (14).
Several formulations of FM have been studied in food-animal species. The use of FM formulated as granules has been evaluated in cattle (6, 15, 16) and goats (17). A dilution of the injectable formulation of FM has also been evaluated in chickens (18). In cattle, oral FM has been studied with respect to effects on prostaglandin metabolites (15), luteolysis (6), and response to endotoxemia (16). Another formulation of FM available for cattle is the transdermal suspension, which has an FDA-approved label indication for minimizing pain associated with foot rot following single transdermal application (19).
Several published studies that evaluated the PK of orally administered injectable formulations of FM have shown oral administration to be similar to injectable routes in cattle (6, 17), chickens (18), and, to a certain extent, goats (17). However, to date, no published studies exist that provide data for a recommended milk withdrawal interval when an injectable formulation of FM is administered SC in goats. This study aimed to determine plasma PK parameters for single and multiple SC and IV injections of FM to non-lactating and lactating dairy goats and to generate data on which to estimate milk withdrawal intervals following extra-label drug use.
Methods
Experimental Animals
This project was approved by the Institutional Animal Care and Use Committee of the University of California-Davis. The project was divided into two study phases, with Phase 1 (trial 1 and trial 2) investigating the PK of a single dose of FM administered IV or SC to non-lactating dairy goats (pregnant and nulliparous does), and Phase 2 (trial 3 and trial 4) investigating the PK of single or multiple doses of FM administered IV or SC to lactating dairy goats. Goats were dosed FM at 1.1 mg/kg based on the low end of the bovine dosing range (1.1–2.2 mg/kg). Each study phase utilized a crossover study design based on administration routes as shown in Figure 1. All animals were determined to be healthy on the basis of physical examination with no evidence of mastitis. Physical examinations were performed before the studies were started and before and after each crossover. Animals were visually assessed daily for appetite, general appearance, and manure consistency. During acclimation, treatment, and washout periods, goats were housed outdoors in a group pen, and provided water ad libitum. The goats were fed alfalfa hay and grain diet that either met or exceeded the National Research Council requirements for maintenance of goats at their respective production status. The herd protocol included twice annual vaccinations against diseases associated with the following Clostridial agents: chauvoei, septicum, haemolyticum, novyi, tetani, as well as perfringens types C & D (Covexin 8TM, Merck Animal Health Kenilworth, New Jersey, USA). None of the animals selected for the study had a history of FM administration within 14 days of the start of the study.
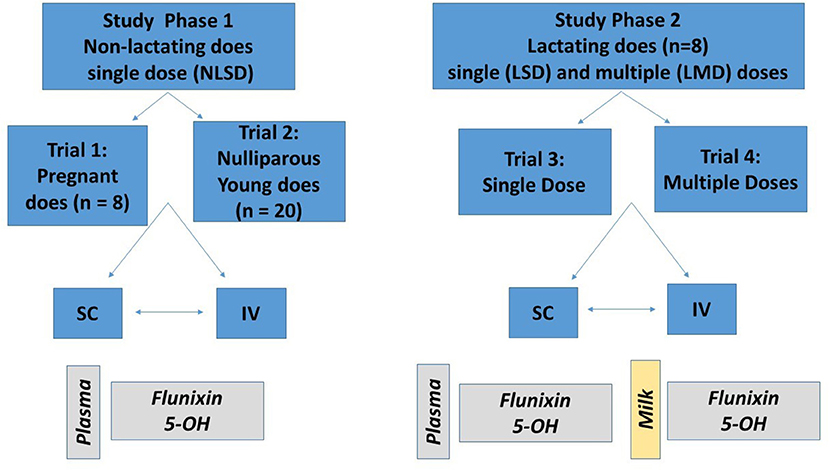
Figure 1. Description of study design. Study phase 1 (left) consisted of single dosing of 1.1 mg/kg of flunixin meglumine (FM) intravenously (IV) and subcutaneously (SC) to eight pregnant non-lactating does (trial 1) and 20 nulliparous does (trial 2). Study phase 2 (right) consisted of single (trial 3) and multiple (trial 4) dosing of 1.1 mg/kg FM to eight lactating does. For each trial, half of the animals were randomly assigned to receive either an IV or SC treatment; after a washout period, the opposite treatment was administered. For study phase 1, plasma concentrations of flunixin (FLU) and 5-hydroxy flunixin (5-OH) were determined. For study phase 2, plasma and milk concentrations of FLU and 5-OH were determined.
Phase 1 (Trials 1 and 2). PK of a Single Dose (SD) of FM Administered IV or SC to Non-lactating Dairy Goats (Nulliparous and Pregnant Does)
Healthy non-lactating dairy goats (n = 28) ranging in age from 1 to 9 years and weighing 43–99.5 kg were enrolled at two different study sites. Both pregnant and nulliparous animals were included. Dairy goat breeds used in the study included Toggenburg, Saanen, Oberhasli, LaMancha, and Alpine. The animals were housed in their normal location and had free access to hay and water throughout the study. The goats were not on any other medications during the study period.
For trial 1, eight non-lactating, pregnant, commercial dairy goats weighing 76 ± 11 kg (range: 64–96 kg) and aged 3.75 ± 3.33 years (range: 1–9 years) were housed at a seedstock production operation (Capay Valley, CA, USA). For trial 2, 20 non-lactating, nulliparous commercial dairy goats weighing 44.85 ± 7.35 kg (range: 32.5–61 kg) and aged 0.71 ± 0.04 years (range: 0.66–0.79 years) were used; these goats were housed at the University of California, Goat Teaching and Research Facility, Davis, CA.
Phase 2 (Trials 3 and 4). PK of Single Dose (SD) or Multiple Doses (MD) of FM Administered IV or SC to Lactating Dairy Goats
For Phase 2, 8 lactating commercial dairy goats (4 Alpine, 4 La Mancha) weighing 85 ± 10 kg (range, 75–95 kg) and aged 3.75 ± 1.54 years (range: 2–6 years) were used; these goats were housed at the University of California, Goat Teaching and Research Facility, Davis, CA. Phase 2 was divided into a single-dose trial (trial 3) and a multiple-dose trial (trial 4). Daily milk production for the goats on the day prior to the start of this study was 5.21 ± 0.8 kg. Lactation status included the following: 1st lactation (2 goats), an extended first lactation (1 goat), 2nd lactation (2 goats), a 4th lactation (1 goat), and 5th lactation (2 goats). At the beginning of trial 3, the goats averaged 111 days in milk (range 49–441 days).
Injection sites following SD SC administration (trial 3) and MD SC administration (trial 4) were assessed according to a scoring system established for this project. Injection sites were clipped before FM administration and a permanent marker was used to identify each site for follow-up observation and scoring. For each doe, the injection site was monitored by the same investigator (JSS) daily during the first 10–14 days following FM administration and then several days prior to the start of the next crossover. The injection sites were subjectively evaluated by visual assessment and palpation for the presence or progression of swelling, heat, redness, or signs of pain, and these adverse reactions were recorded when evident. Injection sites were scored on a 5 point system that utilized four criteria: swelling, heat, redness, or pain. Daily scoring was assigned to each doe, with 1 point being awarded for the presence of swelling <2 cm in diameter and 2 points awarded for the presence of swelling >2 cm in diameter. One point was also awarded individually if heat, redness, or signs of pain were present, and a score of 0 would be awarded for each category if absent. With this system, a score of 5 points would be awarded for an injection site reaction with >2 cm swelling (2 points) that also exhibited heat (1 point), redness (1 point), and signs of pain (1 point). Similarly, an injection site with no swelling, heat, redness, or pain would receive a score of 0.
Experimental Design and Sample Collection
Phase 1 (Trials 1 and 2). PK of a Single Dose (SD) of FM Administered IV or SC to Pregnant (Trial 1) and Nulliparous (Trial 2) Non-lactating (NL) Dairy Goats
For trials 1 and 2, goats were randomly assigned to receive FM (Banamine™, Merck Animal Health, Madison, NJ, USA) at a dose of 1.1 mg/kg either IV or SC. Single-dose injections were given SC in the mid-thoracic region caudal to the elbow. A crossover design was used such that goats were given FM by the alternate route (either IV or SC) after a minimum 28-day washout period. Ten-milliliter blood samples were collected by jugular venipuncture into heparinized tubes (BD vacutainer, BD, Franklin Lakes, NJ, USA). Samples were drawn at 0, 5, 10, 15, 30, and 45 min and 1, 1.5, 2, 4, 6, 8, 12, 18, 24, 30, 32, 36, and 48 h. Samples were drawn on the opposite jugular vein than where the drug was administered.
Phase 2 (Trials 3 and 4). PK of Single Dose (SD; Trial 3) or Multiple Doses (MD; Trial 4) of FM Administered IV or SC to Lactating Dairy Goats
Trial 3 (Single IV or SC dose; lactating does)
Goats were randomly assigned to receive FM at a dose of 1.1 mg/kg either via IV (n = 4 goats) or SC (n = 4 goats) administration. Single-dose injections were given SC in the mid-thoracic region caudal to the elbow. A crossover design was used such that goats were given FM by the alternate route (either IV or SC) after a minimum 14-day washout period. Prior to initiating FM treatment, a sample of milk and whole blood was collected. Each doe's udder was completely milked out prior to drug administration and sampling. Potential injection sites were also scored as described above. Goats were administered FM at time zero, and then blood samples were collected via direct venipuncture at 5, 10, 15, 30, 45, and 60 min after administration, with additional samples being collected at 2, 4, 6, 8, 12, 18, 24, 30, 36, 48, 60, and 72 h after administration. Milk samples were collected via hand milking at 1, 2, 4, 6, 8, and 18 h after administration. Milk samples were also collected by machine milking (Waikato Milking SystemsTM, Hamilton, NZ) at 12, 24, 36, 48, 60, 72, 84, 96, 108, and 120 h after administration.
Trial 4 (multiple IV or SC doses; lactating does)
Goats were maintained in their same assigned administration-based treatment groups as for trial 3. For the multiple-dose study, FM treatments were alternated, with evening treatments administered on either the right side of the animal (SC) or the right jugular vein, and morning treatments administered on the left side of the animal (SC) or the left jugular vein. For the does assigned to the SC treatments, three distinct sites on the left and right side of the thoracic body wall caudal to the elbow were used for injection and were identified with permanent markers. In order to evaluate injection site reactions, pre-identified injection sites were used only once for FM administration. These sites were monitored for injection site reactions as described previously. A crossover design was used such that goats were administered FM by the alternate route (either IV or SC) after a minimum 14-day washout period. Trial 4 (multi-dose lactating does study) was conducted 15 weeks after the conclusion of trial 3 (single-dose lactating does study). Prior to initiating FM treatment, a sample of milk and blood was collected. Each doe's udder was completely milked out prior to drug administration and sampling. Injection sites were also evaluated as described above. Goats were administered a treatment regimen of FM (1.1 mg/kg) every 12 h for six treatments. The sample collected immediately prior to the administration of the sixth treatment marked the time 0. Whole-blood samples were collected by direct venipuncture at 5, 10, 15, 30, 45, and 60 min after administration, with additional samples being collected at 2, 4, 6, 8, 12, 18, 24, 30, 36, 48, 60, and 72 h after the last FM administration. Milk samples were collected via hand milking (complete evacuation of the udder) at 1, 2, 4, 6, 8, and 18 h after administration, with samples being collected by milking machine at 12, 24, 36, 48, 60, 72, 84, and 96 h after administration. For the first crossover of the multi-dose lactating does study, the second dose (12 h) pre-treatment milk samples were lost due to a sampling error.
Sample Processing
For each sampling time point, whole-blood samples were stored on ice and were then centrifuged at 2,000 × g for 10 min. Plasma samples were stored frozen (−80°C) until analyzed.
Milk samples were agitated three times following collection and then placed into sample tubes and frozen (−20°C) until sample analysis.
Quantifying FLU and 5-OH Metabolite Concentrations in Plasma and Milk Samples Using Ultra-Performance Liquid Chromatography With Mass Spectrometric Detection
Plasma and milk FLU and 5-hydroxy flunixin (5-OH) concentrations were quantified based on the method by Buur et al. (20), with minor modifications. Flunixin, flunixin-d3, and 5-hydroxy flunixin were VETRANAL™ analytical grade (≥99.5%; Fluka, St. Louis, MO, USA) and 5-hydroxyflunixin-d3 was analytical grade (95%; Santa Cruz Biotechnology, Dallas, TX, USA). Individual stock solutions of each were made by dissolving 1 mg in 1 ml of methanol. The mixed working solution for the internal standards was made by diluting 50 μl of each to 5 ml. Deuterated forms of FLU and 5-OH were used as internal standards. Samples were acidified with phosphoric acid and centrifuged. The supernatant was further extracted on a Waters Oasis MCX cartridge (1 ml, 30 mg). Samples were eluted with methanol:ammonium hydroxide (90:10, v/v), evaporated to dryness under nitrogen reconstituted with acetonitrile:water (40:60, v/v), and filtered with a 0.2-μm PVDF syringeless filter device.
Analysis was carried out on an Acquity UPLC (Waters) coupled to a Thermo TSQ Quantum Discovery Max tandem quadrupole mass spectrometer with a heated electrospray ionization source operated in the positive ion mode. The column was an Acquity UPLC HSS T3 (1.8 μm, 2.1 × 100 mm) maintained at 30°C. The mobile phase was 0.1% acetic acid:acetonitrile (32:68) at a flow rate of 0.4 ml/min. Ions were monitored in the selected reaction monitoring mode with transitions of 297–279 for FLU, 300–282 for flunixin-d3, 313–295 for 5-OH, and 316–298 for 5-OH flunixin-d3.
Additionally, samples from nine randomly selected does from study phase 1 were collected in crossover fashion after both IV and SC administration and analyzed via ELISA for FLU concentrations for agreement with UPLC-MS/MS results.
Quantifying FLU and 5-OH Concentrations in Plasma and Milk Samples Using Enzyme-Linked Immunoassay (ELISA) Method
The FLU antibody-coated plate, horseradish peroxidase conjugate, and substrate provided by the manufacturer were used to quantify the FLU in goat plasma. The assay procedure followed those described by Shelver et al. (21) for cattle plasma with the exception of the calibration curves and were generated from control goat plasma dissolved in 50 mM phosphate buffer, pH 6.8, 1:1 (v/v). The calibration points included 0. 0.3, 0.5, 1, 3, 10, 30, 100, and 300 ng/ml fitted to a four-parameter logistic equation; the unknown concentrations of flunixin free acid in test samples were computed from the standard curve and adjusted for the dilution factor. If a sample concentration exceeded the highest calibration point, the sample was diluted using blank plasma: 50 mM phosphate buffer 1:1 (v/v) as diluent. The limit of detection (LOD), based on averaged inhibition concentration to reduce 10% of absorbance (IC10) and adjusted for the dilution factor, was 0.16 ng/ml. The working range based on IC15 to IC85 was 0.32–48.6 ng/ml.
PK Analysis
PK analysis of time vs. total FLU and 5-OH plasma concentration data was completed using a noncompartmental model (Phoenix WinNonlin 8.0, Certara, Princeton, NJ, USA). Time vs. concentration figures for FLU and 5-OH were produced via a commercial program (GraphPad Prism 8.0.2, GraphPad Software, Inc., La Jolla, CA, USA).
Standard PK parameters were generated for individual does, as follows:
• Maximum observed FLU concentration (μg/ml), Obs Cmax;
• Last observed FLU concentration (μg/ml), Obs Clast;
• Time to last observed FLU concentration (min), Obs Tlast;
• Area under FLU concentration–time curve from time zero to infinity [(ng/ml)*h], AUCinf;
• Area under FLU concentration–time curve from time zero to last measurement [(ng/ml)*h], AUClast;
• Area under FLU concentration–time curve extrapolated (%), AUC%ext;
• Flunixin mean residence time (MRT; h),
• MRT = AUMCinf/AUCinf, where AUMCinf is the area under the first-moment curve from time zero to infinity [(ng/ml)*h2]. Area parameters (AUC, AUMC) were calculated using the log-linear trapezoidal rule.
• FLU, terminal elimination half-life (T1/2λz, h)
• T1/2λz = ln (2)/λz, where λz is the slope of the terminal phase of the natural logarithm of concentrations vs. time curve
• FLU systemic clearance (ml/h/kg), CL = Dose/AUCinf;
• Volume of distribution (ml/kg) of flunixin during the elimination phase,
• Varea = Dose/(AUCinf × λz); (Vz)
• Volume of distribution (ml/kg) of flunixin at steady state,
• Vss = CL × MRT
For FLU, the extraction ratio (Ebody) was calculated as previously described (22–24) with:
Ebody = Systemic clearance/Cardiac output (1)
First, we calculated for each individual doe, and then combined them for a mean value, with the doe cardiac output described by Toutain et al. (22), as follows:
Cardiac output = 180 × BW(kg)−0.19 (2)
Additionally, the bioavailability (F) of flunixin following SC administration was calculated as follows: (AUCINFSC)/(AUCINFIV).
Statistical Analysis
Within time point, mean plasma concentrations as determined after ELISA or UPLC–MS/MS analysis were compared using the Student's t test after testing for equal variance. Type I statistical error, common with multiple comparisons, was minimized by comparing only means between analytical method within dose route and time point. A similar procedure was used for the comparison of within dose route concentrations calculated from ELISA or UPLC-MS/MS data.
For determination of the effect of age and reproductive status on the PK of IV and SC FLU PK, the PK parameters from trials 1 and 2 were compared. Data distributions for all PK parameters were assessed for normality by Shapiro–Wilk tests. Comparisons between the two experimental groups were performed via unpaired t-tests for normally distributed parameters and Mann–Whitney tests for nonparametric parameters via a commercial program (GraphPad Prism 8, GraphPad Software, Inc, La Jolla, CA, USA) as previously described (25, 26).
For all statistical tests, P < 0.05 was considered significant.
Estimation of Milk Withdrawal Interval
Milk withdrawal intervals for FLU after differing administration regimens were calculated using European Medicines Agency (EMA)'s WTM 1.4 software and US FDA's “reschem” R package. The WTM 1.4 software is an updated computerized version of a harmonized approach for the calculation of withdrawal periods for milk throughout the European Union. This program was initially released in 2000 and later updated and adopted in 2002 by the Committee for Veterinary Medicine Products (CVMP) of EMA. Several calculation methods are available in the WTM 1.4 software, including the safe concentration from linear regression (SCLR) method and the time-to-safe-concentration (TTSC) method. The TTSC method is not applicable to the present data because FLU has a zero tolerance in goat milk; thus, the tolerance is operationally equivalent to the LOD of 0.4 ng/ml for the marker residue 5-OH in milk, which is lower than all the quantifiable concentrations. Therefore, the SCLR calculation method was used to analyze the present data. The limit of quantification (LOQ) of the marker residue 5-OH in milk was 0.9 ng/ml. The CV of the assay was 5.7%. For FDA's “reschem” R package, it requires a minimal of 10 animals and triplicate measurements for each time point. However, the present study only included eight animals and only one measurement was performed for each sample at each time point. In order to satisfy the data format for using the “reschem” package, Crystal Ball (Version 11.1.2.4, Oracle Corporation, Redwood Shores, CA) was used to perform Monte Carlo simulation based on the mean concentration (i.e., the individual measured value) and the intra-assay CV of 3.2% to generate two replicate values. Also, the mean concentration and standard deviation of the studied animals at each time point were calculated and used to run Monte Carlo simulation to generate additional virtual animals to satisfy the requirement for at least 10 animals.
Results
Goat Health and Injection Site Reactions
No adverse effects (sedation, seizures, vomiting, diarrhea, or respiratory compromise) were observed following IV or SC FM administration. For trial 3, injection site scores were 1 and 2 in six and two goats, respectively. For trial 4, injection site scores were 1 and 2–3 in 5 and 3 does, respectively. None of the does had an injection reaction that persisted beyond the washout period to the next study or exit physical examination.
The LOD for FLU was 0.1 and 0.3 ng/ml in plasma and milk, respectively, and 0.3 and 0.4 ng/ml for 5-OH. The LOQ for FLU was 0.5 and 0.9 ng/ml in plasma and milk, and for 5-OH, it was 0.8 and 0.9 ng/ml. Average intra- and inter-assay variability, as measured by relative standard deviation, in plasma was 4.3 and 5.2% for FLU and 4.3 and 5.7% for 5-OH. In milk, the intra- and inter-assay variability was 3.4 and 4.7% for FLU and 3.2 and 5.7% for 5-OH. Average recoveries were 100.0% for both FLU and 5-OH in plasma and 99.1 and 99.6%, respectively, in milk.
Study Phase 1
Following IV administration of a single dose of FM, mean FLU concentration (Obs Cmax) was 9.972 ± 2.596 (pregnant NL does) and 9.613 ± 2.737 μg/ml (nulliparous NL does) after single dosing. Following SC single dosing, the mean observed peak plasma concentration (Obs Cmax) was 2.182 ± 0.255 (pregnant NL does) and 2.495 ± 1.234 (nulliparous NL does) μg/ml and the observed time to maximum concentration (Obs Tmax) occurred 1.41 ± 0.38 and 0.90 ± 0.42 h after SC administration, respectively.
Table 1 summarizes plasma PK parameters after IV and SC single dose administration of FM to pregnant non-lactating does (trial 1) and nulliparous non-lactating does (trial 2).
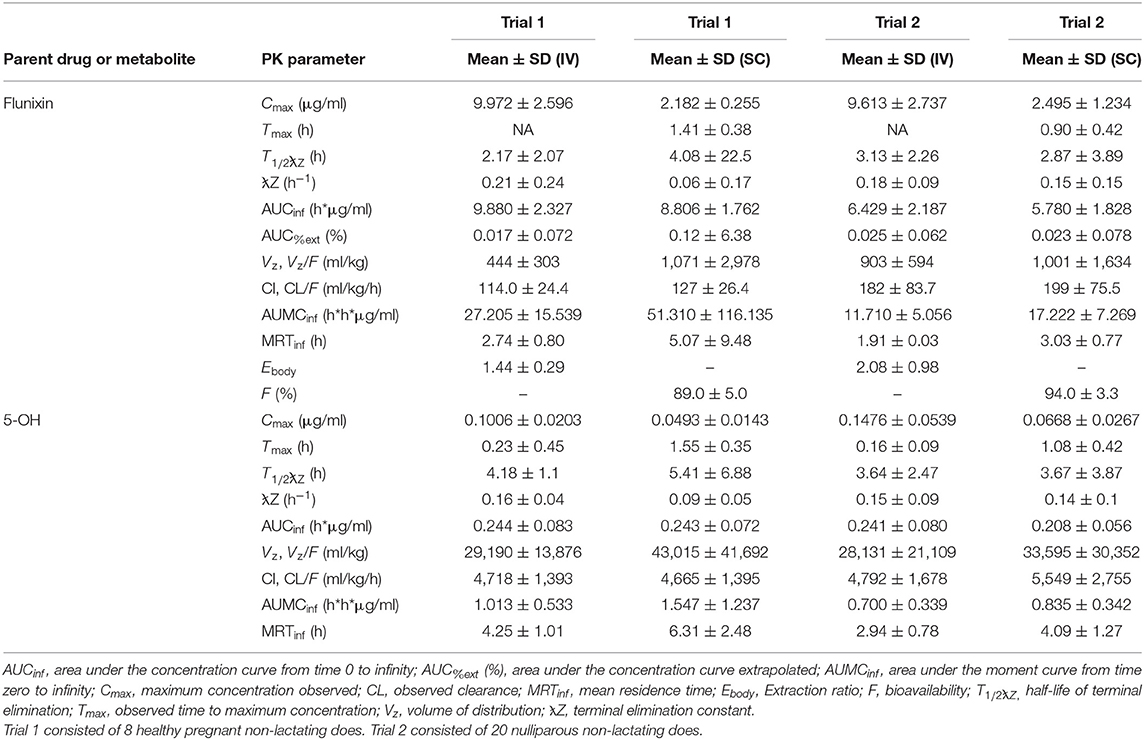
Table 1. Non-compartmental pharmacokinetic parameters (mean, SD) of flunixin and 5-hydroxy flunixin (5-OH) after a single intravenous (IV) and subcutaneous (SC) flunixin meglumine dose (1.1 mg/kg) administered to non-lactating dairy does.
Figure 2 represents the time vs. plasma concentration profile for single-dose IV and SC administration of FM to non-lactating dairy does (trials 1 and 2). Figures 2A,B present the entire time vs plasma concentrate.on profile, whereas Figures 2C,D present the time vs. plasma concentration profile for the first 6 h after administration to focus on the differences in the early period after administration.
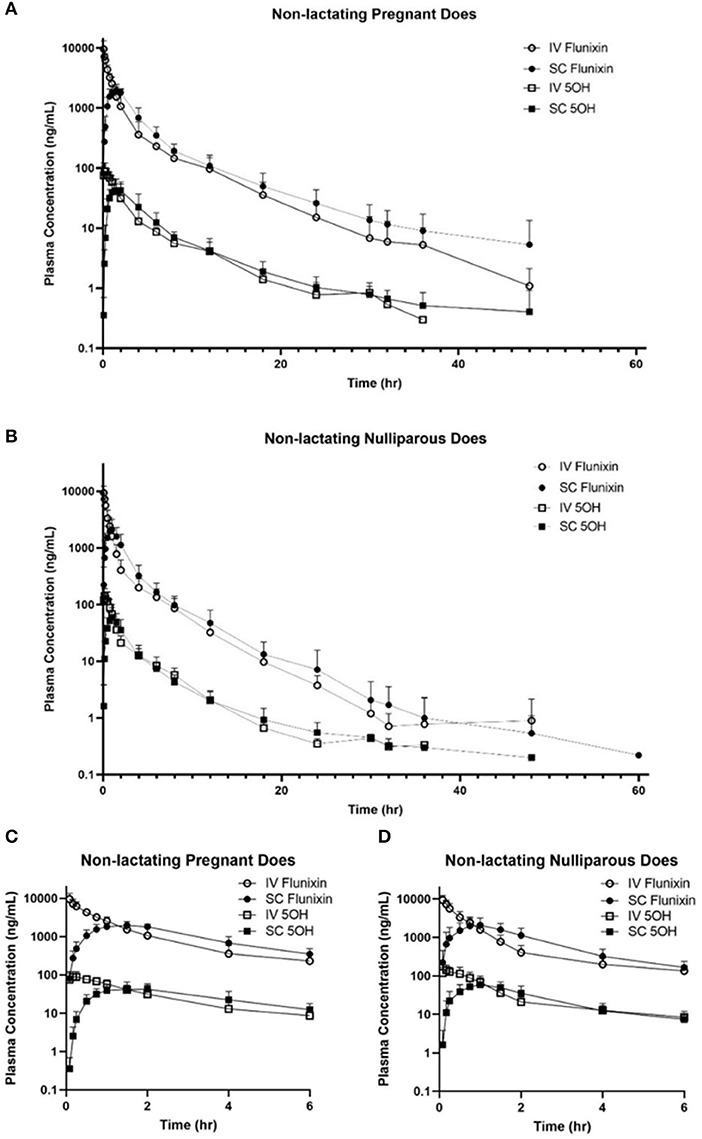
Figure 2. (A,B) Mean plasma flunixin (FLU) and 5-hydroxy flunixin (5-OH) concentration (logarithmic scale) vs. time profiles for (A) pregnant non-lactating (n = 8; trial 1) and (B) nulliparous non-lactating (n = 20; trial 2) dairy does following intravenous (IV) and subcutaneous (SC) single dose administration of 1.1 mg/kg of flunixin meglumine (FM). This study had a crossover design. Each trial was divided into 2 groups and randomly allocated to receive FM IV or SC. After a minimum 4-week washout period, each group received FM via the opposite administration route. Open circles and boxes correspond to plasma concentrations after IV FM administration; solid circles and boxes correspond to plasma concentrations after SC FM administration. (C,D) Mean plasma flunixin (FLU) and 5-hydroxy flunixin (5-OH) concentration (logarithmic scale) vs. time profiles for (C) pregnant non-lactating (n = 8; trial 1) and (D) nulliparous non-lactating (n = 20; trial 2) dairy does following intravenous (IV) and subcutaneous (SC) single dose administration of 1.1 mg/kg of flunixin meglumine (FM) focusing on the initial 6 h following drug administration. This study had a crossover design. Each trial was divided into two groups and randomly allocated to receive FM IV or SC. After a minimum 4-week washout period, each group received FM via the opposite administration route. Open circles and boxes correspond to plasma concentrations after IV FM administration; solid circles and boxes correspond to plasma concentrations after SC FM administration.
No significant differences were found on comparison of IV PK parameters between the groups of trials 1 and 2 for Cmax (P = 0.9379) and T1/2λz (0.5845). Significant differences of IV PK parameters for groups 1 and 2 were as follows: CL (P = 0.0019), AUC last (P = 0.0001), MRT (P = 0.0001), and Vz (P = 0.0238). For SC PK parameters, no significant differences were identified between trials 1 and 2 for Cmax (P = 0.4872), T1/2λz (P = 0.3074), and Vz (P = 0.8557). Significant differences of SC PK parameters for groups 1 and 2 were as follows: Tmax (P = 0.0179), CL/F (P = 0.0071), AUClast (P = 0.0002), and MRT (P = 0.0012).
Study Phase 2
Plasma PK parameters after IV and SC administration of single and multiple doses of FM in lactating dairy does are reported in Table 2. Following single IV administration, FLU concentration (Obs Cmax) was 7.235 ± 3.3252 μg/ml. After single SC dosing, FLU concentration (Obs Cmax) was 0.838 ± 0.2372 μg/ml at 1.28 ± 0.31 h post last administration. Following multiple IV administration, FLU concentration (Obs Cmax) was 7.691 ± 1.3452 μg/ml. After multiple SC dosing, the mean observed peak plasma concentration (Obs Cmax) was 1.434 ± 0.2237 μg/ml and the observed time to maximum concentration (Obs Tmax) occurred 1.17 ± 0.44 h after the last administration.
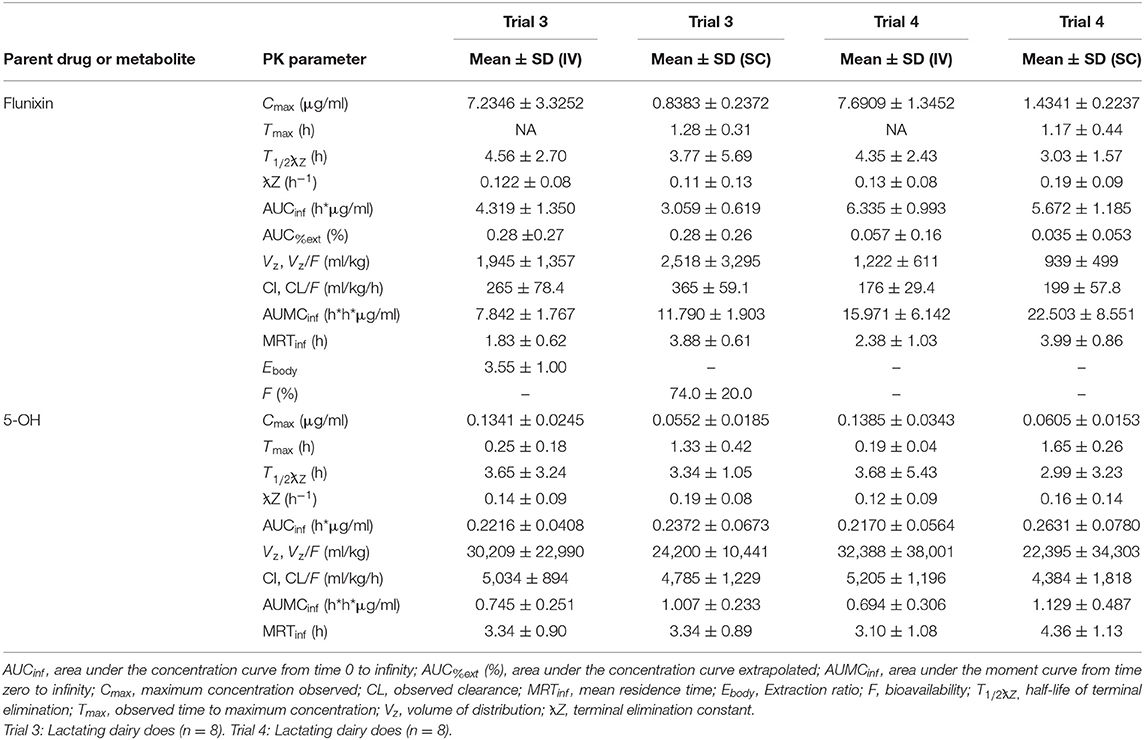
Table 2. Estimated non-compartmental pharmacokinetic parameters (mean ± SD) based on time vs. plasma flunixin and 5-OH concentration profiles after single (trial 3) and multiple (trial 4) doses of flunixin meglumine administered intravenously (IV) and subcutaneous (SC) at 1.1 mg/kg to eight healthy lactating dairy does.
Figure 3 is the time vs. plasma concentration curve for single and multiple doses of FM administered IV and SC to lactating dairy does.
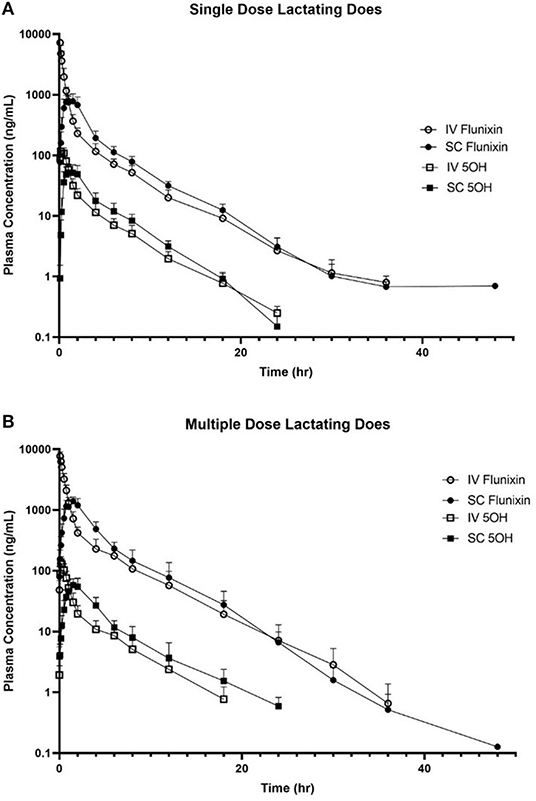
Figure 3. Mean plasma flunixin (FLU) and 5-hydroxy flunixin (5-OH) concentration (logarithmic scale) vs. time profiles for (A) single-dosed lactating (n = 8; trial 3) and (B) multiple-dosed lactating (n = 8; trial 4) dairy does following intravenous (IV) and subcutaneous (SC) administration of 1.1 mg/kg of flunixin meglumine (FM). This study had a crossover design. Each trial was divided into two groups and randomly allocated to receive FM IV or SC. After a minimum 2-week washout period, each group received FM via the opposite administration route. For the multiple-dose study, 6 doses of FM were administered over a 60-h period, with 1 dose q 12 h, with sampling commencing immediately after administration of the 6th dose. Open circles and boxes correspond to plasma concentrations after IV FM administration; solid circles and boxes correspond to plasma concentrations after SC FM administration.
Figure 4 is the time vs. milk concentration profile of FLU and 5-OH following single and multiple doses of FM administered IV and SC to lactating dairy does.
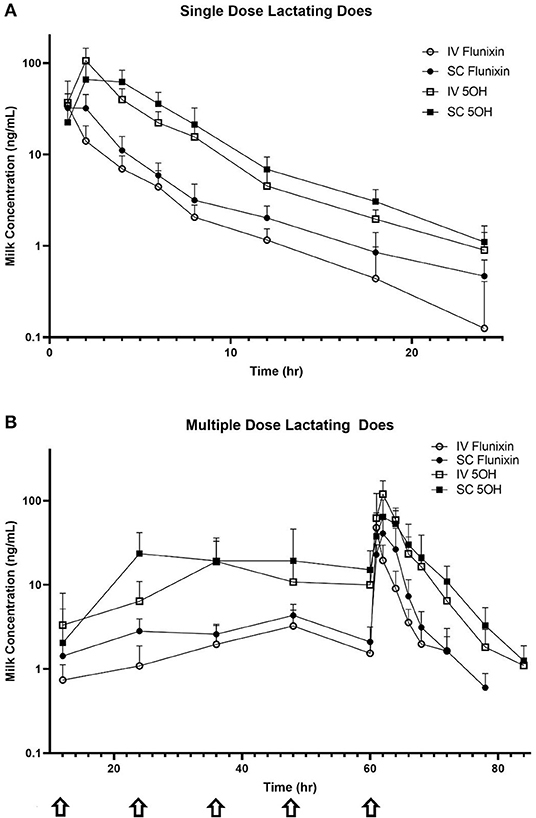
Figure 4. Mean milk flunixin (FLU) and 5-hydroxy flunixin (5-OH) concentration (logarithmic scale) vs. time profiles for (A) single-dosed lactating (n = 8; trial 3) and (B) multiple-dosed lactating (n = 8; trial 4) dairy does following intravenous (IV) and subcutaneous (SC) administration of 1.1 mg/kg of flunixin meglumine (FM). This study had a crossover design. Each trial was divided into two groups and randomly allocated to receive FM IV or SC. After a minimum 2-week washout period, each group received FM via the opposite administration route. For the multiple-dose study, 6 doses of FM were administered over a 60-h period, with one dose q 12 h, with sampling commencing immediately after administration of the 6th dose. Sampling commenced immediately after administration of the initial dose, and for the multiple-dose study, concentrations were measured immediately prior to administration of FM at 12, 24, 36, 48, and 60 h (arrows correspond to these dosing events). Open circles and boxes correspond to plasma concentrations after IV FM administration; solid circles and boxes correspond to plasma concentrations after SC FM administration.
Reported extraction ratios were (mean ± SD) 1.44 ± 0.29 for pregnant NL does, 2.08 ± 0.98 for nulliparous NL goats, and 3.55 ± 1.00 for lactating does after single IV administration. Mean ± SD bioavailability was 89.0% for pregnant NL does, 94.0% for nulliparous NL goats, and 74.0% for lactating does after single SC administration.
ELISA vs. UPLC-MS/MS Concentrations
Table 3 summarizes the FLU plasma concentrations quantified using ELISA and compared to UPLC-MS/MS determined concentrations. No statistically significant differences (P < 0.05) were identified for concentrations at any time point.
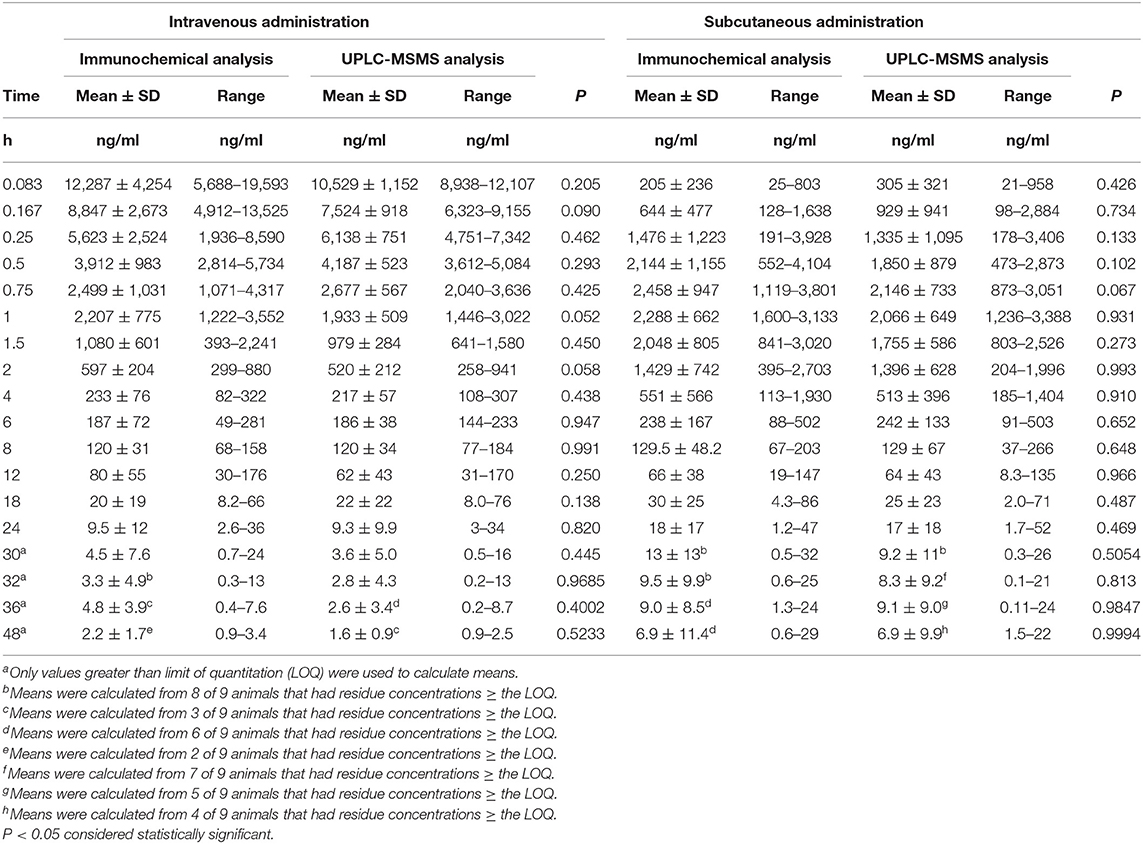
Table 3. Mean (± SD) flunixin plasma concentrations as a function of time as determined by immunochemistry (ELISA) or UPLC-MS/MS analysis in non-lactating does dosed (1.1 mg/kg bw of flunixin meglumine) by intravenous (n = 9) or subcutaneous (n = 9) injections.
Estimation of Milk Withdrawal Intervals
Milk withdrawal intervals ranged from 36 to 60 h post last dose depending on the dosing paradigms and regulatory methods. The results are presented in Table 4. The milk withdrawal interval output figures from EMA's WTM 1.4 software for SD IV, SD SC, and MD SC are displayed in Figures 5–7, respectively. The MD IV dataset was not calculable using the EMA method.
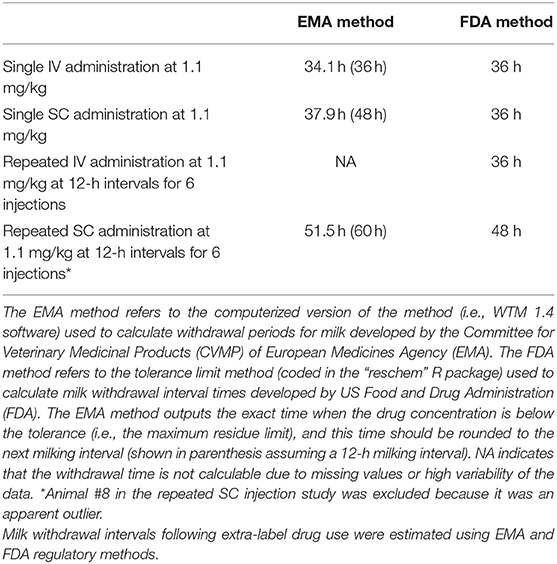
Table 4. Estimated milk withdrawal intervals for lactating goats after single or multiple doses of flunixin meglumine administered intravenously or subcutaneously.
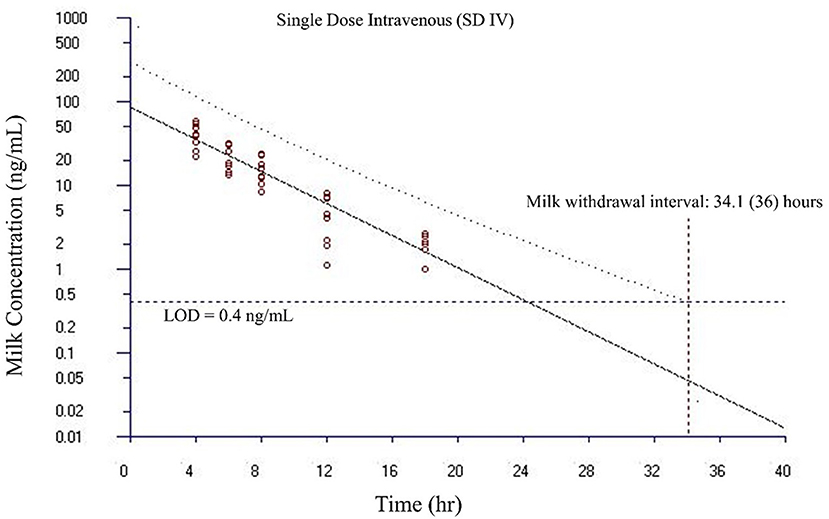
Figure 5. Estimated milk withdrawal interval for flunixin in lactating goats after single intravenous injection at 1.1 mg/kg. The calculation was based on the milk data of 5-hydroxy flunixin (i.e., the marker residue of flunixin in milk) using the European Medicines Agency's WTM 1.4 software (i.e., the EMA method). Since flunixin has a zero tolerance in goat milk, the tolerance or maximum residue limit was set to be operationally equivalent to the limit of detection (LOD) of 0.4 ng/ml for the marker residue 5-hydroxy flunixin in milk. The estimated milk withdrawal interval was rounded to the next milking interval (shown in parenthesis assuming a 12-h milking interval).
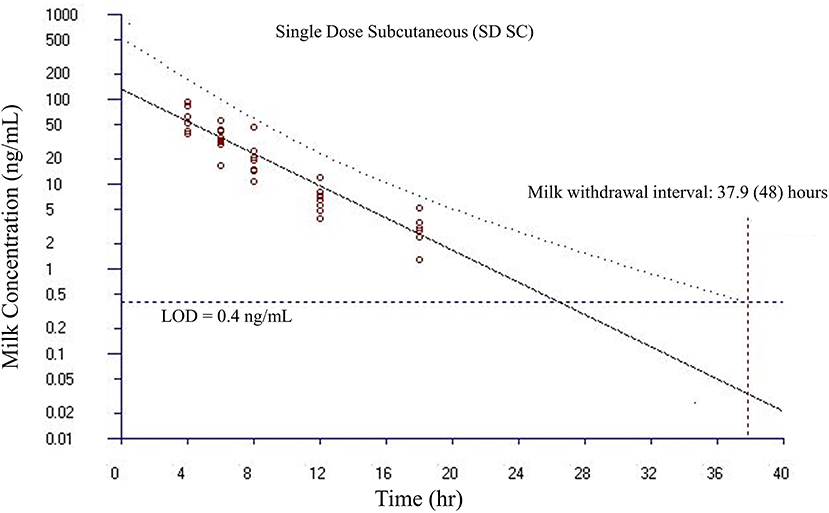
Figure 6. Estimated milk withdrawal interval for flunixin in lactating goats after single subcutaneous injection at 1.1 mg/kg. The calculation was based on the milk data of 5-hydroxy flunixin (i.e., the marker residue of flunixin in milk) using the European Medicines Agency's WTM 1.4 software (i.e., the EMA method). Since flunixin has a zero tolerance in goat milk, the tolerance or maximum residue limit was set to be operationally equivalent to the limit of detection (LOD) of 0.4 ng/ml for the marker residue 5-hydroxy flunixin in milk. The estimated milk withdrawal interval was rounded to the next milking interval (shown in parenthesis assuming a 12-h milking interval).
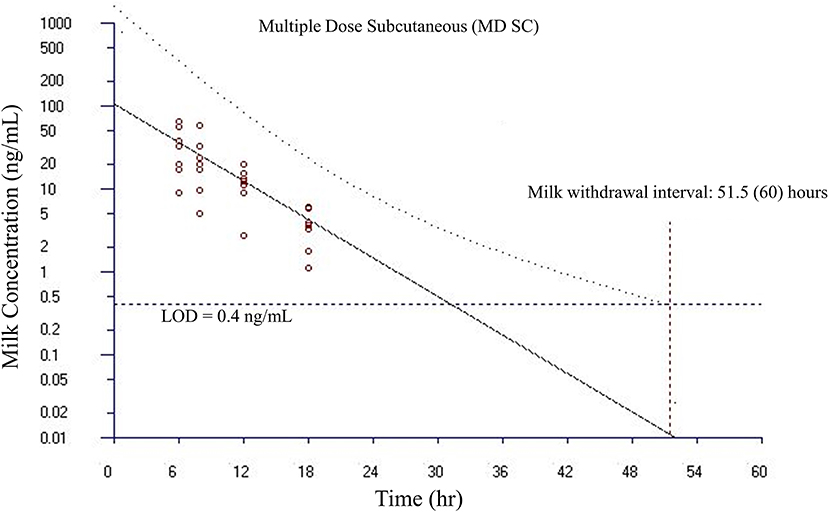
Figure 7. Estimated milk withdrawal interval for flunixin in lactating goats after multiple subcutaneous injections at 1.1 mg/kg every 12 h for 6 injections. The calculation was based on the milk data of 5-hydroxy flunixin (i.e., the marker residue of flunixin in milk) using the European Medicines Agency's WTM 1.4 software (i.e., the EMA method). Since flunixin has a zero tolerance in goat milk, the tolerance or maximum residue limit was set to be operationally equivalent to the limit of detection (LOD) of 0.4 ng/ml for the marker residue 5-hydroxy flunixin in milk. The estimated milk withdrawal interval was rounded to the next milking interval (shown in parenthesis assuming a 12-h milking interval).
Discussion
In this study, we compared the PK parameters of IV and SC of FLU and 5-OH after FM administered to non-lactating and lactating dairy does of multiple ages. Additionally, milk FLU and 5-OH concentrations were determined after each treatment. Our present study is novel because we determined these parameters, including from SC injection, in lactating does grouped to mimic a commercial herd population, using a different route of administration, dose, as well as non-lactating goats of various ages and reproductive statuses. Additionally, FLU concentrations quantified using an ELISA method were compared to those using UPLC-MS/MS to determine if analytical method choice would result in similar FLU concentrations. The time vs. milk 5-OH FLU concentration data from our study were then used to estimate a milk withdrawal interval using statistical approaches to ensure that 95 or 99% of animals' milk will be free of residues 95% of the time.
Our study provided data for estimating plasma PK parameters following IV and SC administrations to pregnant non-lactating does (trial 1), non-lactating nulliparous does (trial 2), and lactating does (trials 3 and 4). Although FLU PK parameters for dairy goats (dosed at 2.2 mg/kg) were previously published (17), these parameters had been identified in dairy goats administered IV, IM, or orally (in granule form) FM, and in a population of 3-year-old goats of the Norwegian breed. That study determined their results using animals of the same age and did not evaluate SC administration of FM. In our study, absorption of FM was rapid after SC administration. The observed Cmax determined for single-dose SC administrations in the groups of our study was 2.18 μg/ml (non-lactating pregnant does), 2.50 μg/ml (non-lactating nulliparous does), and 0.84 μg/ml (lactating does). These observed Cmax values appear to be less than reported for intramuscular (6.1 μg/ml) administration as well more than reported for transdermal (0.134 μg/ml) and oral (1.2 μg/ml) administration in goats (with the exception of the Cmax from the lactating group), although the transdermal study used a dosage of 3.3 mg/kg instead of 2.2 mg/kg (17, 27). The plasma T1/2λz of 4.08 h (pregnant NL does), 2.87 h (nulliparous NL does), and 3.77 h (lactating does) for SD SC treatment is consistent with what would be expected with other studies, as T1/2λz of 3.6 h (IV), 3.4 h (IM), 4.3 h (PO), and 43.1 h (transdermal) have been previously identified in caprine flunixin PK studies (17, 27). When compared to the existing literature, the plasma clearance (CL) of SD IV administered FM in the goats of our study of 114 ml/h/kg (pregnant NL does), 182 ml/h/kg (nulliparous, NL does), and 265 ml/h/kg (lactating does) appears to be higher than previously reported for goats as values of 110 and 67 ml/h/kg have been reported for adult Norwegian dairy goats and adult Boer goats, respectively (17, 27). Table 5 summarizes comparative PK parameters from our study with other caprine FM PK studies. It is important to note that PK parameters can be influenced by the lower LOQ, as recently demonstrated by IV fentanyl in calves (24). For our study the LOQ for flunixin was 0.5 and 0.9 ng/ml in plasma and milk, respectively, and for the 5-OH metabolite, it was 0.8 and 0.9 ng/ml, respectively. When comparing the quantification limits from our study to other studies of flunixin in goats, similarities of LOQs were noted for the meat goat study (0.5 ng/ml), but differed from the Norwegian dairy goat study (47 ng/ml) (17, 27).
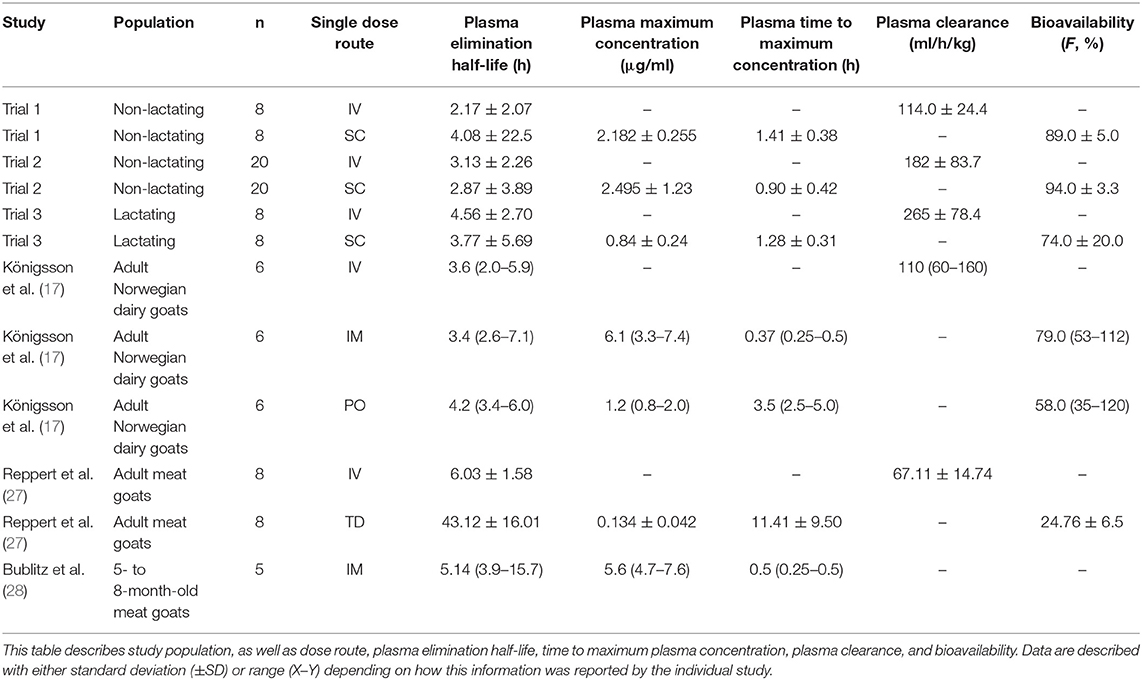
Table 5. Goat plasma flunixin pharmacokinetic parameter comparisons described in the literature.
In cattle, multiple similarities in the PK of flunixin regardless of method of administration have been observed (6, 15, 16, 29). This relationship has been identified to an extent in dairy goats (17), and recently in meat goats after transdermal administration (27). In dairy cattle, differences have been noted with respect to bioavailability, terminal half-life, and milk residue detection between different methods of injectable administration (29). Prolonged terminal half-lives are also associated with IM administration of FM to dairy cattle and goats (28, 30). The results of our study suggest similar terminal elimination half-lives of flunixin and 5-OH when flunixin is administered SC to lactating goats.
Due to a limited number of approved drugs available for treating goats in many countries, different classes of drugs licensed for sheep or cattle are extensively used in goats, in an extra-label fashion, without optimization of dosing regimens, determination of PK and pharmacodynamic (PD) properties, and estimated withdrawal intervals. It is generally acknowledged that plasma disposition and metabolism of anthelmintic drugs can be different between sheep and goats (31, 32). Previously reported PK parameters for sheep administered FM IV also differ from results from our study. Intravenous administration of FM to sheep yielded T1/2λz ranging from 2.5 to 3.8 h (33, 34), which were longer than those determined from our study's non-lactating goats, which ranged from 2.17 to 3.13 h. However, these T1/2λz for sheep administered FM IV were shorter than what we determined for lactating goats in our study (range of 4.35–4.56 h after IV administration).
Multiple age and reproductive status groups were incorporated into this study as the currently reported literature only demonstrated the PK of FLU in adult goats. In cattle administered FM, age was noted to alter PK parameters, primarily clearance being slower in calves at 2 months of age than at 8 months of age (26). A similar relationship was observed in the CL and CL/F in the group of young (nulliparous) does in this study (182 and 199 ml/kg/h) when compared to the older lactating does (265 and 365 ml/kg/h), but not when compared to the older pregnant non-lactating does (114 and 127 ml/kg/h). Specifically, when compared to the older pregnant non-lactating does, the younger nulliparous non-lactating does in our study demonstrated statistically significant differences, regardless of IV or SC route of administration, with CL and CL/F P values of 0.0019 and 0.0071, respectively. A higher CL and CL/F was noted in lactating does when compared to non-lactating does; this is a similar finding to flunixin clearance in lactating cattle (35). The extraction ratios appeared to vary between groups with NL pregnant does having a lower extraction ratio (1.44) than the younger nulliparous does or lactating does (2.08 and 3.55, respectively).
Part of this study's objective was to compare plasma concentrations determined by UPLC-MS/MS with concentrations quantified using commercial ELISA kit designed for bovine plasma. As reported in Table 3, no statistically significant differences were noted in concentrations determined by UPLC-MS/MS or ELISA from the goats within our study. This suggests that ELISA testing may be another useful approach for the determination of flunixin plasma concentration in goats, similar to what is reported for cattle (21). Future studies need to evaluate this diagnostic approach for caprine milk to determine if ELISA testing demonstrates similar results to plasma in this matrix. Additional testing modalities for flunixin in milk include lateral flow testing as determined for bovine milk, as well as gas chromatography coupled with mass spectrometry, which has also been identified as a suitable method for monitoring flunixin residues in goat milk (36–38).
In this study, SC FM injection sites were observed for swelling, heat, or pain. None of the goats administered FM SC in this study had adverse effects with respect to injection site reactions. For does in trial 3 (single dose, lactating does), they had an observed injection site score of 0 (no reaction) and 4 does had an injection site score of 1 (minimal reaction), with none of the scores of 1 lasting for longer than 48 h. All of the injection site scores resolved to 0 within 72 h. With this result, it appears that single SC doses of FM have minimal injection site reactions, whereas multiple SC doses would require monitoring by a producer or veterinarian. The lack of significant injection site reactions in these goats could be due to relative small drug volumes, location of injection, or undetermined factors. These results are promising since animal producers and handlers could administer the bovine IV formulation SC to goats for the treatment of pyrexia, provided the provisions of AMDUCA are met. Given that the Food Safety and Inspection Service (FSIS) has identified FM as an agent of high regulatory concern, any efforts to reduce the potential for residue violations would be beneficial for both producers and consumers of goat dairy products.
The methods for establishing withdrawal intervals presented in this manuscript provide an alternative method for estimating withdrawal intervals following extra-label drug use. In cattle, flunixin is one of the most common violative residues (4). Harmonization by the European Union allows for determination of milk residues by three methods: time to safe concentration, safe concentration based on linear regression, and safe concentration per milking (39). The data from our study do not represent those generated from a good laboratory practice study, nor do they meet the study design requirements of EMA or FDA for the drug approval process, but the regulatory statistical method provides a framework for estimating a conservative withdrawal interval following extra-label drug use. Part of the approach to our estimating the withdrawal intervals was to use a Monte Carlo simulation method to generate triplicate values for each milk sample as required by the FDA (40). By using the intra- and inter-assay coefficients of variation for the UPLC-MS/MS analytical method for milk, milk concentrations were simulated to fulfill the requirement of having triplicate values for each milk sample. The estimated milk withdrawal intervals were relatively close to the FDA-approved withdrawal time for dairy cattle when FM is administered. FM, as labeled for IV administration to dairy cattle in the United States, has a 36-h label milk withdrawal time when administered according to label directions. The current tolerance for 5-OH, the marker residue for flunixin in bovine milk in the United States, is 2 parts per billion (4). Similarly, the European maximum residue limit (MRL) is 4 parts per billion (41).
When the IV product is administered SC or intramuscularly to cattle, residues can be detected in the milk after 36 h, which is the withdrawal time for when the medication is administered IV, as indicated per label (29, 38). Our analysis suggests that using the EMA method estimated milk withdrawal intervals after SD IV, SD SC, and MD SC at 1.1 mg/kg dosing would be 36, 48, and 60 h, respectively. Similarly, using the FDA method, appropriate milk withdrawal intervals after SD IV, SD SC, MD IV, and MD SC at 1.1 mg/kg dosing would be 36, 36, 36, and 48 h, respectively. The estimated milk withdrawal intervals between the EMA and FDA methods were generally very similar. When rounding to the next milking interval assuming a 12-h milking interval, the estimated milk withdrawal intervals between the EMA and FDA methods were either the same (for SD IV) or different by only one milking interval (for SD SC and MD SC). Many studies report suggested milk withdrawal intervals based on a time concentration profile when milk residues are no longer detected. The challenge with these withdrawal interval suggestions are that they are based on a very small number of healthy study subjects. The advantage of our approach used in this study is that the FDA method reports when, with 95% confidence, 99% of animals will be free of residues (95% of animals for the EMA method). This approach to estimating a withdrawal interval recommendation following extra-label drug use is beneficial to clinicians since a greatly extended withdraw interval needs to be provided to assure food safety.
Additional research is necessary for the PD of flunixin in goats, and what effect, if any, SC administration has on PD. In a study evaluating transdermal FM in goats, the 80% inhibitory concentration was 0.28 μg/ml, but was only achieved with IV administration (27). In a study evaluating prostaglandin synthesis following IV, IM, and oral administration of FM to dairy goats, a decrease of prostaglandin plasma concentration was noted regardless of the method of administration of FM (17). Another study identified an inhibition of the generation of thromboxane B2 in goat blood when flunixin was added (42). One study noted higher pain scores in a control group compared to an epidural morphine-treated group in goats undergoing abdominal surgery; in that study, the control group pain scores were lowered by post-operative flunixin administration (43). In cattle, flunixin has been demonstrated to decrease inflammation, as well as pain from castration, disbudding, and lameness; however, limited PD data exist for flunixin in goats.
This study had several limitations. While the study population was distributed into multiple ages as well as lactation statuses and stages to simulate a commercial dairy setting, primarily only five breeds of dairy goat were represented in our study population. This study also used a relatively small number of healthy goats, and while this is commonly done for PK studies, recent research has questioned this practice for determining withdrawal intervals for flunixin in large diverse populations of cattle (44, 45). Since the design of this study does not meet the regulatory requirements of EMA or FDA, the estimated milk withdrawal intervals from this study can only serve as a preliminary recommendation. Additional studies that meet the EMA or FDA study requirements are needed in order to make a more conclusive scientifically based recommendation. The PK parameters in this study were from healthy goats, and caution would have to be used when applying estimated withdrawal intervals to milk samples from sick goats as disease could influence milk withdraw periods as well as milk production. The comparison of PK parameters based on age did not allow the same animals to serve as their own control. Milk elimination is prolonged in cattle with mastitis vs. healthy cattle (46). A prolonged elimination could pose a food safety risk as it would increase the potential for a violative drug residue. In other species, large variations in body size could necessitate dose adjustments based on an allometric function of body weight (47). This study also assumes that dairy goats are similar to cattle in that 5-OH is the major metabolite/marker residue, as 5-OH is the predominant residue with 4-OH flunixin and 2-OH methylflunixin being minor residues (48). Future studies could also incorporate non-linear mixed effects modeling and/or physiologically based pharmacokinetic (PBPK) modeling, as these techniques can account for variability for optimization of dosing schedules and serve as an additional tool for withdrawal time determination (49, 50).
Conclusions
The PK profile of SC FM described in this study including the similar elimination half-lives supports clinical evaluation of the SC administration of this drug for management of pain and inflammation in goats. ELISA testing of goat plasma for FLU concentrations may provide similar results to UPLC-MS/MS. Goat milk concentrations of FLU and 5-OH appear to be similar for both IV and SC routes of administration. After SC administration, a milk withdrawal interval of 36–60 h should be considered depending on the dose and dosing frequency. For dairy goats, SC FM may prove to be a clinically useful method of administration on the farm where allowed by appropriate extra-label drug use provisions.
Data Availability Statement
All datasets generated for this study are included in the article/supplementary material.
Ethics Statement
The animal study was reviewed and approved by Institutional Animal Care and Use Committee, University of California, Davis.
Author Contributions
JS was involved in study concept and design, data collection, flunixin analysis, data analysis, and manuscript preparation. JA participated in study concept and design, data collection, animal procurement, and manuscript preparation. ZL participated in milk withdrawal interval time modeling and calculation, as well as manuscript preparation. JR contributed to data collection and manuscript preparation. TM was involved in data collection and manuscript preparation. EL participated in data collection, animal procurement, and manuscript preparation. JC contributed to animal procurement and data collection. WS contributed to ELISA analysis and manuscript preparation. LT originated the study design and concept for using Monte Carlo simulation method for generating milk data points for FDA and EMA regulatory methods, sample collection, data analysis, and manuscript preparation. All authors have read and approved the final manuscript.
Funding
This work was supported by the USDA National Research Support Project−7 (Minor Use Animal Drug Program), the Food Animal Residue Avoidance Databank, and a UC Davis VMTH Resident Research Grant.
Conflict of Interest
The authors declare that the research was conducted in the absence of any commercial or financial relationships that could be construed as a potential conflict of interest.
Acknowledgments
We wish to thank Amy McGarvey and Scott Wetzlich for their skillful technical support. The authors thank Dr. David Smith (https://www.ars.usda.gov/people-locations/person/?person-id=5269) for his insightful and thorough review of this manuscript.
Abbreviations
Cmax, Maximum concentration (observed); CV, Coefficient of variation; CVMP, Committee for Veterinary Products for Medical Use; ELISA, Enzyme-linked immunosorbent assay; EMA, European Medicines Agency; FDA, Food and Drug Administration (USA); FLU, Flunixin; FM, Flunixin meglumine; IV, Intravenous; LOD, Limit of detection; LOQ, Limit of quantification; MD, Multiple dose; LC-MS/MS, Liquid chromatography mass spectrometry; NL, Non-lactating; NSAIDS, Non-steroidal anti-inflammatory drugs; PD, Pharmacodynamic(s); PK, Pharmacokinetic(s); SC, Subcutaneous; SD, Single dose; T1/2λz, Terminal elimination half-life; Tmax, Time to maximum concentration (observed); UPLC, Ultra-performance liquid chromatography; USA, United States of America; USDA, United States Department of Agriculture; 5-OH, 5-Hydroxy flunixin.
References
2. (NASS) NASS. Sheep and Goats. United States Department of Agriculture (2019). Available online at: https://downloads.usda.library.cornell.edu/usda-esmis/files/000000018/np193h05c/4t64gt965/shep0219.pdf (accessed March 22, 2020).
3. (NASS) NASS. Sheep and Goats. United States Department of Agriculture (2012). Available online at: https://downloads.usda.library.cornell.edu/usda-esmis/files/000000018/2f75rb60p/2v23vw85d/SheeGoat-01-27-2012.pdf (accessed March 22, 2020).
4. Sidhu PK, Gehring R, Mzyk DA, Marmulak T, Tell LA, Baynes RE, et al. Avoiding violative flunixin meglumine residues in cattle and swine. J Am Vet Med Assoc. (2017) 250:182–9. doi: 10.2460/javma.250.2.182
5. Register OotF. Title 21, Code of Federal Regulations, Part 530—EXTRALABEL DRUG USE IN ANIMALS. Government Publishing Office (2020). Available online at: https://www.ecfr.gov (accessed March 22, 2020).
6. Odensvik K, Gustafsson H, Kindahl H. The effect on luteolysis by intensive oral administration of flunixin granules in heifers. Anim Reprod Sci. (1998) 50:35–44. doi: 10.1016/S0378-4320(97)00090-0
7. Smith J, Klostermann C, Harm T, Breuer R, Kovalik DA, Bornkamp J, et al. Abomasal hamartoma in a La Mancha wether. Vet Rec Case Rep. (2017) 5:e000515. doi: 10.1136/vetreccr-2017-000515
8. Breuer R, Merkatoris P, Tepley S, Dierks C, Klostermann C, Flaherty H, et al. Treatment of cerebrospinal nematodiasis in a Boer Buck. Vet Rec Case Rep. (2019) 7:e000706. doi: 10.1136/vetreccr-2018-000706
9. Mavrogianni VS, Alexopoulos C, Fthenakis GC. Field evaluation of flunixin meglumine in the supportive treatment of caprine mastitis. J Vet Pharmacol Ther. (2004) 27:373–5. doi: 10.1111/j.1365-2885.2004.00590.x
10. Plummer PJ, Schleining JA. Assessment and management of pain in small ruminants and camelids. Vet Clin North Am Food Anim Pract. (2013) 29:185–208. doi: 10.1016/j.cvfa.2012.11.004
11. Mavangira V, Angelos JA, Samitz EM, Rowe JD, Byrne BA. Gangrenous mastitis caused by Bacillus species in six goats. J Am Vet Med Assoc. (2013) 242:836–43. doi: 10.2460/javma.242.6.836
12. Smith J, Kovalik D, Varga A. Rattlesnake envenomation in three dairy goats. Case Rep Vet Med. (2015) 2015:787534. doi: 10.1155/2015/787534
13. Kissell LW, Brinson PD, Gehring R, Tell LA, Wetzlich SE, Baynes RE, et al. Pharmacokinetics and tissue elimination of flunixin in veal calves. Am J Vet Res. (2016) 77:634–40. doi: 10.2460/ajvr.77.6.634
14. Anderson FL, Secombe CJ, Lester GD. Clostridial myonecrosis, haemolytic anaemia, hepatopathy, osteitis and transient hypertrophic cardiomyopathy after intramuscular injection in a Thoroughbred gelding. Aust Vet J. (2013) 91:204–8. doi: 10.1111/avj.12021
15. Odensvik K. Pharmacokinetics of flunixin and its effect on prostaglandin F2α metabolite concentrations after oral and intravenous administration in heifers. J Vet Pharmacol Ther. (1995) 18:254–9. doi: 10.1111/j.1365-2885.1995.tb00589.x
16. Odensvik K, Magnusson U. Effect of oral administration of flunixin meglumine on the inflammatory response to endotoxin in heifers. Am J Vet Res. (1996) 57:201–4.
17. Königsson K, Torneke K, Engeland IV, Odensvik K, Kindahl H. Pharmacokinetics and pharmacodynamic effects of flunixin after intravenous, intramuscular and oral administration to dairy goats. Acta Vet Scand. (2003) 44:153–9. doi: 10.1186/1751-0147-44-153
18. Musser JMB. Pharmacokinetics of flunixin in chickens after oral and intravenous administration. J Vet Pharmacol Ther. (2010) 33:312–4. doi: 10.1111/j.1365-2885.2009.01132.x
19. Kleinhenz M, Van Engen N, Smith J, Gorden P, Ji J, Wang C, et al. The impact of transdermal flunixin meglumine on biomarkers of pain in calves when administered at the time of surgical castration without local anesthesia. Livestock Sci. (2018) 212:1–6. doi: 10.1016/j.livsci.2018.03.016
20. Buur JL, Baynes RE, Smith G, Riviere JE. Pharmacokinetics of flunixin meglumine in swine after intravenous dosing. J Vet Pharmacol Ther. (2006) 29:437–40. doi: 10.1111/j.1365-2885.2006.00788.x
21. Shelver WL, Tell LA, Wagner S, Wetzlich SE, Baynes RE, Riviere JE, et al. Comparison of ELISA and LC-MS/MS for the measurement of flunixin plasma concentrations in beef cattle after intravenous and subcutaneous administration. J Agric Food Chem. (2013) 61:2679–86. doi: 10.1021/jf304773p
22. Toutain PL, Bousquet-Melou A. Plasma clearance. J Vet Pharmacol Ther. (2004) 27:415–25. doi: 10.1111/j.1365-2885.2004.00605.x
23. Smith JS, Borts DJ, Slagel CC, Rajewski SM, Bousquet-Melou A, Ferran AA, et al. Pharmacokinetics of Ertapenem in Sheep (Ovis aries) with experimentally induced urinary tract infection. Comp Med. (2019) 69:413–8. doi: 10.30802/AALAS-CM-18-000144
24. Smith JS, Coetzee JF, Fisher IWG, Borts DJ, Mochel JP. Pharmacokinetics of fentanyl citrate and norfentanyl in Holstein calves and effect of analytical performances on fentanyl parameter estimation. J Vet Pharmacol Ther. (2018) 41:555–61. doi: 10.1111/jvp.12501
25. Smith JS, Mochel JP, Borts DJ, Griffith RW. Effects of experimentally induced respiratory disease on the pharmacokinetics and tissue residues of tulathromycin in meat goats. J Vet Pharmacol Ther. (2019) 42:420–9. doi: 10.1111/jvp.12764
26. Kleinhenz MD, Van Engen NK, Gorden PJ, Smith JS, KuKanich B, Rajewski SM, et al. Effect of age on the pharmacokinetics and pharmacodynamics of flunixin meglumine following intravenous and transdermal administration to Holstein calves. Am J Vet Res. (2018) 79:568–75. doi: 10.2460/ajvr.79.5.568
27. Reppert EJ, Kleinhenz MD, Montgomery SR, Bornheim HN, Magnin G, Sidhu PK, et al. Pharmacokinetics and pharmacodynamics of intravenous and transdermal flunixin meglumine in meat goats. J Vet Pharmacol Ther. (2019) 42:309–17. doi: 10.1111/jvp.12756
28. Bublitz CM, Mzyk DA, Mays T, Fajt VR, Hairgrove T, Baynes RE. Comparative plasma and urine concentrations of flunixin and meloxicam in goats. Small Rumin Res. (2019) 174:40–6. doi: 10.1016/j.smallrumres.2019.01.013
29. Kissell LW, Smith GW, Leavens TL, Baynes RE, Wu H, Riviere JE. Plasma pharmacokinetics and milk residues of flunixin and 5-hydroxy flunixin following different routes of administration in dairy cattle. J Dairy Sci. (2012) 95:7151–7. doi: 10.3168/jds.2012-5754
30. Anderson KL, Neff-Davis CA, Davis LE, Bass VD. Pharmacokinetics of flunixin meglumine in lactating cattle after single and multiple intramuscular and intravenous administrations. Am J Vet Res. (1990) 51:1464–7.
31. Gokbulut C, Yalinkilinc HS, Aksit D, Veneziano V. Comparative pharmacokinetics of levamisole-oxyclozanide combination in sheep and goats following per os administration. Can J Vet Res. (2014) 78:316–20.
32. Short CR. Comparative pharmacokinetics–sorting the sheep from the goats. Vet J. (1999) 158:159–61. doi: 10.1053/tvjl.1999.0401
33. Welsh EM, McKellar QA, Nolan AM. The pharmacokinetics of flunixin meglumine in the sheep. J Vet Pharmacol Ther. (1993) 16:181–8. doi: 10.1111/j.1365-2885.1993.tb00162.x
34. Cheng Z, McKeller Q, Nolan A. Pharmacokinetic studies of flunixin meglumine and phenylbutazone in plasma, exudate and transudate in sheep. J Vet Pharmacol Ther. (1998) 21:315–21. doi: 10.1046/j.1365-2885.1998.00144.x
35. Kleinhenz MD, Gorden PJ, Smith JS, Schleining JA, Kleinhenz KE, Wulf LL, et al. Pharmacokinetics of multiple doses of transdermal flunixin meglumine in adult Holstein dairy cows. J Vet Pharmacol Ther. (2018) 41:490–3. doi: 10.1111/jvp.12490
36. Azzouz A, Jurado-Sanchez B, Souhail B, Ballesteros E. Simultaneous determination of 20 pharmacologically active substances in cow's milk, goat's milk, and human breast milk by gas chromatography-mass spectrometry. J Agric Food Chem. (2011) 59:5125–32. doi: 10.1021/jf200364w
37. Kissell LW, Baynes RE, Riviere JE, Smith GW. Occurrence of flunixin residues in bovine milk samples from the USA. Food Addit Contam Part A Chem Anal Control Expo Risk Assess. (2013) 30:1513–6. doi: 10.1080/19440049.2013.803604
38. Shelver WL, Smith DJ, Tell LA, Baynes RE, Schroeder JW, Riviere JE. Screening and confirmatory analyses of flunixin in tissues and bodily fluids after intravenous or intramuscular administration to cull dairy cows with or without lipopolysaccharide challenge. J Agric Food Chem. (2016) 64:336–45. doi: 10.1021/acs.jafc.5b04793
39. Chevance A, Jacques AM, Laurentie M, Sanders P, Henri J. The present and future of withdrawal period calculations for milk in the European Union: focus on heterogeneous, nonmonotonic data. J Vet Pharmacol Ther. (2017) 40:218–30. doi: 10.1111/jvp.12351
40. Medicine CfV. CVM GFI #207 (VICH GL48) Studies to Evaluate the Metabolism and Residue Kinetics of Veterinary Drugs In Food-Producing Animals: Marker Residue Depletion Studies to Establish Product Withdrawal Periods Office of Foods and Veterinary Medicine. Center for Veterinary Medicine (2015). FDA-2010-D-0166. Available online at: https://www.fda.gov/regulatory-information/search-fda-guidance-documents/cvm-gfi-207-vich-gl48-studies-evaluate-metabolism-and-residue-kinetics-veterinary-drugs-food (accessed March 22, 2020).
41. Dowling G, Malone E, Harbison T, Martin S. Analytical strategy for the determination of non-steroidal anti-inflammatory drugs in plasma and improved analytical strategy for the determination of authorized and non-authorized non-steroidal anti-inflammatory drugs in milk by LC-MS/MS. Food Addit Contam Part A Chem Anal Control Expo Risk Assess. (2010) 27:962–82. doi: 10.1080/19440041003706779
42. Galbraith EA, McKellar QA. Protein binding and in vitro serum thromboxane B2 inhibition by flunixin meglumine and meclofenamic acid in dog, goat and horse blood. Res Vet Sci. (1996) 61:78–81. doi: 10.1016/S0034-5288(96)90115-0
43. Hendrickson DA, Kruse-Elliott KT, Broadstone RV. A comparison of epidural saline, morphine, and bupivacaine for pain relief after abdominal surgery in goats. Vet Surg. (1996) 25:83–7. doi: 10.1111/j.1532-950X.1996.tb01382.x
44. Wu H, Baynes RE, Leavens T, Tell LA, Riviere JE. Use of population pharmacokinetic modeling and Monte Carlo simulation to capture individual animal variability in the prediction of flunixin withdrawal times in cattle. J Vet Pharmacol Ther. (2013) 36:248–57. doi: 10.1111/j.1365-2885.2012.01420.x
45. Li M, Cheng YH, Chittenden JT, Baynes RE, Tell LA, Davis JL, et al. Integration of Food Animal Residue Avoidance Databank (FARAD) empirical methods for drug withdrawal interval determination with a mechanistic population-based interactive physiologically based pharmacokinetic (iPBPK) modeling platform: example for flunixin meglumine administration. Arch Toxicol. (2019) 93:1865–80. doi: 10.1007/s00204-019-02464-z
46. Kissell LW, Leavens TL, Baynes RE, Riviere JE, Smith GW. Comparison of pharmacokinetics and milk elimination of flunixin in healthy cows and cows with mastitis. J Am Vet Med Assoc. (2015) 246:118–25. doi: 10.2460/javma.246.1.118
47. Lee CD, Maxwell LK. Effect of body weight on the pharmacokinetics of flunixin meglumine in miniature horses and quarter horses. J Vet Pharmacol Ther. (2014) 37:35–42. doi: 10.1111/jvp.12056
48. Feely WF, Chester-Yansen C, Thompson K, Campbell JW, Boner PL, Liu DD, et al. Flunixin residues in milk after intravenous treatment of dairy cattle with (14)C-flunixin. J Agric Food Chem. (2002) 50:7308–13. doi: 10.1021/jf0258609
49. Bon C, Toutain PL, Concordet D, Gehring R, Martin-Jimenez T, Smith J, et al. Mathematical modeling and simulation in animal health. Part III: Using nonlinear mixed-effects to characterize and quantify variability in drug pharmacokinetics. J Vet Pharmacol Ther. (2018) 41:171–83. doi: 10.1111/jvp.12473
50. Lin Z, Gehring R, Mochel JP, Lave T, Riviere JE. Mathematical modeling and simulation in animal health - Part II: principles, methods, applications, and value of physiologically based pharmacokinetic modeling in veterinary medicine and food safety assessment. J Vet Pharmacol Ther. (2016) 39:421–38. doi: 10.1111/jvp.12311
Keywords: flunixin meglumine, subcutaneous, goat, pharmacokinetics, milk, withdrawal interval
Citation: Smith JS, Marmulak TL, Angelos JA, Lin Z, Rowe JD, Carlson JL, Shelver WL, Lee EA and Tell LA (2020) Pharmacokinetic Parameters and Estimated Milk Withdrawal Intervals for Domestic Goats (Capra Aegagrus Hircus) After Administration of Single and Multiple Intravenous and Subcutaneous Doses of Flunixin Meglumine. Front. Vet. Sci. 7:213. doi: 10.3389/fvets.2020.00213
Received: 20 February 2020; Accepted: 31 March 2020;
Published: 19 May 2020.
Edited by:
Nora Mestorino, National University of La Plata, ArgentinaReviewed by:
Cengiz Gokbulut, Balikesir University, TurkeyMariana Florencia Lucas, Universidad del Salvador, Argentina
Copyright © 2020 Smith, Marmulak, Angelos, Lin, Rowe, Carlson, Shelver, Lee and Tell. This is an open-access article distributed under the terms of the Creative Commons Attribution License (CC BY). The use, distribution or reproduction in other forums is permitted, provided the original author(s) and the copyright owner(s) are credited and that the original publication in this journal is cited, in accordance with accepted academic practice. No use, distribution or reproduction is permitted which does not comply with these terms.
*Correspondence: Joe S. Smith, jss303@iastate.edu; animal197@gmail.com; Lisa A. Tell, latell@ucdavis.edu
†Present address: Joe S. Smith, Veterinary Diagnostic and Production Animal Medicine, Iowa State University, Ames, IA, United States
Tara L. Marmulak, Veterinary Teaching Hospital, Colorado State University, Fort Collins, CO, United States