Towards Country-Specific Nitrous Oxide Emission Factors for Manures Applied to Arable and Grassland Soils in the UK
 Rachel E. Thorman1*
  Fiona A. Nicholson1
  Cairistiona F. E. Topp2
  Madeleine J. Bell2
  Laura M. Cardenas3
  David R. Chadwick4
  Joanna M. Cloy2
  Tom H. Misselbrook3
  Robert M. Rees2 Catherine J. Watson5
  John R. Williams1
- 1ADAS Boxworth, Cambridge, United Kingdom
- 2Agriculture, Horticulture and Engineering Sciences, Scotland's Rural College (SRUC), Edinburgh, United Kingdom
- 3Rothamsted Research, North Wyke, Okehampton, United Kingdom
- 4School of Natural Sciences, Bangor University, Bangor, United Kingdom
- 5Agri-Environment, Agri-Food and Biosciences Institute, Belfast, United Kingdom
Nitrous oxide (N2O) emission factors (EFs) were calculated from measurements of emissions from livestock manures applied to UK arable crops and grassland as part of a wider research programme to reduce uncertainty in the UK national agricultural N2O inventory and to enhance regional inventory reporting through increased understanding of processes and factors controlling emissions. Field studies were undertaken between 2011 and 2013 at 3 arable and 3 grassland sites in the UK. Nitrous oxide emissions were measured following the autumn and spring application of different manures (pig slurry, cattle slurry, cattle farmyard manure (FYM), pig FYM, poultry layer manure, and broiler litter) at typical rates, using representative manure application and soil incorporation methods. In addition, ammonia emissions and nitrate leaching losses (1 site on a light sandy soil) were measured to calculate indirect N2O losses. IPCC comparable, direct N2O EFs ranged from −0.05 to 2.30% of total nitrogen applied, with the variability driven by a range of factors including differences in manure composition, application method, incorporation and climatic conditions. When data from the autumn applications were pooled, the mean N2O EF from poultry manure (1.52%) was found to be greater (P < 0.001) than from FYM (0.37%) and slurry (0.72%), with no difference found (P = 0.784) in the EF for bandspread compared with surface broadcast slurry application, and no effect (P = 0.328) of the nitrification inhibitor, Dicyandiamide (DCD). For the spring applications, the mean N2O EF for bandspread slurry (0.56%) was greater (P = 0.028) than from surface broadcast slurry (0.31%), but there were no differences (P = 0.212) in the mean N2O EFs from poultry manure (0.52%), slurry (0.44%), and FYM (0.22%). The study did confirm, however, that DCD reduced N2O emissions from slurries applied in the spring by 45%. EF data from this project have been used in the derivation of robust Tier 2 country specific EFs for inclusion in the UK national agriculture greenhouse gas inventory.
Introduction
Nitrous oxide (N2O) is a powerful greenhouse gas (GHG) with a global warming potential of 298 times that of carbon dioxide (IPCC, 2007). The UK has a legally binding domestic target to reduce GHG emissions by 80% below 1990 baseline levels by 2050 (DECC, 2009), although a more challenging target of net zero GHG emissions by 2050 was announced in 2019 (Committee on Climate Change, 2019).
The current UK GHG inventory (Brown et al., 2019) estimates that for 2017, 70% of N2O was produced from agricultural sources. The majority of this (65%) was directly emitted from agricultural soils e.g., following the application of livestock manure and manufactured nitrogen (N) fertilizer, crop residue incorporation, and from grazing returns via dung and urine (Brown et al., 2019). Drawing on global data from national GHG inventory submissions, livestock manures have been shown to be an important contributor to N2O emissions, comprising up to 36% (mean 11%) of the total agricultural N2O emission (Figure 1). In the UK for 2013, i.e., prior to the use of country specific EFs in the inventory calculations, the contribution from manures applied to soils was estimated to be 5.3% of the total N2O emission from agriculture (MacCarthy et al., 2015).
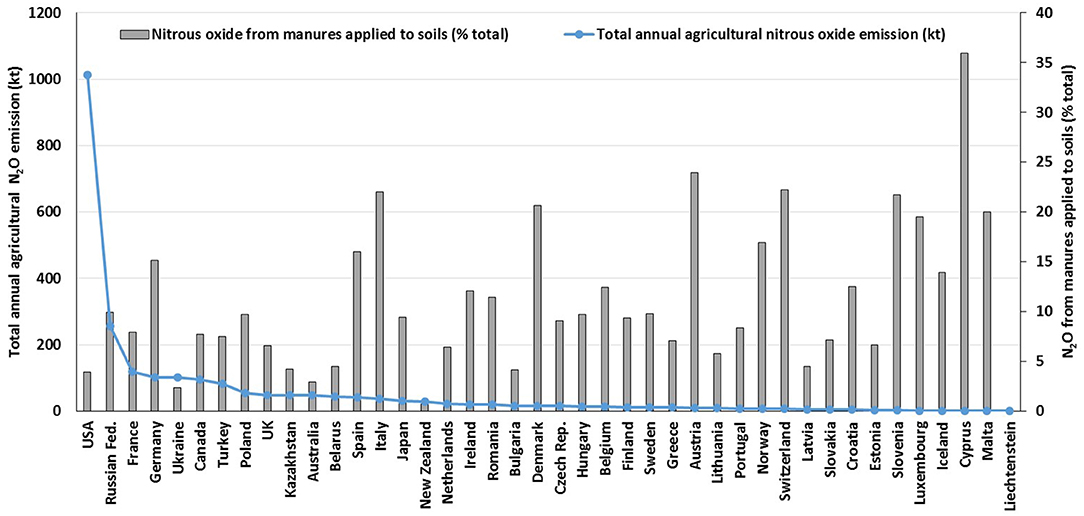
Figure 1. Annual (2016) agricultural N2O emissions and direct N2O emissions from manure applied to soils, expressed as a percentage of the total agricultural N2O emission, from different nations (source: UNFCCC, 2018).
In soils, N2O production is predominantly carried out by microbial nitrification and denitrification (Baggs, 2011; Butterbach-Bahl et al., 2013). There are many factors which may affect N2O emission from manure following application to land including application timing and method of incorporation, manure composition, soil type, temperature, and rainfall (Chadwick et al., 2011). A review of N2O mitigation options for manure management (Montes et al., 2013) reported that whilst incorporating or injecting manures into the soil is very effective in reducing ammonia (NH3) emissions, it can leave more N susceptible to loss as N2O, a finding confirmed by Velthof et al. (2003) and more recently by Duncan et al. (2017) for dairy slurry applications. Carbon (C) added to soil through manure application can stimulate denitrification and also speed up soil respiration, depleting oxygen in soil pores, and triggering denitrification and release of N2O (Paul et al., 1993; Clemens and Huschka, 2001; Lazcano et al., 2016). Pre-treating manure by solid separation or anaerobic digestion reduces the amount of degradable C applied in a single application to the soil and hence tends to decrease N2O emissions relative to untreated manure (Montes et al., 2013). High N2O emissions (via denitrification) are favored by wet (anaerobic) conditions (Firestone and Davidson, 1989), so manure application to very wet soils or before heavy rainfall should be avoided. Maintaining soil at pH 6.5 and above has also been shown to help reduce N2O emissions (Mkhabela et al., 2006). Many studies have demonstrated that nitrification inhibitors (NIs), such as dicyandiamide (DCD), can reduce N2O emissions (e.g., Gillingham et al., 2012; Gilsanz et al., 2016; Chadwick et al., 2018), however, their efficacy in practice has been shown to depend on a number of external factors such as temperature, moisture, and soil properties including clay and organic matter content (Montes et al., 2013; McGeough et al., 2016).
In theory, the derivation of livestock manure N2O EFs should account for the most important factors that control the total (annual) emission. However, due to the quantity of data required, it is not possible to determine EFs for each combination of manure management, soil, and system factors; instead, EFs should represent a defined subset of conditions that result in N2O emissions of a different order of magnitude from another subset of conditions. For example, season of application (Krol et al., 2016), application method (Velthof and Mosquera, 2011), soil texture (Rochette et al., 2018), and available nitrogen content (van der Weerden et al., 2016) are important management factors that affect subsequent N2O emissions.
The Intergovernmental Panel on Climate Change (IPCC) Tier 1 methodology sets a single default N2O EF for manures of 1% of total N applied (IPCC, 2006), although following a refinement to the IPCC method this has recently been disaggregated to 0.6 and 0.5% of total N applied in wet and dry climates, respectively (IPCC, 2019). However, a recent global meta-analysis by Zhou et al. (2017) reported a much higher overall mean N2O EF for manure application of 1.83 ± 0.30% (n = 146) and noted that the EF for manure was on average c.33% greater than that for manufactured N fertilizer. Similarly, Velthof et al. (2003) found high N2O emissions associated with manures with high inorganic N, easily mineralizable N and easily mineralizable C, such as liquid pig manure (EF 7.3–13.9%). The EF for cattle slurries ranged from 1.8 to 3.0% and for poultry manures from 0.5 to 1.9% Velthof et al. (2003). In contrast, a recent global meta-analysis (Charles et al., 2017) identified three groups of organic materials with similar N2O EFs: the high-risk group included animal slurries, waste waters and biosolids (mean EF 1.21%); the medium-risk group included solid manure, composts + fertilizers, and crop residues + fertilizers (mean EF 0.35%); and the low-risk group included composts, crop residues, paper mill sludge and pellets (mean EF 0.02%). The EF depended on the composition of the material (C/N ratio), soil properties (texture, drainage, organic C and N) and climatic (precipitation) factors. For example, EFs were on average 2.8 times greater in fine-textured than coarse-textured soils. The authors recommended that EFs should be site-specific and should account for organic material composition, soil characteristics, climate conditions, and whether the organic amendment is applied alone or in combination with manufactured N fertilizers.
There is little information to verify if the Tier 1 IPCC default values are valid for UK manures and climatic conditions, or whether it would be possible or appropriate to assign a different EF for the UK or indeed a range of values (e.g., for different manure types). Several countries have, however, moved to a Tier 2 approach using country specific manure EFs (Canada, Japan, The Netherlands and New Zealand), whereas the USA has moved to a Tier 3 approach using the DayCent model to estimate N2O emissions. Clearly changing the EF value has important implications for the contribution of manures to the N2O inventory total and consequently the ability to achieve GHG reduction targets.
This study was part of a UK-wide project to reduce some of the uncertainty in the UK agricultural N2O inventory through the generation of robust and experimentally derived Tier 2 EFs in compliance with the requirements of the IPCC (2000). A central component of the project was the establishment of a network of linked experimental sites designed to generate evidence to underpin regionally specific EFs for standard agricultural management practices. The work was intended to provide manure EFs where data was lacking, with the results being combined with those from other studies to potentially generate new manure EFs to use in the UK GHG inventory (Brown et al., 2019). This paper reports the results from the experimental sites where manures (cattle slurry, cattle farmyard manure (FYM), pig slurry, pig FYM, poultry layer manure and broiler litter) were applied over two cropping seasons (2011/12 and 2012/13) to derive N2O EFs for manures and, as a secondary objective, to test the efficacy of potential mitigation methods (i.e., alternative manure application methods and the use of a nitrification inhibitor).
Materials and Methods
Experimental Sites
The experimental study sites (Table 1; Figure 2) were chosen to augment data from previous UK studies, so that the principal geoclimatic zones supporting agricultural production (arable and grassland) in the UK were represented. Sites were selected which had no manure applications or grazing 6 months prior to establishment of the experiment.
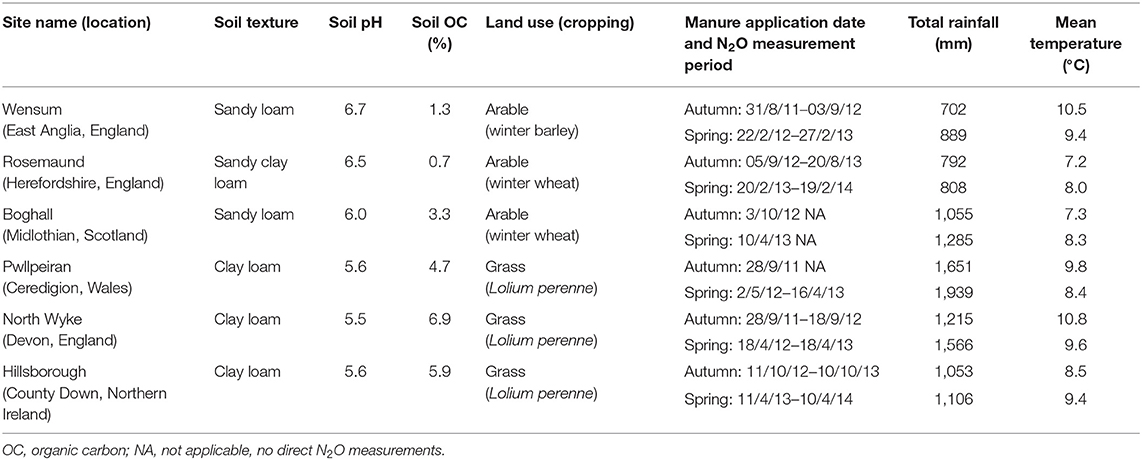
Table 1. Details of the experimental sites, including soil properties, total rainfall, and mean air temperature over the measurement period.
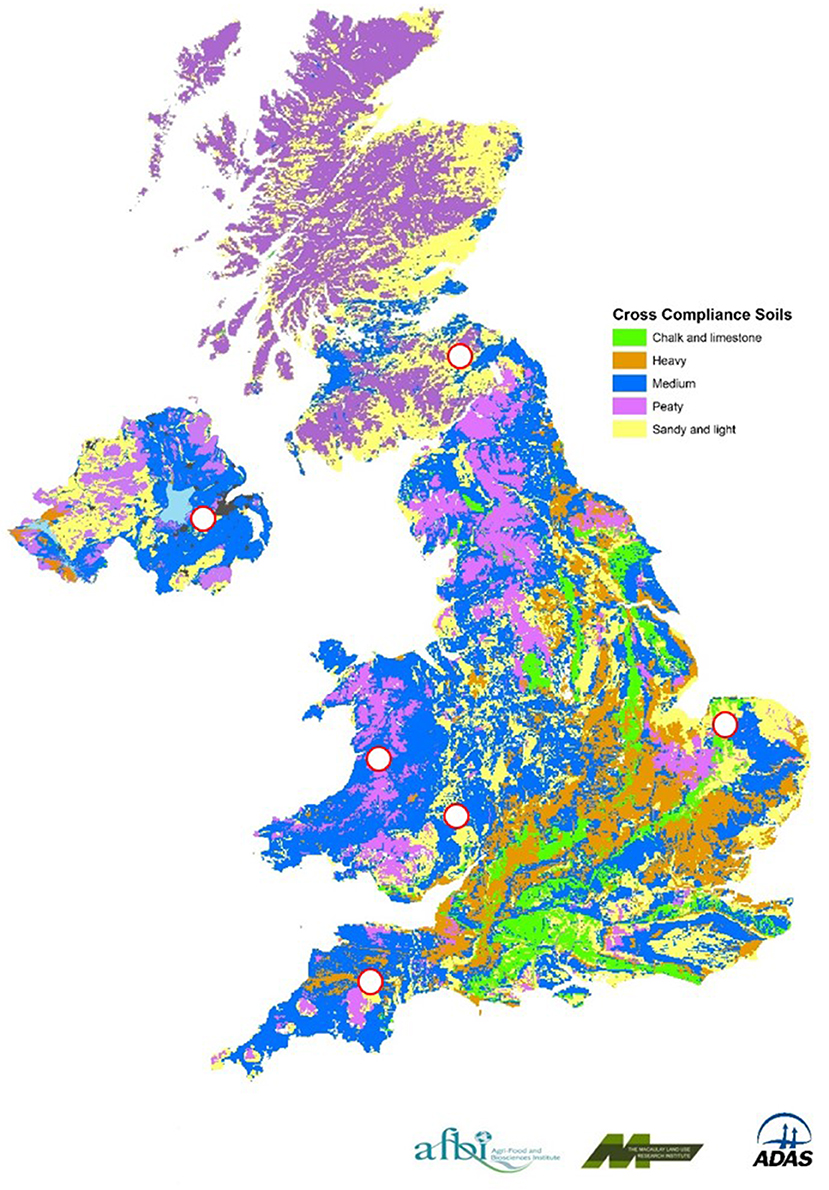
Figure 2. Map showing the locations and soil types of the experimental sites.
The 15 experiments were conducted by four measurement teams, from different UK organizations, ADAS, AFBI, Rothamsted Research, and SRUC. A joint experimental protocol was agreed to ensure that the manure management, chamber deployment, and ancillary measurements were made in a consistent fashion.
At the arable sites a cereal crop was planted after manures were applied in the autumn, for harvest the following year. In the spring, the manures were top-dressed to the growing cereal crop. At the managed grassland sites, grass was grown for silage (Table 1). No manufactured N fertilizer was applied to any of the manure treatments. To prevent any other nutrient deficiencies, overall basal P, K, and Mg fertilizers and S were applied according to site requirements following recommended practice (Anon, 2010). Other agro-chemicals were applied as needed and according to good agricultural practice to control weeds, pests and diseases.
Manures and Treatments
Livestock manures were applied in autumn and spring using application and soil incorporation methods representative of those in the UK (Table 2) and with timings and application rates that complied with Nitrate Vulnerable Zone (NVZ) guidance (Defra, 2015). So that manure composition for autumn and spring application timings were as similar as possible, the manures were sourced locally for each site and stored over-winter; slurry in tanks and solid manure in heaps either in an undercover storage area or covered by plastic sheeting. Livestock manure application rates (Table 2) were based on the total N content of the supplied materials ensuring that the crop available N applied did not exceed crop N requirements (Anon, 2010; SRUC, 2013). The slurry applications were made using a specially designed small plot applicator (Wensum, Rosemaund, Pwllpeiran) or by hand using modified watering cans (Boghall, North Wyke, Hillsborough). The solid manures were forked onto the plots from pre-weighed barrels to simulate surface broadcast application. At the arable sites, FYM was surface broadcast and not incorporated into the soil after application. Poultry manures were also surface broadcast, and in order to comply with NVZ guidance, those applied in autumn were incorporated into the soil using a power harrow within 24 h of application (Defra, 2015; Table 2). Slurry was either surface broadcast or bandspread at a spacing of 30 cm between bands. Slurry which was surface broadcast in autumn was also incorporated by power harrowing within 24 h of application, to comply with NVZ regulations (Defra, 2015; Table 2). At the grassland sites at both application timings, the FYM was surface broadcast and the slurry was either surface broadcast or bandspread at a spacing of 20 cm between bands (Table 2).
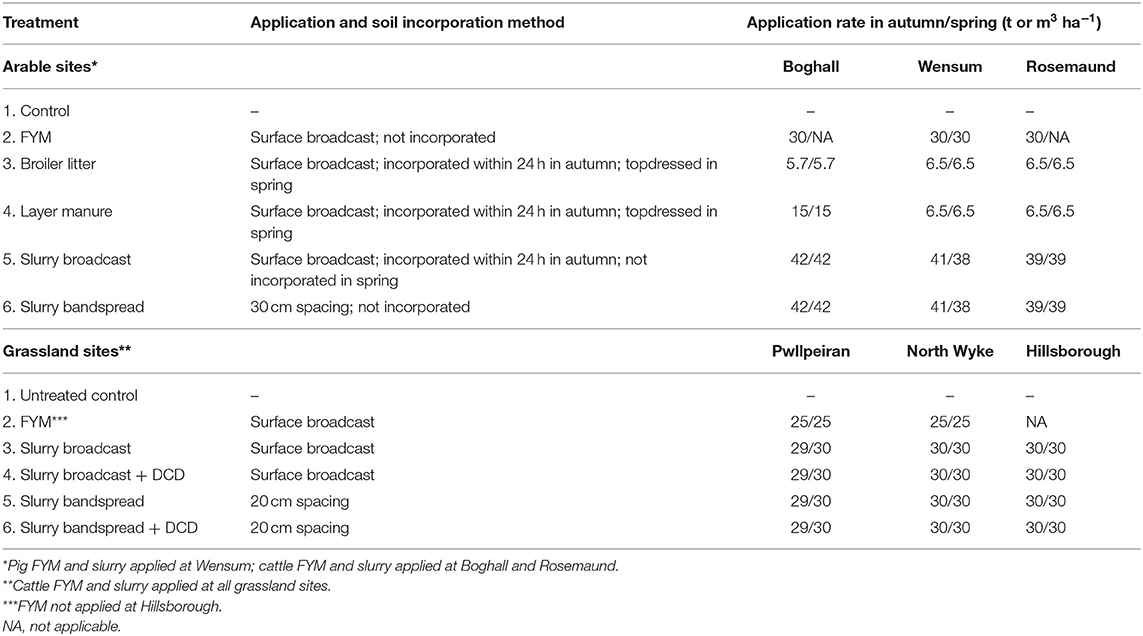
Table 2. Manure treatments and application rates.
At the grassland sites, dicyandiamide (DCD—a nitrification inhibitor) was applied to selected slurry treatments (Table 2) as a 1% solution (i.e., 10 g/1,000 ml) at a recommended rate equivalent to 10 kg ha−1 DCD (i.e., 1,000 l/ha of 1% solution) (Di et al., 2007). Due to logistics, the DCD solution was applied separately to the slurry application, using calibrated spray equipment within 1 h of slurry application.
There were three replicates of each treatment. For practical reasons associated with the use of wind tunnels for measuring NH3 emissions, the spring and autumn treatments at each site were grouped together (each group with an untreated control) but arranged in a randomized block design within each group (Supplementary Figure 1). Plot sizes were 2–6 m wide and 12–24 m long, depending on the site.
Soil and Manure Analysis
Topsoil samples (0–7.5 cm for grassland sites; 0–15 cm for arable sites) were taken from each block prior to any organic material applications. The soil was thoroughly mixed and soil texture, pH, organic C (Table 1) and a range of other soil properties were determined (not reported here).
A representative sample of each livestock manure was taken from each block at spreading (c.2 l for liquid manures and c.2 kg for solid manures) and analyzed for dry matter, pH, total N, ammonium-N (-N), nitrate N (-N), uric acid N (poultry manures only), and total organic C (Modified Walkley-Black method) using standard methods (Anon, 1986).
N2O Flux Measurements
Direct N2O emissions were measured from the sites and application timings in Table 1. Measurements were taken using the non-steady state static chamber technique (Bell et al., 2016a; Nicholson et al., 2017a; Cardenas et al., 2019), from three replicate plots per treatment, using 5 un-vented chambers per plot (giving a total of 15 chamber measurements per treatment). Chamber dimensions were 40 × 40 × 25 cm (high), giving a soil surface area coverage of 0.16 m2. Immediately after manure application, the chambers were installed to a depth of c. 5 cm and remained in place throughout the experiment, except during soil cultivations and harvest. Chambers were positioned over slurry bands to ensure representative coverage of slurry bands and “clean” areas. The chambers were designed to completely enclose growing arable crops and grassland, without damage, with 25 cm chamber extensions fitted to enable measurements to be taken from mature cereal and grass crops.
On each sampling occasion, the chambers were covered for at least 40 min before the headspace was sampled (T40). Ten samples of ambient air (5 at the beginning and 5 at the end of the chamber measurement period) were taken to represent the chamber headspace concentration at time zero (T0). The samples were transferred to pre-evacuated 20 ml glass vials, transported to the laboratory and analyzed by gas chromatography. Samples from the Wensum, Rosemaund, and Pwllpeiran sites were analyzed using a Perkin Elmer Clarus 580 gas chromatograph (GC) and TurboMatrix 110 headspace auto-sampler. The GC was fitted with two identical Perkin Elmer Elite-Plot Q capillary separation columns, each being 30 cm in length and 0.53 internal diameter which operated at 30°C. An electron capture detector (ECD) was employed and was set at 375°C with nitrogen as the carrier gas. Similar systems were used at the other sites and are described in McGeough et al. (2016) and Cardenas et al. (2019). The N2O flux was calculated using an assumed linear increase in headspace N2O concentration from T0 to T40 (Chadwick et al., 2014). To verify the assumption of linear gas accumulation within a chamber's headspace, “linearity checks” were carried out where 3 chambers were selected on each sampling occasion from which a time series of headspace samples was taken every 10 or 15 min up to 60 min after closure.
Sampling was normally conducted between 10 a.m. and 2 p.m., and where possible between 10 a.m. and 12 p.m., as previous studies have shown that emissions at this time of day approximate to the average diurnal emission rate (IPCC, 2000; Rochette et al., 2015). Data from previous UK studies have indicated that c.75% of total direct N2O emissions are likely to occur in the first 4–6 weeks following slurry application (Defra, 2006, 2007). Therefore, our sampling strategy was weighted accordingly, with c.50% of sampling events carried out during the (likely) period of highest N2O fluxes (i.e., 4–6 weeks after application), giving a total of at least 30 measurements over the 12-month monitoring period (Nicholson et al., 2017a; Chadwick et al., 2018, Cardenas et al., 2019). Specifically, sampling frequency was 5 times a week in the first 2 weeks following manure application, twice a week in the next 2 weeks and then 1 sample every other week for 5 months. Monthly sampling then followed until the end of the measurement period.
Annual cumulative N2O emissions were calculated using the mean flux from the 5 chambers per plot and the trapezoidal rule (Cardenas et al., 2010), which were then used in the subsequent analysis. Nitrous oxide EFs were calculated by subtracting the fluxes on the control plots from the manure treatments and expressing this as the percentage of the total-N applied in the manure and as a percentage of the manure total-N remaining after NH3 loss. The N supplied by the DCD was accounted for in the total N application value (Tables 8, 9).
Indirect N2O Emissions
A modified wind tunnel technique (Misselbrook et al., 2014; Nicholson et al., 2017a), based on the design developed by Lockyer (1984), was used to assess NH3 emissions from the livestock manure treatments at all the sites. Absorption flasks (containing 80 ml of 0.02 M orthophosphoric acid) were changed after 1, 3, 6, and 24 h and then daily for between 7 (slurries and FYM) and 21 (poultry manures) days. For each sampling period, the loss of NH3 from beneath each tunnel was calculated as the product of air flow through the tunnel and the difference between the concentrations of NH3 in the air entering and leaving the tunnel. Indirect N2O emissions from NH3 volatilization and redeposition were estimated from the measured NH3 losses using the IPCC default value for the fraction of volatilized N lost as N2O-N (1%; IPCC, 2006).
At the Wensum site, nitrate () leaching losses were measured from the plots receiving autumn manure applications, using porous ceramic cups (5 per plot to a depth of 90 cm) (Lord and Shepherd, 1993). Soil water samples were collected every 2 weeks or after 50 mm drainage, whichever occurred sooner, throughout the drainage period and analyzed for -N and -N using standard methodologies (Anon, 1986). Drainage estimates were obtained using IRRIGUIDE (Bailey and Spackman, 1996) and were combined with the pollutant concentration data to calculate N losses in drainage water. The fraction of leached N lost as N2O-N was calculated using the IPCC default value of 0.75% (IPCC, 2006).
Nitrate leaching losses at all sites other than Wensum were estimated from values of FracLeach used in the UK Inventory Report (i.e., 30% for arable and 10% for grassland; Brown et al., 2019) and the fraction of leached N lost as N2O-N (0.75%) (IPCC, 2006). Nitrate leaching losses from the spring application timings were assumed to be zero.
Weather Data
Daily rainfall and mean air and soil temperature data (at 5 cm depth) were measured at each site or were obtained from a nearby meteorological station (Tables 1, 3).
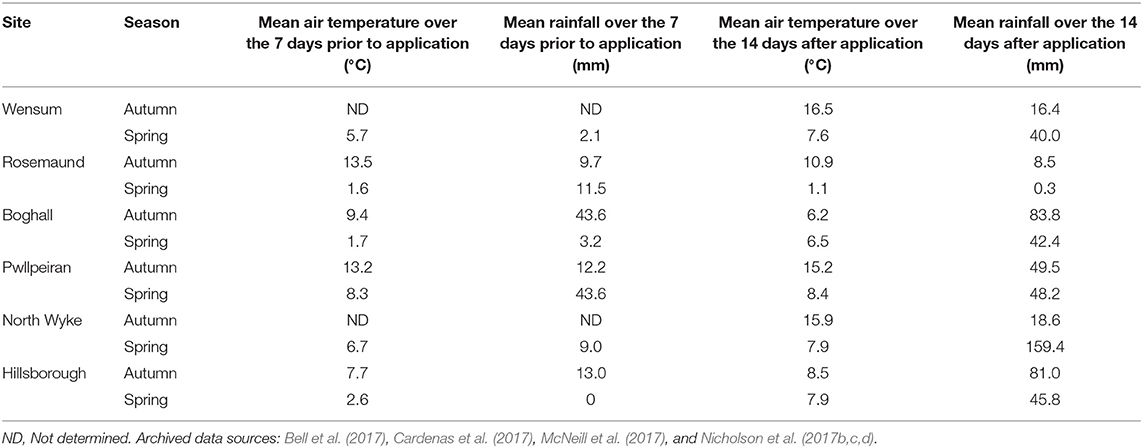
Table 3. Weather data for the different sites and application timings.
Statistical Analysis
The mean and the standard error of the mean were calculated per site per treatment for the cumulative annual N2O emissions, annual N2O EFs and NH3 emissions (% total-N applied). The statistical analysis of the emissions data was performed separately, treating the autumn and spring application timings as independent experiments due to the differences in incorporation of the manure between the seasons, and because the treatments were randomized within the spring and autumn groupings (Supplementary Figure 1). The analysis focused on assessing the effect of manure treatment and application method on annual N2O, NH3, and leaching EFs (as % of total N applied). The comparison between treatments and application methods were conducted using a mixed model and the restricted maximum likelihood (REML) algorithm. The Wald statistic was used to assess the effects of application method nested within manure type. The random effects, which account for the design of the experiment, were site/block. All the data were assessed for normality. In the case of the NH3 emissions, the data were transformed using the square root function and because of some negative emissions, 0.6 was added to the measurements before applying the transformation. The leaching data for Wensum was also analyzed using REML. A separate analysis of the effect of DCD application and method of slurry application to grassland was also assessed using a mixed model and REML algorithm. Genstat 19.1 (VSN International, 2018) was used for all the data analysis, and differences were considered significant for P < 0.05.
Additionally for N2O, the “linearity check” data was inspected and revealed that on sampling days when there were medium-high (>10 g N2O-N ha−1 d−1) N2O fluxes (Conen et al., 2000), the mean percentage of cases where the increase in N2O concentration within the chamber headspace was linear (R2 > 0.9) (Guardia et al., 2016) was 86%, ranging from 67% from the spring application at the North Wyke site to 100% following the spring application at Rosemaund.
Further information relating to these experiments can be found in the archived data sources of the UK's Agricultural and Environmental Data Archive (http://www.environmentdata.org/): Bell et al. (2017), Cardenas et al. (2017), McNeill et al. (2017), and Nicholson et al. (2017b,c,d).
Results
Manure Analysis
The poultry manures (layer and broiler) had the highest dry matter contents (45–56%), followed by the FYM (21%) and livestock slurry (4%) (Table 4). The total N concentrations followed a similar pattern with poultry manures containing 24–31 kg N t−1, FYM 6 kg N t−1, and slurry 2 kg N t−1, although the slurry had the highest proportion of total N (59%) in a readily available form (i.e., ammonium-N; plus uric acid-N for poultry manure) and the FYM the lowest (3%). The organic C concentrations of the manures were in the order, broiler litter (185 kg t−1) > layer manure (105 kg t−1) > FYM (69 kg t−1) > slurry (12 kg t−1).
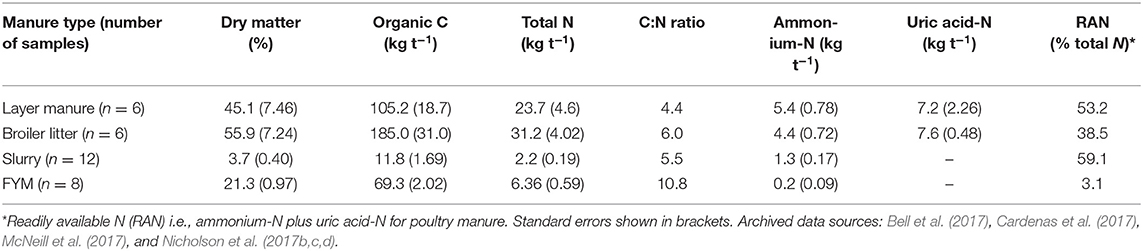
Table 4. Mean manure analysis across all sites (fresh weight basis).
Weather
The total rainfall over the experimental measurement period ranged from 702 to 1,651 mm following the autumn applications, and from 808 to 1,939 mm following the spring applications (Table 1). The mean air temperature over the same periods ranged from 7.2 to 10.8°C and 8.0 to 9.6°C following the autumn and spring applications, respectively. The experimental sites, however, experienced a wide range of climatic conditions around the time of manure application (Table 3). Mean rainfall over the 14 days after application ranged from 0.3 mm in the spring at Rosemaund to 159.4 mm in the autumn at North Wyke. Whilst the mean air temperature over the 14 days after manure application ranged from 6.2°C at Boghall to 16.5°C at Wensum in autumn, and from 1.1°C at Rosemaund to 8.4°C at Pwllpeiran in spring. Over the 7 days prior to spring application, the mean air temperature at all sites was <8.5 and <3°C at Rosemaund, Boghall, and Hillsborough.
Ammonia Emissions
Mean NH3 emissions across all the sites, timing, and treatments ranged from <1 to 48 kg N ha−1 (Tables 5, 6). For the autumn applications, there was no difference in the NH3 loss (expressed as % total N applied) between the broadcast and bandspread slurry application methods. However, there were significant differences (P < 0.001) between the manure types, with losses from FYM and poultry manure significantly lower than those from slurry (Table 7). For the spring applications, losses from the broadcast applied slurry were significantly higher (P = 0.046) than those from the bandspread slurry (Table 7). There were also significant differences (P < 0.001) between the other manure types (Table 7), with the lowest losses again measured from FYM and the highest from slurry. At the grassland sites there was no effect of DCD on NH3 loss following either the autumn (P = 0.525) or spring (P = 0.468) application timings (data not shown).
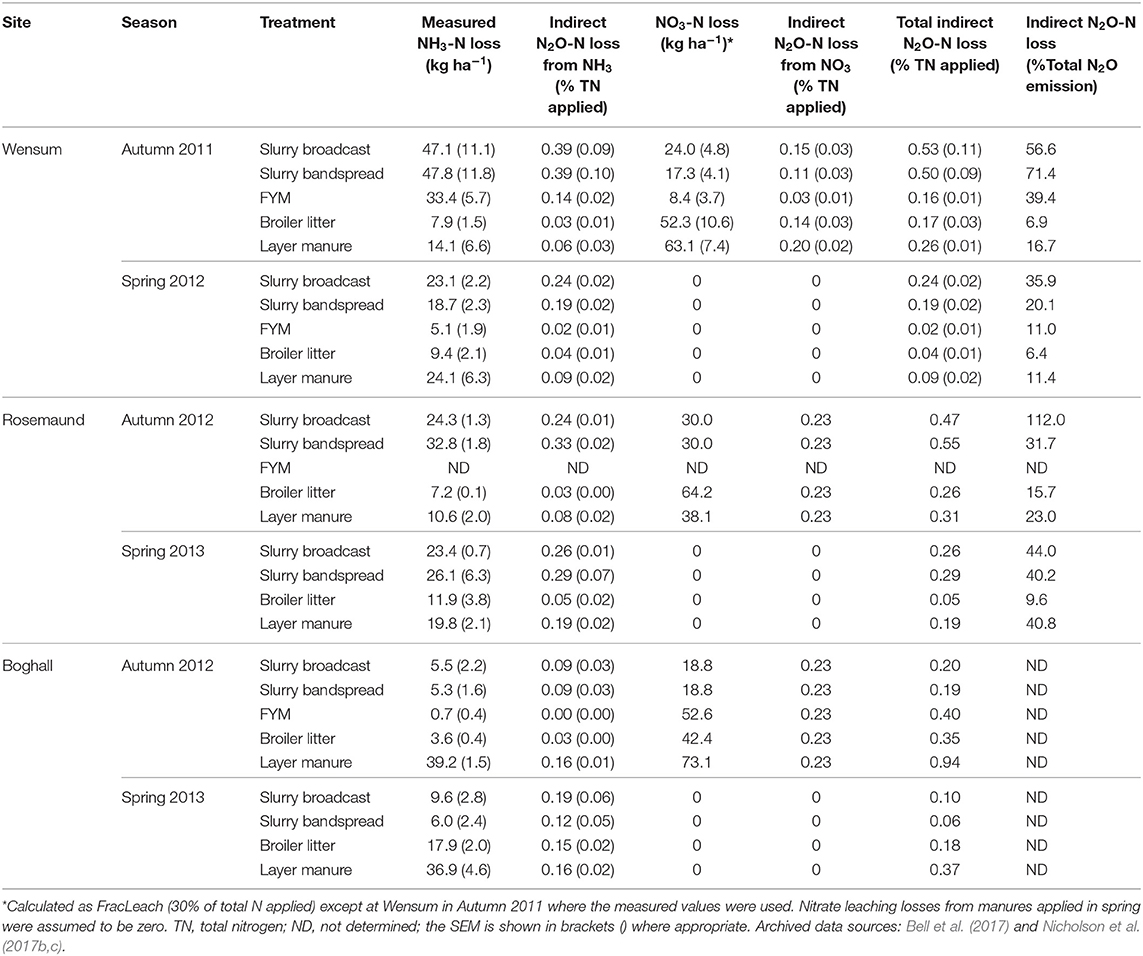
Table 5. Mean NH3 volatilization and NO3 leaching losses and calculated indirect N2O emissions at the arable sites.
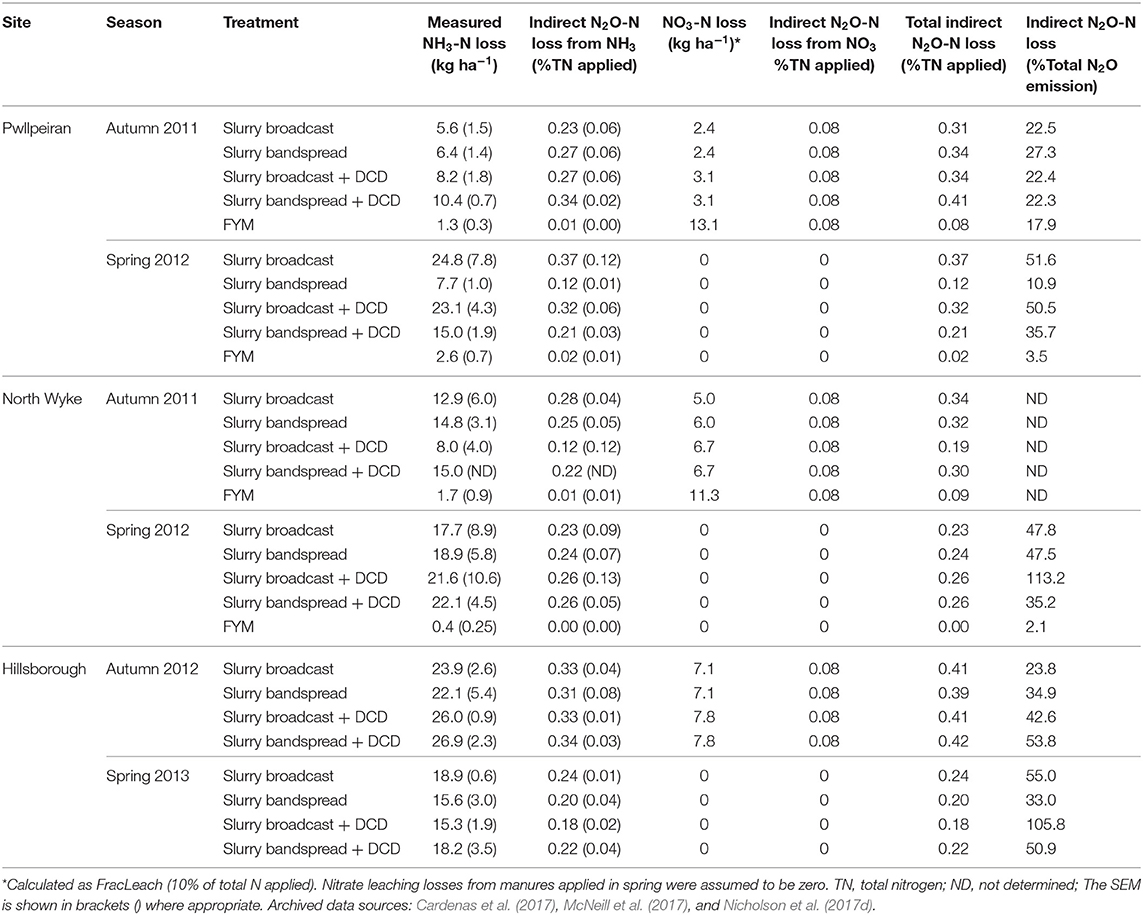
Table 6. Mean NH3 volatilization and NO3 leaching losses, and calculated indirect N2O emissions at the grassland sites.
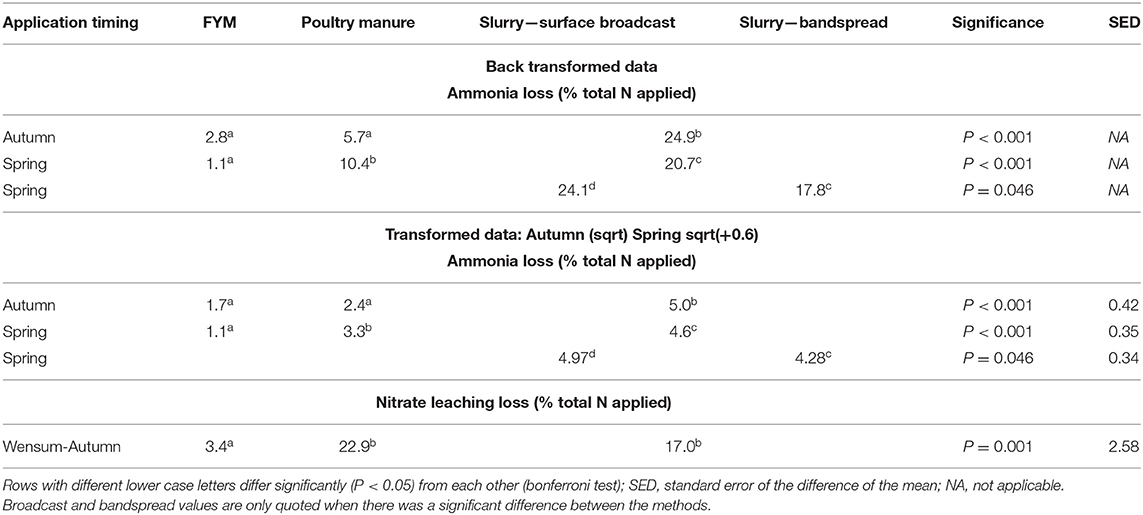
Table 7. Ammonia losses from the autumn and spring manure applications at all sites, and nitrate leaching losses following autumn manure applications at Wensum.
Direct Nitrous Oxide Emissions and Emission Factors
Mean direct N2O emissions across all the sites, timings, and manure treatments ranged from −0.28 to 8.0 kg N2O-N ha−1 (Tables 8, 9), with the highest emission from the broiler litter application to arable land at Wensum in autumn 2011 and the lowest emission from slurry broadcast with DCD applied to grass at Hillsborough in spring 2013. When these losses were expressed as IPCC comparable 12-month EFs (i.e., as the percentage of the total N applied with the manure), they ranged from −0.05% from the broadcast slurry applied to arable land at Rosemand in autumn 2012 to 2.30% from the broiler litter applied to arable land at Wensum in autumn 2011 (Tables 8, 9). Taking into account the NH3-N lost from the manure N applied, the N2O losses (i.e., as the percentage of the total manure N applied remaining after NH3 loss) ranged from −0.05% from the broadcast slurry applied to arable land at Rosemand in autumn 2012 to 3.18% from the bandspread slurry applied to grassland at Pwllpeiran in autumn 2011 (Tables 8, 9). The mean overall N2O emission from the control (i.e., zero N applied) treatments at the arable sites was 1.57 kg N2O-N ha−1 ranging from 0.95 to 2.06 kg N2O-N ha−1, whereas for the grassland sites the mean emission was 0.49 kg N2O-N ha−1 ranging from 0.25 to 0.78 kg N2O-N ha−1.
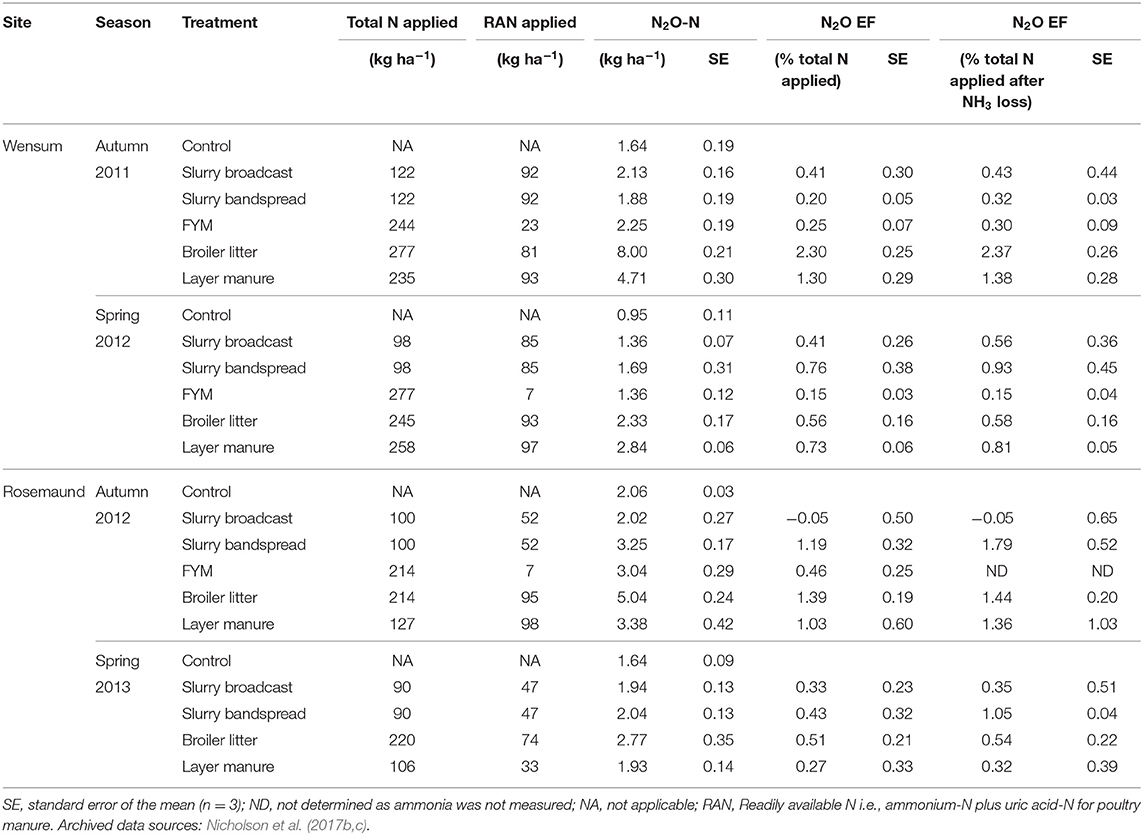
Table 8. Manure nitrogen applied, mean annual N2O emissions and emission factors (EFs) at the arable sites.
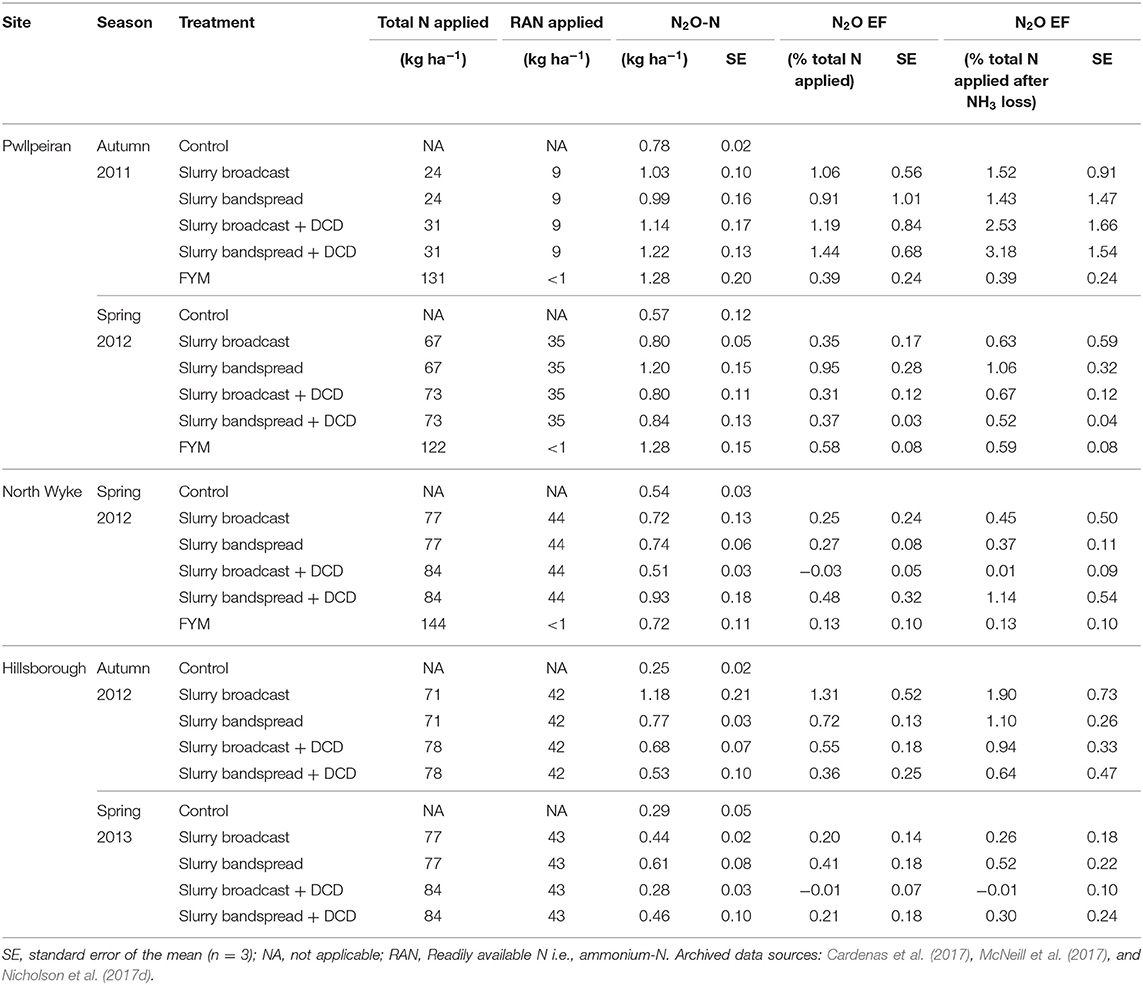
Table 9. Manure nitrogen applied, mean annual N2O emissions and emission factors (EFs) at the grassland sites.
Following the autumn treatment applications the EF (% total-N applied) for poultry manures (1.52%) was significantly (P < 0.001) higher than the EF for both slurry and FYM (Table 10), and although the EF for slurry (0.72%) was twice that from FYM (0.37%), there was no significant difference between the EFs. At this application timing, emissions from poultry manures were found to continue for longer following spreading compared with FYM and slurry (Figure 3). For the spring applications, the EF (% total-N applied) for bandspread slurry (0.56%) was higher (P = 0.028) than for surface broadcast slurry (0.31%), whilst there was no difference (P = 0.328) between the EFs for FYM (0.24%), poultry manures (0.52%), and for slurry (0.44%). Although the data from the autumn and spring application timings were analyzed separately, it was apparent that generally the trend was for higher N2O EFs (% total-N applied) in the autumn than in the spring (Figure 4).
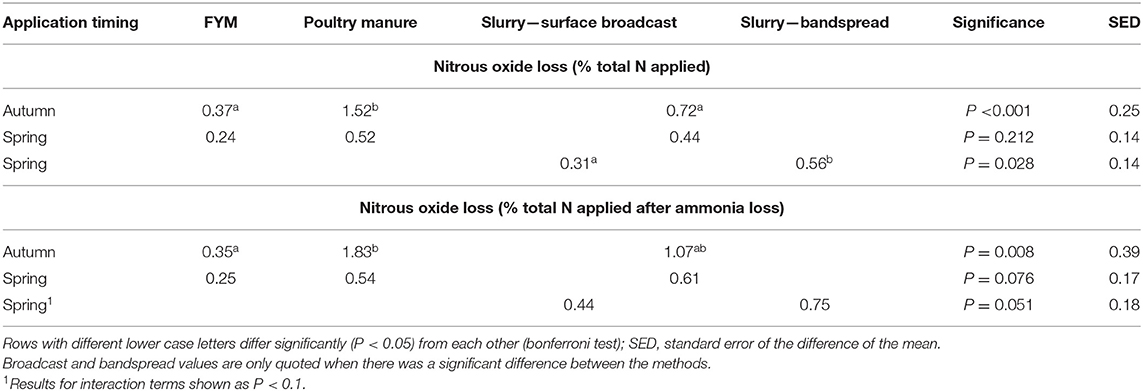
Table 10. Mean direct nitrous oxide losses from the autumn and spring manure applications at the arable and grassland sites.
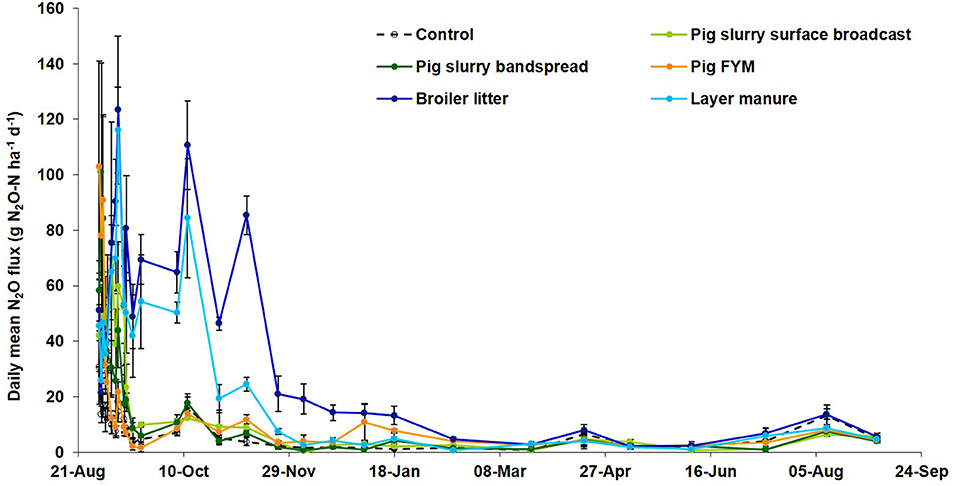
Figure 3. Daily mean N2O flux at Wensum following manure applications in autumn 2011 (vertical lines ±1 standard error, N = 3).
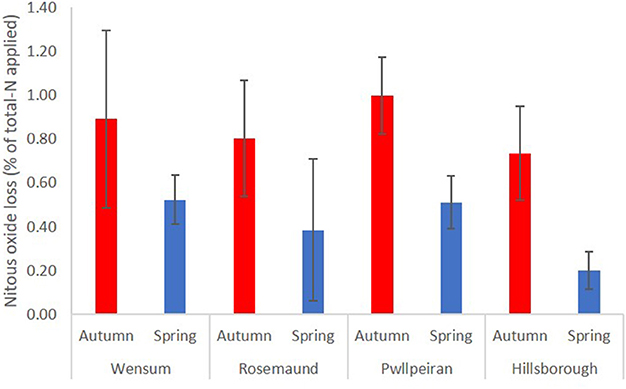
Figure 4. Mean annual direct N2O losses (% total-N applied) at four sites following manure applications in autumn and spring.
When the N2O EFs were expressed as a percentage of total manure N applied remaining after NH3 volatilization, N2O loss from autumn applied poultry manures (1.83%) was still significantly (P = 0.008) higher than from FYM applied at the same time (0.35%) (Table 10). The EF for slurry (1.07%) though was not significantly different to that for either poultry manures or FYM (P > 0.05). For the spring applications there were no significant differences in N2O loss between manure types (P = 0.076) and marginally no significant difference (P = 0.051) between slurry application methods.
At the grassland sites there was no consistent effect of DCD on N2O loss (Table 11), although for individual site/seasons, DCD was quite effective at reducing N2O emissions as illustrated by data from the Hillsborough site (Table 9). For the autumn application timing there was no effect (P = 0.328) of DCD. For the spring application however, we found significantly (P = 0.039) lower emissions from slurry applications with DCD (0.22% total-N applied) compared with those where no DCD was applied (0.40%) (Table 11). There was no interaction (P > 0.05) between DCD use and slurry application method.
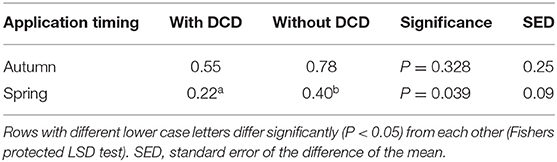
Table 11. The effect of DCD on N2O EFs (% total N applied) from slurry application at the grassland sites.
Nitrate Leaching
Nitrate leaching was only measured following autumn manure applications at the Wensum site. Here, there were significant differences (P = 0.001) in leaching between the treatments (Table 7); the lowest losses were from pig FYM (3.4% total N applied) and the highest from poultry manure (22.9% total N applied), with 17% lost from pig slurry.
Indirect N2O Emissions
Across all the sites and treatments, the mean total indirect N2O emission was 0.27% of total N applied, comprising 0.19% from redeposited NH3 and 0.07% from leached . On average the indirect emission was c.37% of the total N2O emission, although there was considerable variability (Tables 5, 6).
Discussion
Manure Composition
The manure composition values (Table 4) were very similar to the “typical” analysis values for livestock manures published in UK guidance documentation (Anon, 2010; SRUC, 2013). Some of the variability in the data probably reflected the different sources of the manure between sites and the different FYM and slurry types (i.e., pig FYM and slurry at Wensum, cattle FYM/slurry at all other sites).
Ammonia Losses
There was a wide range of NH3 emissions measured across the different sites and manure types (Tables 5, 6). Ammonia emissions from manures are known to be affected by a range of factors including manure composition, application method, and the environmental conditions at the time of application (Nicholson et al., 2013). In this study, the lowest NH3 losses were measured from FYM in both autumn and spring (Table 7) reflecting the low readily available N content of this material (Table 4).
Bandspreading (trailing hose and trailing shoe) techniques are practical methods that can be used for applying livestock slurry to growing crops, since they spread slurry evenly, minimize odor and reduce crop contamination compared with conventional surface broadcast applications. Furthermore, it has been extensively shown that band spreading of slurry can reduce NH3 emissions compared with surface broadcasting (e.g., Sommer et al., 1997; Smith et al., 2000; Sagoo et al., 2006; Hou et al., 2015). The lack of a difference in NH3 losses in this study between the broadcast and bandspread slurry application methods in autumn (Table 7) may, however, have been related to the soil conditions. Topsoil moisture content has been identified as an important factor in affecting the magnitude of NH3 emissions (Nicholson et al., 2013). Dry soils can be hydrophobic (as noted at many of the sites in autumn) which reduces the infiltration of slurry into the soil and limits the potential for bandspreading to reduce NH3 emissions compared to surface broadcasting. Similarly, when soils are wet (as at Hillsborough and North Wyke in the autumn where the WFPS at application was >70%) slurry is unable to infiltrate into the soil, maintaining an NH3 emitting surface. In spring when soils tend to be moist (and arable soils have a more open structure), the results demonstrated that there were significantly (P < 0.05) lower losses from the bandspread slurries (Table 7).
The poultry manure applied to arable soils was incorporated in autumn and NH3 losses were not significantly different from the FYM, which remained on the soil surface (Table 7). At the time of the experiments, it was a requirement of the NVZ regulations (Defra, 2015) that high readily available N content manures (such as poultry manure and slurry) applied in autumn were incorporated into the soil within 24 h of application. Previous work has shown that c.50% of total NH3 emissions from surface broadcast poultry manure applications occurs 24 h after application, which suggests that soil incorporation within 24 h can be effective at reducing NH3 losses (Nicholson et al., 2013). In spring, the poultry manure was not incorporated after application and the results demonstrated that there were significantly (P < 0.05) higher losses from the poultry manure than from the FYM (Table 7).
In this study, DCD was used as an NI on the slurry treatments at the grassland sites, which would be expected to reduce N2O emissions (and potentially leaching from the autumn applications) from those treatments (Akiyama et al., 2010; Ruser and Schulz, 2015). The mode of action of NIs, which retain N in the soil as ammonium-N can, however, increase NH3 emissions depending on soil properties such as pH, wetness and cation exchange capacity (Kim et al., 2012; Lam et al., 2017). Our results show that there was no difference in NH3 losses from slurries applied to grassland with and without DCD (P > 0.05; data not shown), presumably due to prevailing site conditions.
Direct Nitrous Oxide Emissions and Emission Factors
The wide variability in the N2O EFs (% total-N applied) obtained from the different sites and seasons (Tables 8, 9) was most likely a result of differences and interactions between site history, soil texture, soil temperature, and rainfall during the measurement periods. Differences in manure composition, application method, incorporation, cropping etc. may also have had an effect, although there were insufficient data to fully analyze for these interactions. Nevertheless, the EFs were within a comparable range to other UK field experiments previously reported in the literature (<0.01–3.76%; Thorman et al., 2006; Chadwick et al., 2011; Webb et al., 2014). The mean manure EF (% total-N applied) from all the experiments reported here was 0.60 ± 0.07 % (n = 42; Tables 8, 9), similar to the mean EF of 0.51% (n = 92) from an earlier UK dataset of direct N2O emissions following manure application (Nicholson et al., 2013), and less than the (IPCC, 2006) Tier 1, default value of 1% for livestock manures, but consistent with the new 2019 disaggregated IPCC EF1 for wet climates of 0.6% (IPCC, 2019).
In these experiments, N2O emissions were measured over 12 months in order to derive EFs that were comparable to the IPCC Tier 1, default EF1 (IPCC, 2006, 2019) and fit for purpose for inventory reporting. Mineralization can release c.10–30% of manure organic N within 12 months of application, and a further c.5–15% over the next 6 months (Bhogal et al., 2016). Mineralized manure organic N could, therefore, provide a substrate for nitrification and denitrification resulting in the production of N2O, which would not be included in the annual emissions reported here or in the IPCC default EF.
Topsoil (0–10 cm) mineral N samples were taken at regular intervals from all the treatments (data not shown) and confirm that large N2O emissions after the 12-month sampling period were unlikely. Soil mineral N levels from the manure treatments returned to background (i.e., levels measured from the control treatment) within 4–6 and 8–12 weeks of application on the grassland and arable land, respectively. These data support the assumption of the IPCC that the majority of N2O resulting from the application of manure N to land will be emitted within a year of application.
The mean N2O emission measured from the control treatments (or background emissions) at the arable sites (1.57 kg N2O-N ha−1) was more than three times that from the grassland sites (0.49 kg N2O-N ha−1). Recent work in the UK supports this apparent difference in background emissions between grass and arable land with mean emissions of 0.45 kg N2O-N ha−1 (range −0.03–1.26) and 0.64 kg N2O-N ha−1 (range 0.20–1.34) from grassland (Chadwick et al., 2018; Cardenas et al., 2019), and 0.93 kg N2O-N ha−1 (range 0.66–1.39) and 1.15 kg N2O-N ha−1 (range 0.01–6.78) from arable land (Sylvester-Bradley et al., 2015; Bell et al., 2016b). The magnitude of background emissions will have been affected by interactions between several factors including cropping history, soil pH, soil N, and carbon content, soil moisture etc. The higher emissions from the arable sites may also, however, be related to soil cultivation stimulating mineralization of organic N providing a substrate for N2O production, as well as in autumn, a lower crop N uptake by recently sown arable crops.
Effect of Manure Type on N2O Emission Factors
In this study we found that for the autumn application, the EF (% total-N applied) for poultry manures (1.52%) was significantly (P < 0.001) higher than the EF for both slurry (0.72%) and FYM (0.37%). Pelster et al. (2012) reported similar results from a field experiment where N2O emissions following application of ammonium nitrate, poultry manure, and cattle and pig slurry were measured for 2 years on two soil types in a cool, humid climate. On the sandy loam soil, the EF (% total-N applied) for poultry manure was 1.8%, more than double that of the other treatments (0.3–0.9%), which was ascribed to the high C content of the manure; however, on the silty clay soil, there was no difference in EFs between treatments. In this study, for the spring application however, a different pattern was observed with no difference between EFs from the three manure types. Other studies have also explored differences in EFs (% total-N applied) between different manure types with somewhat contradictory results. For example, Velthof et al. (2003) observed that N2O EFs were less from poultry manure (0.5–1.9%) than from cattle slurry (1.8–3.0%) or pig slurry (7–14%), although this was a laboratory incubation study and N2O fluxes were only measured for 98 days. Loro et al. (1997) ascribed greater N2O fluxes from cattle FYM than from slurry to the greater quantity and longer duration of availability of the C applied with FYM, whereas Rochette et al. (2008) found no clear treatment differences following application of liquid and solid manures.
The larger N2O EF (% total-N applied) and the longer duration of the emission from poultry manures following the autumn applications was probably due to the differences in the way the manures were managed after application at the arable sites. In autumn, the poultry manures and broadcast applied slurries were incorporated into the soil within 24 h of application to comply with NVZ regulations for high available N manures, whereas in spring they were left on the soil surface. Incorporation would be expected to reduce N losses from NH3 volatilization (Sagoo et al., 2007; Webb et al., 2014; Hou et al., 2015), hence conserving N in the soil for subsequent loss as N2O (an example of so-called “pollution swapping”). At the arable sites (Table 7), mean NH3 losses from the autumn application of poultry manures were about half that from the spring application. Furthermore, following incorporation, reduced soil oxygen concentrations from buried manure decomposition may have resulted in the formation of anaerobic micro-sites within the soil matrix suitable for denitrification and subsequent N2O generation (Webb et al., 2014). Thus, greater N2O emissions may be expected following autumn incorporation in comparison with manure left on the soil surface in spring. The effects of manure incorporation on N2O losses from solid manures were previously explored in UK field studies by Thorman et al. (2006, 2007a). Their results showed that whilst incorporation sometimes increased N2O emissions (particularly on light textured soils) this was not always the case, and that the effect may be related to an interaction between soil texture and weather conditions.
The importance which NH3 volatilization can have on N2O emissions was highlighted when the N2O EFs were expressed as the percentage of total manure N applied remaining after NH3 loss. Following the autumn manure applications, the N2O loss (total-N applied after NH3 loss) from slurry (1.07%) was not significantly different (P > 0.05) to that from poultry manure (1.83%), reflecting the much greater (P < 0.001) NH3 loss (and subsequent reduction of the manure N pool) from slurry (24.9% total-N applied) than from poultry manures (5.7% total-N applied).
The low emissions from FYM following both the autumn and spring application timings were probably because a much lower proportion of the total N applied was in the NH4-N form and hence available for nitrification (Table 4). Indeed, in their meta-analysis of N2O emissions in Mediterranean cropping systems, Cayuela et al. (2017) also attributed the higher N2O EF (% total-N applied) from organic liquid fertilizers (0.84%) compared with organic solid fertilizers (0.19%) to differences in readily available N content of the manures. Likewise, in a review of N2O emissions from agricultural soils in Eastern Canada the mean N2O EF (% total-N applied) from liquid manure (1.7%) was found to be considerably higher than from solid manure (0.3%) (Gregorich et al., 2005).
Notwithstanding the effect that the incorporation of manures following the autumn application had on increasing N2O EFs, the tendency for higher N2O EFs in the autumn than in the spring (Figure 4) was in close agreement with findings from a previous UK study. Thorman et al. (2007b) showed that direct N2O losses were greater (P < 0.05) from slurry applications in autumn/winter (1.10% total-N applied) than from those in spring (0.51% total-N applied). This probably reflected differences in soil moisture/temperature conditions, but also the lower levels of crop N uptake in the autumn/winter compared with spring. Grassland studies in Ireland (Bourdin et al., 2014; Cahalan et al., 2015) have also shown that the influence which the season and timing of cattle slurry applications have on N2O emissions is driven by soil and climatic conditions (moisture/rainfall and temperature). Numerous studies have shown that N2O production increases with temperature and can be stimulated with a rise in soil moisture (Dobbie et al., 1999; Dobbie and Smith, 2003; Lazcano et al., 2016). At three of the sites (Wensum, Rosemaund, and Pwllpeiran) the mean air temperature in the 2 weeks following autumn spreading was approximately double that for the spring timings and coupled with sufficient rainfall could have contributed to the increased autumn N2O emissions (Table 3). At Hillsborough, however, there was very little difference in the air temperature following the autumn and spring applications, although this site received considerable rainfall (>80 mm) in the fortnight following the autumn application. Furthermore, the air temperature in the week prior to the spring application was low (<3°C), resulting in manure application to cold soil at this time and reduced microbial activity.
Clearly the seasonal difference in N2O emission was not purely driven by temperature, rainfall (soil moisture), manure composition or manure management, but is a complex interaction between these and other soil and environmental factors, as well as crop N uptake. The effects of these factors on N2O EFs from manure applications need to be explored in a greater dataset that includes the results from this study and other similar studies in the UK, before country specific N2O EFs can be derived.
Effect of Slurry Application Method on Emission Factors
In this study, slurries were either broadcast on the soil surface or to minimize NH3 losses applied using a bandspreading technique. It might be expected that conserving manure N by reducing NH3 losses would increase the soil mineral N pool and hence subsequent N2O emissions (Webb et al., 2010, 2014). Indeed this “pollution swapping” effect was seen for the spring application where mean NH3 losses were lower from the bandspread slurry treatments compared to the surface broadcast slurry (Table 7) and the mean direct N2O EF (% total-N applied) from the bandspread slurry was larger than from the surface broadcast. Expressing the N2O EFs as a percentage of manure N applied remaining after NH3 loss confirmed the role which NH3 volatilization had on the N2O emissions with little difference (P = 0.051) in the N2O EF from the spring applied surface broadcast and bandspread slurry (Table 10).
A review carried out by, Chadwick et al. (2011) commented, however, that whilst some studies had shown that application methods which retain more N in the soil can lead to higher N2O emissions, this was not always the case. Even in different years of the same study, slurry injection, for example, could increase, decrease or have no effect on N2O emissions compared to surface broadcast, the implication being that soil and environmental conditions that give rise to N2O production and emission (e.g., warm and wet soils) can be more important than application method in controlling N2O emissions.
Effect of Nitrification Inhibitors on Emission Factors
At the grassland sites, the mean reduction in N2O emissions using DCD following the spring application (45%) was at the lower end of the range (47–70%) that has been previously reported from land spreading of pig/cattle slurry (Merino et al., 2002; Meijide et al., 2007; Aita et al., 2015; Cahalan et al., 2015). Other published studies have, however, reported a similar inhibitor efficiency as found in this study. For example, trials in New Zealand reported that DCD reduced N2O losses from field deposited urine and feces by an average of 50% Gillingham et al. (2012) and Chadwick et al. (2018) found that DCD reduced the N2O EF from urine patches by an average of 46% under UK conditions. A global meta-analysis found that NIs were effective in reducing N2O emissions by 42% and 40%, for DCD and 3,4-dimethylpyrazole phosphate (DMPP), respectively (Gilsanz et al., 2016).
In this study, however, using DCD did not consistently reduce N2O EFs, as demonstrated by the lack of a statistical effect at the autumn application (Table 11). At Pwllpeiran, autumn manure applications coincided with warm weather where the mean maximum air temperatures over the first 6 days was 24°C. The efficacy and persistence of DCD is known to be affected by several factors including high temperatures (Kelliher et al., 2008). The effect of temperature was also demonstrated in a laboratory incubation study using soils from these field experiments (McGeough et al., 2016). At 5°C the half-life of DCD in the Pwllpeiran soil was about 35 days, but at 25°C this decreased to <7 days so that insufficient DCD was present to inhibit nitrification at Pwllpeiran after 16 days. Furthermore, this laboratory work showed that the inhibition of ammonium oxidation by DCD was dramatically reduced in the Pwllpeiran soil from 81% at 15°C to just 10% at 25°C. It is clear that NIs can reduce N2O emissions, but the efficacy is highly variable creating a considerable challenge for the accurate inclusion of this potential N2O mitigation technique in national GHG inventories.
Nitrate Leaching
Nitrate leaching losses following manure applications are well-understood as a result of data gathered in a series of past field experiments (Nicholson et al., 2013). In the present study, leaching losses were only measured at the Wensum site, which was in arable cropping and situated on a light (sandy loam) textured soil (Table 1). There were significant differences (P = 0.001) in leaching losses between the autumn manure applications (Table 7). Unsurprisingly, the lowest losses were from pig FYM and the highest from poultry manure, reflecting the different readily available N contents of these two manure types (Table 4). It may be expected that due to differences in NH3 emissions and the subsequent availability of N, leaching losses from the bandspread slurry would be higher than from surface broadcast. The lack of such an effect, reflected the similar NH3 emission measurements from the two slurry application methods.
Indirect N2O Emissions
Indirect N2O emissions following manure applications may arise from the re-deposition of volatilized NH3 and NOx onto nearby soil, providing a substrate for nitrification and denitrification. Indirect N2O emissions may also arise from N lost to surface waters via leaching of which is later denitrified.
In this study, the NH3 volatilization losses measured at all sites and applications were used to provide a better indication of the indirect emission (Tables 5, 6). Because leaching losses were only measured at the Wensum site following the autumn 2011 manure application, leaching losses at the other sites were estimated using FracLeach i.e., of the total N applied, 30% was assumed to be lost via leaching at the arable sites and 10% at the grassland sites (Brown et al., 2019). At Wensum, the measured leaching (net of the control) was lower than the FracLeach value (30%) for all the treatments (mean 17% total N applied). This suggests that FracLeach may not accurately represent actual leaching losses for individual sites and treatments, and that the estimates of indirect N2O emission from leaching (Tables 5, 6) should be treated as indicative only.
The mean total indirect N2O emission across all sites and treatments was 0.27% of total N applied, of which 0.19% was from redeposited NH3 and 0.07% from leached . Although there was considerable variability and values could not be calculated for all the experiments, on average the indirect emission was c.37% of the total (i.e., direct and indirect) N2O emission (Tables 5, 6). These findings indicate that whilst reducing direct N2O emissions, for example by using NIs, could have a considerable impact on reducing the amount of N2O released to the atmosphere following manure applications, attention should also be given to NH3 and mitigation strategies which will also have the effect of reducing the indirect N2O emission.
Conclusions
The results from this study showed that the mean direct N2O EF (% total-N applied) for manure applied to soils, at 0.60%, was approximately half that of the 2006 IPCC default EF of 1%, but comparable to the new refined 2019 IPCC EF for manure applied in wet climates. Our data provide evidence for setting a new country specific direct N2O EF for manure applied to soils in the UK, and possible disaggregation by manure type, application method, and application timing. This study confirmed that the nitrification inhibitor, DCD has the potential to reduce N2O emissions from slurry applications, but that its efficacy is highly variable. Before widespread adoption of NI use is promoted, further work is required to not only understand the practical and economic implications of using NIs, but crucially to also understand the soil and weather conditions where their use could be beneficial in reducing N2O emissions.
The outcomes of this research have contributed not only to our scientific understanding of N2O emissions from agricultural soils, but also to the derivation of a more robust and transparent inventory of GHG emissions from UK agriculture. This work will also enable evidence based policy to be developed to help the UK achieve its ambitious “net zero” GHG emission target.
Data Availability Statement
The datasets analyzed for this study can be found in the UK Agricultural and Environmental Data Archive. http://www.environmentdata.org/clist/ghgno/none/none.
Author Contributions
RT: data collection, lead data interpretation, and lead manuscript preparation. FN: data collection, substantial data interpretation, and substantial manuscript preparation. CT: lead data analysis and manuscript preparation. MB: data collection. LC: project design, data collection, and manuscript revision. DC: project lead, project concept, project design, and manuscript revision. JC: data collection and manuscript revision. TM, RR, and CW: project design and manuscript revision. JW: project concept, project design, data interpretation, and manuscript revision.
Funding
The authors are grateful to the UK Department for Environment, Food and Rural Affairs (Defra), the Department of Agriculture and Rural Development (now the Department of Agriculture, Environment and Rural Affairs) in Northern Ireland, and the Scottish Government and the Welsh Government for financial support via the InveN2Ory project (AC0116).
Conflict of Interest
RT, FN, and JW were employed by RSK ADAS Ltd.
The remaining authors declare that the research was conducted in the absence of any commercial or financial relationships that could be construed as a potential conflict of interest.
Supplementary Material
The Supplementary Material for this article can be found online at: https://www.frontiersin.org/articles/10.3389/fsufs.2020.00062/full#supplementary-material
Supplementary Figure 1. Example plot layout. NB Plots are at an angle to facilitate the placement of ammonia windtunnels so that clean air can flow into the tunnels.
References
Aita, C., Schirmann, J., Pujol, S. B., Giacomini, S. J., Rochette, P., Angers, D. A., et al. (2015). Reducing nitrous oxide emissions from a maize-wheat sequence by decreasing soil nitrate concentration: effects of split application of pig slurry and dicyandiamide. Eur. J. Soil Sci. 66, 359–368. doi: 10.1111/ejss.12181
Akiyama, H., Yan, X., and Yagi, K. (2010). Evaluation of effectiveness of enhanced-efficiency fertilizers as mitigation options for N2O and NO emissions from agricultural soils: meta-analysis. Glob. Chang. Biol. 16, 1837–1846. doi: 10.1111/j.1365-2486.2009.02031.x
Anon (1986). The Analysis of Agricultural Materials. Ministry of Agriculture Fisheries and Food Reference Book, 3rd Edn. London: HMSO.
Baggs, E. (2011). Soil microbial sources of nitrous oxide: recent advances in knowledge, emerging challenges and future direction. Curr. Opin. Environ. Sustain. 3, 321–327. doi: 10.1016/j.cosust.2011.08.011
Bailey, R. G., and Spackman, E. (1996). A model for estimating soil moisture changes as an aid to irrigation scheduling and crop water-use studies II. Field test of the model. Soil Use Manage. 12, 122–128. doi: 10.1111/j.1475-2743.1996.tb00532.x
Bell, M. J., Hinton, N. J., Cloy, J. M., Topp, C. F. E., Rees, R. M., Cardenas, L., et al. (2016b). Nitrous oxide emissions from fertilised UK arable soils: fluxes, emission factors and mitigation. Agric. Ecosyst. Environ. 212, 134–147. doi: 10.1016/j.agee.2015.07.003
Bell, M. J., Hinton, N. J., Cloy, J. M., Topp, C. F. E., Rees, R. M., Williams, J. R., et al. (2016a). How do emission rates and emission factors for nitrous oxide and ammonia vary with manure type and time of application in a Scottish farmland? Geoderma 264, 81–93. doi: 10.1016/j.geoderma.2015.10.007
Bell, M. J., Hinton, N. J., Cloy, J. M., Williams, J. R., Misselbrook, T. H., Rees, R. M., et al. (2017). Agricultural Greenhouse Gas Inventory Research Platform - InveN2Ory. Manure Experimental Site in Midlothian, 2012-13. Version: 1. Freshwater Biological Association. doi: 10.17865/ghgno555
Bhogal, A., Williams, J. R., Nicholson, F. A., Chadwick, D. R., Chambers, K. H., and Chambers, B. J. (2016). Mineralization of organic nitrogen from farm manure applications. Soil Use Manage. 32, 32–43. doi: 10.1111/sum.12263
Bourdin, F., Sakrabani, R., Kibblewhite, M. G., and Lanigan, G. J. (2014). Effect of slurry dry matter content, application technique and timing on emissions of ammonia and greenhouse gas from cattle slurry applied to grassland soils in Ireland. Agric. Ecosyst. Environ. 188, 122–133. doi: 10.1016/j.agee.2014.02.025
Brown, P., Broomfield, M., Cardenas, L., Choudrie, S., Jones, S., Karagianni, E., et al. (2019). UK Greenhouse Gas Inventory, 1990-2017: Annual Report for Submission Under the Framework Convention on Climate Change. Didcot: Ricardo-AEA.
Butterbach-Bahl, K., Baggs, E. M., Dannenmann, M., Kiese, R., and Zechmeister-Boltenstern, S. (2013). Nitrous oxide emissions from soils: how well do we understand the processes and their controls? Phil. Trans. R. Soc. B 368:20130122. doi: 10.1098/rstb.2013.0122
Cahalan, E., Ernfors, M., Müller, C., Devaney, D., Laughlin, R. J., Watson, C. J., et al. (2015). The effect of the nitrification inhibitor dicyandiamide (DCD) on nitrous oxide and methane emissions after cattle slurry application to Irish grassland. Agric. Ecosyst. Environ. 199, 339–349. doi: 10.1016/j.agee.2014.09.008
Cardenas, L. M., Bhogal, A., Chadwick, D. R., McGeough, K. L., Misselbrook, T., Rees, R. M., et al. (2019). Nitrogen use efficiency and nitrous oxide emissions from five UK fertilised grasslands. Sci. Total Environ. 661, 696–710. doi: 10.1016/j.scitotenv.2019.01.082
Cardenas, L. M., Misselbrook, T. H., and Donovan, N. (2017). Agricultural Greenhouse Gas Inventory Research Platform - InveN2Ory. Manure Experimental Site in Devon, 2011-12. Version: 1. Freshwater Biological Association. doi: 10.17865/ghgno548
Cardenas, L. M., Thorman, R., Ashlee, N., Butler, M., Chadwick, D., Chambers, B., et al. (2010). Quantifying annual N2O emission fluxes from grazed grassland under a range of inorganic fertiliser nitrogen inputs. Agric. Ecosyst. Environ. 136, 218–226. doi: 10.1016/j.agee.2009.12.006
Cayuela, M. L., Aguilera, E., Sanz-Cobena, A., Adams, D. C., Abalos, D., Barton, L., et al. (2017). Direct nitrous oxide emissions in Mediterranean climate cropping systems: emission factors based on a meta-analysis of available measurement data. Agric. Ecosyst. Environ. 238, 25–35. doi: 10.1016/j.agee.2016.10.006
Chadwick, D., Sommer, S., Thorman, R., Fangueiro, D., Cardenas, L., Amon, B., et al. (2011). Manure management: implications for greenhouse gas emissions. Anim. Feed Sci. Technol. 166–167, 514–531. doi: 10.1016/j.anifeedsci.2011.04.036
Chadwick, D. R., Cardenas, L., Misselbrook, T. H., Smith, K. A., Rees, R. M., Watson, C. J., et al. (2014). Optimizing chamber methods for measuring nitrous oxide emissions from plot-based agricultural experiments. Eur. J. Soil Sci. 65, 295–307. doi: 10.1111/ejss.12117
Chadwick, D. R., Cardenas, L. M., Dhanoa, M. S., Donovan, N., Misselbrook, T., Williams, J. R., et al. (2018). The contribution of cattle urine and dung to nitrous oxide emissions: quantification of country specific emission factors and implications for national inventories. Sci. Total Environ. 635, 607–617. doi: 10.1016/j.scitotenv.2018.04.152
Charles, A., Rochette, P., Whalen, J. K., Angers, D. A., Chantigny, M. H., and Bertrand, N. (2017). Global nitrous oxide emission factors from agricultural soils after addition of organic amendments: a meta-analysis. Agric. Ecosyst. Environ. 236, 88–98. doi: 10.1016/j.agee.2016.11.021
Clemens, J., and Huschka, A. (2001). The effect of biological oxygen demand of cattle slurry and soil moisture on nitrous oxide emissions. Nutr. Cycl. Agroecosyst. 59, 193–198. doi: 10.1023/A:1017562603343
Committee on Climate Change (2019). Net Zero - The UK's Contribution to Stopping Global Warming. London: Committee on Climate Change.
Conen, F., Dobbie, K. E., and Smith, K. A. (2000). Predicting N2O emissions from agricultural land through related soil parameters. Glob. Change Biol. 6, 417–426. doi: 10.1046/j.1365-2486.2000.00319.x
DECC (2009). The UK Low Carbon Transition Plan: National Strategy for Climate and Energy. London: Department of Energy and Climate Change.
Defra (2006). Optimising Slurry Application Timings to Minimise Nitrogen Losses: OPTI-N. Final Report for Defra Project ES0115. Available online at: http://sciencesearch.defra.gov.uk/Default.aspx?Menu=Menu&Module=More&Location=None&Completed=0&ProjectID=11016 (accessed April 3, 2019).
Defra (2007). Integrating Slurry Management Strategies to Minimise Nitrogen Losses - Application Rates and Method (Slurry-NR). Final Report for Defra Project ES0114. Available online at: http://sciencesearch.defra.gov.uk/Default.aspx?Menu=Menu&Module=More&Location=None&Completed=0&ProjectID=11015 (accessed April 3, 2019).
Defra (2015). Using Nitrogen Fertilisers in Nitrate Vulnerable Zones. Available online at: https://www.gov.uk/guidance/using-nitrogen-fertilisers-in-nitrate-vulnerable-zones
Di, H. H., Cameron, K. C., and Sherlock, R. R. (2007). Comparison of the effectiveness of a nitrification inhibitor, dicyandiamide, in reducing nitrous oxide emissions in four different soils under different climatic and management conditions. Soil Use Manage. 23, 1–9. doi: 10.1111/j.1475-2743.2006.00057.x
Dobbie, K. E., McTaggart, I. P., and Smith, K. A. (1999). Nitrous oxide emissions from intensive agricultural systems: variations between crops and seasons, key driving variables, and mean emission factors. J. Geophys. Res. 104, 26891–26899. doi: 10.1029/1999JD900378
Dobbie, K. E., and Smith, K. A. (2003). Nitrous oxide emission factors for agricultural soils in Great Britain: the impact of soil water-filled pore space and other controlling variables. Glob. Change Biol. 9, 204–218. doi: 10.1046/j.1365-2486.2003.00563.x
Duncan, E. W., Dell, C. J., Kleinman, P. J., and Beegle, D. B. (2017). Nitrous oxide and ammonia emissions from injected and broadcast-applied dairy slurry. J. Environ Qual.46, 36–44. doi: 10.2134/jeq2016.05.0171
Firestone, M. K., and Davidson, E. A. (1989). Microbiological basis of NO and N2O production and consumption in soil, in Exchange of Trace Gases Between Terrestrial Ecosystems and the Atmosphere, eds Andeae, M. O., and Schimel, D. S., (Chichester: Wiley), 7–21.
Gillingham, A. G., Ledgard, S. F., Saggar, S., Cameron, K. C., Di, H. J., de Klein, C., et al. (2012). Initial evaluation of the effects of dyciandiamide (DCD) on nitrous oxide emissions, nitrate leaching and dry matter production from dairy pastures in a range of locations within New Zealand, in Advanced Nutrient Management: Gains from the Past – Goals for the Future, Occasional Report No. 25, eds Currie, L. D., and Christensen, C. L., . Palmerston North: Fertilizer and Lime Research Centre; Massey University.
Gilsanz, C., Baez, D., Misselbrook, T. H., Dhanoa, M. S., and Cardenas, L. M. (2016). Development of emission factors and efficiency of two nitrification inhibitors, DCD and DMPP. Agric. Ecosyst. Environ. 216, 1–8. doi: 10.1016/j.agee.2015.09.030
Gregorich, E. G., Rochette, P., vandenBygaart, A. J., and Angers, D. A. (2005). Greenhouse gas contributions of agricultural soils and potential mitigation practices in Eastern Canada. Soil Tillage Res. 83, 53–72. doi: 10.1016/j.still.2005.02.009
Guardia, G., Abalos, D., García-Marco, S., Quemada, M., Alonso-Ayuso, M., Cárdenas, L. M., et al. (2016). Effect of cover crops on greenhouse gas emissions in an irrigated field under integrated soil fertility management. Biogeosciences 13, 5245–5257. doi: 10.5194/bg-13-5245-2016
Hou, Y., Velthof, G. L., and Oenema, O. (2015). Mitigation of ammonia, nitrous oxide and methane emissions from manure management chains: a meta-analysis and integrated assessment. Glob. Change Biol. 21, 1293–1312. doi: 10.1111/gcb.12767
IPCC (2000). Good Practice Guidance and Uncertainty Management in National Greenhouse Gas Inventories, eds Penman, J., Kruger, D., Galbally, I., Hiraishi, T., Nyenzi, B., Emmanuel, S., . Intergovernmental Panel on Climate Change (IPCC), IPCC/OECD/IEA/IGES, Hayama.
IPCC (2006). Chapter 11: N2O emissions from managed soils, and CO2 emissions from lime and urea application, in Guidelines for National Greenhouse Gas Inventories Agriculture, Forestry and Other Land Use, eds de Klein, C., Novoa, R. S. A., Ogle, S., Smith, K. A., Rochette, P., Wirth, T. C., . Intergovernmental Panel on Climate Change (IPCC). Available online at: http://www.ipcc-nggip.iges.or.jp/public/2006gl/pdf/4_Volume4/V4_11_Ch11_N2O&CO2.pdf (accessed November 20, 2019).
IPCC (2007). Climate change 2007 – the physical science basis, in Contribution of Working Group 1 to the Fourth Assessment, eds Solomon, S., Qin, D., Manning, M., Chen, Z., Marquis, M., Averyt, K. B., . Report of the Intergovernmental Panel on Climate Change. Cambridge: Cambridge University Press, 210–214.
IPCC (2019). Chapter 11: N2O emissions from managed soils, and CO2 emissions from lime and urea application, in Refinement to the 2006 IPCC Guidelines for National Greenhouse Gas Inventories, eds Hergoualc'h, K., Akiyama, H., Bernoux, M., Chirinda, N., del Prado, A., Kasimir, Å., . Available online at: https://www.ipcc-nggip.iges.or.jp/public/2019rf/pdf/4_Volume4/19R_V4_Ch11_Soils_N2O_CO2.pdf (accessed November 20, 2019).
Kelliher, F. M., Clough, T. J., Clark, H., Rys, G., and Sedcole, J. R. (2008). The temperature dependence of dicyandiamide (DCD) degradation in soils: a data synthesis. Soil Biol. Biochem. 40, 1878–1882. doi: 10.1016/j.soilbio.2008.03.013
Kim, D.-G., Saggar, S., and Roudier, P. (2012). The effect of nitrification inhibitors on soil ammonia emissions in nitrogen managed soils: a meta-analysis. Nutr. Cycl. Agroecosyst. 93, 51–64. doi: 10.1007/s10705-012-9498-9
Krol, D. J, Carolan, R., Minet, E., McGeough, K. L., Watson, C. J., Forrestal, P. J., et al. (2016). Improving and disaggregating N2O emission factors for ruminant excreta on temperate pasture soils. Sci. Total Environ. 568, 327–338. doi: 10.1016/j.scitotenv.2016.06.016
Lam, S. K., Suter, H., Mosier, A. R., and Chen, D. (2017). Using nitrification inhibitors to mitigate agricultural N2O emission: a double-edged sword? Glob. Change Biol. 23, 485–489. doi: 10.1111/gcb.13338
Lazcano, C., Tsang, A., Doane, T. A., Pettygrove, G. S., Horwath, W. R., and Burger, M. (2016). Soil nitrous oxide emissions in forage systems fertilized with liquid dairy manure and inorganic fertilizers. Agric. Ecosyst. Environ. 225, 160–172. doi: 10.1016/j.agee.2016.04.009
Lockyer, D. R. (1984). A system for the measurement in the field of losses of ammonia through volatilization. J. Sci. Food Agric. 35, 837–848. doi: 10.1002/jsfa.2740350805
Lord, E. I., and Shepherd, M. A. (1993). Developments in the use of porous ceramic cups for measuring nitrate leaching. J. Soil Sci. 44, 435–451. doi: 10.1111/j.1365-2389.1993.tb00466.x
Loro, P. J., Bergstrom, D. W., and Beauchamp, E. G. (1997). Intensity and duration of denitrification following application of manure and fertilizer to soil. J. Environ Qual. 26, 706–713. doi: 10.2134/jeq1997.00472425002600030016x
MacCarthy, J., Broomfield, M., Brown, P., Buys, G., Cardenas, L., Murrells, T., et al. (2015). UK Greenhouse Gas Inventory, 1990-2013: Annual Report for Submission Under the Framework Convention on Climate Change. Didcot: Ricardo-AEA.
McGeough, K. L., Watson, C. J., Müller, C., Laughlin, R. J., and Chadwick, D. R. (2016). Evidence that the efficacy of the nitrification inhibitor dicyandiamide (DCD) is affected by soil properties in UK soils. Soil Biol. Biochem. 94, 222–232. doi: 10.1016/j.soilbio.2015.11.017
McNeill, G., McGeough, K. L., Laughlin, R. J., and Watson, C. J. (2017). Agricultural Greenhouse Gas Inventory Research Platform - InveN2Ory. Manure Experimental Site in County Down, 2012-13. Version: 1. Freshwater Biological Association. doi: 10.17865/ghgno541
Meijide, A., Díez, J. A., Sánchez-Martin, L., López-Fernández, S., and Vallejo, A. (2007). Nitrogen oxide emissions from an irrigated maize crop amended with treated pig slurries and composts in a Mediterranean climate. Agric. Ecosyst. Environ. 121, 383–394. doi: 10.1016/j.agee.2006.11.020
Merino, P., Estavillo, J. M., Graciollo, L. A., Pinto, M., Lacuesta, M., Muñoz-Rueda, A., et al. (2002). Mitigation of N2O emissions from grassland by nitrification inhibitor and Actilith F2 applied with fertilizer and cattle slurry. Soil Use Manage. 18, 135–141. doi: 10.1111/j.1475-2743.2002.tb00231.x
Misselbrook, T. H., Cardenas, L. M., Camp, V., Thorman, R. E., Williams, J. R., Rollett, A. J., et al. (2014). An assessment of nitrification inhibitors to reduce nitrous oxide emissions from UK agriculture. Environ. Res. Lett. 9:115006. doi: 10.1088/1748-9326/9/11/115006
Mkhabela, M. S., Gordon, R., Burton, D., Madani, A., Hart, W., and Elmi, A. (2006). Ammonia and nitrous oxide emissions from two acidic soils of Nova Scotia fertilized with liquid hog manure mixed with or without dicyandiamide. Chemosphere 65, 1381–1387. doi: 10.1016/j.chemosphere.2006.04.062
Montes, F., Meinen, R., Dell, C., Rotz, A., Hristov, A. N., Oh, J., et al. (2013). SPECIAL TOPICS—mitigation of methane and nitrous oxide emissions from animal operations: II. A review of manure management mitigation options. J. Anim. Sci. 91, 5070–5094. doi: 10.2527/jas.2013-6584
Nicholson, F., Bhogal, A., Cardenas, L., Chadwick, D., Misselbrook, T., Rollett, A., et al. (2017a). Nitrogen losses to the environment following food-based digestate and compost applications to agricultural land. Environ. Pollut. 228, 504–516. doi: 10.1016/j.envpol.2017.05.023
Nicholson, F. A., Balshaw, H., Bowden, M., Chauhan, M., Paine, F., Thorman, R. E., et al. (2017c). Agricultural Greenhouse Gas Inventory Research Platform - InveN2Ory. Manure Experimental Site in Herefordshire, 2012-13. Version: 1. Freshwater Biological Association. doi: 10.17865/ghgno636
Nicholson, F. A., Bennett, G., Bowden, M., Chauhan, M., Lathwood, T., Smith, K. E., et al. (2017d). Agricultural Greenhouse Gas Inventory Research Platform - InveN2Ory. Manure Experimental Site in Ceredigion, 2011-12. Version: 1. Freshwater Biological Association. doi: 10.17865/ghgno621
Nicholson, F. A., Bhogal, A., Chadwick, D., Gill, E., Gooday, R. D., Lord, E., et al. (2013). An enhanced software tool to support better use of manure nutrients: MANNER-NPK. Soil Use Manage. 29, 473–484. doi: 10.1111/sum.12078
Nicholson, F. A., Bowden, M., Chauhan, M., Cross, R., Munro, D., Smith, K. E., et al. (2017b). Agricultural Greenhouse Gas Inventory Research Platform - InveN2Ory. Manure experimental Site in Norfolk, 2011-12. Version: 1. Freshwater Biological Association. doi: 10.17865/ghgno667
Paul, J. W., Beauchamp, E. G., and Zhang, X. (1993). Nitrous and nitric oxide emissions during nitrification and denitrification from manure-amended soil in the laboratory. Can. J. Soil Sci. 73, 539–553. doi: 10.4141/cjss93-054
Pelster, D. E., Chantigny, M. H., Rochette, P., Angers, D. A., Rieux, C., and Vanasse, A. (2012). Nitrous oxide emissions respond differently to mineral and organic nitrogen sources in contrasting soil types. J. Environ Qual. 41, 427–435. doi: 10.2134/jeq2011.0261
Rochette, P., Angers, D. A., Chantigny, M. H., Gagnon, B., and Bertrand, N. (2008). N2O fluxes in soils of contrasting textures fertilized with liquid and solid dairy cattle manures. Can. J. Soil Sci. 88, 175–187. doi: 10.4141/CJSS06016
Rochette, P., Chadwick, D. R., de Klein, C. A. M., and Cameron, K. (2015). Deployment protocol, in Nitrous Oxide Chamber Methodology Guidelines—Version 1.1, eds de Klein, C. A. M., and Harvey, M. J., (Wellington: Ministry for Primary Industries), 34–55.
Rochette, P., Liang, C., Pelster, D., Bergeron, O., Lemke, R., Kroebel, R., et al. (2018). Soil nitrous oxide emissions from agricultural soils in Canada: exploring relationships with soil, crop and climatic variables. Agric. Ecosyst. Environ. 254, 69–81. doi: 10.1016/j.agee.2017.10.021
Ruser, R., and Schulz, R. (2015). The effect of nitrification inhibitors on the nitrous oxide (N2O) release from agricultural soils-a review. J. Plant Nutrit. Soil Sci. 178, 171–188. doi: 10.1002/jpln.201400251
Sagoo, E., Williams, J. R., Chambers, B. J., Boyles, L. O., Matthews, R., and Chadwick, D. R. (2007). Integrated management practices to minimise losses and maximise the crop nitrogen value of broiler litter. Biosyst. Eng. 97, 512–519. doi: 10.1016/j.biosystemseng.2007.03.032
Sagoo, E., Williams, J. R., Chambers, B. J., Lapworth, J., and Misselbrook, T. (2006). Ammonia volatilisation from cattle slurry applied to grassland: effects of application technique and rate, in Proceedings SAC/SEPA Biennial Conference - Agriculture and the Environment VI, eds. Gairns, L., . (Managing Rural Diffuse Pollution: Edinburgh, 240–243.
Smith, K. A., Jackson, D. R., Misselbrook, T. H., Pain, B. F., and Johnson, R. A. (2000). Reduction of ammonia emission by slurry application techniques. J. Agric. Eng. Res. 77, 277–287. doi: 10.1006/jaer.2000.0604
Sommer, S. G., Friis, E., Bach, A., and Schjørring, J. K. (1997). Ammonia volatilization from pig slurry applied with trial hoses or broadspread to winter wheat: effects of crop developmental stage, microclimate, and leaf ammonia absorption. J. Environ. Qual. 26, 1153–1160. doi: 10.2134/jeq1997.00472425002600040030x
SRUC (2013). Optimising the Application of Bulky Organic Fertilisers. Technical Note TN650. Edinburgh: Scotland's Rural College.
Sylvester-Bradley, R., Thorman, R. E., Kindred, D. R., Wynn, S. C., Smith, K. E., Rees, R. M., et al. (2015). Minimising Nitrous Oxide Intensities of Arable Crop Products (MIN-NO). Project Report No. 548. Kenilworth: AHDB Cereals and Oilseeds.
Thorman, R. E., Chadwick, D. R., Boyles, L. O., Matthews, R., Sagoo, E., and Harrison, R. (2006). Nitrous oxide emissions during storage of broiler litter and following application to arable land, in Proceedings of the 2nd International Conference on Greenhouse Gases and Animal Agriculture Held in Zurich, Switzerland Between 20 and 24 September 2005, International Congress Series 1293 (Elsevier: Amsterdam), 355–358.
Thorman, R. E., Chadwick, D. R., Harrison, R., Boyles, L. O., and Matthews, R. (2007a). The effect on N2O emissions of storage conditions and rapid incorporation of pig and cattle FYM into arable land. Biosyst. Eng. 97, 501–511. doi: 10.1016/j.biosystemseng.2007.03.039
Thorman, R. E., Sagoo, E., Williams, J. R., Chambers, B. J., Chadwick, D., Laws, J. A., et al. (2007b). The effect of slurry application timings on direct and indirect N2O emissions from free draining grassland soils, in Towards a Better Efficiency in N Use. Proceedings of the 15th Nitrogen Workshop, eds Bosch, A., Teira, M. R., and Villar, J. M., (Lleida: Editorial Milenio), 297–299.
UNFCCC (2018). Available online at: https://unfccc.int/process/transparency-and-reporting/reporting-and-review-under-the-convention/greenhouse-gas-inventories-annex-i-parties/national-inventory-submissions-2018 (accessed on March 28, 2019).
van der Weerden, T. J., Cox, N., Luo, J., Di, H. J., Podolyan, A., Phillips, R. L., et al. (2016). Refining the New Zealand nitrous oxide emission factor for urea fertilizer and farm dairy effluent. Agric. Ecosyst. Environ. 222, 133–137. doi: 10.1016/j.agee.2016.02.007
Velthof, G. L., Kuikman, P. J., and Oenema, O. (2003). Nitrous oxide emission from animal manures applied to soil under controlled conditions. Biol. Fertil. Soils 37, 221–230. doi: 10.1007/s00374-003-0589-2
Velthof, G. L., and Mosquera, J. (2011). The impact of slurry application technique on nitrous oxide emission from agricultural soils. Agric. Ecosyst. Environ. 140, 298–308. doi: 10.1016/j.agee.2010.12.017
VSN International (2018). Genstat for Windows, 19th Edn. Hemel Hempstead: VSN International; Genstat.co.uk.
Webb, J., Pain, B., Bittman, S., and Morgan, J. (2010). The impacts of manure application methods on emissions of ammonia, nitrous oxide and on crop response - a review. Agric. Ecosyst. Environ. 137, 39–46. doi: 10.1016/j.agee.2010.01.001
Webb, J., Thorman, R. E., Fernanda-Aller, M., and Jackson, D. R. (2014). Emission factors for ammonia and nitrous oxide emissions following immediate manure incorporation on two contrasting soil types. Atmos. Environ. 82, 280–287. doi: 10.1016/j.atmosenv.2013.10.043
Keywords: greenhouse gas, ammonia, slurry, FYM, poultry, bandspread, inventory, nitrification inhibitor
Citation: Thorman RE, Nicholson FA, Topp CFE, Bell MJ, Cardenas LM, Chadwick DR, Cloy JM, Misselbrook TH, Rees RM, Watson CJ and Williams JR (2020) Towards Country-Specific Nitrous Oxide Emission Factors for Manures Applied to Arable and Grassland Soils in the UK. Front. Sustain. Food Syst. 4:62. doi: 10.3389/fsufs.2020.00062
Received: 20 December 2019; Accepted: 16 April 2020;
Published: 12 May 2020.
Edited by:
José Martinez, National Research Institute of Science and Technology for Environment and Agriculture (IRSTEA), FranceReviewed by:
Roland Fuß, Thünen Institut of Climate-Smart Agriculture, GermanyDavid Pelster, Agriculture and Agri-Food Canada (AAFC), Canada
Copyright © 2020 Thorman, Nicholson, Topp, Bell, Cardenas, Chadwick, Cloy, Misselbrook, Rees, Watson and Williams. This is an open-access article distributed under the terms of the Creative Commons Attribution License (CC BY). The use, distribution or reproduction in other forums is permitted, provided the original author(s) and the copyright owner(s) are credited and that the original publication in this journal is cited, in accordance with accepted academic practice. No use, distribution or reproduction is permitted which does not comply with these terms.
*Correspondence: Rachel E. Thorman, rachel.thorman@adas.co.uk