An LCD monitor with sufficiently precise timing for research in vision
- 1 Department of Neurophysiology, Max-Planck Institute for Brain Research, Frankfurt am Main, Germany
- 2 Frankfurt Institute for Advanced Studies, Johann Wolfgang Goethe University, Frankfurt am Main, Germany
Until now, liquid crystal display (LCD) monitors have not been used widely for research in vision. Despite their main advantages of continuous illumination and low electromagnetic emission, these monitors had problems with timing and reliability. Here we report that there is at least one new inexpensive 120 Hz model, whose timing and stability is on a par with a benchmark cathode-ray tube monitor, or even better. The onset time was stable across repetitions, 95% confidence interval (the error) of which was <0.01 ms. Brightness was also delivered reliably across repeated presentations (<0.04% error) and across blocks with different durations (<3% error). The LCD monitor seems suitable for many applications in vision research, including the studies that require combined accuracy of timing and intensity of visual stimulation.
Introduction
Accurate stimulus presentation is vital to research in vision, and the biggest limitations are imposed by the device used to display stimuli (Krantz, 2000; Bukhari and Kurylo, 2008). In early times, accurate timing of visual stimuli was achieved by specialized apparatus such as tachistoscopes (Mollon and Polden, 1978). Later, these expensive devices were replaced by cheaper and broadly available cathode-ray tube (CRT) monitors, which could be controlled conveniently and flexibly via personal computers (PCs; Brainard, 1989). These systems allowed researchers to adjust a much larger number of stimulus’ parameters and are partly responsible for the expansion of the research in vision.
Nevertheless, CRT monitors are not perfect as they continue to pose several limitations for researchers. First, the light is not presented continuously, but discretely in flashes. In CRT monitors each pixel of the screen changes from bright to dark with certain vertical refresh rate frequency (60 Hz or higher), producing constant flicker. This fast flicker is largely fused by our visual system (Kristofferson, 1967; Andrews et al., 1996; Carmel et al., 2006), but not necessarily completely, as it can affect electrophysiological recordings (Wollman and Palmer, 1995; Krolak-Salmon et al., 2003; Williams et al., 2004). This technology, based on non-continuous light sources, makes an exact calculation of the stimulus presentation time difficult (Bridgeman, 1998). For example, if an image is presented nominally for four screen frames with a 100-Hz refresh rate, the total time span over which the screen is emitting light does not correspond to 4 × 10 = 40 ms, but to a shorter period of time, the exact duration of which depends on the duration of each flash, which in turn depends on the phosphor decay characteristics of a particular screen. Another disadvantage of the CRT monitors is the lack of independence between neighboring pixels (Pelli, 1997). This can be illustrated by presenting the finest possible grating (i.e., one-pixel raster of black and white stripes) with either horizontal or vertical orientation, in which cases the luminance can differ dramatically (Pelli, 1997; Krantz, 2000). Moreover, CRT monitors produce electromagnetic radiation and hence often induce noise in electrophysiological recordings. This noise is correlated to the stimulus and hence, cannot be averaged out. Finally, CRT monitors are becoming increasingly difficult to purchase due to the shrinkage of the market for such products.
There are several possible replacements of CRT monitors in experiments, such as those based on digital light projection or mechanical shutters (Packer et al., 2001; Wiens et al., 2004; Fischmeister et al., 2010). However, these solution need complex setups and the costs are considerable, which limits their application. More general solutions for visual stimulation may be based on liquid crystal display (LCD) technology. LCD monitors present images continuously, i.e., without flicker, generate the luminance of the neighboring pixels independently, produce negligible electromagnetic noise, and are broadly available. Unfortunately, so far, these monitors could not be used widely for research in vision because they lacked speed and accuracy mandatory for scientific investigation of the visual system. These monitors were sluggish in responding to the changes dictated by the computer software and were unable to set the intensity of illumination with sufficient reliability (Wiens et al., 2004). These two disadvantages rendered LCD monitors not applicable for most studies in vision. However, as the technology for LCD monitors has been improving steadily, one can expect LCD monitors to catch up eventually with CRTs also in respect to the timing and luminance accuracy. We report here that at least one recently introduced LCD model has sufficient speed, and temporal and luminance accuracy adequate for most research purposes in vision.
Methods
Experimental Setup
The timing and intensity of luminance changes on the screen were controlled by general-purpose PC using specialized software ActiveSTIM (www.ActiveSTIM.com), which enables creating simple scripts for visual stimulation in conventional programming languages such as LabView, Matlab, C++, etc. The PC was equipped with a modern, but inexpensive, display card (NVIDIA Quadro FX580), which was used to drive, one at a time, all three different monitors that have been tested: (i) a new model of 22′′ 120 Hz LCD monitor (SAMSUNG 2233RZ), backlit by a cold cathode fluorescent lamp and developed for 3D gaming purposes, which was our candidate for a new lab monitor for visual stimulation, referred to as LCD-1. The performance of that monitor was compared to (ii) our current visual stimulation monitor, a 21′′ CRT (ViewSonic P227f, CRT), and (iii) an older LCD model (DELL 3007WFPt, LCD-2), which we knew did not satisfy the needs for visual stimulation.
The settings of brightness, contrast and gamma mode for all monitors were kept constant during the test. In LCD-1, these values were set to the 100, 75, and 1, respectively. In CRT brightness and contrast were set to the 0 and 88, respectively. This monitor did not have an option for setting the gamma mode. In LCD-2 the default setup was used as there was no numeric indicator of the intensity of the luminance set manually. All the tests were taken with the same amount of ambient light. The LCD monitors were always used with their native resolutions, 1680 × 1050 for LCD-1 and 2560 × 1600 for the LCD-2. The resolution of the CRT was 1024 × 768, unless specified otherwise.
A lux probe from a luxmeter (Voltcraft, LX-1108) was used to measure the luminance delivered by the monitors. The sensor of the probe is shaped as a semi-hemisphere surrounded by a black plastic light shield (see Figure A1 in Appendix). The sensor was fixed to the screen by a sticky tape during measurements and always covered by a lid when no measurements took place. To measure average luminance produced by the images over multiple screen frames, the value from the sensor was read by an electronic readout device supplied with the probe, returning values directly in lux. To investigate frame-to-frame dynamic changes of the screen luminance, we used our system for the acquisition of electrophysiological data to first amplify (30×) the voltage generated by the sensor and then record the signal with high sampling frequency (10 kHz). The timing of stimuli was controlled by the phase change of a digital signal (trigger) sent by ActiveSTIM via a digital IO board (National Instrument, NI-6503). The pulses were sent at the beginning of each measurement, and were recorded by the acquisition system. We also tested how the luminance was affected by changes in the viewing angles for a viewer positioned in the center of the screen and viewing either the center of the periphery of the screen.
Procedure
All the generated images had square form and their size (∼7 cm × 7 cm) exceeded well the screen area sampled by the sensor. In the first test, the measurements of the luminance during sustained illumination of the screen, the used image was either uniform white or consisted of full contrast (i.e., white/black) high-frequency grating with the widths of the stripes spanning a single pixel. The grating was oriented either vertically or horizontally. The lux values for white squares and gratings were measured at nine locations on the screen: the center, the four corners, and the four midpoints between the corners. On each location, the luminance produced by grating and uniform white images was measured twice, in the following order: vertical, horizontal, uniform, uniform, horizontal, and vertical. These measurements were made with 60 Hz refresh rate on all three monitors and with 120 Hz on LCD-1 and CRT (LCD-2 does not support refresh rates higher than 60 Hz). In addition to the resolution 1024 × 768, at 120 Hz the CRT monitor was tested also with another higher resolution (1280 × 1024), closer to those of the two LCDs.
To investigate the effect of a change in a viewing angle, the luminance of the screen was set constant and a chroma-meter (Konica Minolta, model CS-100A) was positioned at the distance of 57 cm facing the center of the monitor, which is a relatively small viewing distance for a typical experiment in vision and hence, it estimated the upper boundary of the magnitude of the effects of different viewing angles. The luminance values were measured by rotating the chroma-meter along one horizontal and the vertical axis to point to five locations on the screen: the center of the screen and the four centers of the four edges of the screen. The performance was compared between CRT and LCD-1 at 120 Hz.
In LCD-1 and CRT we measured also the maximum luminance contrast and the resolution of the generated luminance. The maximum luminance contrast was defined as the ratio between the difference and the sum of the maximum and the minimum luminance [RGB values (255 255 255) and (0 0 0), respectively; i.e., (max − min)/(max + min)]. To investigate the resolution of the generated luminance, we attempted making luminance changes in the steps much finer than those provided by individual RGB values in the default mode. To this end, we re-defined the color-lookup table to split three luminance levels (RGB values, 100, 101, and 102) into 21 luminance levels. The luminance levels generated by the two monitors were then measured for the white and separately, for each of the three color channels. The color-lookup table was set back to default for all other tests.
In the second test we measured accurately the time of rise and fall of illumination when an image was presented for a limited amount of time (number of screen frames). A white square (RGB 255, 255, 255) appeared in the center of the display, which returned back to black (RGB 0, 0, 0) after a duration of either 1, 2, 3, 6, 10, 15, 20, or 30 frames of screen refresh. Each of these eight durations was presented in a block consisting of 100 repetitions, starting with a block of 1-frame and ending with a block of 30-frame long images. Thus, there were 800 measurements in total, each lasting 600 ms. LCD-1 and CRT were tested at 60, 100, and 120 Hz refresh rates, and LCD-2, only at 60 Hz.
In the third test we investigated luminance delivered by the monitors when the luminance of the presented image changed randomly at each frame of screen refresh. To this end, a square at the center of the screen took all the 256 different shades of gray (from RGB 0, 0, 0 to RGB 255, 255, 255) in a random order, each shade lasting for only one frame. 100 such sequences were shown, each randomized anew. LCD-1 and CRT were tested at 60 and 100 Hz (LCD-2 was not tested).
Finally, the second and the third test were conducted also for LCD-1 mimicking the flickering flashes of a CRT. Here, LCD-1 was ran at 120 Hz but every second screen frame was set always to full black, resembling the luminance flicker of a 60-Hz CRT monitor.
Analysis
To account for possible DC drifts of the recording system, the baseline luminance (i.e., full black) in the second and third tests was subtracted from all signals prior to further analyses. The baseline luminance was taken from the recordings 60–10 ms prior to the occurrence of digital trigger. Since different monitors differed in absolute luminance generated, it was necessary to normalize the measured values to the maximum (i.e., full white) for each monitor. The maximum luminance for the normalization reference was determined as the peak luminance within a presentation period that lasted 30 frames (at 60 Hz) and that was averaged across 100 repetitions.
The onset time of illumination was defined as the time at which the luminance rose to half of its maximum. We defined the offset time in a similar way: the point at which the luminance reduced to half of its maximum in the last frame. To quantify the properties of the luminance rise and fall, we fit the following exponential function:

to the regions of the measured luminance curves that preceded the onset times and that followed the offset times, respectively. The smaller the time constant c, the steeper are the rising/falling slopes, and thus the monitor is closer to the ideal performance. These measures are also related to the magnitude of the motion blur produced by the screen (Watson, 2010). The duration of illumination was defined then simply as the interval between the onset time and offset time.
In the third test with random sequences of the shades of gray, the time period over which each frame was illuminated (i.e., the period between the onset and offset time) was determined with methods similar to those in other tests, except that the luminance did not change from full black to a given level of gray but rather, in most cases, from other shades of gray. Hence, the duration of illumination could not be determined accurately for each level of gray, the dark ones being least accurate. As a result, the illumination periods were first determined solely on the basis of the full white frames for which we used the darkest available shades of the preceding and succeeding frames. Within this time window we then calculated the mean luminance for all frames, including those with other levels of gray. Finally, for each level of gray (i.e., each target luminance), these individual averages were normalized relative to the gross average obtained across all 100 repetitions.
Results
We first investigated the consistency of brightness across different locations on the screen. The brightness of a full white statically presented image varied across locations in all three tested monitors. Typically, luminance was highest at the center of the screen. LCD-1, our candidate for a new visual stimulation monitor, exhibited least variability of all tested monitors, while LCD-2, an older model used for comparison, showed the largest variability (Figure 1A). The tested CRT monitor had also variability larger than LCD-1. In addition, as would be expected for back-lit LCDs, these monitors had the advantage of high constancy across different refresh rates, which was problematic for the CRT monitor. Therefore, although LCD-1 does not illuminate the screen with perfect homogeneity, it is much closer to this goal than other tested monitors. This disadvantage of the CRT monitor was compensated by its better luminance stability as a function of changes in viewing angles. When luminance was measured from distance and under an angle by a chroma-meter, the drop of luminance in the corners of the screen was much larger for LCD than for CRT. Consequently, the total drop of generated peripheral luminance about equaled for the two monitors, in one monitor being caused primarily by a reduction in the total amount of light generated (CRT) and in the other by the viewing angle (LCD).
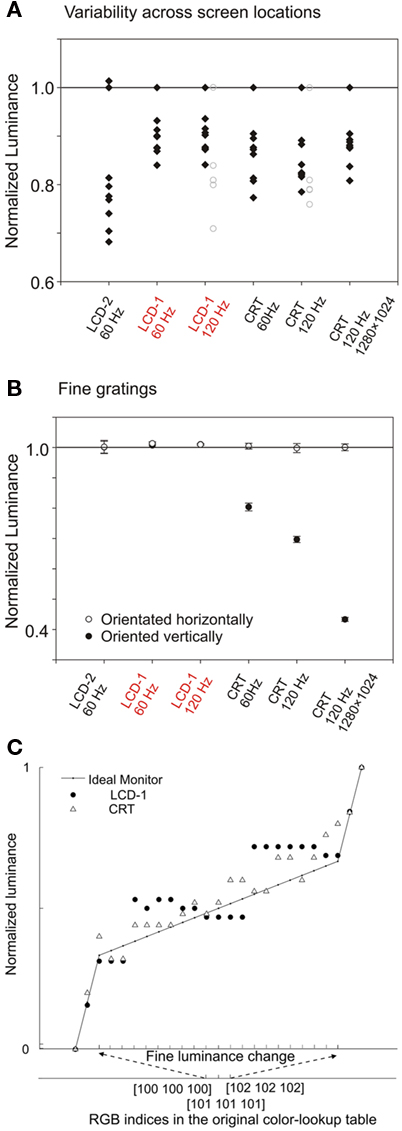
Figure 1. Spatial reliability of generated stimuli. (A) Variability of luminance across screen location. Diamonds: for each monitor and each setting (x-axis), luminance measures on the screen shown for nine different locations (eight along the borders and one in the center). Open circles: for CRT and LCD-1 at 120 Hz, the luminance measured from a viewing distance of 57 cm and from different angles, shown for five locations (the four centers of the borders and one screen center). For easy comparison, the luminance at the center locations was always taken as a norm (i.e., it has been assigned the value of 1.0), others being shown as proportions of the value at the center. Red: the new LCD model tested for the possible suitability for research in vision. (B) Luminance produced by fine (one-pixel wide stripes) gratings of different orientations. The luminance produced by gratings is shown relative to the expectation defined as 1/2 of the luminance produced by a white square (indicated by the horizontal line). Each data point is the normalized luminance averaged over nine locations. Error bar: 95% confidence interval. (C) Test of fine changes in luminance for the levels of gray. To examine the luminance resolution of the monitors, the color-lookup table was modified such that the luminance steps between adjacent RGB values were reduced to 1/10 of those in the default color-lookup table, as shown by the solid line. Hence, the RGB range in the x-axis covered a very small luminance span with fine changes that corresponded to the span of only three RGB values (100–102) of the original lookup table. y-Axis: the luminance normalized to the range measured in this test, which corresponds to about 2.4% of the total luminance range of the monitor.
The independence between neighboring pixels was confirmed for LCD monitors. Horizontally oriented black/white gratings produced in all cases luminance that corresponded accurately to 1/2 of the luminance of a fully white square, as expected (Figure 1B). Gratings oriented vertically produced also identical results when rendered on LCDs. However, when rendered on the CRT, consistent with previous reports (Pelli, 1997; Krantz, 2000), the luminance was reduced relative to the horizontal grating. This reduction became more severe with higher refresh rates and higher screen resolutions. In our most strenuous test (120 Hz refresh rate, 1280 × 1024 resolution), the luminance of the vertical grating got reduced on the CRT to ∼40% of that produced by the horizontal grating (Figure 1B). Thus, only LCD monitors, but not the CRTs, generate the luminance of the neighboring pixels independently.
Theoretically, the highest possible value of luminance contrast is 1, which would require the monitor to produce full black (i.e., zero luminance) with the RGB values (0 0 0). The minimal and maximal luminances for the CRT monitor were 0.7 lx and 145.6 lx, respectively and for LCD-1, 1.3 lx and 236.6 lx, respectively. Thus the contrasts were 99.0 and 98.9% for CRT and LCD-1, respectively. This indicates no substantial difference between the maximum contrasts of these two monitors.
The test of luminance resolution indicated that LCD-1 generated a different value of luminance for each RGB value, but not finer. By modifying the color-lookup table, we requested 21 levels of gray from the monitors within the very narrow range of luminance change corresponding to only three RGB levels of the original setup. In that setting, the monitors were still able to produce only about three levels (Figure 1C), as would be expected from 8-bit color depth screen. The three groups of measured luminance values (filled circles in Figure 1C) suggest that this limitation was imposed by digital technology. The results were similar for the measurements of individual color channels (Figure A2 in Appendix). In contrast, CRT monitor did not produce clear groups of luminance values as the values of luminance generated by this monitor deviated from the ideal in an irregular way (open triangles in Figure 1C). This would be expected from analog technology. In conclusion, both monitors seem to generate luminance levels accurately enough to achieve 8-bit color depth, each achieving this goal with a different technical solution.
Our second and more important set of tests was about precise temporally resolved measurements of the changes in luminance (see Methods). Repeated generations of an image enabled us to assess the reliability of the generated luminance. LCD-1 and CRT performed both excellently, as they produced identical luminance traces across repetitions. To illustrate this point, in Figure 2A, the non-averaged luminance traces of each of the 100 repetitions are shown superimposed for all tested monitors. As can be seen, no noticeable variability exists for LCD-1 and CRT. In contrast, LCD-2 exhibited problems in delivered luminance. The traces had an oscillatory component of ∼200 Hz which, at the maximum luminance, accounted for ∼11% of the total luminance. This oscillatory component was not locked to the refresh rate of the monitor, resulting in a thick region of overlap in Figure 2A. Therefore, only the newer LCD model repeats the generated luminance trace exactly.
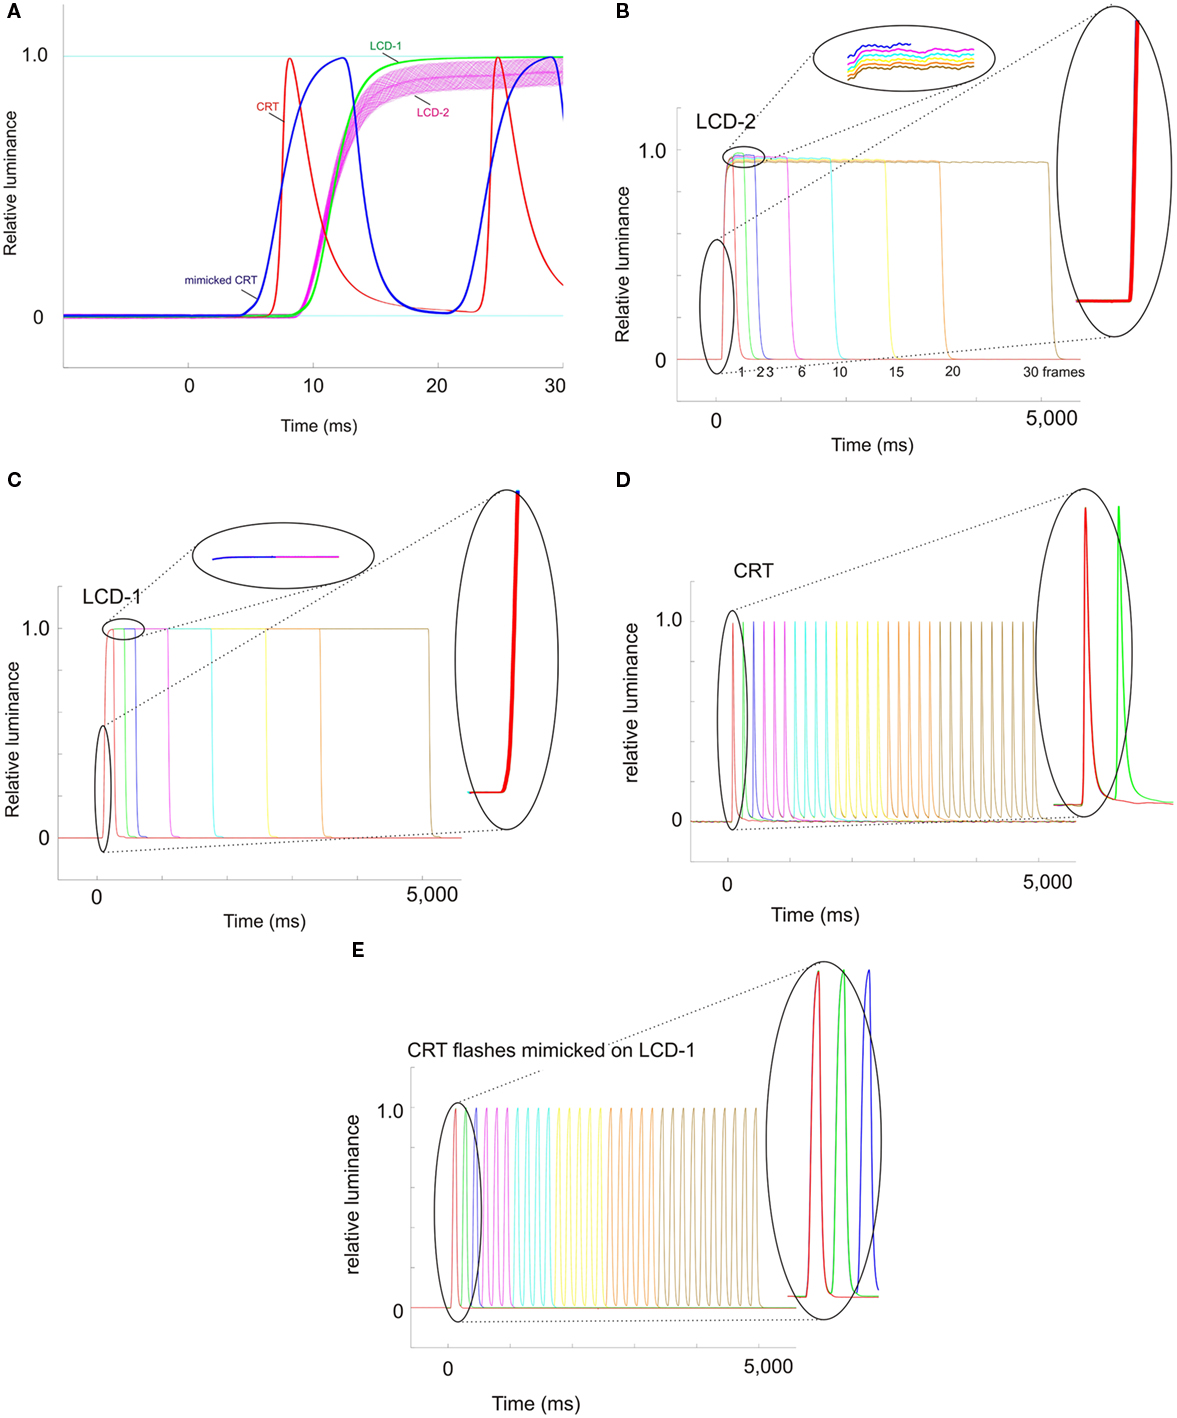
Figure 2. Precise timing of the changes in luminance. (A) Overlay of 100 traces of luminance measurements for a presentation of a full white stimulus, shown for three actual monitors and one mimicked monitor (mimicked CRT; every other frame of LCD-1 is set to full black). The measurements are made in all cases with 60 Hz refresh rate. The trace of LCD-1 is delayed relative to the CRT mimicked on LCD-1 because in the former case the monitor ran at 60 Hz while in the latter case its real underlying refresh rate was 120 Hz. The time 0 ms is the moment at which a digital pulse was sent. (B–E) Luminance traces averaged across 100 repetitions and produced by the different monitors at 60 Hz when stimuli of different durations are presented (1–30 frames; color coded). Zoom-in: detailed view for the first frames of the presentation.
Consistent with the precisely overlapping traces in Figure 2A for LCD-1 and CRT, the quantitative measures of the precision (i.e., error defined by 95% confidence interval) were also excellent for the onset time of the stimulus, for the time it needs to rise from the minimum to its maximum, and for the overall duration over which the stimulus was presented. These errors were less than 0.02 ms for all tested refresh rates.
Some of the advantages of the CRT monitor came from its flickering nature, the return to full black at each screen frame contributing to, e.g., the high consistency of the total generated luminance at each frame. Hence, when relevant, we also show the performance of LCD-1 when it mimics the flicker of the CRT monitor by using 120 Hz refresh rate to mimic a 60-Hz flicker-based generation of an image. These results are indicated as “Mimicked CRT” and are discussed at the end of the Section “Results.”
We also measured the stability of the peak intensity, i.e., the maximum luminance within a single presentation, across 100 presentations of a stimulus. LCD-1 and CRT had low errors of less than 0.04%. LCD-2, although not performing as well as the other two monitors, had nevertheless relatively low error of up to 0.11% of the maximum. Probably, all these errors would be acceptable for most research applications in vision.
The monitors were also similarly consistent when we used the luminance traces to calculate the average intensity of luminance generated along each stimulus presentation. The upper bound of the error across repeated presentations was around 0.07, 0.02, and 0.11% for CRT, LCD-1, and LCD-2, respectively. Therefore, all three monitors can be described as generally reliable in producing luminance across repeated presentations, with the exception that LCD-2 had an oscillatory component not locked to the refresh rate, as described above.
Ideally, an image should appear on the screen and disappear immediately. In other words, the luminance should change with a square-wave function. Unfortunately, the technology is not at that level and every monitor requires time to change from one luminance level to another, here referred to as rising and falling times. According to our measurement of the time constant of rising times, CRT monitors outperformed both LCDs (0.2–0.3 ms for CRT vs. 1.1 ms for LCD-1 and 1.5 ms for LCD-2, respectively). Therefore, the CRT built up luminance faster than the LCDs. However, CRT was not generally better in changing the luminance, as the opposite was the case for the time constant of falling time, which was longer for the phosphor of CRTs (1.7–1.9 ms) as compared to the modern liquid crystals (1.2 ms; see Figure 3A for details). Therefore, CRTs and LCDs can be considered about even in this test, one being faster in building luminance, and the other in returning back to full black.
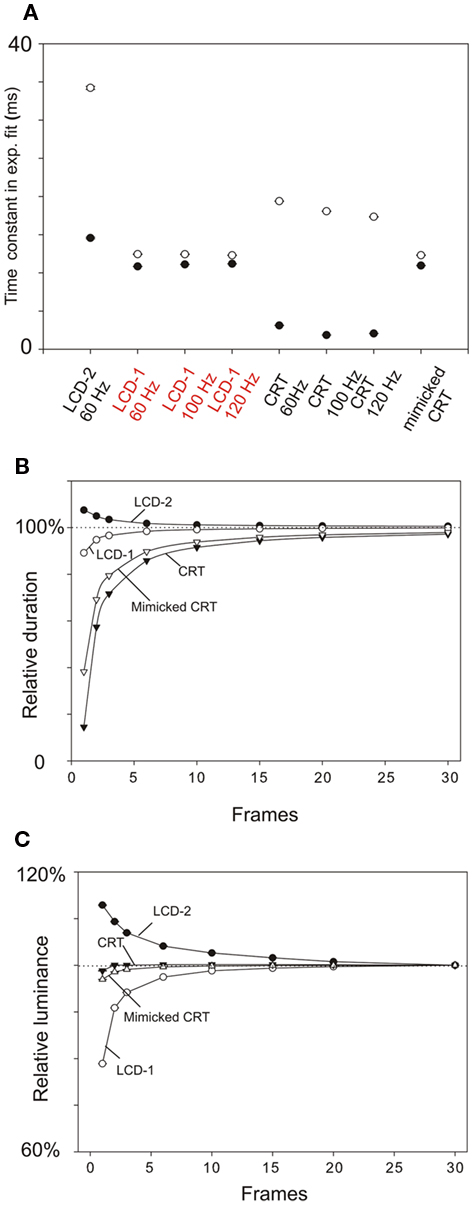
Figure 3. (A) The rising and falling times obtained for different monitors by fitting exponential functions to luminance traces. Filled circles: rising times; Open circles: falling times. (B) The duration over which stimuli are presented relative to the nominal duration specified by the number of screen frames, investigated at 60 Hz refresh rate. y-Axis: measured duration normalized relative to the nominal duration. (C) The amount of light delivered by the stimuli relative to the nominal amount computed from the number of screen frames, investigated at 120 Hz refresh rate. y-Axis: the total amount of luminance generated per frame normalized relative to that obtained by the longest presentation (30 frames).
Rising and falling times determine also the total time window over which a stimulus is presented. We compared how well the true duration of illumination corresponded to the nominal one computed by multiplying the number of presented frames with the nominal duration of the frame (1/refresh rate). The true duration corresponded always better to the nominal ones for LCDs than for the CRT, the latter being especially inaccurate with short nominal presentation times (one or two screen frames; see Figure 3B). The main reason for the inaccuracy of the CRT is that the effective time over which light has been generated is relatively short (e.g., only ∼3 ms).
An important related question is whether a monitor can reach 100% of its maximum intensity within a single frame of presentation. This was the case for neither of the tested monitors. The error was especially large for higher refresh rates and for the CRT monitor, which, at 120 Hz, delivered 4.28% smaller peak luminance at the first frame than at a later frame in which the maximum has been reached (the traces are shown in Figure A3 in Appendix). This should be compared to only 0.43% reduction in peak luminance at the first frame for LCD-1 running at 60 Hz (Figure 2C). Fortunately, these problems seem relevant only for the first one or two frames. With longer stimulus durations, these errors vanished quickly for both LCD-1 and CRT (already with >3 frames to <0.20%).
Liquid crystal display-2 delivered luminance also inconsistently over time. As our recording progressed over the period of ∼8 min (from 1-frame to 30-frame stimuli), the luminance produced by the light source gradually reduced in total by about 4% (see zoom-in in Figure 2B). Therefore, the source of light of that monitor is not necessarily stable but one may have to ensure that the monitor is on for a certain period of time (e.g., several tens of minutes) before it can be used for delivering visual stimuli. LCD-1 and CRT did not suffer from this problem (zoom-ins in Figures 2C–E).
Although LCD-1 was better than CRT in reaching maximum intensity at the first frame, it was worse in the total amount of luminance generated at the first frame when compared to later frames (Figure 3C). If the same image is shown for different numbers of frames, ideally, the amount of light delivered would be proportional to the number of frames, e.g., the light energy of a one-frame presentation would be one-tenth of that of a ten-frame presentation. The results indicated that CRT was the closest to this goal. A comparison between blocks with shortest duration (only one frame) and longest duration (30 frames), lead to a discrepancy of up to 20% in LCD-1, compared to only 2% in CRT.
Our final set of questions was about possible temporal dependences between frames in the delivered luminance by displaying images of varying shades of gray sequentially one frame after another. For both LCD-1 and CRT monitors, the luminance generated at the current screen frame depended to a degree on the luminance of the preceding frame. High preceding luminance always increased the luminance of the current frame (Figures 4A,B; also Figure A4 in Appendix) and vice versa, low luminance in the preceding frame reduced the luminance of the current frame. In LCD, this was a carry-over effect due to the non-zero time needed to switch from one luminance level to the other, as can be seen in Figure 4A. In the CRT, this carry-over effect (Figure 4B) occurred perhaps due to insufficiently quick change in voltage in the emission guns. Note that in LCD-1, toward the end of the frame also a small reversal of luminance occurred: high preceding luminance tended to reduce slightly the luminance generated at the very end of the current frame. The coefficients of variation (target luminance vs. actual luminance) are shown for all monitors and all target luminance values in Figure 4D. As one can see, LCD-1 performed better than CRT for lower target luminance (RGB values <∼80, 80, 80), and this reversed for higher target luminance (e.g., RGB value >120, 120, 120), CRT generating luminance more accurately than LCD-1. Notice also that in most cases, with higher refresh rate the actual luminance varied also more.
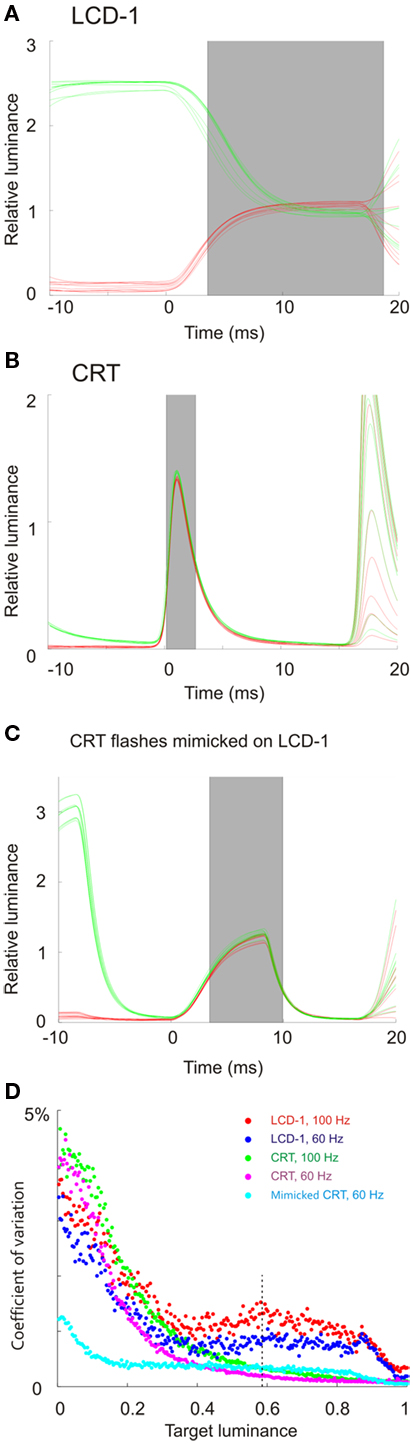
Figure 4. The effects of the preceding screen frame on the generated luminance. (A–C) Traces of measured luminance for the specified RGB value (150, 150, 150), obtained following either high luminance of the preceding frames (green) or low (red). Ten traces are shown for each color. All plots are shown for refresh rates of 60 Hz. Gray box: the actual duration of illumination during the frame as defined in our analyses (see Methods). (D) The summary of the results for all different values of target luminance and for all monitors and all tested refresh rates, shown as coefficients of variation. The target luminance is shown normalized relative to the maximum (RGB 255, 255, 255). Vertical dashed line: the target luminance used for plots in [(A–C) RGB 150, 150, 150].
Finally, the mimicked CRT exhibited the advantages of both LCD-1 and CRT. This monitor had very accurate onset, rising, and falling times, inherited from LCD-1 (see Figure 2E). The same held for the actual duration of the stimulation, which was generated more accurately than by the CRT monitor (see Figure 3B). Also, this mimicked monitor had good average intensity of generated luminance due to the repeatable return to full black, a property of the CRT (Figure 2E). In Figures 4C,D one can see that this resulted in very low temporal dependence on luminance generated in the preceding frame, the coefficient of variation being especially favorable with low target luminance.
Discussion
In general, a researcher in vision needs a monitor that creates stimuli as close as possible to their formal specification. The duration and intensity of the stimuli should linearly scale with the values specified in the software and the values should remain constant across contextual and other variables, such as the immediately preceding stimuli, stimulus position on the screen, size, or orientation of the stimulus, etc.
Our results indicate that a new model of LCD can satisfy most of these needs and that in many cases should be preferred over the CRT monitor. Although the luminance of LCD decreases with an increase in viewing angle, LCD generates luminance more consistently over different screen locations, which makes LCD, as a net result, about even with CRT. In addition, the luminance of the neighboring pixels is independent in LCD only. Therefore, good reasons exist to prefer LCD over CRT, in experiments in which these spatial variables are of concern.
The temporal variables, i.e., the speed and the temporal accuracy of the changes in luminance have improved significantly with the new model, which even leads in several categories. By not producing flicker in the frequency of the refresh rate of the monitor, the LCD monitor has the advantage of continuous illumination and has much better agreement between the actual duration of the stimulus and the nominal duration specified by the software. The tested LCD monitor responds fast and is negligibly slower than CRT in changing the luminance from zero to the maximum. LCD is even faster than the CRT in returning from the maximum back to zero.
There is one situation in which the CRT may be still preferred over LCD. The luminance dependency on the preceding frame in LCD may have undesirable carry-over effects in experiments with fast exchange of screen luminance. An example is binocular rivalry induced using shutter glasses. In such a case, it may be advisable to use either a CRT monitor or an LCD in a mimicked CRT mode.
If the stimulus design requires only one- or two-frame long presentations; the total amount of light generated does not scale linearly with the number of frames in LCD. In a single frame, LCD will underperform more in the amount of generated luminance than the CRT. This problem can be remedied on the LCD if the exact amount of delivered luminance can be measured, e.g., as made in the present study. In the case that the experimental design allows for low refresh rates (60 Hz), another possibility exists: the flickering property of the CRT can be mimicked on a fast LCD (120 Hz) by setting every second frame to full black. As our results show, this CRT-mimicking approach offers even higher temporal accuracy than does CRT, as the setup combines the respective advantages of CRT and LCD monitors.
Our perceptual experience with the use of the monitor was in agreement with the measurements. For example, the perceived motion blur matched the measurements of rising and falling times. CRT seemed to produce less motion blur than LCD-1 when a dark object moved on a bright background, which was in agreement with the short rising time of the CRT. However, the opposite was the case when a bright object moved on a dark background. In that condition, the overall largest extent of motion blur was perceived on the CRT, which was in agreement with the unusually long falling time of that monitor. During our tests of LCD-1, we detected no other artifacts despite having run the most demanding stimuli, such as the full contrast full-speed flickering and fast moving images.
One limitation for all monitors is that they draw each frame sequentially, starting from the upper left corner and proceeding to the right. This has as consequence that different parts of the screen are illuminated at different times, delays being especially large along the vertical axis. For example, in any task that measures response times (physiological or behavioral) to stimuli presented at different vertical locations on the screen, several milliseconds of differences (sometimes up to 10 ms) will be necessarily created by the monitor.
In conclusion, as the technology of LCD monitors keeps improving, some of the other novel models may have even better performance. Due to the variability of technical solutions no suitability for research should be assumed but each model should be tested thoroughly. Also, no suitability for all research questions in vision should be assumed for the presently evaluated model. We did not make all possible tests relevant for research in vision. For example, the accuracy with which colors are generated was not addressed. Hence, we cannot conclude that the tested monitor is suitable for all research problems in vision. Nevertheless, the model that has excellent timing and generates stimulus intensities accurately, which makes it usable for many applications in vision research.
Conflict of Interest Statement
The authors declare that the research was conducted in the absence of any commercial or financial relationships that could be construed as a potential conflict of interest.
Acknowledgments
This study was supported by Max-Planck Society, Frankfurt Institute for Advanced Studies, the Hertie Foundation, DFG grant number NI 708/2-1, the Hertie Foundation, and by research grant 01GQ0840 of the German Federal Ministry of Education and Research (BMBF) within the “Bernstein Focus: Neurotechnology.” We thank Wolf Singer for valuable comments.
References
Andrews, T. J., White, L. E., Binder, D., and Purves, D. (1996). Temporal events in cyclopean vision. Proc. Natl. Acad. Sci. U.S.A. 93, 3689–3692.
Brainard, D. H. (1989). Calibration of a computer controlled color monitor. Color Res. Appl. 14, 23–34.
Bridgeman, B. (1998). Durations of stimuli displayed on video display terminals: (n − 1)/f + persistence. Psychol. Sci. 9, 232–233.
Bukhari, F., and Kurylo, D. D. (2008). Computer programming for generating visual stimuli. Behav. Res. Methods 40, 38–45.
Carmel, D., Lavie, N., and Rees, G. (2006). Conscious awareness of flicker in humans involves frontal and parietal cortex. Curr. Biol. 16, 907–911.
Fischmeister, F. P. S., Leodolter, U., Windischberger, C., Kasess, C. H., Schopf, V., Moser, E., and Bauer, H. (2010). Multiple serial picture presentation with millisecond resolution using a three-way LC-shutter-tachistoscope. J. Neurosci. Methods 187, 235–242.
Krantz, J. H. (2000). Tell me, what did you see? The stimulus on computers. Behav. Res. Methods Instrum. Comput. 32, 221–229.
Kristofferson, A. B. (1967). Successiveness discrimination as a two-state, quantal process. Science 158, 1337–1339.
Krolak-Salmon, P., Henaff, M. A., Tallon-Baudry, C., Yvert, B., Guenot, M., Vighetto, A., Mauguière, F., and Bertrand, O. (2003). Human lateral geniculate nucleus and visual cortex respond to screen flicker. Ann. Neurol. 53, 73–80.
Mollon, J. D., and Polden, P. G. (1978). Time Constants of Tachistoscopes. Q. J. Exp. Psychol. 30, 555–568.
Packer, O., Diller, L. C., Verweij, J., Lee, B. B., Pokorny, J., Williams, D. R., Dacey, D. M., and Brainard, D. H. (2001). Characterization and use of a digital light projector for vision research. Vision Res. 41, 427–439.
Pelli, D. G. (1997). Pixel independence: measuring spatial interactions on a CRT display. Spat. Vis. 10, 443–446.
Watson, A. B. (2010). Display motion blur: comparison of measurement methods. J. Soc. Inf. Disp. 18, 179–190.
Wiens, S., Fransson, P., Dietrich, T., Lohmann, P., Ingvar, M., and Ohman, A. (2004). Keeping it short: a comparison of methods for brief picture presentation. Psychol. Sci. 15, 282–285.
Williams, P. E., Mechler, F., Gordon, J., Shapley, R., and Hawken, M. J. (2004). Entrainment to video displays in primary visual cortex of macaque and humans. J. Neurosci. 24, 8278–8288.
Keywords: visual stimulation, display, stimulus delivery, precise timing, LCD, CRT
Citation: Wang P and Nikolić D (2011) An LCD monitor with sufficiently precise timing for research in vision. Front. Hum. Neurosci. 5:85. doi: 10.3389/fnhum.2011.00085
Received: 11 April 2011; Accepted: 01 August 2011;
Published online: 18 August 2011.
Edited by:
Michael X. Cohen, University of Amsterdam, NetherlandsReviewed by:
Clifford D. Saron, University of California at Davis, USATomas Knapen, University of Amsterdam, Netherlands
Copyright: © 2011 Wang and Nikolić. This is an open-access article subject to a non-exclusive license between the authors and Frontiers Media SA, which permits use, distribution and reproduction in other forums, provided the original authors and source are credited and other Frontiers conditions are complied with.
*Correspondence: Danko Nikolić, Department of Neurophysiology, Max-Planck Institute for Brain Research, Deutschordenstr. 46, 60528 Frankfurt am Main, Germany. e-mail: danko.nikolic@gmail.com