 Prabina K. Meher
 Tanmaya K. Sahu
 Shachi Gahoi
 Atmakuri R. Rao
- 1Division of Statistical Genetics, ICAR-Indian Agricultural Statistics Research Institute, New Delhi, India
- 2Centre for Agricultural Bioinformatics, ICAR-Indian Agricultural Statistics Research Institute, New Delhi, India
Heat shock proteins (HSPs) play a pivotal role in cell growth and variability. Since conventional approaches are expensive and voluminous protein sequence information is available in the post-genomic era, development of an automated and accurate computational tool is highly desirable for prediction of HSPs, their families and sub-types. Thus, we propose a computational approach for reliable prediction of all these components in a single framework and with higher accuracy as well. The proposed approach achieved an overall accuracy of ~84% in predicting HSPs, ~97% in predicting six different families of HSPs, and ~94% in predicting four types of DnaJ proteins, with bench mark datasets. The developed approach also achieved higher accuracy as compared to most of the existing approaches. For easy prediction of HSPs by experimental scientists, a user friendly web server ir-HSP is made freely accessible at http://cabgrid.res.in:8080/ir-hsp. The ir-HSP was further evaluated for proteome-wide identification of HSPs by using proteome datasets of eight different species, and ~50% of the predicted HSPs in each species were found to be annotated with InterPro HSP families/domains. Thus, the developed computational method is expected to supplement the currently available approaches for prediction of HSPs, to the extent of their families and sub-types.
Introduction
In the course of constant interaction between life and environment, cell experiences different environmental stresses that slow down its original function including DNA, RNA, and protein synthesis (Csermely and Yahara, 2005). Further, almost all these stresses induce a group of proteins called as heat shock proteins (HSPs) that are found almost in all living organisms (Al-Whaibi, 2011). HSPs are considered as a major group of molecular chaperones assisting in proper folding of partially folded or denatured proteins, organization of correct protein conformation, and prevention of irreversible aggregation of damaged proteins (Hubbard and Sander, 1991; Zeng et al., 2004; Poulain et al., 2010). Six major families of HSPs viz., HSP20, HSP40, HSP60, HSP70, HSP90, and HSP100 have been reported based on molecular weight and functions (Ratheesh et al., 2012; Feng et al., 2013). Besides chaperonin activities, HSPs are also known to be involved in other functions like modulation of their synthesis (Blaszczak et al., 1999), participation in signal transduction pathways (Louvion et al., 1998), RNA processing (Ruggero et al., 1998) etc. Furthermore, HSPs play vital role in maintaining the overall cellular protein homeostasis (Mallouk et al., 1999; Tytell and Hooper, 2001). Due to broad range of functions of HSPs, their dysfunction causes many serious disorders. In particular, aggregation of misfolded proteins causes many neurodegenerative diseases including Alzheimer's and Parkinson's disease (Hamos et al., 1991; Wu et al., 2004; Adachi et al., 2009; Arawaka et al., 2010; Sajjad et al., 2010; Maiti et al., 2014; Paul and Mahanta, 2014; Lackie et al., 2017), cardiovascular disease (Pockley, 2002), and cancer (Goldstein and Li, 2009). The HSPs can also be used as therapeutic targets for cancer treatment (Chatterjee and Burns, 2017; Saini and Sharma, 2017; Wu et al., 2017), diagnosis of neurodegenerative disorders (Kampinga and Bergink, 2016), and preventing the onset and progression of atrial fibrillation (Hu et al., 2017). Owing to the wide range of activities of HSPs, identification of HSPs, and categorizing them into different families is an important and challenging problem (Feng et al., 2013; Ahmad et al., 2015).
The advancement of relatively cheaper sequencing technologies has witnessed a huge volume of protein sequences that are added to the public databases (Feng et al., 2013; Ahmad et al., 2015; Kumar et al., 2016). Due to lack of experimentally validated structures in the databases, resource intensive traditional method like nuclear magnetic resonance (NMR) has become inappropriate for identifying HSP families in large protein datasets (Redfield, 2004; Lange et al., 2012; Nasedkin et al., 2015). Thus, the development of computational method for identifying HSPs and their families is essential due to their inexpensive and high throughput nature. To this end, some computational methods i.e., iHSP-PseRAAAC (Feng et al., 2013), JPred (Feng et al., 2014), JPPRED (Zhang et al., 2015), and PredHSP (Kumar et al., 2016) have already been developed in the recent past. In iHSP-PseRAAAC, support vector machine (SVM) was used for predicting six different families of HSPs, based on reduced alphabet amino acid composition (AAC) features of protein sequences. The JPred was developed for prediction of four types of HSP40 (DnaJ) proteins (Type-I, Type-II, Type-III, and Type-IV) based on composition of clustered amino acids and SVM predictor. In another approach, Ahmad et al. (2015) employed different supervised learning techniques viz., k-nearest neighbor, probabilistic neural network, SVM, and artificial neural network for prediction of six different families of HSPs as well as four different types of DnaJ proteins, based on different compositional features viz., pseudo AAC, split AAC, and di-peptide compositions (DPC). The JPPRED employed a more complex set of features for predicting different DnaJ proteins. Keeping in mind the fact that a protein sequence should be predicted first as HSP before being predicted to its family, PredHSP was developed based on DPC using SVM. It identifies HSPs in the first stage and classifies them into different families in the second stage. Each of the above mentioned approaches has their own advantages, and contributed in generating knowledge for predicting HSPs. Though reasonable results have been achieved in identifying HSP families, still there is a room for improvement. In particular, there is a need to improve the accuracy of prediction of HSPs and non-HSPs. Moreover, none of the above mentioned tools were designed to predict all the three components viz., HSPs, six families of HSPs, and four types of DnaJ proteins in a single framework. Thus, the development of a new computational approach is required for the prediction of all these three components reliably, and in a single framework as well.
Taking above prospects into consideration, we made an attempt in this study to develop a novel computational method for predicting all the three components in a single framework. In the proposed approach, G-spaced di-peptide compositions were used as input features and SVM as the prediction machine. The proposed approach achieved higher accuracy than most of the existing approaches in predicting HSPs, six families of HSPs and four types of DnaJ proteins, while compared using benchmark datasets. Besides, an online prediction server has also been developed to help enable the researchers, scientists and other stakeholders in predicting HSP families and their sub-types with higher accuracy.
Materials and Methods
As stated in many recently published articles (Chen et al., 2016; Jia et al., 2016c; Liu B. et al., 2016; Liu Z. et al., 2016; Qiu et al., 2016; Meher et al., 2017), five steps should be followed to set up a sequence-derived-features based statistical predictor. The steps are as follows:
i. Build standard training and test datasets to effectively train and test the predictor.
ii. Map the input biological sequences into such numeric feature vectors which can truly reflect their inherent association with the target.
iii. Develop an efficient prediction algorithm.
iv. Properly perform the cross-validation tests.
v. Develop an online prediction server, which is freely accessible to the users.
In the following sub-sections, we have described these steps one-by-one.
Dataset
We considered the same dataset which was used to develop PredHSP. This dataset contains 2,225 true HSP and 10,000 non-HSP sequences. The true HSP dataset was actually constructed by Feng et al. (2013) to develop iHSP-PseRAAAC, where the sequences were originally collected from HSPIR database (Ratheesh et al., 2012). Though HSPIR contains >9,900 sequences belonging to 277 genomes of both prokaryotes and eukaryotes, the true HSP dataset was constructed after removing the sequences with ≥40% pair-wise sequence identity in each family of HSP, to reduce homologous bias and redundancy. Further, the non-HSP dataset consisting of 10,000 sequences was created first time in PredHSP, where the sequences were randomly drawn from Swiss-Prot (http://web.expasy.org/docs/swiss-prot_guideline.html) based on the criterion that no two sequences are homologous. After removing the sequences with non-standard residues (residues other than 20 amino acids), a final dataset consisting of 2,181 HSPs (354 HSP20, 1,257 HSP40, 159 HSP60, 278 HSP70, 52 HSP90, and 81 HSP100) and 9,965 non-HSPs was prepared (Table 1).
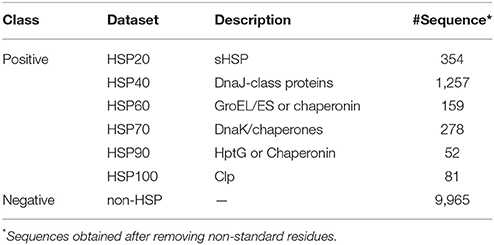
Table 1. Summary of the positive and negative datasets.
Construction of Balanced Dataset
The final dataset (2,181 HSPs and 9,965 non-HSPs) is highly imbalanced, because the number of sequences in non-HSP dataset are much higher than that of HSP dataset. By using the highly imbalanced dataset to train the prediction model, the results may get biased toward the class having larger number of sequences i.e., major class (Chou, 2013; Chen et al., 2015; Liu Z. et al., 2015; Xiao et al., 2015; Jia et al., 2016b; Liu B. et al., 2017). In order to reduce the biasness, balanced datasets having approximately same number of HSP and non-HSP sequences were constructed for classification of HSPs and non-HSPs. More clearly, balanced datasets consisting of 2,180 HSPs and 2,180 non-HSPs were prepared for classification of HSPs and non-HSPs, which were randomly drawn from 2,181 HSPs and 9,965 non-HSPs, respectively. Classifications were also made among different families of HSPs where a particular family is considered as the positive set and the remaining families together as negative set. Moreover, performances of prediction models were assessed using leave-one-out cross-validation (LOOCV) technique as similar to the earlier studies (Feng et al., 2013; Ahmad et al., 2015; Kumar et al., 2016).
Feature Generation
Sequence-derived features viz., AAC and DPC were previously used by Kumar et al. (2016) where the accuracy under DPC feature was found to be higher than that of AAC. The reason behind this could be the local ordering of amino acids that are not accounted in AAC. On the other hand, the DPC not only encapsulates the local ordering of amino acids but also the global information of each protein sequence (Bhasin and Raghava, 2004; Ding et al., 2004). Keeping this in mind, four kinds of DPC i.e., 0-spaced, 1-spaced, 2-spaced, and 3-spaced were used, which are nothing but the frequencies of all pairs of amino acids conditioned with 0, 1, 2, and 3 skips, respectively (Govindan and Nair, 2011). Besides, all possible combinations of 0-, 1-, 2-, and 3-gap (spaced) amino acid pair compositions (GPC) were also used as features. Since, composition-transition-distribution (CTD), autocorrelation function (ACF), and pseudo-AAC (PAAC) features also take into account the local ordering of amino acids as similar to GPC, they were considered as features. For computing these features, BioSeqClass package (Hong, 2016) of R-software (R Development Core Team, 2012) was used. A brief description about the computation of GPC, PAAC, CTD, and ACF features is provided below.
G-Spaced Amino Acid Pair Composition (GPC)
Each kind of GPC gives 400 descriptors, which can be defined as , where DG(i, j) is the number of amino acid pairs represented by amino acid i and j with G-gap, fG(i, j) represents the frequency of occurrence and N is the length of sequence.
Pseudo Amino Acid Composition (PAAC)
The PAAC was first time used by Chou (2001) for the prediction of protein sub-cellular localization. Unlike the discrete AAC, the effects of sequence ordering are taken into consideration in PAAC. This feature has been verified effectively in many protein-related classifications (Wang et al., 2010). Based on the PAAC features, each protein sequence can be mapped onto a (20+d)-dimensional numeric feature vector for d-tier correlation factor. In the current study, 1st-tier correlation was only considered by which each sequence was converted into a numeric vector of 21 elements. Though more details can be found from the studies of Chou (2005, 2009), a brief description about computing the PAAC features is as follows:
Let ψ1ψ2ψ3 … ψL−2ψL−1ψL be a protein sequence of L amino acids long. Then, the ordering of amino acids in the sequence can be represented by a set of discrete correlation factors ρ1, ρ2, …, ρd, where
The ρ1, ρ2, …, ρd are called the 1st, 2nd, …, dth tier correlation factors, respectively. The correlation function Φ(ψi, ψi+j) is given by , where Θ(ψi) is the transformed feature value of amino acid ψi. The value of Θ(ψi) can be computed from the original feature value Θo(ψi) as follows:
Thus, the PAAC of a protein can be represented by a (20+d)-dimensional vector as [θ1, θ2, …, θ20, θ21, …, θ20+d]′, where θx is represented as
where fx represents the occurrence of frequencies for the 20 amino acids in the protein sequence, ρj represents the jth tier sequence correlation factor and w represents the weight for the sequence-order effect.
Composition-Transition-Distribution (CTD)
Dubchak et al. (1995) introduced the CTD feature for the prediction of protein folding classes. Since its introduction, it has been widely used in many functional and structural related studies of proteins (Cai et al., 2003; Govindan and Nair, 2011). In CTD feature, composition (C) stands for the composition of amino acids, transition (T) represents the percent frequency with which residues of certain characteristics are followed by other amino acids, and distribution (D) determines the sequence length within which the first, 25, 50, 75, and 100% of the amino acids of certain characteristics are placed. With the CTD feature, each protein sequence of length L was mapped into a numeric vector of length L + {L * (L−1)/2} + (L * 5).
Autocorrelation Function (ACF)
Features based on ACF take into consideration the dependencies between the sequence features at each location. ACF-based features are computed by taking into account the distribution of amino acid properties along the sequence. In this study, ACF features were computed based on all the 531 amino acid indices available in AAindex database (Kawashima and Kanehisa, 2000). With ACF feature encoding, each sequence was transformed into a 531*n-dimensional numeric feature vector, for nth order autocorrelation. Here, we considered the 1st and 2nd order autocorrelation only, because the number of features will increase geometrically with increase in the order.
Support Vector Machine (SVM)
The SVM supervised learning technique (Cortes and Vapnik, 1995) has been extensively used in the area of computational biology and bioinformatics (Chou and Cai, 2002; Chen and Lin, 2010; Lin and Ding, 2011; Xiao et al., 2012; Chen et al., 2013). In the context of predicting HSPs, SVM has already been used in earlier studies (Feng et al., 2013, 2014; Ahmad et al., 2015; Zhang et al., 2015; Kumar et al., 2016). The kernel functions play vital role as far as the predictive ability of SVM is concerned. Using the kernel function, the input dataset is transformed into a high-dimensional feature space in which the observations of different classes are linearly separable by optimal separating hyper plane. We also employed SVM for prediction purpose in this study. Based on a sample dataset of 1,000 HSPs and 1,000 non-HSPs, all the four basic kernels (Linear, Polynomial, Radial, and Sigmoid) with default parameters setting were initially used to assess the prediction accuracy. Then, the model with the best fitted kernel (having highest accuracy) was chosen and used in the subsequent analysis. The svm function available in e1071 package (Dimitriadou et al., 2012) of R-software was used for implementing SVM model.
Evaluating the Performance
Cross-validation is an essential tool in machine learning and statistics. This procedure estimates the expected error of a learning algorithm by running training and testing procedures repeatedly on different partitions of the dataset (Geras and Sutton, 2013). Here, five-fold cross-validation procedure was adopted for evaluating the performance of the developed approach. In this procedure, the dataset was partitioned into five sets randomly, where in each set almost same number of HSPs and non-HSPs were present. Four out of five sets were used to train the prediction model and the remaining one set was used for validation. Each set was used once for validation and thus the whole process was repeated five times. The performance of the method was measured by taking average over the five sets. We considered the evaluation metrics, viz., sensitivity, specificity, accuracy, precision, and Matthew's correlation coefficient (MCC) to evaluate the performance of the proposed approach because these measures have been widely accepted by researchers (Guo et al., 2014; Lin et al., 2014; Liu B. et al., 2014, 2016; Jia et al., 2016a,d; Liu et al., 2016; Meher et al., 2017) for assessing the performance of statistical predictor. The above mentioned performance metrics are defined as follows:
where tp, tn, fp, and fn represent the number of HSPs correctly classified, non-HSPs correctly classified, non-HSPs misclassified as HSPs and HSPs misclassified as non-HSPs, respectively. As receiver operating characteristics (ROC) is also a widely used measure (Baten et al., 2006), we further used area under ROC curve (AUC-ROC) (Fawcett, 2006; Davis and Goadrich, 2013) to evaluate the prediction accuracy of the proposed approach. Furthermore, ROC is independent of class distribution and precision-recall is a better measure over ROC under imbalanced situation. Thus, areas under precision-recall curve (AUC-PR) were used for comparing the performance of the developed approach with the existing methods.
Comparison with Existing Methods
PredHSP is the only tool available in literature for classification of HSP and non-HSP proteins. Thus, comparison was made between the performances of PredHSP and the proposed approach by using two independent datasets. The first independent dataset contains 96 human HSPs collected from HUGO Gene Nomenclature Committee (HGNC) database and the second dataset comprises of 55 rice HSPs, where 31 HSPs (14 HSP20, 4 HSP60, 7 HSP70, 3 HSP90, and 3 HSP100) were obtained from Wang et al. (2014) and 24 HSP70 were obtained from Sarkar et al. (2013). We used these datasets to compare our developed approach with the PredHSP, as the same datasets have been used to evaluate the performance of PredHSP. Besides, we have also prepared a non-HSP dataset consisting of 5,000 sequences that were randomly drawn from UniProt (http://www.uniprot.org/), where none of the sequences has >40% pair-wise sequence identity to any other sequences in the dataset. We constructed this independent negative dataset to evaluate the performance of the PredHSP as well as to compare with that of proposed approach, because the PredHSP has not been evaluated with any independent negative dataset. Further, the classification accuracy of the developed approach was compared against the existing methods viz., PredHSP, iHSP-PseRAAAC, and Ahmad et al. (2015) approach with respect to classification of different families of HSPs. The performances were compared using 354 HSP20, 1,257 HSP40, 159 HSP60, 278 HSP70, 52 HSP90, and 81 HSP100 sequences, because the same datasets have been used to evaluate the performance of PredHSP, iHSP-PseRAAAC, and Ahmad et al. (2015) approach for classifying different families of HSPs. For classification among different families of HSPs, LOOCV technique was employed to assess the performances.
Prediction of DnaJ Protein Types
Besides classifying different families of HSPs, classifications were also made among four different types of J-proteins (Type-1, Type-II, Type-III, and Type-IV). The sequences of J-proteins were obtained from an earlier study (Feng et al., 2014), accessible at http://cabgrid.res.in:8080/ir-hsp/dataset.html. These J-proteins datasets, which were originally derived from HSPIR database, were prepared after removing the sequences with non-standard residues as well as the sequences having >40% pair-wise sequence identities. The constructed dataset comprises of 63 Type-I, 53 Type-II, 1,107 Type-III, and 22 Type-IV sequences. Since the number of sequences are small in different types (except Type III), LOOCV was adopted for assessing the performance. These datasets have been used to evaluate the performances of JPred and JPPRED, for classification of four types of DnaJ proteins. Therefore, we have also used the same datasets to evaluate the proposed computational approach as well as to compare with the above mentioned approaches. As the datasets are highly imbalanced, AUC-PR was also used along with the other metrics for comparing the performances.
Performance Evaluation with Interpro Dataset
Since, the positive independent datasets used to evaluate the performances of PredHSP and the proposed approach are very small (96 human HSPs and 55 rice HSPs, as mentioned in section Comparison with Existing Methods), the predictive abilities of the developed computational method and PredHSP were also assessed using HSPs of different families, which were collected from InterPro database (https://www.ebi.ac.uk/interpro/). The number of sequences in different families/domains, obtained after removing the non-standard amino acids, are provided in Table 2. We did not consider HSP100 because no match was found for the keyword HSP100 in InterPro.
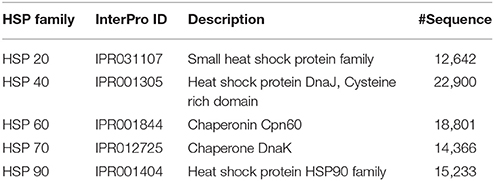
Table 2. Number of HSP sequences collected from InterPro, corresponding to different HSP families.
Proteome-Wide Identification
The proposed approach was also employed for proteome-wide identification of HSPs and their families. Since HSPs are present in all the three domains of life, we considered eight different proteomes belonging to archaea (Methanothermobacter thermautotrophicus), prokaryotes (Mycobacterium tuberculosis and Escherichia coli), and eukaryotes (Arabidopsis thaliana, Saccharomyces cerevisiae, Drosophila melanogaster, Oryza sativa, and Caenorhabditis elegans). The total number of proteins collected are 1,857, 4,187, 3,873, 6,479, 30,036, 37,228, 25,878, 20,249 for M. thermautotrophicus, E. coli, M. tuberculosis, S. cerevisiae, A. thaliana, O. sativa, C. elegans, and D. melanogaster, respectively.
Development of Prediction Server
To augment the practical applicability of the developed approach as well as to make use of the proposed approach convenient for the experimental scientists, a web server was also designed and hosted for the prediction of HSPs, their families and sub-types of DnaJ proteins. The server was developed using hypertext mark-up language (HTML) and hypertext pre-processor (PHP), where an in-house R-script was executed in the backend upon submitting protein sequences in single letter code format. The user can submit one or more protein sequences in FASTA format where each sequence should contain only standard amino acid residues.
Results
Analysis of Kernels and Features
Based on the sample dataset of 1,000 HSPs and 1,000 non-HSPs, performance metrics for different combinations of GPC features (computed by taking average over five-folds) for all the four kernels are shown in Figure 1A. With some exceptions in sensitivity, it is observed that the performance metrics for the radial basis function (RBF) kernel are higher than that of other kernels. It is further observed that the performance metrics are higher for the combined 0-, 1-, 2-, and 3-gap amino acid pair features (GPC-0123), irrespective of the kernels used. From ROC curves of different features (Figure 1B), it is also seen that the area covered under ROC curve of GPC-0123 feature is higher than that of other feature sets i.e., PAAC, CTD, ACF of 1st order (ACF-1), and ACF of 2nd order (ACF-2). In addition, sensitivity, specificity, accuracy, and MCC are also observed to be higher for the GPC-0123 feature set (Figure 1C). Furthermore, it can be observed that the performance metrics under GPC-0123 feature set are much higher than that of DPC feature i.e., GPC-0 (Figure 1A), which is adopted in PredHSP for the prediction of HSPs and their families.
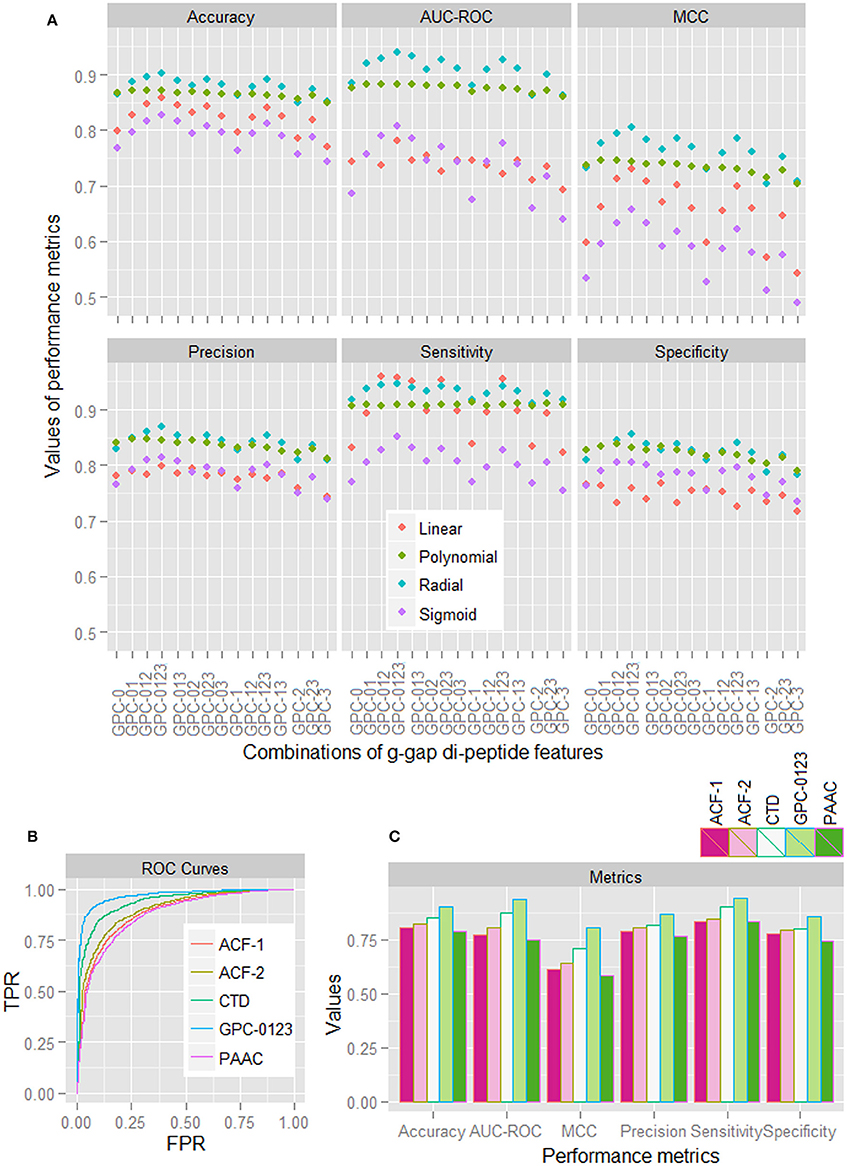
Figure 1. (A) Performance metrics of SVM for four different kernels, under different combinations of 0-, 1-, 2-, and 3-spaced base pair features. (B) ROC curves for SVM with RBF kernel, under different feature sets i.e., ACF-1, ACF-2, CTD, GPC-0123, and PAAC. (C) Values of different performance metrics for SVM with RBF kernel under different feature sets. It can be seen that the values of performance metrics for SVM with RBF kernel under GPC-0123 feature set are higher than that of other feature sets.
Feature Selection Analysis
Although the prediction accuracies are observed to be higher for GPC-0123 feature set (Figure 1), the number of features in GPC-0123 are large (1,600) and prediction analysis by using such a large number of features may take longer time. Thus, we employed five different feature selection techniques viz., F-measure (FM) (Golub et al., 1999), Information gain (IG) (Alhaj et al., 2016), LASSO (Tibshirani, 1996), Random Forest (Breiman, 2001), and SVM (Cortes and Vapnik, 1995) to select important features. The criteria for selecting important features under each technique are provided in Data Sheet 1. Since 484 features are observed with non-zero coefficients under LASSO, same number of features are also selected under other techniques. Among 484 selected features, it is observed that most of the features selected under IG and FM are among those selected through other three selection techniques (Figure 2A). On the contrary, large number of features selected under SVM and LASSO are not among the features selected through other three techniques. Based on the selected features under each technique, performance of SVM was also assessed using the sample dataset of 1,000 HSPs and 1,000 non-HSPs. Except specificity and precision, higher values of performance metrics are observed under 484 RF-based selected features (Figure 2B). Thus, the 484 RF-based selected features are considered in subsequent analysis.
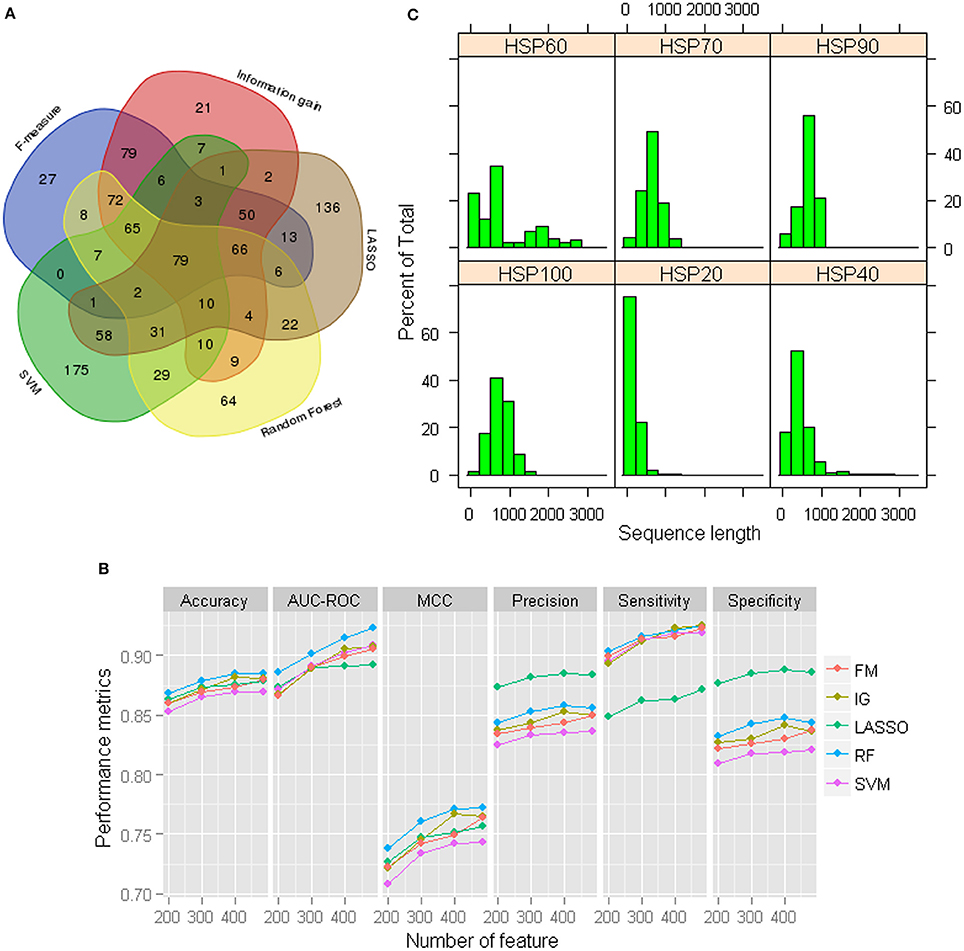
Figure 2. (A) Venn diagram of the selected 484 features under each feature selection technique. It can be seen that a large number of features selected under LASSO and SVM are not common to the features selected under other techniques. On the other hand, most of the features selected through F-measure and Information gain are among those selected under other three techniques. (B) Performance metrics for SVM with RBF kernel with 484 selected GPC-0123 features under each feature selection technique. It can be observed that values of performance metrics are higher for RF-based selected 484 GPC-0123 features. (C) Distribution of length of sequences for each family of HSPs.
Cross Validation Analysis
Using 484 RF-based selected features, prediction was made for 2,180 HSPs and 2,180 non-HSPs that were randomly drawn from 2,181 HSPs and 9,965 non-HSPs, respectively. Moreover, to assess the consistency of the proposed approach, prediction was made over 100 such samples (where each sample consists of 2,180 HSPs and 2,180 non-HSPs) that were randomly drawn from the available HSP and non-HSP sequences. Using the same datasets, performance of PredHSP (DPC as features and SVM as classifier) was also evaluated. Performance metrics averaged over five-folds as well as 100 sample sets are given in Table 3. From the table, it is observed that the specificities are higher than the sensitivities. The proposed approach achieved ~84% overall accuracy, which is 2% higher than that of PredHSP (~82%). In terms of all the performance metrics, proposed approach is also observed to achieve higher accuracy than that of PredHSP. Except MCC, values of other performance metrics for the proposed approach are observed >80%. On the other hand, except specificity and precision, values of other performance metrics are <80% for PredHSP. Besides, the performance metrics of the proposed approach are also seen to be more stable (less standard error) as compared to that of PredHSP.
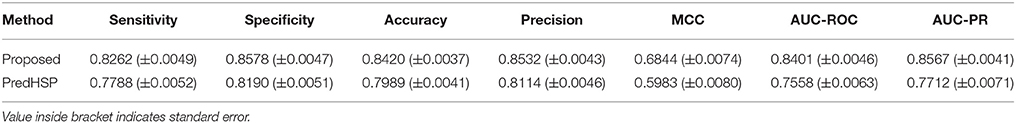
Table 3. Performance metrics for the proposed approach with respect to classification of HSP and non-HSP sequences.
Family-Wise Performance Analysis
Based on the 484 selected features, classifications were further made among different families of HSPs by following LOOCV technique. The values of different performance metrics are given in Table 4. Overall accuracies of >96% are observed for all the HSP families. It is also observed that the sensitivity, specificity and MCC are higher for HSP40 as compared to the other families of HSPs, and this may be due to the large number of sequences in HSP40 that lead to a well fitted prediction model. On the other hand, it is seen that the performance metrics (sensitivity, precision, MCC) are low for HSP60, and this may be due to the larger variability in the sequence length as compared to other families (Figure 2C) as well as the number of sequences in that family is 159 by which the model was not fitted well. Similarly, the sensitivity for HSP90 is also low (75%), and the possible reason for this may be that the number of sequences is less (52). Since the datasets were highly imbalanced, specificities are observed to be higher than the sensitivity. In terms of AUC-ROC and AUC-PR, accuracies are observed to be higher for HSP100 followed by HSP40 and HSP20. On the other hand, lowest values of AUC-ROC and AUC-PR are seen for HSP90 (Table 4).
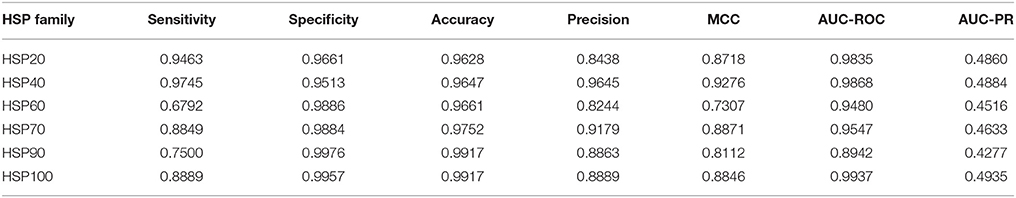
Table 4. Performance metrics for the proposed approach with regard to classification of different families of HSPs.
Comparative Analysis of Family-Wise Prediction
The performances of the developed approach, PredHSP and iHSP-PseRAAAC were compared in respect of classification of families of HSPs. Since family-wise accuracy is not available for Ahmad et al. (2015) approach, weighted average accuracies were also compared. Family-wise accuracies are shown in Figure 3A, and the weighted average accuracies are shown in Figure 3B. Higher values of sensitivities are observed for the proposed approach in case of HSP 20, HSP40, HSP90, and HSP100 whereas it is seen to be higher for PredHSP in other two families (Figure 3A). However, in terms of sensitivities, the developed approach outperformed iHSP-PseRAAAC for classification of all the HSP families (Figure 3A). Though, specificities for all the three approaches are observed at par (~97%) for HSP20, these are observed to be higher for the proposed approach in rest of the five families of HSPs. Except HSP40, MCC of the proposed computational method is also seen to be higher than that of both PredHSP and iHSP-PseRAAAC in rest of the families. Furthermore, average performance metrics of the proposed approach are not only seen to be higher than that of Ahmad et al. (2015) approach, but also over PredHSP and iHSP-PseRAAAC (Figure 3B). Since, datasets are highly imbalanced, values of AUC-PR are also computed. It is observed that except for HSP60, values of AUC-PR for the proposed approach are higher than that of PredHSP and iHSP-PseRAAAC in respect of classifying other families of HSPs (Table 5). Further, it is seen that except for HSP20, PredHSP outperformed iHSP-PseRAAAC in terms of AUC-PR measure (Table 5). Also, it is observed that the value of AUC-PR is lowest for prediction of HSP90 and highest for the prediction of HSP100.
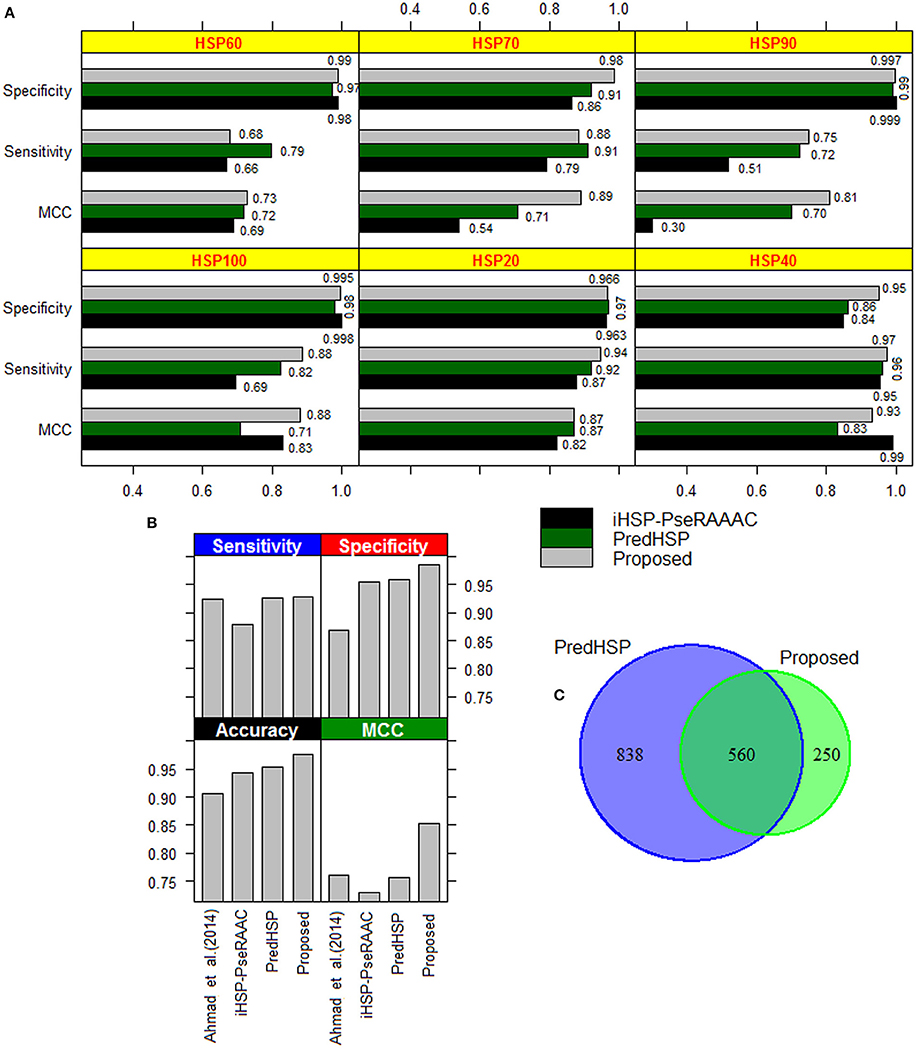
Figure 3. (A) Bar diagrams of performance metrics for the proposed approach, PredHSP and iHSP-PseRAAAC with respect to classification of different families of HSPs. With some exceptions (sensitivity in HSP60 and HSP70; MCC in HSP40), proposed approach is seen to achieve higher accuracy than that of other two approaches. (B) Bar diagrams of weighted accuracies for the above mentioned three approaches along with the Ahmad et al. (2015) approach. It can be seen that the weighted accuracies are higher for the proposed approach followed by PredHSP. (C) Venn diagram showing the number of HSPs predicted common (i.e., 560) to the proposed approach and PredHSP, for the negative dataset of 5,000 protein sequences.
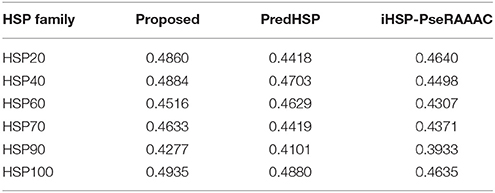
Table 5. Values of AUC-PR for classification of different families of HSP, by the proposed approach and two other existing approaches.
Performance Analysis Using Independent Dataset
By using 2,181 HSPs and 2,181 non-HSPs (randomly drawn from available non-HSPs) as training dataset, prediction was made for the independent dataset consisting of 96 human and 55 rice HSPs. In human, 85 are correctly predicted by both the approaches whereas in rice 54 and 53 HSPs are correctly predicted by the proposed approach and PredHSP, respectively (Table 6). Further, out of 96 human HSPs, 84 and 83 are correctly predicted into their corresponding families, whereas in rice 53 and 52 HSPs are correctly predicted into their corresponding families by the proposed approach and PredHSP, respectively (Table 6). Besides independent set of HSPs, performances were also evaluated with an independent negative dataset containing 5,000 non-HSP sequences (as mentioned in “material and method” section). It is observed that the number of false positives predicted by PredHSP (1,398) are higher than that of proposed approach (810), where 560 predicted HSPs by the proposed approach are among the 1,398 of PredHSP (Figure 3C). So, it can be said that the proposed approach and PredHSP may be equally efficient in detecting the true positives, but number of false positives will be lesser for the proposed approach as compared to PredHSP.
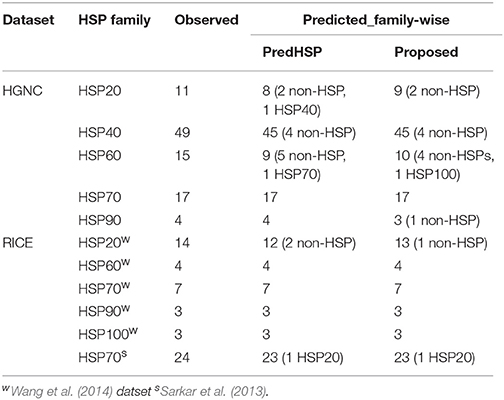
Table 6. Number of observed and correctly predicted HSPs by the proposed approach and PredHSP for the independent dataset of 96 human and 55 rice HSPs.
Performance Analysis Using Interpro Dataset
The same training dataset (2,181 HSPs and 2,181 non-HSPs) mentioned in the previous section was used for prediction of HSP sequences collected from InterPro. The sequences of the InterPro were also not present in the training dataset. Number of HSPs predicted into different families by the proposed approach (ir-HSP) and PredHSP are shown in Figure 4. It can be seen that the number of correctly predicted HSP20 (9,960), HSP40 (18,721), and HSP60 (17,313) by ir-HSP are higher than the correctly predicted HSP20 (6,976), HSP40 (18,347), and HSP60 (16,833) by PredHSP. On the contrary, number of correctly predicted HSP90 (12,408) by PredHSP are higher as compared to the number of HSP90 (11,453) correctly predicted by ir-HSP. Furthermore, it is observed that the total number of correctly identified HSPs by ir-HSP is higher than that of PredHSP. Specifically, out of 83,942 InterPro HSPs, number of correctly identified HSPs by ir-HSP and PredHSP are 74,383 and 72,622, respectively. Besides, almost all the HSP70 are seen to be correctly identified by both the methods.
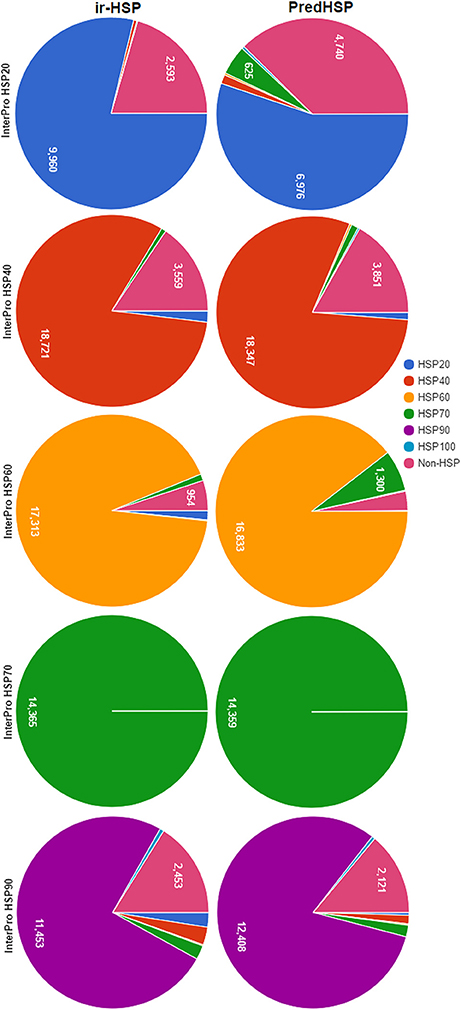
Figure 4. Pie charts showing the number of correctly predicted HSP by ir-HSP (proposed approach) and PredHSP, for different families of HSPs collected from InterPro database. In case of HSP20, HSP40, HSP60, number of correctly predicted HSPs by ir-HSP are higher than that of PredHSP, whereas in HSP90 PredHSP performed better than ir-HSP. Almost all the HSPs are correctly predicted by both the approaches for HSP70.
Prediction Analysis of DnaJ Proteins
Accuracies in predicting the DnaJ proteins by the proposed approach, JPred and JPPRED are given in Table 7. Both sensitivity and specificity of the developed approach are observed to be higher than that of JPred, for all the four types of J-Proteins. Though the sensitivities of JPPRED are seen to be higher, specificities are observed to be less than that of other two approaches. It is further observed that the sensitivity and specificity are more balanced in JPPRED as compared to the other two methods, and this may be due to the use of balanced dataset (number of observations in all the classes are almost same) in JPPRED that is obtained by employing synthetic minority over-sampling technique (SMOTE; Chawla et al., 2002). On the other hand, values of specificity for the proposed approach and JPred are observed to be higher than that of sensitivity due to imbalanced-ness (number of instances in Type-III is much higher than that of other classes). It is further observed that the overall accuracy (proportion of correctly predicted proteins for all the classes) of the proposed approach (94.7%) is at par with that of JPred (94.06%) but much higher than that of JPPRED (86.23%). Further, the proposed approach is observed to outperform JPred in terms of AUC-PR, as far as the classifications of four types of DnaJ proteins are concerned (Table 7). We have also tabulated all the methods along with their features that have been used for prediction of HSPs in earlier studies and the same is provided as Table S1 in Data Sheet 1.
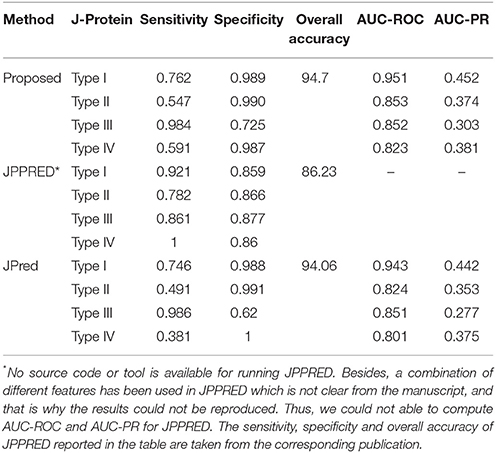
Table 7. Performance metrics for the proposed approach, JPPRED and JPred with regard to classification of four types of DnaJ proteins.
Analysis of Proteome-Wide Prediction of HSPs
The total number of HSPs predicted in each species, number of predicted HSPs annotated with InterPro and number of predicted HSPs annotated with HSP domains/families are shown in Figure 5A, and family-wise annotation of predicted HSPs are shown in Figure 5B. The proposed approach predicted 318 HSPs in M. thermautotrophicus, 362 in E. coli, 581 in M. tuberculosis, 795 in S. cerevisiae, 4,112 in A. thaliana, 6,648 in O. sativa, 3,420 in C. elegans, and 2,067 in D. melanogaster. It is seen that the percentage of HSPs are higher in both plant species (A. thaliana and O. sativa) than in other organisms. This could be due to the extra biotic and abiotic stress the plants tolerate due to their immobile nature (Al-Whaibi, 2011; Park and Seo, 2015). Further, highest number of HSPs are predicted with HSP40 followed by HSP70 and HSP20 whereas lowest number of HSPs are predicted with HSP90 (Figure 5B). In particular, >50% HSPs are predicted with HSP40 and <1% are predicted with HSP90. Out of total HSPs annotated with InterPro, ~50% of them are found to be annotated with HSP families/domains in each species (Figure 5A).
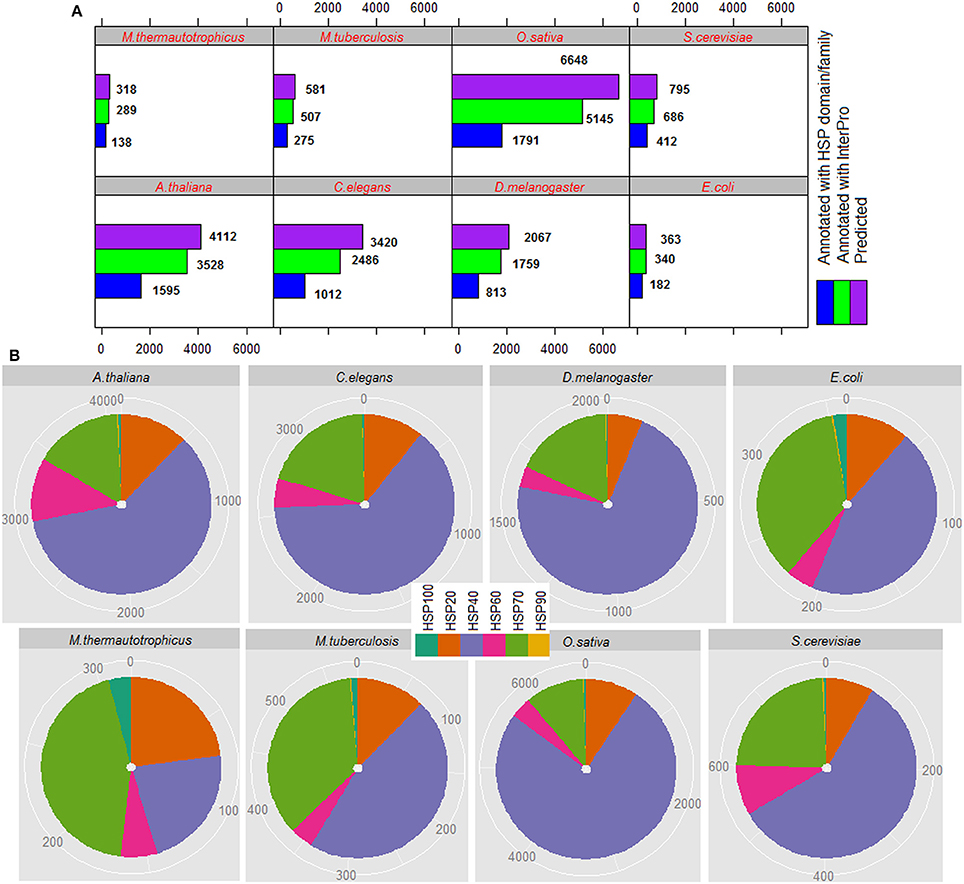
Figure 5. (A) Proteome-wide prediction of HSPs for eight different species, by using the proposed approach. It can be seen that ~50% of the predicted HSPs are annotated with InterPro HSP family/domain. (B) Family-wise distribution of predicted HSPs, where it is seen that >50% HSPs are predicted with HSP40 and <1% with HSP90.
Performance Analysis Using Blast Algorithms
To assess the performance using homology-based method, the most widely used Basic Local Alignment Search Tool (BLAST; Altschul et al., 1990) of NCBI was opted. Two different versions of protein blast i.e., Blastp and Delta-Blast with three different e-values i.e., 0.1, 0.01, and 0.001 were used for this purpose. Moreover, the classification of HSPs and non-HSP was made using 2,181 HSPs and 2,181 non-HSPs (as mentioned in section Performance Analysis using Independent Dataset) and performance was assessed through five-fold cross validation technique. For cross validation, the offline version of Blast software was installed in a local server, where Blastp and Delta-Blast algorithms were executed. In each fold of the cross validation, the training dataset was used as the database and the corresponding test set was used as query. Each query sequence was predicted as the HSP or non-HSP category based on the top hit found in the blast search. From the analysis it is seen that though the number of false positives are much less, no hits are found for many of the true positives. In particular, no hits are found for ~23, ~25, and ~26% of true HSPs with e-values i.e., 0.1, 0.01, and 0.001, respectively, in both Blastp and Delta-Blast. Thus, by using homology-based method there is a probability of losing information on true positives.
Online Prediction Server: ir-HSP
A web server named as “ir-HSP” has been established and hosted at http://cabgrid.res.in:8080/ir-hsp to facilitate the prediction of HSPs up to the level of families and sub-types.
For user guidance with regard to input-output, execution and interpretation of results, a help page has been provided in the main menu. The SVM architecture for predicting HSPs, their families and subtypes of DnaJ proteins by ir-HSP is explained through a flow diagram (Figure 6). The results are displayed in a tabular format with four columns. The first to fourth columns, respectively, represent the serial number, sequence identifier, types of predicted HSP (with sub-type of DnaJ, if predicted as HSP40) or non-HSP, and probabilities with which they are predicted in the respective classes. For reproducible research, links to download the datasets used to train the prediction server and other datasets used in this study are also provided at http://cabgrid.res.in:8080/ir-hsp/dataset.html.
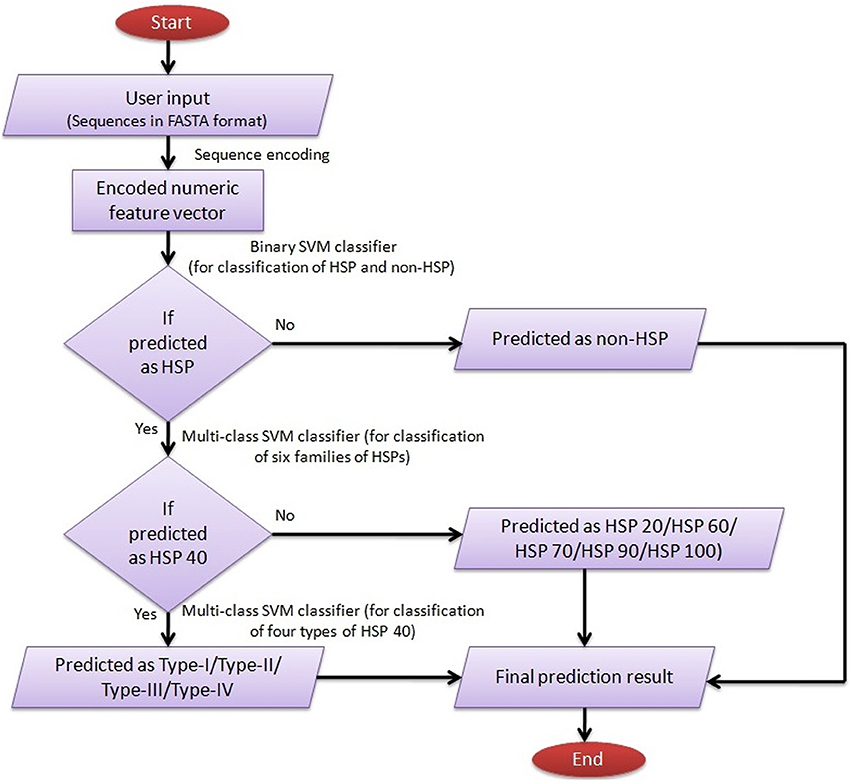
Figure 6. Flow diagram showing the step-wise working procedure of the developed prediction server ir-HSP.
Discussion
The discovery of heat shock response by Ritossa (1962) in the salivary gland of drosophila larvae and subsequent recognition of HSPs have laid down the foundation for expanding research on HSPs (Tissieres et al., 1974; Morana et al., 1978). As molecular chaperones, HSPs are vital bio-molecules that play pivotal role in maintaining the structure of the cytoplasm in eukaryotes and safeguarding life against proteotoxic stress (Pratt and Toft, 1997; Csermely et al., 1998). Further, the broad range of functions of HSPs makes them an attractive target for pharmacological interventions. It is also believed that the diversity present in different families of HSP makes the plants to tolerate different biotic and abiotic stresses. Specifically, till date, 52 plant species including maize, soybean, cotton, potato have been genetically modified for heat stress tolerance (Al-Whaibi, 2011). Due to diversified nature of HSPs and wide range of functions, development of an automated method for timely and reliably predicting HSPs and their families is indispensable in the area of proteomics research (Feng et al., 2013). Keeping this in view, this study presents an automated system for identification of HSPs, their families and sub-types of DnaJ proteins in a single frame work as well as with higher accuracy.
In the proposed approach, the GPC features were used as input for prediction by employing SVM predictor. The accuracy under GPC feature set was found higher than that of DPC feature set used in PredHSP, which resembles with the finding of Brinda et al. (2015). Though it is true that the number of features in GPC-0123 feature set were higher than that of other feature sets, this may not be the only reason for getting higher accuracy because the number of features in ACF-2 were also higher than that of CTD but the accuracies were still lower than that of CTD feature set. Instead of using imbalanced dataset, performance of the proposed approach was assessed using balanced dataset to avoid biasness toward the major class (Chou, 2013; Chen et al., 2015). Moreover to assess the consistency with different non-HSP sequences, performance of the proposed approach was assessed over 100 sample sets, which seems to be more logical as compared to that of using one sample set in PredHSP (Kumar et al., 2016).
The DPC of standard amino acids was first used by Ahmad et al. (2015) for classification of six different families of HSPs, which was later adopted in PredHSP. This may be the possible reason that the overall sensitivity, specificity, accuracy and MCC were found to be approximately same for PredHSP and Ahmad et al. (2015) approach (Figure 3B). Though DPC feature set was initially used in iHSP-PseRAAAC, it was based on the reduced amino acid alphabet (Etchebest et al., 2007). However, GPC features were first time used in this study, and the accuracies under this feature set were found higher than that of PredHSP, iHSP-PseRAAAC, and Ahmad et al. (2015) approach with respect to classification of six different families of HSPs (Figure 3B). On the other hand, accuracy was found to be lowest for iHSP-PseRAAAC and this may be due to the use of reduced amino acid alphabet by which the variability present in the dataset was not captured well by the prediction model. In respect of predicting four types of DnaJ proteins, the proposed approach achieved high accuracy than that of JPred. Though the JPPRED achieved higher accuracy in terms of sensitivity, the developed approach outperformed JPPRED in terms of overall accuracy. Moreover, no computational tool is available for JPPRED to predict DnaJ proteins, which further limits its application with real-world protein sequence data. However, number of features used in JPPRED (224) is almost half of those used in the proposed approach (484) and JPpred (512). Nevertheless, it can be said that the proposed approach will supplement the existing approaches in predicting the four types of DnaJ proteins.
With the independent datasets of 96 human HSPs and 55 rice HSPs, almost same number of HSPs were correctly predicted into their corresponding families by both the proposed approach and PredHSP. However, the number of false positives were found higher for PredHSP as compared to the proposed approach. Furthermore, based on the InterPro dataset of HSP families/domain, the proposed approach was found to achieve higher accuracies for HSP20, HSP40, and HSP60 than that of PredHSP. On the other hand, PredHSP performed better than the proposed approach for HSP90. In case of HSP70, almost all the sequences were correctly predicted by both the methods and this may be due to the fact that Hsp70 proteins are highly conserved. In particular, HSP70 contains a conserved peptide binding domain, an ATPase domain, a region at the middle having protease sensitive sites and a C-terminal region enriched with G/P amino acids that enable the proteins to bind with co-chaperones and other HSPs (Hartl, 1996; Tavaria et al., 1996; Bukau et al., 2006; Daugaard et al., 2007).
The performance of the proposed approach was further assessed at proteome level by using 8 different proteome datasets. Though, most of the predicted HSP sequences were annotated with InterPro domain, ~50% of them were found to be annotated with HSP domains/families in each species. Further, most of them were found to be annotated with HSP40 followed by HSP20. In particular, number of predicted HSP40s were found to be higher for eukaryotes that resembles with earlier study (Wacker and Muchowski, 2006). Since ~50% of predicted HSPs were found to be annotated with HSP domains/families, the developed computational method is expected to supplement the existing approaches for sequence annotation at proteome level. The developed prediction server ir-HSP will be of great help for the experimental scientists to get the required results without going into mathematical details.
Author Contributions
PM and AR: conception and design of the work; PM, TS, and SG: acquisition, analysis, and interpretation of data; PM, SG, TS, and AR: drafting the manuscript; PM, AR, TS, and SG: revising the manuscript; All authors read and approved the final version of the manuscript.
Funding
This study was supported by the grant (Agril.Edn.4-1/2013-A&P dated 11.11.2014) received from Indian Council of Agriculture Research (ICAR) for Centre for Agricultural Bioinformatics (CABin) scheme of Indian Agricultural Statistics Research Institute (IASRI). The funding body played no role in design or conclusion of this study.
Conflict of Interest Statement
The authors declare that the research was conducted in the absence of any commercial or financial relationships that could be construed as a potential conflict of interest.
Acknowledgments
The authors acknowledge Mr. Subhrajit Satpathy and Mr. Nalinikanta Chowdhury for their support in processing the data and result files.
Supplementary Material
The Supplementary Material for this article can be found online at: https://www.frontiersin.org/articles/10.3389/fgene.2017.00235/full#supplementary-material
Data Sheet 1. A brief description about different feature selection techniques used in this study for selection of important features.
References
Adachi, H., Katsuno, M., Waza, M., Minamiyama, M., Tanaka, F., and Sobue, G. (2009). Heat shock proteins in neurodegenerative diseases: pathogenic roles and therapeutic implications. Int. J. Hyperthermia 25, 647–654. doi: 10.3109/02656730903315823
Ahmad, S., Kabir, M., and Hayat, M. (2015). Identification of heat shock protein families and J-protein types by incorporating dipeptide composition into Chou's general PseAAC. Comput. Methods Programs Biomed. 122, 165–174. doi: 10.1016/j.cmpb.2015.07.005
Alhaj, T. A., Siraj, M. M., Zainal, A., Elshoush, H. T., and Elhaj, F. (2016). Feature selection using information gain for improved structural-based alert correlation. PLoS ONE 11:e0166017. doi: 10.1371/journal.pone.0166017
Altschul, S. F., Gish, W., Miller, W., Myers, E. W., and Lipman, D. J. (1990). Basic local alignment search tool. J. Mol. Biol. 215, 403–410. doi: 10.1016/S0022-2836(05)80360-2
Al-Whaibi, M. H. (2011). Plant heat-shock proteins: a mini review. J. King Saud Univ. Sci. 23, 139–150. doi: 10.1016/j.jksus.2010.06.022
Arawaka, S., Machiya, Y., and Kato, T. (2010). Heat shock proteins as suppressors of accumulation of toxic prefibrillar intermediates and misfolded proteins in neurodegenerative diseases. Curr. Pharm. Biotechnol. 11, 158–166. doi: 10.2174/138920110790909713
Baten, A., Chang, B. C., Halgamuge, S. K., and Li, J. (2006). Splice site identification using probabilistic parameters and SVM classification. BMC Bioinformatics 7:S15. doi: 10.1186/1471-2105-7-S5-S15
Bhasin, M., and Raghava, G. P. (2004). ESLpred: SVM-based method for subcellular localization of eukaryotic proteins using dipeptide composition and PSI-BLAST. Nucleic Acids Res. 32, W414–W419. doi: 10.1093/nar/gkh350
Blaszczak, A., Georgopoulos, C., and Liberek, K. (1999). On the mechanism of FtsH-dependent degradation of the sigma 32 transcriptional regulator of Escherichia coli and the role of the Dnak chaperone machine. Mol. Microbiol. 31, 157–166. doi: 10.1046/j.1365-2958.1999.01155.x
Brinda, K., Sykulski, M., and Kucherov, G. (2015). Spaced seeds improve k-mer-based metagenomic classification. Bioinformatics 31, 3584–3592. doi: 10.1093/bioinformatics/btv419
Bukau, B., Weissman, J., and Horwich, A. (2006). Molecular chaperones and protein quality control. Cell 125, 443–451. doi: 10.1016/j.cell.2006.04.014
Cai, C. Z., Han, L. Y., Ji, Z. L., Chen, X., and Chen, Y. Z. (2003). SVM-Prot: web-based support vector machine software for functional classification of a protein from its primary sequence. Nucleic Acids Res. 31, 3692–3697. doi: 10.1093/nar/gkg600
Chatterjee, S., and Burns, T. F. (2017). Targeting heat shock proteins in cancer: a promising therapeutic approach. Int. J. Mol. Sci. 18:E1978. doi: 10.3390/ijms18091978
Chawla, N. V., Bowyer, K. W., Hall, L. O., and Kegelmeyer, W. P. (2002). SMOTE: synthetic minority over-sampling technique. J. Artif. Intell. Res. 16, 321–357. doi: 10.1613/jair.953
Chen, W., Ding, H., and Feng, P. (2016). iACP: a sequence-based tool for identifying anticancer peptides. Oncotarget 7, 16895–16909. doi: 10.18632/oncotarget.7815
Chen, W., Feng, P., Ding, H., Lin, H., and Chou, K. C. (2015). iRNA-Methyl: identifying N(6)-methyl adenosine sites using pseudo nucleotide composition. Anal. Biochem. 490, 26–33. doi: 10.1016/j.ab.2015.08.021
Chen, W., Feng, P. M., and Lin, H. (2013). iRSpot-PseDNC: identify recombination spots with pseudo dinucleotide composition. Nucleic Acids Res. 41:e68. doi: 10.1093/nar/gks1450
Chen, W., and Lin, H. (2010). Prediction of midbody, centrosome, and kinetochore proteins based on gene ontology information. Biochem. Biophys. Res. Commun. 401, 382–384. doi: 10.1016/j.bbrc.2010.09.061
Chou, K. C. (2001). Prediction of protein cellular attributes using pseudo-amino-acid-composition. Proteins Struct. Funct. Genet. 43, 246–255. doi: 10.1002/prot.1035
Chou, K. C. (2005). Using amphiphilic pseudo amino acid composition to predict enzyme subfamily classes. Bioinformatics 21, 10–19. doi: 10.1093/bioinformatics/bth466
Chou, K. C. (2009). Pseudo amino acid composition and its applications in bioinformatics, proteomics and system biology. Curr. Proteomics 6, 262–274. doi: 10.2174/157016409789973707
Chou, K. C. (2013). Some remarks on predicting multi-label attributes in molecular biosystems. Mol. Biosyst. 9, 1092–1100. doi: 10.1039/c3mb25555g
Chou, K. C., and Cai, Y. D. (2002). Using functional domain composition and support vector machines for prediction of protein subcellular location. J. Biol. Chem. 277, 45765–45769. doi: 10.1074/jbc.M204161200
Cortes, C., and Vapnik, V. (1995). Support-vector networks. Mach. Learn. 20, 273–297. doi: 10.1007/BF00994018
Csermely, P., Schnaider, T., Söti, C., Prohászka, Z., and Nardai, G. (1998). The 90-kDa molecular chaperone family: structure, function and clinical applications. A comprehensive review. Pharmacol. Therap. 79, 129–168. doi: 10.1016/S0163-7258(98)00013-8
Csermely, P., and Yahara, I. (2005). “Heat shock proteins,” in Molecular Patho-Mechanisms and New Trends in Drug Research, eds G. Keri and I. Toth (New York, NY: Taylor and Francis Inc.), 67–75.
Daugaard, M., Rohde, M., and Jäättelä, M. (2007). The heat shock protein 70 family: highly homologous proteins with overlapping and distinct functions. FEBS Lett. 581, 3702–3710. doi: 10.1016/j.febslet.2007.05.039
Davis, J., and Goadrich, M. (2013). “The relationship between Precision-Recall and ROC curves, ML '06,” in Proceedings of the 23rd International Conference On Machine Learning (New York, NY), 233–240.
Dimitriadou, E., Hornik, K., Leisch, F., and Meyer, D. (2012). A. Weingessel, e1071: Misc Functions of the Department of Statistics (e1071), R package version 1.6–1. Vienna: TU Wien.
Ding, Y., Cai, Y., Zhang, G., and Xu, W. (2004). The influence of dipeptide composition on protein thermostability. FEBS Lett. 569, 284–288. doi: 10.1016/j.febslet.2004.06.009
Dubchak, I., Muchnik, I., Holbrook, S. R., and Kim, S. H. (1995). Prediction of protein folding class using global description of amino acid sequence. Proc. Natl. Acad. Sci. U.S.A. 92, 8700–8704. doi: 10.1073/pnas.92.19.8700
Etchebest, C., Benros, C., Bornot, A., Camproux, A. C., and de Brevern, A. G. (2007). A reduced amino acid alphabet for understanding and designing protein adaptation to mutation. Eur. Biophys. J. 36, 1059–1069. doi: 10.1007/s00249-007-0188-5
Fawcett, T. (2006). An introduction to ROC analysis. Pattern Recog. Lett. 27, 861–874. doi: 10.1016/j.patrec.2005.10.010
Feng, P., Lin, H., Chen, W., and Zuo, Y. (2014). Predicting the types of J-proteins using clustered amino acids. Biomed Res. Int. 2014:935719. doi: 10.1155/2014/935719
Feng, P. M., Chen, W., Lin, H., and Chou, K. C. (2013). iHSP-PseRAAAC: identifying the heat shock protein families using pseudo reduced amino acid alphabet composition. Anal. Biochem. 442, 118–125. doi: 10.1016/j.ab.2013.05.024
Geras, K. J., and Sutton, C. (2013). “Multiple-source cross-validation,” in Proceedings of the 30th International Conference on Machine Learning (Atlanta, GA), JMLR: W & CP 28.
Goldstein, M. G., and Li, Z. (2009). Heat-shock proteins in infection-mediated inflammation-induced tumorigenesis. J. Hematol. Oncol. 2:5. doi: 10.1186/1756-8722-2-5
Golub, T. R., Slomin, D. K., Tamayo, P., Huard, C., Gaasenbeek, M., Mesirov, J. P., et al. (1999). Molecular classification of cancer: class discovery and class prediction by gene expression monitoring. Science 286, 531–537. doi: 10.1126/science.286.5439.531
Govindan, G., and Nair, A. S. (2011). “New feature vector for apoptosis protein subcellular localization prediction,” in ACC: International Conference on Advances in Computing and Communications (Kochi), 294–301.
Guo, S. H., Deng, E. Z., and Xu, L. Q. (2014). iNuc-PseKNC: a sequence-based predictor for predicting nucleosome positioning in genomes with pseudo k-tuple nucleotide composition. Bioinformatics 30, 1522–1529. doi: 10.1093/bioinformatics/btu083
Hamos, J. E., Oblas, B., Pulaski-Salo, D., Welch, W. J., Bole, D. G., and Drachman, D. A. (1991). Expression of heat shock proteins in Alzheimer's disease. Neurology 41, 345–350. doi: 10.1212/WNL.41.3.345
Hartl, F. U. (1996). Molecular chaperones in cellular protein folding. Nature 381, 571–579. doi: 10.1038/381571a0
Hu, X., Van Marion, D. M. S., Wiersma, M., Zhang, D., and Brundel, B. J. J. M. (2017). The protective role of small heat shock proteins in cardiac diseases: key role in atrial fibrillation. Cell Stress Chaperones 22, 665–674. doi: 10.1007/s12192-017-0799-4
Hubbard, T. J., and Sander, C. (1991). The role of heat-shock and chaperone proteins in protein folding: possible molecular mechanisms. Protein Eng. 4, 711–717. doi: 10.1093/protein/4.7.711
Jia, J., Liu, Z., and Xiao, X. (2016a). iCar-PseCp: identify carbonylation sites in proteins by Monto Carlo sampling and incorporating sequence coupled effects into general PseAAC. Oncotarget 7, 34558–34570. doi: 10.18632/oncotarget.9148
Jia, J., Liu, Z., Xiao, X., Liu, B., and Chou, K. C. (2016b). iPPBS-Opt: a sequence-based ensemble classifier for identifying protein-protein binding sites by optimizing imbalanced training datasets. Molecules 21:E95. doi: 10.3390/molecules21010095
Jia, J., Liu, Z., and Xiao, X. (2016c). pSuc-Lys: predict lysine succinylation sites in proteins with PseAAC and ensemble random forest approach. J. Theor. Biol. 394, 223–230. doi: 10.1016/j.jtbi.2016.01.020
Jia, J., Zhang, L., and Liu, Z. (2016d). pSumo-CD: Predicting sumoylation sites in proteins with covariance discriminant algorithm by incorporating sequence-coupled effects into general PseAAC. Bioinformatics 32, 3133–3141. doi: 10.1093/bioinformatics/btw387
Kampinga, H. H., and Bergink, S. (2016). Heat shock proteins as potential targets for protective strategies in neurodegeneration. Lancet Neurol. 15, 748–759. doi: 10.1016/S1474-4422(16)00099-5
Kawashima, S., and Kanehisa, M. (2000). Amino acid index database. Nucleic Acids Res. 28:374. doi: 10.1093/nar/28.1.374
Kumar, R., Kumari, B., and Kumar, M. (2016). PredHSP: sequence based proteome-wide heat shock protein prediction and classification tool to unlock the stress biology. PLoS ONE 11:e0155872. doi: 10.1371/journal.pone.0155872
Lackie, R. E., Maciejewski, A., Ostapchenko, V. G., Marques-Lopes, J., Choy, W. Y., Duennwald, M. L., et al. (2017). The Hsp70/Hsp90 chaperone machinery in neurodegenerative diseases. Front. Neurosci. 11:254. doi: 10.3389/fnins.2017.00254
Lange, O. F., Rossi, P., Sgourakis, N. G., Song, Y., Lee, H. W., Aramini, J. M., et al. (2012). Determination of solution structures of proteins up to 40 kDa using CS-Rosetta with sparse NMR data from deuterated samples. Proc. Natl. Acad. Sci. U.S.A. 109, 10873–10878. doi: 10.1073/pnas.1203013109
Liu, B., Long, R., and Chou, K. C. (2016). iDHS-EL: identifying DNase I Hypersensitive Sites by fusing three different modes of pseudo nucleotide composition into an ensemble learning framework. Bioinformatics 32, 2411–2418. doi: 10.1093/bioinformatics/btw186
Lin, H., Deng, E. Z., and Ding, H. (2014). iPro54-PseKNC: a sequence-based predictor for identifying sigma-54 promoters in prokaryote with pseudo k-tuple nucleotide composition. Nucleic Acids Res. 42, 12961–12972. doi: 10.1093/nar/gku1019
Lin, H., and Ding, H. (2011). Predicting ion channels and their types by the dipeptide mode of pseudo amino acid composition. J. Theor. Biol. 269, 64–69. doi: 10.1016/j.jtbi.2010.10.019
Liu, B., Fang, L., and Long, R. (2016). iEnhancer-2L: a two-layer predictor for identifying enhancers and their strength by pseudo k-tuple nucleotide composition. Bioinformatics 32, 362–369. doi: 10.1093/bioinformatics/btv604
Liu, B., Yang, F., and Chou, K. C. (2017). 2L-piRNA: a two-layer ensemble classifier for identifying piwi-interacting RNAs and their function. Mol. Ther. Nucleic Acids 7, 267–277. doi: 10.1016/j.omtn.2017.04.008
Liu, B., Zhang, D., and Xu, R. (2014). Combining evolutionary information extracted from frequency profiles with sequence-based kernels for protein remote homology detection. Bioinformatics 30, 472–479. doi: 10.1093/bioinformatics/btt709
Liu, Z., Xiao, X., Qiu, W. R., and Chou, K. C. (2015). iDNA-methyl: identifying DNA methylation sites via pseudo trinucleotide composition. Anal. Biochem. 474, 69–77. doi: 10.1016/j.ab.2014.12.009
Liu, Z., Xiao, X., and Yu, D. J. (2016). pRNAm-PC: predicting N-methyl-adenosine sites in RNA sequences via physical-chemical properties. Anal. Biochem. 497, 60–67. doi: 10.1016/j.ab.2015.12.017
Louvion, J. F., Abbas-Terki, T., and Picard, D. (1998). Hsp90 is required for pheromone signalling in yeast. Mol. Biol. Cell 9, 3071–3083. doi: 10.1091/mbc.9.11.3071
Maiti, P., Manna, J., Veleri, S., and Frautschy, S. (2014). Molecular chaperone dysfunction in neurodegenerative diseases and effects of curcumin. Biomed Res. Int. 2014:495091. doi: 10.1155/2014/495091
Mallouk, Y., Vayssier-Taussat, M., Bonventre, J. V., and Polla, B. S. (1999). Heat shock protein 70 and ATP as partners in cell homeostasis. Int. J. Mol. Med. 4, 463–474. doi: 10.3892/ijmm.4.5.463
Meher, P. K., Sahu, T. K., Saini, V., and Rao, A. R. (2017). Predicting antimicrobial peptides with improved accuracy by incorporating the compositional, physico-chemical and structural features into Chou's general PseAAC. Sci. Rep. 7:42362. doi: 10.1038/srep42362
Morana, L., Mirault, M. E., Arrigo, A. P., Goldschmidt-Clermont, M., and Tissieres, A. (1978). Heat shock of Drosophila melanogaster induces the synthesis of new messenger RNAs and proteins, Philos. Trans. R. Soc. Lond. B. Biol. Sci. 283, 391–406. doi: 10.1098/rstb.1978.0044
Nasedkin, A., Marcellini, M., Religa, T. L., Freund, S. M., Menzel, A., Fersht, A. R., et al. (2015). Deconvoluting protein (un) folding structural ensembles using X-ray scattering, nuclear magnetic resonance spectroscopy and molecular dynamics simulation. PLoS ONE 10:e0125662. doi: 10.1371/journal.pone.0125662
Park, C. J., and Seo, Y. S. (2015). Heat shock proteins: a review of the molecular chaperones for plant immunity. Plant Pathol. J. 31, 323–333. doi: 10.5423/PPJ.RW.08.2015.0150
Paul, S., and Mahanta, S. (2014). Association of heat-shock proteins in various neurodegenerative disorders: is it a master key to open the therapeutic door? Mol. Cell. Biochem. 386, 45–61. doi: 10.1007/s11010-013-1844-y
Pockley, A. G. (2002). Heat shock proteins, inflammation, and cardiovascular disease. Circulation 105, 1012–1017. doi: 10.1161/hc0802.103729
Poulain, P., Gelly, J. C., and Flatters, D. (2010). Detection and architecture of small heat shock protein monomers. PLoS ONE 5:e9990. doi: 10.1371/journal.pone.0009990
Pratt, W. B., and Toft, D. O. (1997). Steroid receptor interactions with heat shock protein and immunophilin complexes. Endocrine Rev. 18, 306–360.
Qiu, W. R., Sun, B. Q., and Xiao, X. (2016). iPTM-mLys: identifying multiple lysine PTM sites and their different types. Bioinformatics 32, 3116–3123. doi: 10.1093/bioinformatics/btw380
Ratheesh, R. K., Nagarajan, S. N., Arunraj, S. P., Sinha, D., Veedin Rajan, V. B., Esthaki, V. K., et al. (2012). HSPIR: a manually annotated heat shock protein information resource. Bioinformatics 28, 2853–2855. doi: 10.1093/bioinformatics/bts520
R Development Core Team (2012). R: A Language and Environment for Statistical Computing. Vienna: R Foundation for Statistical Computing. Available online at: http://www.R-project.org/
Redfield, C. (2004). Using nuclear magnetic resonance spectroscopy to study molten globule states of proteins. Methods 34, 121–132. doi: 10.1016/j.ymeth.2004.03.009
Ritossa, P. (1962). Problems of prophylactic vaccinations of infants. Riv. Ist. Sieroter. Ital. 37, 79–108.
Ruggero, D., Ciammaruconi, A., and Londei, P. (1998). The chaperonin of the archaeon Sulfolobus solfataricus is an RNA-binding protein that participates in ribosomal RNA processing. EMBO J. 17, 3471–3477. doi: 10.1093/emboj/17.12.3471
Saini, J., and Sharma, P. K. (2017). Clinical, prognostic and therapeutic significance of heat shock proteins in cancer. Curr. Drug Targets. doi: 10.2174/1389450118666170823121248. [Epub ahead of print].
Sajjad, M. U., Samson, B., and Wyttenbach, A. (2010). Heat shock proteins: therapeutic drug targets for chronic neurodegeneration? Curr. Pharm. Biotechnol. 11, 198–215. doi: 10.2174/138920110790909641
Sarkar, N. K., Kundnani, P., and Grover, A. (2013). Functional analysis of Hsp70 superfamily proteins of rice (Oryza sativa). Cell Stress Chaperon 18, 427–437. doi: 10.1007/s12192-012-0395-6
Tavaria, M., Gabriele, T., Kola, I., and Anderson, R. L. (1996). A hitchhicker's guide to human Hsp70 family. Cell Stress Chaperon 1, 23–28. doi: 10.1379/1466-1268(1996)001<0023:AHSGTT>2.3.CO;2
Tibshirani, R. (1996). Regression shrinkage and selection via the Lasso. J. R. Stat. Soc. Ser. B. 58, 267–288.
Tissieres, A., Mitchell, H. K., and Tracy, U. M. (1974). Protein synthesis in salivary glands of Drosophila melanogaster: relation to chromosome puffs. J. Mol. Biol. 85, 389–398. doi: 10.1016/0022-2836(74)90447-1
Tytell, M., and Hooper, P. L. (2001). Heat shock proteins: new keys to the development of cytoprotective therapies. Expert Opin. Ther. Targets 5, 267–287. doi: 10.1517/14728222.5.2.267
Wacker, J. L., and Muchowski, P. J. (2006). “Protein Reviews,” in Chaperone Suppression of Aggregated Protein Toxicity, eds V. N. Uversky and A. L. Fink (Singapore: Springer Inc.), 137–164.
Wang, Y. C., Wang, X. B., Yang, Z. X., and Deng, N. Y. (2010). Prediction of enzyme subfamily class via pseudo amino acid composition by incorporating the conjoint triad feature. Protein Pept. Lett. 17, 1441–1449. doi: 10.2174/0929866511009011441
Wang, Y., Lin, S., Song, Q., Li, K., Tao, H., and Huang, J. (2014). Genome-wide identification of heat shock proteins (Hsps) and Hsp interactors in rice: Hsp70s as a case study. BMC Genomics 15:344. doi: 10.1186/1471-2164-15-344
Wu, J., Liu, T., Rios, Z., Mei, Q., Lin, X., and Cao, S. (2017). Heat shock proteins and cancer. Trends Pharmacol. Sci. 38, 226–256. doi: 10.1016/j.tips.2016.11.009
Wu, Y. R., Wang, C. K., Chen, C. M., Hsu, Y., Lin, S. J., Lin, Y. Y., et al. (2004). Analysis of heat-shock protein 70 gene polymorphisms and the risk of Parkinson's disease. Hum. Genet. 114, 236–241. doi: 10.1007/s00439-003-1050-1
Xiao, X., Min, J. L., Lin, W. Z., Liu, Z., Cheng, X., and Chou, K. C. (2015). iDrug-Target: predicting the interactions between drug compounds and target proteins in cellular networking via benchmark dataset optimization approach. J. Biomol. Struct. Dyn. 33, 2221–2233. doi: 10.1080/07391102.2014.998710
Xiao, X., Wang, P., and Chou, K. C. (2012). INR-PhysChem: a sequence-based predictor for identifying nuclear receptors and their subfamilies via physical–chemical property matrix. PLoS ONE 7:e30869. doi: 10.1371/journal.pone.0030869
Zeng, X. C., Bhasin, S., Wu, X., Lee, J. G., Maffi, S., Nichols, C. J., et al. (2004). Hsp70 dynamics in vivo: effect of heat shock and protein aggregation. J. Cell Sci. 117, 4991–5000. doi: 10.1242/jcs.01373
Keywords: molecular chaperones, heat shock, protein folding, machine learning, di-peptide composition, DnaJ proteins
Citation: Meher PK, Sahu TK, Gahoi S and Rao AR (2018) ir-HSP: Improved Recognition of Heat Shock Proteins, Their Families and Sub-types Based On g-Spaced Di-peptide Features and Support Vector Machine. Front. Genet. 8:235. doi: 10.3389/fgene.2017.00235
Received: 05 July 2017; Accepted: 27 December 2017;
Published: 11 January 2018.
Edited by:
Gustavo Glusman, Institute for Systems Biology, United StatesReviewed by:
Cuncong Zhong, University of Kansas, United StatesRichard D. Emes, University of Nottingham, United Kingdom
Copyright © 2018 Meher, Sahu, Gahoi and Rao. This is an open-access article distributed under the terms of the Creative Commons Attribution License (CC BY). The use, distribution or reproduction in other forums is permitted, provided the original author(s) or licensor are credited and that the original publication in this journal is cited, in accordance with accepted academic practice. No use, distribution or reproduction is permitted which does not comply with these terms.
*Correspondence: Atmakuri R. Rao, rao.cshl.work@gmail.com
†These authors have contributed equally to this work.