Robust Bayesian Joint Inversion of Gravimetric and Muographic Data for the Density Imaging of the Puy de Dôme Volcano (France)
 Anne Barnoud1,2*
  Valérie Cayol2
  Peter G. Lelièvre3
  Angélie Portal2,4 Philippe Labazuy2 Pierre Boivin2 Lydie Gailler2
- 1LPC, Université Clermont Auvergne, CNRS/IN2P3, Clermont-Ferrand, France
- 2Laboratoire Magmas et Volcans, Université Clermont Auvergne, CNRS, IRD, OPGC, Clermont-Ferrand, France
- 3Department of Mathematics and Computer Science, Mount Allison University, Sackville, NB, Canada
- 4BRGM, DRP/IGT, Orléans, France
Imaging the internal structure of volcanoes helps highlighting magma pathways and monitoring potential structural weaknesses. We jointly invert gravimetric and muographic data to determine the most precise image of the 3D density structure of the Puy de Dôme volcano (Chaîne des Puys, France) ever obtained. With rock thickness of up to 1,600 m along the muon lines of sight, it is, to our knowledge, the largest volcano ever imaged by combining muography and gravimetry. The inversion of gravimetric data is an ill-posed problem with a non-unique solution and a sensitivity rapidly decreasing with depth. Muography has the potential to constrain the absolute density of the studied structures but the use of the method is limited by the possible number of acquisition view points, by the long acquisition duration and by the noise contained in the data. To take advantage of both types of data in a joint inversion scheme, we develop a robust method adapted to the specificities of both the gravimetric and muographic data. Our method is based on a Bayesian formalism. It includes a smoothing relying on two regularization parameters (an a priori density standard deviation and an isotropic correlation length) which are automatically determined using a leave one out criterion. This smoothing overcomes artifacts linked to the data acquisition geometry of each dataset. A possible constant density offset between both datasets is also determined by least-squares. The potential of the method is shown using the Puy de Dôme volcano as case study as high quality gravimetric and muographic data are both available. Our results show that the dome is dry and permeable. Thanks to the muographic data, we better delineate a trachytic dense core surrounded by a less dense talus.
1 Introduction
The density structure of volcanoes is classically inferred from the inversion of gravimetric data (Camacho et al., 1997; Cella et al., 2007; Linde et al., 2014). Gravimetry provides measurements of the gravity field throughout the study area, corresponding to the integrated effect of the whole Earth, but also sensitive to the local density variations. The inversion of gravimetric data is well-known to be non-unique and ill-posed, requiring a priori geological information or a combination with other geophysical data, such as seismic travel times (Onizawa et al., 2002; Coutant et al., 2012), to constrain the models. Muography is a recent imaging method which emerged from the field of particle physics (Alvarez et al., 1970; Nagamine et al., 1995). It provides images of integrated densities of an edifice using atmospheric muons generated by the interaction of cosmic rays with the atmosphere. The muons are charged elementary particles, like electrons but about 200 times heavier, that interact with matter in a stochastic way depending on their energies and on the density and composition of the medium (Groom et al., 2001; Nagamine, 2003). At high energy, traveling along straight paths, they can penetrate up to kilometers of rocks. Their trajectories are reconstructed thanks to multi-layer muon detectors. As muons come from the atmosphere, the muon detectors can only image structures higher in elevation. This makes muography particularly suitable to image lava domes like the Puy de Dôme (Chaîne des Puys, France). Application of muography to the imaging of volcanoes has been developed in the last two decades (Tanaka et al., 2001; Lesparre et al., 2012; Kusagaya and Tanaka, 2015; Oláh et al., 2018). The rate of muons crossing the target along a given direction depends, to the first order, on the rock density integrated along this line of sight. The 3D density reconstruction by muon tomography is limited by the number of view points and the acquisition duration. For example, imaging a 1,000 m thick and 1,800 kg/m3 dense structure with a precision of 5% on the density, an angular resolution of 3° by 3° and a 1 m2 detector requires an exposure of about 100 days of effective acquisition time (Cârloganu et al., 2016; Niess et al., 2016).
The combination of muography and gravimetry in a joint inversion scheme better constrains three-dimensional density models (Davis et al., 2011; Davis and Oldenburg, 2012; Okubo and Tanaka, 2012; Nishiyama et al., 2014b; Rosas-Carbajal et al., 2017; Cosburn et al., 2019). However, the joint inversion problem is still ill-posed and a regularization is needed, tuned by some parameters. These regularization parameters are determined either based on a checkerboard test (Nishiyama et al., 2014b), based on a classical L-curve (Rosas-Carbajal et al., 2017), or arbitrarily (Nishiyama et al., 2017a). However, so far inversions have shown artifacts related to the muography acquisition geometry and to the limited number of muon detectors. Based on synthetic data, Barnoud et al. (2019) designed a Bayesian inversion scheme where two regularization parameters, an a priori density standard deviation and a correlation length, can be determined in a robust way using a Cross-Validation Sum of Squares criterion, such as the Leave One Out (LOO). Using this approach, the resulting 3D density models are free of artifacts linked to the acquisition geometry, even with a limited number of muographic view points. Besides, comparing the inversions of synthetic data with one and three muographic view points, Barnoud et al. (2019) show that the resolution of the resulting density model is improved when using multiple points of view. Another difficulty in such a joint inversion is that the density estimated by muography is often lower than the density estimated by gravimetry due to the detection of 1) non-ballistic low-energy muons scattered by the volcanic edifice (Nishiyama et al., 2014a, 2016; Gómez et al., 2017; Rosas-Carbajal et al., 2017), 2) muons coming from the backward direction (Jourde et al., 2013) and 3) other charged particles (Oláh and Varga, 2017; Saracino et al., 2017). Tests on synthetic data (Barnoud et al., 2019) show that this offset leads to artifacts in the inversion results so that it should be corrected. To overcome this, the determination of a constant relative density offset can be taken into account in the inversion process (Rosas-Carbajal et al., 2017). Using synthetic data, Lelièvre et al. (2019) explore and compare various methods to automatically determine the offset and recommend a least-squares approach. In this paper, we combine the most robust and efficient techniques identified by Barnoud et al. (2019) and Lelièvre et al. (2019). We use a Bayesian formalism with a least-squares automatic computation of a potential constant density offset. The regularization parameters, namely the a priori density standard deviation and the isotropic correlation length, are determined using an LOO criterion.
We apply our method to gravimetric and muographic data acquired on the Puy de Dôme volcano to recover the 3D density structure of the edifice. The Puy de Dôme volcano is the highest volcano (1,465 m a.s.l.) of the Chaîne des Puys located in the French Massif Central (Figure 1, top left). The Chaîne des Puys is a complex field of about 80 monogenetic volcanic edifices aligned following a north-south direction. These volcanoes are built on a Variscan granitic basement whose top is situated around 800–1,000 m a.s.l. (Portal et al., 2016). The word “puy” refers to an isolated hill in the Auvergne area of the Massif Central. The Puy de Dôme is an 11,000-year-old monogenetic, composite trachytic dome (Boivin et al., 2017). The dome itself is about 400 m high and is about 1,800 m wide at its base (Figure 1). The Puy de Dôme volcano is a good natural laboratory to assess the methods for joint gravimetric and muographic inversions as high quality gravimetric and muographic datasets are available. Moreover, it is extinct and its structure does not change, ensuring a stable image during the six months of muography campaign required to get a sufficient resolution. With up to 1,600 m of rock thickness along the muon lines of sight, it is, to our knowledge, the largest lava dome presently imaged combining muography and gravimetry.
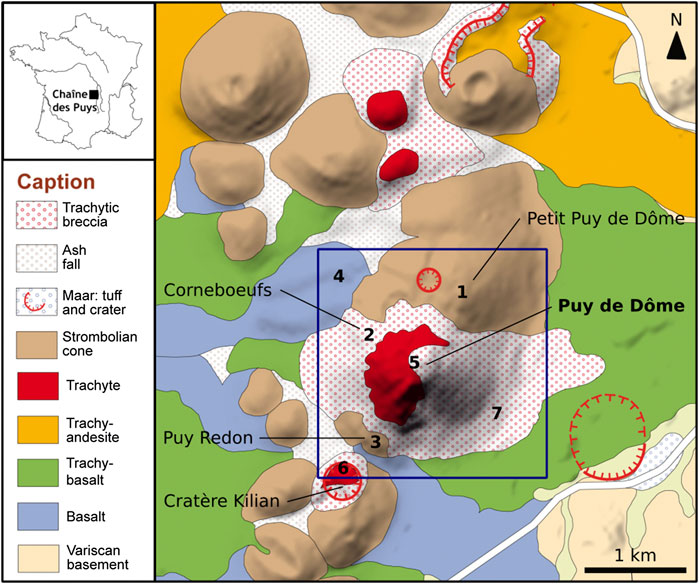
FIGURE 1. Simplified geological map of the Puy de Dôme and neighboring cones, adapted from Boivin et al. (2017). Top left: Location of the Chaîne des Puys in France. Blue square: Study area of the present paper (Figures 2, 7).
2 Joint Inversion Method
The medium is described with a three-dimensional mesh of equally spaced nodes of densities
where the matrix elements Gij contain the modeled contribution of each node j of unitary density to each observation location i. The sensitivity matrix G is computed taking into account the topography (Coutant et al., 2012; Barnoud et al., 2016). The muographic data consist of densities averaged in conic bins of azimuth and elevation in the angle of view of the muon detector. These averaged densities μ are estimated from the flux of muons crossing the edifice (Cârloganu and the TOMUVOL Collaboration, 2018; Niess et al., 2018b) and are linearly related to the subsurface densities ρ via the sensitivity matrix M:
We use the joint linear Bayesian inversion method of Barnoud et al. (2019). To determine a constant offset between densities inferred from gravimetric data and muographic data, we adapt and implement the automatic least-squares determination proposed by Lelièvre et al. (2019). We therefore consider the following linear joint inversion problem:
where e is a vector of ones with the same length as μobs and c is a constant accounting for the potential density offset between the two datasets.
Following Tarantola (Tarantola, 2005), we use a Bayesian formalism where the solution minimizes the objective function
The first term of the objective function (Eq. 4) is the gravimetric data misfit
where
where Cµ is the muographic data misfit. Depending on the processing applied to obtain the averaged densities, this matrix might be diagonal (uncorrelated data) or it might be sparse and banded with non-diagonal elements. The third term of the objective function is the regularization term which consists of a distance to an a priori model with a smoothing applied:
The a priori density covariance matrix
where
To obtain the density offset c, we seek the minimum of the objective function (Eq. 4) with respect to c. This is achieved by canceling its derivative with respect to c, leading to:
where we define the vector
In the particular case of a diagonal muographic data covariance matrix (uncorrelated data) with all the data variances being equal,
where Nµ is the number of muographic data.
We rewrite the muographic data term of the objective function (Eq. 6) by replacing the expression of the constant offset c (Eq. 9):
where we define the matrix
Hence, solving the linear joint inverse problem with a Bayesian formalism and a constant offset (Eq. 3) is equivalent to minimizing the objective function
where A is the modified sensitivity matrix
d is the modified data vector
and Cd is the data covariance matrix
According to Tarantola (2005), minimizing the objective function (Eq. 14) leads to the estimated density
which is the center of the a posteriori Gaussian density distribution with the associated a posteriori covariance matrix (Tarantola, 2005)
The diagonal elements of
The inversion result (Eqs 18 and 19) is tuned by two regularization parameters, namely the a priori density standard deviation
3 Application to the Puy De Dôme Volcano
3.1 Data
The gravimetric data were acquired and processed by Portal et al. (2016). We use the 650 measurements covering the dome itself (Figure 2). The data processing includes the Earth tide correction using the Longman formula (Longman, 1959) and the instrumental drift. The free-air anomaly is computed using the Somigliana formula (Somigliana, 1930) and the WGS84 reference ellipsoid (Moritz, 2000). The Bouguer correction for unitary densities is computed (Coutant et al., 2012; Barnoud et al., 2016). The contribution of masses outside the area of interest and up to 160 km is corrected using a density of 2,670 kg/m3 (far-field). Close to the target, we determine the correction density with the Parasnis method (Parasnis, 1972). Using the full gravimetric dataset of Portal et al. (2016), we correct for the masses outside the volume of interest and up to about 4.5 km from the summit with a density of 2,420 kg/m3 (mid-field). For masses inside the volume of interest, we estimate the optimal density of correction of 1,890 kg/m3 (near-field). Finally, we remove the mean value of −15.97 mGal from the gravity data to account for the regional field component. The residual Bouguer anomaly, used as input data for the inversions, is shown on Figure 2. The uncertainties (i.e., data standard deviations), on the Bouguer anomaly is estimated to 0.039 mGal (Portal et al., 2016), including uncertainties from gravimetric and positioning measurements as well as from gravity corrections.
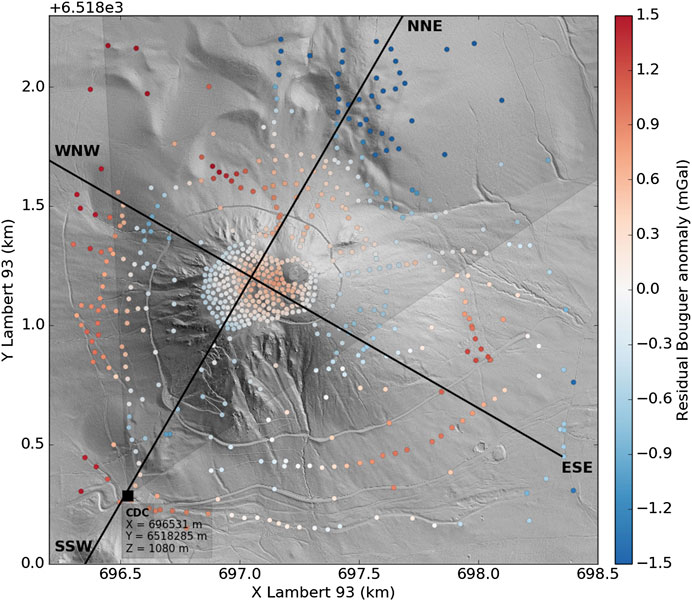
FIGURE 2. Residual Bouguer anomaly data of the Puy de Dôme volcano using correction densities of 2,670 kg/m3 (far-field), 2,420 kg/m3 (mid-field) and 1,890 kg/m3 (near-field). The gravimetric measurements are from Portal et al. (2016). The extent of this map is indicated by a blue square in Figure 1. The location of the muon detector installed at the Col de Ceyssat (CDC) is indicated (black square) as well as the angle of view of the detector (gray shaded area). The two black lines locate the slices of the inversion results shown in Figures 6, 7.
In this paper, we use as muographic data a preliminary result (Cârloganu and the TOMUVOL Collaboration, 2018; Niess et al., 2018a) from an acquisition campaign performed in 2015–2016, at a single view point. The map of average densities (Figure 3B) computed from the muon acquisition was provided by the TOMUVOL (TOmography avec des MUons atmosphériques de VOlcans) collaboration. The muon detector was installed at 1,080 m a.s.l. at the Col de Ceyssat (CDC), located at about 1,200 m from the summit of the Puy de Dôme edifice in the south-west direction (Figure 2). The TOMUVOL muon detector (Cârloganu et al., 2013; Ambrosino et al., 2015) is composed of four 1 m2 layers of Gas Resistive Plate Chambers (GRPCs), similar to the ones developed for the detection of hadrons in the framework of the CALICE experiment (The CALICE Collaboration, 2016). The spacing between the outer layers is about 1.8 m. A 10 cm wall of lead is placed in the middle to deviate the trajectories of low energy particles. The campaign lasted for six months, resulting in three months of effective acquisition time (99.6 effective days of data tracking). The high resolution of the TOMUVOL detector allows tracking muons crossing up to about 1,600 m of rocks (Figure 3A). We only consider the muon path above 6° above the horizontal so that only the Puy de Dôme relief is crossed by the muons. Below this elevation, muons also cross the Petit Puy de Dôme, situated to the north-east of the Puy de Dôme (Figure 1), which is outside the region of interest in this study. We recall here the key steps of the process (Niess et al., 2016; Cârloganu and The TOMUVOL Collaboration, 2018; Niess et al., 2018a; Niess et al., 2018b; Niess et al., 2020). The muon tracks are summed up in bins of 1° by 1° in azimuth and elevation. A kernel method is used to increase the muon count per bin, hence decrease the statistical uncertainty in the estimate of the transmitted flux of muons (Cârloganu et al., 2016; Cârloganu and The TOMUVOL Collaboration, 2018). The observed rate of muons is the convolution of the transmitted flux with the effective surface of the detector. For each bin, the density best fitting the observed muon rate is retained. The muographic data used for the inversion therefore consist of a map of densities averaged along the lines of sight (Figure 3B). The overall density of the Puy de Dôme, averaged and weighted by the rock thickness (Figures 3A,B), is 1,565 kg/m3, which is 325 kg/m3 lower than the averaged density estimated from the gravimetric data. This difference can partly be explained by the fact that the muographic data do not encompass the dense lava flows to the west and to the south-east of the dome (Figure 2). The statistical and systematic errors are estimated using a bootstrap procedure (Niess et al., 2018b; Niess et al., 2018a; Niess et al., 2020). The statistical errors correspond to the measurement standard deviations. The estimated standard deviations are below 100 kg/m3 in most of the dome, with larger values close to the surface and to the south-east (Figure 3C). The systematic errors are the biases (i.e., offsets) between the measured value and the true value. The estimated biases are about one order of magnitude lower than the standard deviations (Figure 3D), with values lower than 20 kg/m3 for most of the bins. The bias is therefore underestimated compared to the 325 kg/m3 offset of the averaged density with respect to the gravimetric data.
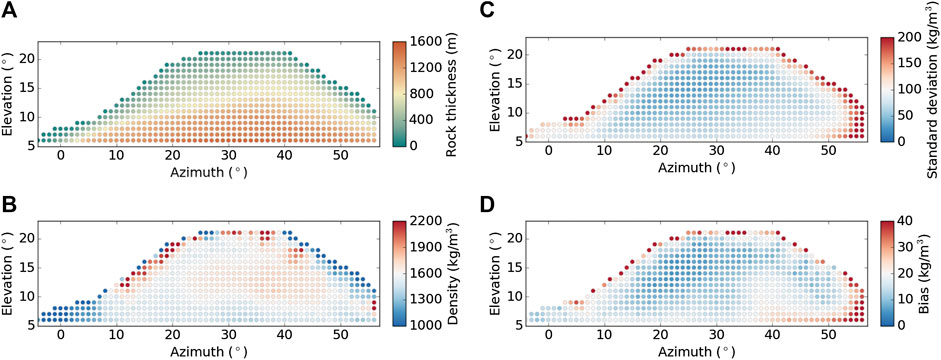
FIGURE 3. Preliminary muographic data of the Puy de Dôme volcano as observed from the Col de Ceyssat with the TOMUVOL detector and associated errors (Cârloganu and the TOMUVOL collaboration, 2018; Niess et al., 2018a). The location of the muon detector is indicated in Figure 2. (A) Thickness of rock along the muon trajectories. (B) Averaged densities estimated from the muon count. (C) Statistical error (i.e., standard deviation). (D) Systematic error (i.e., bias).
In addition to these data, density measurements have been performed on a collection of 45 rock samples from the Puy de Dôme, including the ones from Portal (Portal, 2015). The densities for dry samples range from 1,300 kg/m3 to 2,080 kg/m3 with an average of 1,839 kg/m3 (Figure 4), in accordance to the mean density estimated from the gravimetric data. When water-saturated, the average density reaches 2,044 kg/m3 with densities up to 2,200 kg/m3. The trachytes that constitute the Puy de Dôme therefore present densities lower than usual massive trachytes, such as the ones from New Zealand for instance (Tenzer et al., 2011). This low density can be explained by the high porosity of the samples (Boudon et al., 2015; Portal, 2015).
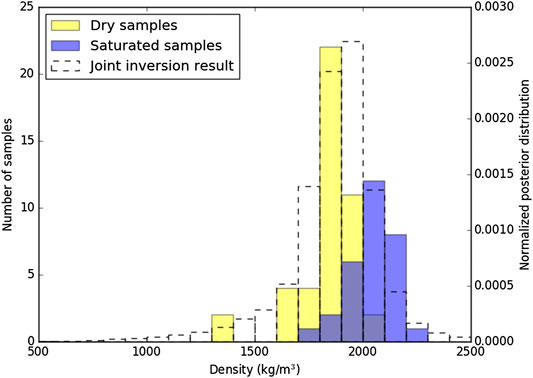
FIGURE 4. Densities measured on dry and water-saturated samples of trachyte from the Puy de Dôme volcano. The dashed histogram corresponds to the normalized distribution of the 3D density model resulting from the joint inversion (Figure 7).
3.2 Inversion Results and Discussion
We describe the volume using a mesh of 85 × 85 × 29 density nodes with a regular spacing of 25 m. This mesh extends up to 1,000 m away from the Puy de Dôme summit and up to an elevation of 800 m, i.e., more than 600 m below the summit. The Chaîne des Puys is covered by a Lidar Digital Elevation Model (DEM) with a 50 cm spatial resolution and a 10 cm precision. We use this DEM for the computation of the gravimetric and muographic data sensitivity matrices. We present here the inversion of the gravimetric data alone, the inversion of the muographic data alone and the joint inversion of the gravimetric and muographic data with offset determination. The LOO criterion is used to determine the optimal set of correlation length λ and a priori density standard deviation
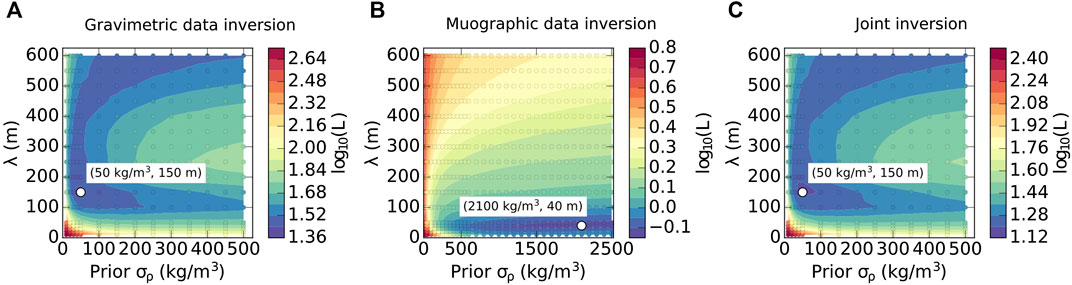
FIGURE 5. Maps of the Leave One Out (LOO) criterion L (Eq. 21) for (A) the gravimetric independent inversion, (B) the muographic independent inversion and (C) the joint inversion. White dots indicate minimal values of L obtained for the optimal sets of a priori density standard deviations
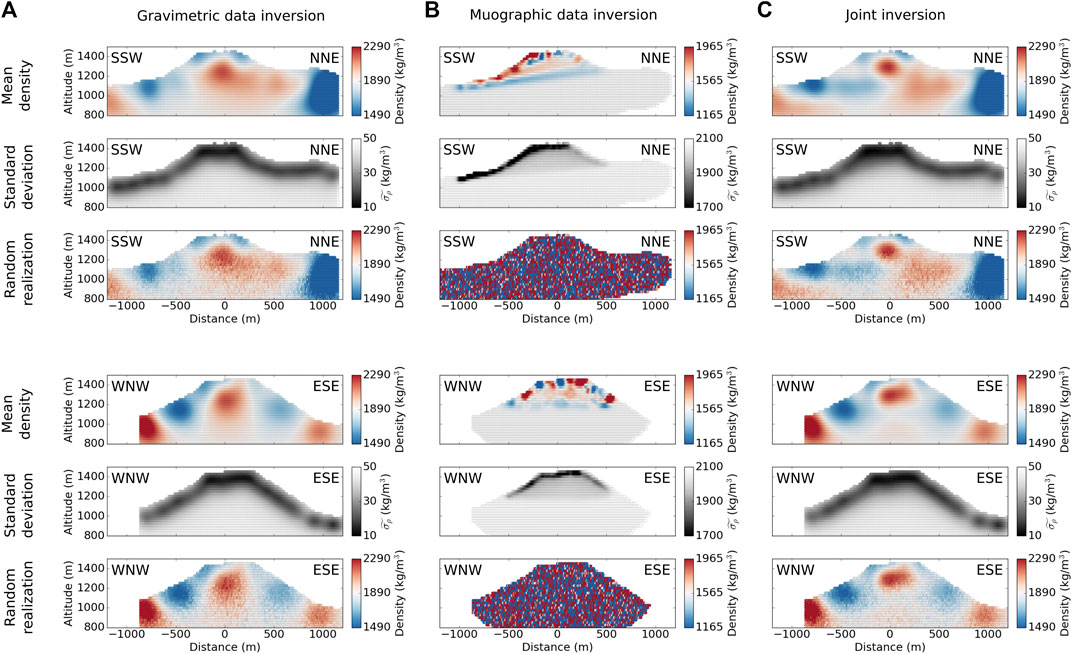
FIGURE 6. Inversion results: mean of the a posteriori density distribution (blue to red color scale), standard deviation (gray scale, the darker the better resolved) and random realization of the posterior distribution (blue to red color scale). The blue to red color scales of all panels have the same range of ±400 kg/m3. (A) Independent inversion of the gravimetric data. The density color scales are centered on 1,890 kg/m3, corresponding to the optimal density correction determined with the Parasnis method from the gravimetric data. (B) Independent inversion of the muographic data. The density color scales are centered on 1,565 kg/m3, corresponding to the weighted averaged of densities from the muographic data. Note that the gray colorscale for the a posteriori standard deviation is different than for the gravimetric and joint inversion results. (C) Joint inversion. The density color scales are centered on 1,890 kg/m3, as for the gravimetric inversion, to ease the comparison between the results. The locations of the SSW-NNE and WNW-ESE sections are indicated on Figure 2.
The optimal inversion result for the gravimetric inversion is obtained for
Here, the inversion of the muographic data alone is not meaningful by itself, as one cannot retrieve a 3D distribution from a single view point, but it is shown for the purpose of illustrating the specificities of the method. The optimal muographic inversion result is obtained for
The optimal regularization parameters for the joint inversion are
The automatic least-squares determination of a constant offset allows to easily invert residual Bouguer anomaly data jointly with averaged densities from muographic data. The constant offset determined in the joint inversion from Eq. 9 is c = 1,650 kg/m3. We recall that the residual Bouguer anomalies have been obtained by substracting a constant density of 1,890 kg/m3, while the muographic data correspond to absolute densities. Consequently, the offset c corresponds to a mean difference of 240 kg/m3 between the muographic and the gravimetric data. This is lower than the difference of 325 kg/m3 observed from the data indicating that the joint inversion helps the resulting density model to be consistent with the two datasets. Note that we have assumed here a constant density offset, taken into account using a mathematical model. To take into account a non constant density offset, a comprehensive physical model would be necessary to fully estimate the bias contained in the data. To ease the comparison with the gravimetric inversion result, we choose the average gravity density of 1,890 kg/m3 as central value for the joint inversion result. The statistical distribution of the densities resulting from the joint inversion is shown in Figure 4. This distribution is closer to the distribution of the dry rock sample densities (average of 1,839 kg/m3) than to the distribution of the water-saturated rock sample densities (averaged of 2,044 kg/m3). Even if the joint inversion result was centered on the average density from the muographic data (1,565 kg/m3) or on an intermediate density value, the whole densities would decrease by a few hundreds of kg/m3, still more consistent with the distribution of the dry rock samples than with the distribution of the water-saturated samples. This supports the idea of a dry dome, highly permeable, so that water quickly flows at depth, in accordance with the literature (Lecoq, 1831; Boudon et al., 2015).
The 3D density model resulting from the joint inversion allows to identify several key structures of the Puy de Dôme volcano (Figures 6C, 7). In addition to the SSW-NNE and WNW-ESE cross-sections of densities and associated standard-deviations (Figure 6C), the 3D density structure of the Puy de Dôme is shown using isosurfaces of 1,690 kg/m3 and 2,090 kg/m3, corresponding to the averaged density of 1,890 kg/m3 ± 200 kg/m3 (Figure 7). These isosurfaces highlight low and high density zones inside the edifice but should not be considered as sharp limitations of the structures. Instead, the extent of the structures (especially the depth extent) is better shown by the random realization of densities from the a posteriori distribution (Figure 6C). We interpret the main identified structures (Figure 7) with regards to the geological map (Figure 1) and the available literature on the area (Miallier et al., 2010; Portal et al., 2016; Boivin et al., 2017; Portal et al., 2019; Deniel et al., 2019). Three main low density anomalies are identified (noted 1, 2 and 3 on Figure 7): 1) to the north-east of the Puy de Dôme, toward the Petit Puy de Dôme edifice, 2) below the north-west slope of the Puy de Dôme at depth, in the Corneboeufs area (Miallier et al., 2010) and 3) at the location of Puy Redon. These three low density anomalies correspond to scoria and cinder Strombolian cones erected before the construction of the Puy de Dôme (Boivin et al., 2017). To the north-west of the Puy de Dôme, higher density anomalies are found in the area covered by basaltic rocks (Boivin et al., 2017) (lava flow noted 4 on Figure 7) which are known to be denser than trachytes. The model also highlights the trachytic core of the dome (noted 5 on Figure 7), denser than the surrounding trachytic breccia, and an associated feeding conduit located to the NNW of the summit. This structure is typical of volcanic domes, with a compact core surrounded by a clastic talus resulting from rockfalls (Hale et al., 2009), as at Soufriere Hills volcano in Montserrat, Lesser Antilles (Sparks and Young, 2002). Another example is the Showa-Shinzan lava dome, Usu, Japan, where the joint gravimetric and muographic inversion results of Nishiyama et al. (2017b) show a massive cylindrical lava block of about 300 m in diameter. We also identify similar higher densities in the area of the Cratère Kilian (noted 6 on Figure 7) which presents trachyte rocks similar to those of the Puy de Dôme (Boivin et al., 2017). Finally, the model brings out a linear high density structure to the south-east, at the bottom of the edifice (noted 7 on Figure 7). This structure is oriented in a north 30° direction and might correspond to an old underlying trachy-basaltic or basaltic lava flow (Figure 1) (Boivin et al., 2017). As shown by the standard-deviations in Figure 6C, the whole density model is better resolved in the first 200–300 m below the surface. The dense trachytic core of the Puy de Dôme 5) and the low density material of the Puy Redon 3) are better delineated at depth thanks to the addition of the muographic data, as indicated by the standard-deviations show in Figures 6A,C. However, structures such as the high density body of the Cratère Kilian 6) or the buried lava flow 7) are located outside the angle of view of the muon detector and are mostly constrained by the gravimetric data. These structures are therefore well constrained laterally, but their depth extents are poorly resolved. Note that, in general, even when some structures are situated outside the angle of view of the muon detector, their imaging is likely to be improved by the joint inversion. Indeed, the gravimetric and muographic datasets are linked in the inversion process, so that the model improvement is global. Nevertheless, the gain in resolution depends on the distribution of gravimetric data (lateral extent and density of coverage), hence on the resolving power of the gravimetric data at depth.
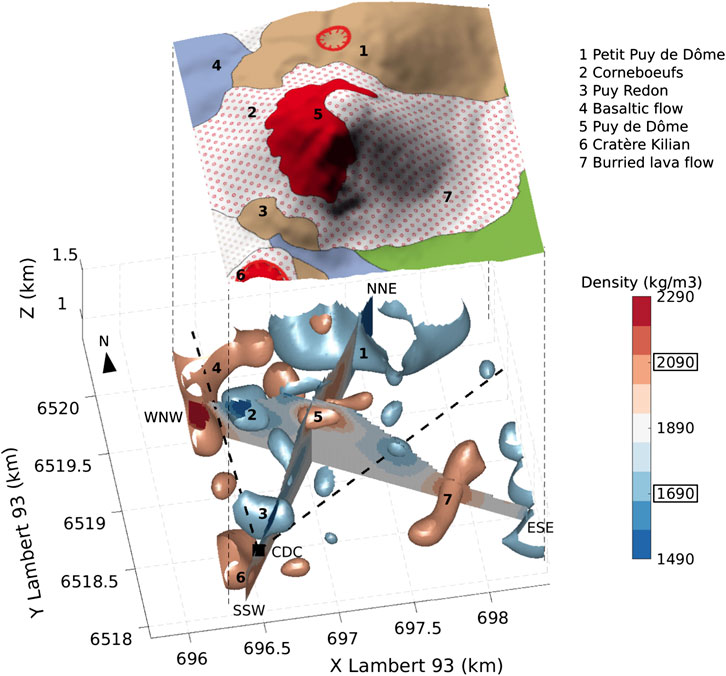
FIGURE 7. 3D density model of the Puy de Dôme volcano resulting from the joint inversion of muographic and gravimetric data, with geological map wrapped on topography. The lateral extent of the model is indicated by the blue square on Figure 1. The averaged density is 1,890 kg/m3. Iso densities of 1,690 and 2,090 kg/m3, corresponding to the averaged density ±200 kg/m3, are chosen to highlight low and high density zones in blue and red respectively. The SSW-NNE and WNW-ESE vertical sections are the same as in Figure 6 (locations indicated on Figure 2). The numbered features indicate the structures discussed in the article. The black square and dashed lines indicate the location of the muon detector at Col de Ceyssat (CDC) and its angle of view.
4 Conclusion
We have presented a robust Bayesian joint inversion method developed in order to reconstruct the 3D density structure of a 1,600 m large volcanic dome. The determination of the two optimal inversion regularization parameters with an LOO algorithm overcomes the artifacts linked to the acquisition geometry. The automatic determination of a constant density offset accounts for a possible bias between the density inferred from the two datasets.
For the case study of the Puy de Dôme volcano, the final 3D density structure is free of data acquisition artifacts and the recovered structures are in accordance with previous geological and geophysical studies. In particular, our results confirm that the Puy de Dôme is dry and permeable, with low density porous trachytic rocks. The muographic data acquired at one location bring a slight improvement to the model compared to the gravimetric data alone. The trachytic core of the dome and its surrounding less dense talus are better delineated. The recovered structure is typical of a lava dome such as Soufriere Hills, Montserrat. The resolution improvement could be amplified thanks to muon acquisitions from complementary view points as shown with synthetic tests (Barnoud et al., 2019; Lelièvre et al., 2019).
The joint inversion method presented in this paper, combined with improved high resolution muon detectors and multiple acquisition view points, has the potential to better image the structure and plumbing system of kilometer size volcanic edifices. Beyond imaging, the method could be used to monitor slow processes including fracturing and flanks instabilities.
Data Availability Statement
The raw data supporting the conclusions of this article will be made available by the authors, without undue reservation.
Author Contributions
AB developed the codes for the inversion of the muographic and gravimetric data, produced the results and wrote the paper. VC and PGL participated in the development of the inversion methodology. AP and LG acquired the gravimetric data. AB and AP processed the gravimetric data. PL participated in the acquisition of the muographic data. AP, PL, and PB provided the density measurements of rock samples. PB provided the geological map. All authors participated in the interpretation of the results and reviewed the manuscript.
Conflict of Interest
The authors declare that the research was conducted in the absence of any commercial or financial relationships that could be construed as a potential conflict of interest.
Acknowledgments
We warmly thank Valentin Niess, Eve Le Ménédeu, and Didier Miallier for fruitful exchanges, collaboration and support. The authors thank the TOMUVOL collaboration for providing the preliminary muographic data (www.obs.univ-bpclermont.fr/tomuvol/). We thank Olivier Coutant for the forward gravimetric computation code. We thank Andrew Harris for discussions on lava dome structures. We thank Yosuke Aoki and Valerio Acocella from the editorial board for their help in the review process and two anonymous reviewers for their comments and corrections that helped improve the article. The LIDAR data used in this study derive from a collective project driven by the Center Régional Auvergnat de l’Information Géographique (CRAIG), financially supported by the Conseil Départemental du Puy-de-Dôme, the European Regional Development Fund and the University of Clermont-Ferrand. Computations have been performed on the supercomputer facilities of the Mésocentre Clermont Auvergne University. This research was financed by the French Government Laboratory of Excellence initiative n° ANR-10-LABX-0006, the Region Auvergne and the European Regional Development Fund. This is Laboratory of Excellence ClerVolc contribution number 430.
References
Alvarez, L. W., Anderson, J. A., Bedwei, F., Burkhard, J., Fakhry, A., Girgis, A., et al. (1970). Search for hidden chambers in the pyramids. Science 167, 832–839. doi:10.1126/science.167.3919.832
Ambrosino, F., Anastasio, A., Bross, A., Béné, S., Boivin, P., Bonechi, L., et al. (2015). Joint measurement of the atmospheric muon flux through the puy de dôme volcano with plastic scintillators and resistive plate chambers detectors. J. Geophys. Res. 120, 7290–7307. doi:10.1002/2015JB011969
Barnoud, A., Cayol, V., Niess, V., Cârloganu, C., Lelièvre, P., Labazuy, P., et al. (2019). Bayesian joint monographic and gravimetric inversion applied to volcanoes. Geophys. J. Int. 218, 2179–2194. doi:10.1093/gji/ggz300
Barnoud, A., Coutant, O., Bouligand, C., Gunawan, H., and Deroussi, S. (2016). 3-D linear inversion of gravity data: method and application to Basse-Terre volcanic island, Guadeloupe, Lesser Antilles. Geophys. J. Int. 205, 562–574. doi:10.1093/gji/ggw030
Boivin, P., Besson, J.-C., Briot, D., Deniel, C., Gourgaud, A., Labazuy, P., et al. (2017). Volcanology of the Chaîne des Puys Massif Central Français. Aydat, France: Parc Naturel Régional des Volcans d’Auvergne, 199.
Boudon, G., Balcone-Boissard, H., Villemant, B., and Morgan, D. J. (2015). What factors control superficial lava dome explosivity? Sci. Rep. 5, 14551. doi:10.1038/srep14551
Cârloganu, C.; The TOMUVOL collaboration (2018). “Density imaging of puy de Dôme volcano with atmospheric muons in French Massif central as a case study for volcano muography,” in EGU general assembly conference abstracts, vol. 20, 18420.
Cârloganu, C., and Le Ménédeu, E.; The TOMOVOL Team (2016). “Density imaging of puy de Dôme volcano with atmospheric muons in French Massif Central as a case study for volcano muography,” in Geophysical research abstracts, EGU General Assembly, Vol. 18.
Cârloganu, C., Niess, V., Béné, S., Busato, E., Dupieux, P., Fehr, F., et al. (2013). Towards a muon radiography of the Puy de Dôme. Geosci. Instrum. Methods Data Syst. 2, 55–60. doi:10.5194/gi-2-55-2013
Camacho, A. G., Montesinos, F. G., and Vieira, R. (1997). A three-dimensional gravity inversion applied to São Miguel island (Azores). J. Geophys. Res. 102, 7717–7730. doi:10.1029/96JB03667
Cella, F., Fedi, M., Florio, G., Grimaldi, M., and Rapolla, A. (2007). Shallow structure of the Somma–Vesuvius volcano from 3D inversion of gravity data. J. Volcanol. Geoth. Res. 161, 303–317. doi:10.1016/j.jvolgeores.2006.12.013
Cosburn, K., Roy, M., Guardincerri, E., and Rowe, C. (2019). Joint inversion of gravity with cosmic ray muon data at a well-characterized site for shallow subsurface density prediction. Geophys. J. Int. 217, 1988–2002. doi:10.1093/gji/ggz127
Coutant, O., Bernard, M. L., Beauducel, F., Nicollin, F., Bouin, M. P., and Roussel, S. (2012). Joint inversion of P–wave velocity and density, application to La Soufrière of Guadeloupe hydrothermal system. Geophys. J. Int. 191, 723–742. doi:10.1111/j.1365-246X.2012.05644.x
Davis, K., and Oldenburg, D. W. (2012). Joint 3D of muon tomography and gravity data to recover density. CSIRO, 1–4.
Davis, K., Oldenburg, D. W., Kaminski, V., Pilkington, M., Bryman, D., Bueno, J., et al. (2011). “Joint 3D inversion of muon tomography and gravity data,” in International workshop on gravity, electrical & magnetic methods and their applications 2011: international workshop on gravity, electrical & magnetic methods and their applications, October 10–13, 2011 (Beijing, China: Society of Exploration Geophysicists), 81.
Deniel, C., Boivin, P., Miallier, D., and Gerbe, M. C. (2019). Multi-stage growth of the trachytic lava dome of the Puy de Dôme (Chaîne des Puys, France). Field, geomorphological and petro-geochemical evidence. J. Volcanol. Geoth. Res. 396, 106749. doi:10.1016/j.jvolgeores.2019.106749
Gómez, H., Gibert, D., Goy, C., Jourde, K., Karyotakis, Y., Katsanevas, S., et al. (2017). Forward scattering effects on muon imaging. J. Instrum. 12, P12018. doi:10.1088/1748-0221/12/12/P12018
Groom, D. E., Mokhov, N. V., and Striganov, S. I. (2001). Muon stopping power and range tables 10 MeV–100 TeV. Atomic Data Nucl. Data Tables 78, 183–356. doi:10.1006/adnd.2001.0861
Hale, A. J., Calder, E. S., Wadge, G., Loughlin, S. C., and Ryan, G. A. (2009). Modelling the lava dome extruded at Soufrière Hills volcano, Montserrat, August 2005–May 2006: Part I: dome shape and internal structure. J. Volcanol. Geoth. Res. 187, 53–68. doi:10.1016/j.jvolgeores.2009.08.023
Jourde, K., Gibert, D., Marteau, J., de Bremond d’Ars, J., Gardien, S., Girerd, C., et al. (2013). Experimental detection of upward going cosmic particles and consequences for correction of density radiography of volcanoes. Geophys. Res. Lett. 40, 6334–6339. doi:10.1002/2013GL058357
Kusagaya, T., and Tanaka, H. K. M. (2015). Development of the very long-range cosmic-ray muon radiographic imaging technique to explore the internal structure of an erupting volcano, Shinmoe-dake, Japan. Geosci. Instrum. Methods Data Sys. 4, 215–226. doi:10.5194/gi-4-215-2015
Lecoq, H. (1831). Itinéraire de Clermont au Puy de Dôme, ou description de cette montage et de la vallée de Royat et Fontanat. Clermont-Ferrand, France: Imprimerie de Thibaud-Landriot.
Lelièvre, P. G., Barnoud, A., Niess, V., Cârloganu, C., Cayol, V., and Farquharson, C. G. (2019). Joint inversion methods with relative density offset correction for muon tomography and gravity data, with application to volcano imaging. Geophys. J. Int. 218, 1685–1701. doi:10.1093/gji/ggz251
Lesparre, N., Gibert, D., and Marteau, J. (2012). Density muon radiography of La Soufrière of Guadeloupe volcano: comparison with geological, electrical resistivity and gravity data. Geophys. J. Int. 185, 1–14. doi:10.1111/j.1365-246X.2012.05546.x
Linde, N., Baron, L., Finizola, A., Revil, A., Muccini, F., Cocchi, L., et al. (2014). 3-D density structure and geological evolution of Stromboli volcano (Aeolian Islands, Italy) inferred from land-based and sea-surface gravity data. J. Volcanol. Geoth. Res. 273, 58–69. doi:10.1016/j.jvolgeores.2014.01.006
Longman, I. M. (1959). Formula for computing the tidal accelerations due to the Moon and the Sun. J. Geophys. Res. 64, 2351–2355. doi:10.1029/JZ064i012p02351
Miallier, D., Boivin, P., Deniel, C., Gourgaud, A., Lanos, P., Sforna, M., et al. (2010). The ultimate summit eruption of Puy de Dôme volcano (Chaîne des Puys, French Massif Central) about 10,700 years ago. Compt. Rendus Geosci. 342, 847–854. doi:10.1016/j.crte.2010.09.004
Moritz, H. (2000). Geodetic reference system 1980. J. Geodes. 74, 128–140. doi:10.1007/S001900050278
Nagamine, K., Iwasaki, M., Shimomura, K., and Ishida, K. (1995). Method of probing inner-structure of geophysical substance with the horizontal cosmic-ray muons and possible application to volcanic eruption prediction. Nucl. Instrum. Methods Phys. Res. Sect. A Accel. Spectrom. Detect. Assoc. Equip. 356, 585–595. doi:10.1016/0168-9002(94)01169-9
Niess, V., Barnoud, A., Cârloganu, C., and Le Ménédeu, E. (2018a). “Methods and tools for transmission muography,” in EGU general assembly conference abstracts, vol. 20, 18110
Niess, V., Barnoud, A., Cârloganu, C., and Le Ménédeu, E. (2018b). Backward monte-carlo applied to muon transport. Comput. Phys. Commun. 229, 54–67. doi:10.1016/j.cpc.2018.04.001
Niess, V., Barnoud, A., Cârloganu, C., and Martineau-Huynh, O. (2020). TURTLE: a C library for an optimistic stepping through a topography. Comput. Phys. Commun. 247, 106952. doi:10.1016/j.cpc.2019.106952
Niess, V., Barnoud, A., Le Ménédeu, E., Cayol, V., and Cârloganu, C. (2016). “Density imaging of Puy de Dôme volcano by joint inversion of muographic and gravimetric data,” in AGU fall meeting (AGU).
Nishiyama, R., Ariga, A., Ariga, T., Käser, S., Lechmann, A., Mair, D., et al. (2017a). First measurement of ice-bedrock interface of alpine glaciers by cosmic muon radiography. Geophys. Res. Lett. 44, 6244–6251. doi:10.1002/2017gl073599
Nishiyama, R., Miyamoto, S., and Naganawa, N. (2014a). Experimental study of source of background noise in muon radiography using emulsion film detectors. Geosci. Instrum. Method. Data Syst. 3, 29–39. doi:10.5194/gi-3-29-2014
Nishiyama, R., Miyamoto, S., Okubo, S., Oshima, H., and Maekawa, T. (2017b). 3D density modeling with gravity and muon-radiographic observations in Showa-Shinzan lava dome, Usu, Japan. Pure Appl. Geophys. 174, 1061–1070. doi:10.1007/s00024-016-1430-9
Nishiyama, R., Taketa, A., Miyamoto, S., and Kasahara, K. (2016). Monte Carlo simulation for background study of geophysical inspection with cosmic-ray muons. Geophys. J. Int. 206, 1039–1050. doi:10.1093/gji/ggw191
Nishiyama, R., Tanaka, Y., Okubo, S., Oshima, H., Tanaka, H. K. M., and Maekawa, T. (2014b). Integrated processing of muon radiography and gravity anomaly data toward the realization of high-resolution 3-D density structural analysis of volcanoes: case study of Showa-Shinzan lava dome, Usu, Japan. J. Geophys. Res. Solid Earth 119, 699–710. doi:10.1002/2013JB010234
Okubo, S., and Tanaka, H. K. M. (2012). Imaging the density profile of a volcano interior with cosmic-ray muon radiography combined with classical gravimetry. Meas. Sci. Technol. 23, 042001. doi:10.1088/0957-0233/23/4/042001
Oláh, L., Tanaka, H. K. M., Ohminato, T., and Varga, D. (2018). High-definition and low-noise muography of the Sakurajima volcano with gaseous tracking detectors. Sci. Rep. 8, 3207. doi:10.1038/s41598-018-21423-9
Oláh, L., and Varga, D. (2017). Investigation of soft component in cosmic ray detection. Astropart. Phys. 93, 17–27. doi:10.1016/j.astropartphys.2017.06.002
Onizawa, S. y., Mikada, H., Watanabe, H., and Sakashita, S. (2002). A method for simultaneous velocity and density inversion and its application to exploration of subsurface structure beneath Izu-Oshima volcano, Japan. Earth Planets Space 54, 803–817. doi:10.1186/BF03352074
Portal, A. (2015). Étude géophysique de la structure interne d’un dôme volcanique : le Puy de Dôme et son environnement (Chaîne des Puys, France). PhD thesis. Clermont-Ferrand (France): Université Blaise Pascal.
Portal, A., Fargier, Y., Labazuy, P., Lénat, J.-F., Boivin, P., and Miallier, D. (2019). 3D electrical imaging of the inner structure of a complex lava dome, Puy de Dôme volcano (French Massif Central, France). J. Volcanol. Geoth. Res. 373, 97–107. doi:10.1016/j.jvolgeores.2019.01.019
Portal, A., Gailler, L.-S., Labazuy, P., and Lénat, J.-F. (2016). Geophysical imaging of the inner structure of a lava dome and its environment through gravimetry and magnetism. J. Volcanol. Geoth. Res. 320, 88–99. doi:10.1016/j.jvolgeores.2016.04.012
Rosas-Carbajal, M., Jourde, K., Marteau, J., Deroussi, S., Komorowski, J.-C., and Gibert, D. (2017). Three-dimensional density structure of La Soufrière de Guadeloupe lava dome from simultaneous muon radiographies and gravity data. Geophys. Res. Lett. , 44, 6743–6751. doi:10.1002/2017GL074285
Saracino, G., Ambrosino, F., Bonechi, L., Bross, A., Cimmino, L., Ciaranfi, R., et al. (2017). The MURAVES muon telescope: technology and expected performances. Ann. Geophys. 60, 0103. doi:10.4401/ag-7378
Somigliana, C. (1930). Sul campo gravitazionale esterno del geoide ellissoidico. Atti della Reale Academia Nazionale dei Lincei. Classe di scienze fisiche, matematiche e naturali. Rendiconti. 6, 237–243.
Sparks, R. S. J., and Young, S. R. (2002). The eruption of Soufrière Hills Volcano, Montserrat (1995–1999): overview of scientific results. Geol. Soc. London Memoirs 21, 45–69. doi:10.1144/gsl.mem.2002.021.01.03
Tanaka, H., Nagamine, K., Kawamura, N., Nakamura, S. N., Ishida, K., and Shimomura, K. (2001). Development of the cosmic-ray muon detection system for probing internal-structure of a volcano. Hyperfine Interact. 138, 521–526. doi:10.1023/A:1020843100008
Tarantola, A. (2005). Inverse problem theory and methods for model parameter estimation. Philadelphia, PA: SIAM, 342.
Tenzer, R., Sirguey, P., Rattenbury, M., and Nicolson, J. (2011). A digital rock density map of New Zealand. Comput. Geosci. 37, 1181–1191. doi:10.1016/j.cageo.2010.07.010
Keywords: joint inversion method, Bayesian inversion, gravimetry, muography, volcanology, lava dome, Puy de Dôme
Citation: Barnoud A, Cayol V, Lelièvre PG, Portal A, Labazuy P, Boivin P and Gailler L (2021) Robust Bayesian Joint Inversion of Gravimetric and Muographic Data for the Density Imaging of the Puy de Dôme Volcano (France). Front. Earth Sci. 8:575842. doi: 10.3389/feart.2020.575842
Received: 24 June 2020; Accepted: 09 October 2020;
Published: 11 January 2021.
Edited by:
Yosuke Aoki, The University of Tokyo, JapanReviewed by:
Mousumi Roy, University of New Mexico, United StatesLászló Oláh, The University of Tokyo, Japan
Copyright © 2021 Barnoud, Cayol, Lelièvre, Portal, Labazuy, Boivin and Gailler. This is an open-access article distributed under the terms of the Creative Commons Attribution License (CC BY). The use, distribution or reproduction in other forums is permitted, provided the original author(s) and the copyright owner(s) are credited and that the original publication in this journal is cited, in accordance with accepted academic practice. No use, distribution or reproduction is permitted which does not comply with these terms.
*Correspondence: Anne Barnoud, anne.barnoud@gmail.com