Volume Changes of Elbrus Glaciers From 1997 to 2017
 Stanislav Kutuzov
 Ivan Lavrentiev
 Andrew Smirnov
 Gennady Nosenko
 Dmitry Petrakov
- 1Institute of Geography, Russian Academy of Sciences, Moscow, Russia
- 2Faculty of Geography, Lomonosov Moscow State University, Moscow, Russia
This study describes the analysis of changes in area and volume of the Mt.Elbrus glacier system, Central Caucasus from 1997 to 2017. It is based on helicopter-borne ice thickness measurements, comparison of high-resolution imagery and two digital elevation models (DEMs) with 10 m resolution. More than 250 km of ground-penetrating radar (GPR) profiles of ice thickness with reliable reflections were obtained. The total volume of Mt. Elbrus glaciers was 5.03 ± 0.85 km3 of ice in 2017. Our results show that 68% of the total ice volume is concentrated below 4,000 m a.s.l. where the average ice thickness was 44.6 ± 7.3 m, 18% of the volume lies within 4,000–4,500 m a.s.l. (thickness of 41.2 ± 7.3 m), and just 14% lies above 4,500 m a.s.l. (thickness of 29.7 ± 6.7 m). The glacier-covered area of Mt. Elbrus decreased from 125.76 ± 0.65 km2 in 1997 to 112.20 ± 0.58 km2 in 2017, a reduction of 10.8%. Over the same period the volume decreased by 22.8%. The mass balance of the Elbrus glaciers decreased by −0.55 ± 0.04 m w.e. a−1 from 1997 to 2017. Mass balance on west-oriented glaciers is less negative than on east-and south-oriented glaciers where mass balance is most negative. The mass balance of the east-oriented Djikiugankez glacier decreased at the fastest average rate (−0.97 ± 0.07 m w.e. a−1). This glacier contains 28% of the total Elbrus glacier system ice volume, most of which is concentrated below 4,000 m a.s.l. Only one small glacier on the western slope demonstrated mass gain. Our results match well with the long term direct mass balance measurements on the Garabashi glacier on Elbrus which lost 12.58 m w.e. and 12.92 ± 0.95 m w.e. between 1997 and 2017 estimated by glaciological and geodetic method, respectively. The rate of Elbrus glacier mass loss tripled in 1997-2017 compared with the 1957-1997 period.
Introduction
Mountain glacier recession is considered to be unequivocal evidence of climate change. Glacier melt water released from ice loss contributes to sea level rise and modifies downstream river runoff (Huss and Hock, 2018). However, knowledge of glacier mass changes is still limited. Assessments of rates of change of global and regional glacier masses may contain considerable uncertainties (Gardner et al., 2013; Zemp et al., 2019). A glacier adjusts its geometry (area and length) in response to climatic changes, but this adjustment is controlled by its dynamic response (Vincent et al., 2017). However, mountain glacier mass balance is driven directly by meteorological variables and hence serves as a good climate indicator. Glacier mass change estimates are usually based on time series of glaciological measurements, digital elevation models (DEMs) differencing, and numerical mass balance estimations (e.g., Paul et al., 2009). In recent years, the geodetic method for estimating changes in the surface elevation and volume of glaciers has been widely used (Berthier et al., 2016; Brun et al., 2017; Azam et al., 2018; Robson et al., 2018). The data were used not only to estimate decadal mass changes but also to correct and reanalyse long-term glaciological mass balance measurements (Zemp et al., 2013; Sold et al., 2016).
Knowledge of glacier volume and spatial distribution is important for many applications, including contribution to sea-level rise and projections of future glacier runoff (Vaughan et al., 2013; Andreassen et al., 2015). The detailed measurements of ice-thickness of mountain glaciers are limited and ice volume is usually estimated using empirical relationships (Bahr et al., 2015). More recently, ice thickness modeling has been based on characteristics of the glacier surface (Farinotti et al., 2019). Despite recent advances these approaches still have large uncertainties. In this respect ice volume estimates from direct ice thickness measurements are of high importance and provide valuable ground truth. Currently the global ice thickness database contains observations from ~1,100 glaciers and ice caps (Gärtner-Roer et al., 2014).
Radio-echo sounding is a powerful and widely used method of assessing glacier thickness and bedrock topography, and provides meter-level accuracy using ground-penetrating radar (GPR) (Navarro and Eisen, 2009). Airborne GPR surveys are still quite rare in mountain areas and the data obtained are reported to have lower quality, which poses difficulties for interpretation of the signal (Rutishauser et al., 2016). Nevertheless, rapid airborne data acquisition in comparison to ground-based surveys enables estimation of ice thickness over large areas of rough mountain terrain.
Our study site is Elbrus Mountain, the highest in the Caucasus with total glacier coverage of ~109 km2 in 2017 or ~10% of the total glacier coverage in the Caucasus and the Middle East region (Figure 1). The most comprehensive assessment of Elbrus glaciation was published in 1968 (Tushinskiy, 1968). It was based on the results from numerous studies conducted during the International Geophysical Year in 1957-1958.
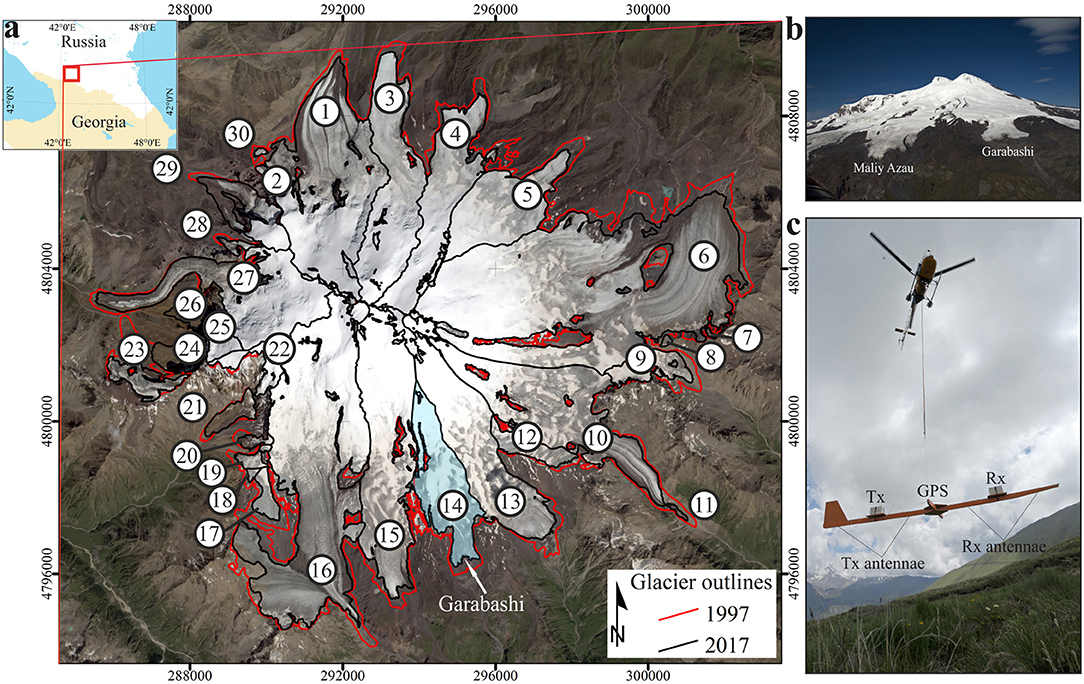
Figure 1. (a) Location of Mt. Elbrus. Changes in glacier area between 1997 (red) and 2017 (black) are superimposed on a SPOT 7 image obtained on 20 August 2016. Numbers mark individual glaciers; see Table 2 for their names and statistics. Rectangular coordinates are recalculated for UTM Zone 38 projection. Oblique photographs of glaciers on Mt. Elbrus (b) and of a helicopter with suspended GPR VIRL-6 on a wooden frame (c).
Recent studies of glacier fluctuations in this area focused mostly on areal and length changes (Zolotarev and Kharkovets, 2012; Holobâcǎ, 2013; Shahgedanova et al., 2014; Solomina et al., 2016; Tielidze and Wheate, 2018) and ice core studies (Mikhalenko et al., 2015). Glaciological mass balance measurements have been performed on Garabashi glacier (Figure 1) since 1987 (Rototaeva et al., 2019). Elbrus glacier volume changes were previously estimated by the comparisons between topographic maps based on aerial photographs and topographic surveys produced by the Lomonosov Moscow State University in 1957 and 1997, and on a topographic map completed in 1887 by Podozerskiy (1911), although state-of-the-art assessment of the uncertainties of this map has not been done (Zolotarev, 2009).
Recession of the Elbrus Mt. glaciers leads to contradictory effects on glacier-related hazards. The area of glacier lakes and the threat of glacier lake outburst floods (GLOF) have been increasing. In 2006 a GLOF caused damage to infrastructure at the Dzhilysu resort (Petrakov et al., 2007), and minor GLOFs occurred in 2007 and 2011 (Perov et al., 2017). On the other hand, glacier down wasting may lead to a decreasing potential for the occurrence of lahars. Therefore, the reliable data on ice thickness distribution are of great importance.
In this study we present results of helicopter-borne and ground-based ice thickness surveys conducted in 2013, 2014, and 2017 over the Elbrus glaciers. Ice thickness and volume, together with glacier-wide mass balance of these glaciers, were estimated from 1997 to 2017. The surface elevation change was obtained by differencing two high resolution DEMs. There are 16 main outlet glaciers within the Elbrus glacier system and a number of smaller separate glaciers around the mountain. In this paper we estimated elevation changes for 23 individual glaciers while relative ice loss was assessed for 19 glaciers.
Data
GPR
Airborne GPR surveys across the Elbrus glacier system were performed during two field campaigns on 1st July 2013 and 25th June 2014. For the ice thickness measurements a 20 MHz monopulse GPR VIRL-6 (Macheret et al., 2006) was used. Radar components (transmitter, receiver, control unit, batteries, antennas, and GPS) were mounted on a wooden frame suspended beneath a helicopter by a non-metal cable (Figure 1c). The frame has sufficient weight (about 150 kg) and a tail stabilizer, which ensure a stable position during flight.
In 2013 flights conducting GPR measurements over all the glaciers of the southern and eastern sectors of Elbrus started from Terskol airfield (Figure 2, orange line). A total of 211.7 km of profiles were made directly above the glaciers, while reliable basal returns were registered on 167 km of profiles (79% of the total length of the flights over glaciers or 30,000 points). In 2014 GPR measurements were carried out during two flights starting from Bermamyt plateau (~3,000 m a.s.l.) situated on the northern side of Elbrus (Figure 2, magenta line). The total length of profiles with reliable radar returns from basal layers was ~90 km (69% of the total flights length above glaciers or 10,000 points). Additionally we used ground-based ice thickness data obtained in 2017 at the western firn plateau (~5,100 m a.s.l.) (Figure 2, red line) and at the east crater of Elbrus (~5,500–5,600 m a.s.l.) (Figure 2, green line). A 20 MHz impulse GPR VIRL-7 (Vasilenko et al., 2011) and a 300 MHz GPR ZOND-12e (http://www.radsys.lv) were used for ground-based measurements on the western plateau and east crater, respectively (Mikhalenko et al., 2017), where radar components were carried over the glacier by three (VIRL-7) and one (ZOND) people.
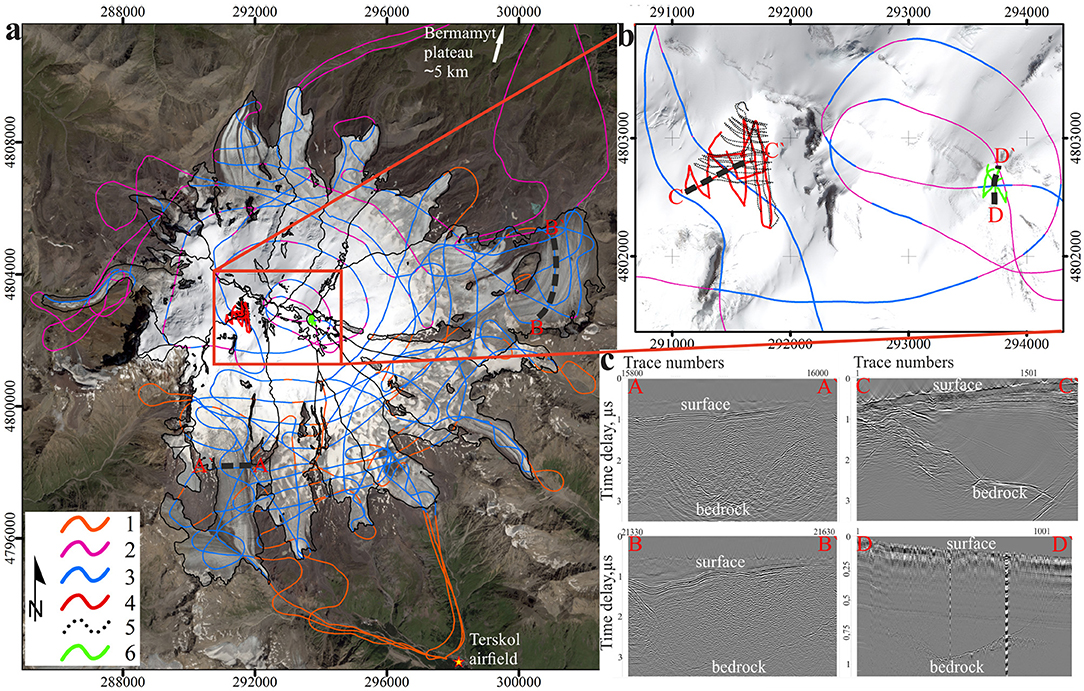
Figure 2. (a) Ice thickness measurements of Elbrus glaciers in 2013 (1) and 2014 (2). All GPR profiles with detectable bedrock reflections are shown in blue (3). Rectangular coordinates are recalculated for UTM Zone 38 projection. (b) Ground-based measurements carried out in 2017 at the western plateau (4) and eastern crater (5) of Elbrus are shown in the enlarged region. The SPOT 7 image obtained on 20 August 2016 is shown as a background. (c) Typical radargrams from aerial and ground-based radar measurements.
DEMs
The Pléiades stereo-pair and DEM used in this study were provided by the Pléiades Glacier Observatory initiative of the French Space Agency (CNES). The DEM (4 m resolution) was generated using the Ames Stereo Pipeline of Pléiades images acquired on 8 September 2017 (Shean et al., 2016). The vertical precision of the Pléiades DEM was assessed earlier (Berthier et al., 2014; Marti et al., 2016; Belart et al., 2017) and generally is between ± 0.5 m ± 1 m.
The 1997 DEM was obtained as a result of an aerial photography survey conducted on 8 September 1997 by the Faculty of Geography, Moscow State University. The methodology is described in detail in Zolotarev and Kharkovets (2000). The DEM was created from 10 stereo pairs. Aerial images were digitized using a photogrammetric scanner and then georeferenced using a set of ground control points with reported 1.5 m horizontal and vertical accuracy. About 100,000–150,000 tie points matched stereoscopically were generated for each stereo pair by automatic (96% of points) and manual matching using custom photogrammetric software developed in the laboratory of Aerocosmic methods, Lomonosov Moscow State University. The average reported distance between the points was 20 m, which enabled the generation of DEM with reported ±1 m vertical accuracy (Zolotarev and Kharkovets, 2000). The presence of shadowed blind zones and areas covered with fresh snow on aerial images (Figure S1) resulted in reduced density of control points and therefore larger uncertainties in some parts of DEM. The 1997 DEM we used for this study has a spatial resolution of 10 m.
Imagery
The available imagery for this study include an orthoimage mosaic of the 1997 aerial photographs with a resolution of 2.2 m, the 2017 Pleiades image with a resolution of 0.5 m, the SPOT7 image (1.5 m resolution) obtained on 20 August 2016. In addition, a set of aerial and ground photographs obtained during 2013-2017 summer season was used for glacier outline correction (Table 1).
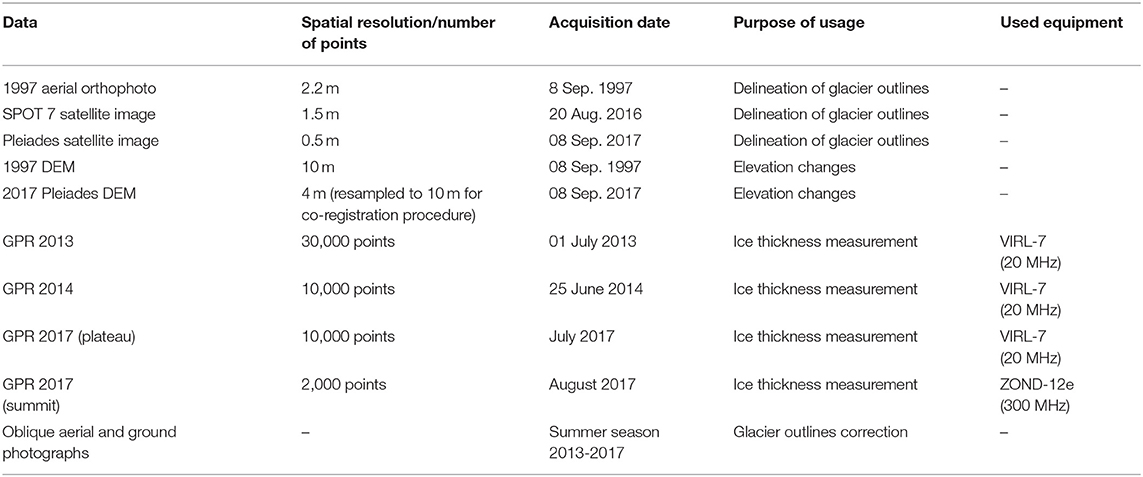
Table 1. List and characteristics of used datasets.
Methods
DEM Co-registration
The surface elevation change of Elbrus glaciers from 1997 to 2017 was calculated using the difference between the two DEMs. After the initial processing of the DEMs (reprojection and resampling to 10 m), the 1997 DEM was subtracted from the 2017 DEM. The resulting map revealed relief-like structures over the non-glacial areas (Figure 3A). Such a pattern suggests that one model is horizontally shifted relative to another; thus, co-registration is required. A solution of the horizontal co-registration of DEMs was presented in Nuth and Kääb (2011) and consists of finding the shift parameters through an analytical regression equation.
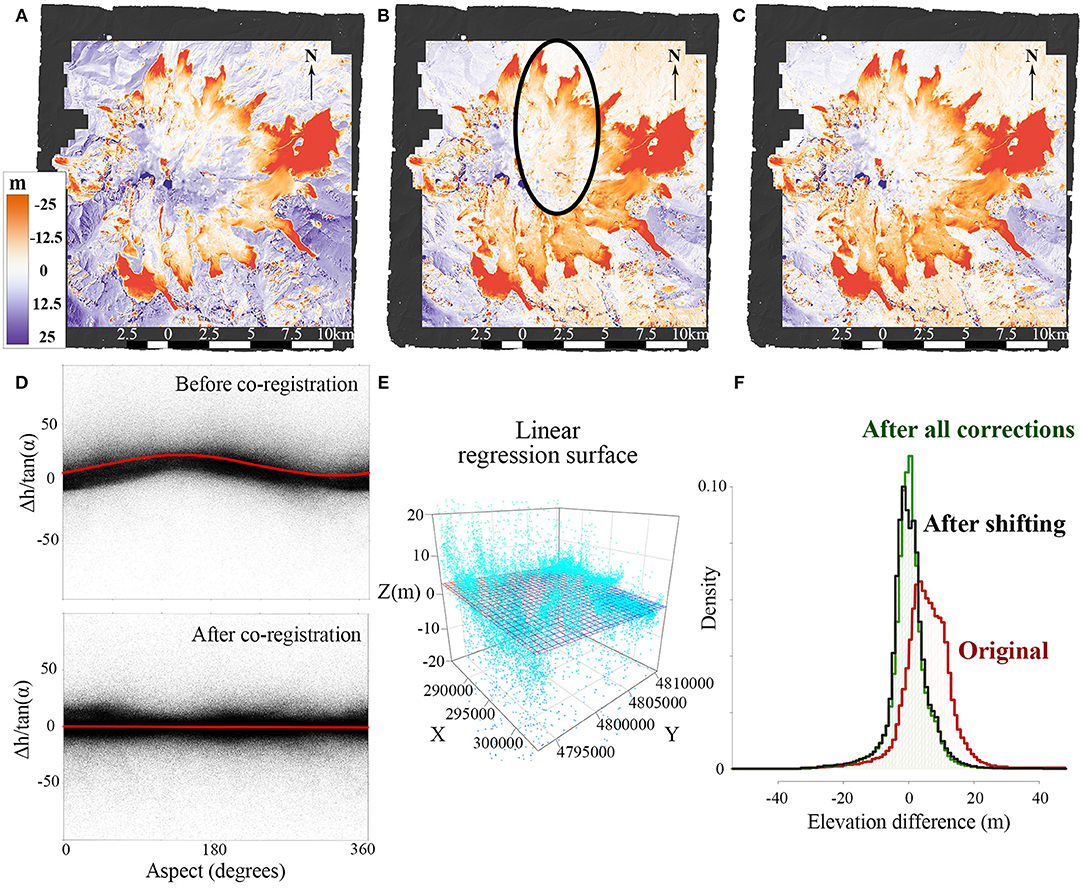
Figure 3. Initial elevation difference (Δh) map between 2017 Pléiades and 1997 DEMs (A) before and (B) after co-registration. (C) Final elevation difference raster after along-cross amendment and manual correction. (D) Plots show the aspect-dependent distribution of shift direction and its magnitude on stable terrain before and after co-registration. (E) Regression surface for along- and cross-line correction of the 1997 DEM. (F) The Δh values distribution improvement through the steps of corrections.
The elevation difference obtained by subtracting the DEMs is described by the equation:
and the horizontal shift is expressed by the equation:
Where Δh is the individual elevation difference, α is the terrain slope, ψ is terrain aspect and (Δh) is the overall elevation bias between the two elevation data sets.
The displacement vector has horizontal (a) and vertical components (c), as well as some direction (b). In addition, the distortion of the Δh value depends upon the slope. The sinusoidal dependence of the elevation differences over the stable terrain on the aspect is shown in Figure 3D. Calculation of the parameters in Equation 2 and approximation of the data by a sinusoid were carried out by the least squares method. Since the proposed solution is analytical and the relief is not an analytical surface, several iterations may be required to co-register one DEM to another. In the original method (Nuth and Kääb, 2011), it was proposed that the process be terminated when the calculated shift is <0.5 m. In this paper, the final horizontal displacement parameter is 0.09 m. The calculated vertical offset of the last iteration is 0.36 m and is applied to the 1997 DEM.
Some areas of instrumental distortions in the 1997 DEM were identified after the co-registration procedure (Figure 3B). The nature of such artifacts may be due to known problems during one of the aerial photography flights in 1997 over the northern slopes of Elbrus. Areas on the non-glacial part can be excluded from the analysis, since they are not involved in further calculations; however, the incorrect data over the glaciers need to be resolved. In this case, automated analytical correction with the help of any function is impossible, since the distortions are not random. Boundaries of erroneous elevations were determined by analysis of the Δh value distributions along the longitudinal and transverse profiles. On the basis of abrupt changes, in places where there is no logical explanation for this, the boundaries of violations were identified and adjustment values (1–4 m) were determined accordingly. For the most part the alleged defect of the glacial surface coincided with the genetic distortion of the stable relief, therefore the corrections were made to both glacier and non-glacier areas which met the requirement of minimal distortion of the original data.
The difference raster of the co-registered DEMs has a gradient of values from west to east. It is possible to correct such bias by building regression planes (Figure 3E). Planar analysis combines the search for longitudinal (south-north) and transverse (west-east) distortions. For the longitudinal-transverse correction (which in this case acts as a tilt operation of the slave DEM), a linear approximation was adopted:
The coefficients a and b from Equation 3 are equal to the tangents of the plane inclination angles in the transverse and longitudinal direction, respectively. After this correction was applied, co-registration analysis was repeated, which revealed an additional shift of the DEM by 1.4 m.
Thus, three types of DEM adjustments were made: horizontal shift, elimination of artifacts, and tilt of one model relative to another (Figures 3C,F). This procedure eliminated the vertical biases of the two models and increased the accuracy by 12.3%. The final correction parameters are shown in Table S1.
Areas of fresh snow cover are apparent in original imagery of 1997 and 2017 used for DEMs generation (Figures S1b,c). Snow cover had similar distribution on both images, and field snow depth data collected during mass balance survey on Garabashi Glacier, showed that snow cover was only a few centimeter at the time of image acquisition; therefore no additional correction was applied.
Exclusion of Outliers and Calculation of Glacier Mass Changes
Several outliers were identified on the resultant difference DEM, both over the stable terrain and glacier surfaces. For non-glacier areas elevation differences over 50 m were excluded from the statistical analysis. It is still conservative as it exceeds three times standard deviation of the elevation difference over the stable terrain. Erroneous deviation zones over glaciers correspond mostly to very steep slopes, ice falls and ice-cliff areas. Distributions of the Δh values were calculated for 100 m elevation bins and then the deviations exceeding 2σ were eliminated from the analysis (Figure 4A). Extreme values can be seen in Figure 4B, which illustrates the distribution of the Δh values with elevation over glaciers.
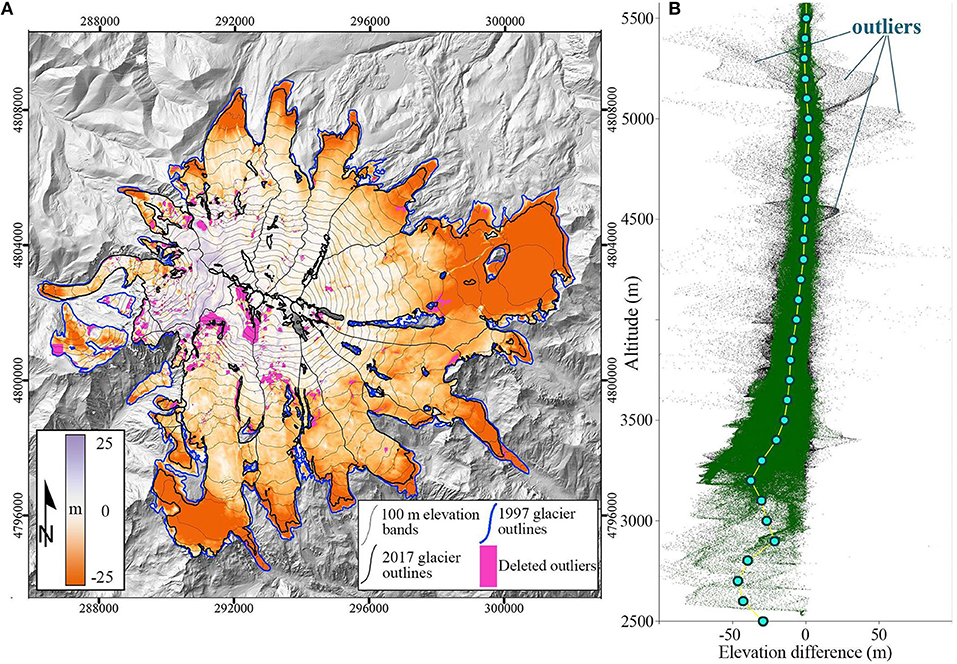
Figure 4. (A) Surface elevation changes of Mt. Elbrus glaciers in 1997-2017. Thin black lines mark the 100 m elevation contours, and thick lines separate glacier basins. (B) Plot shows the Δh distribution vs. altitude. Green color marks points used in the calculations, black points show deleted outliers (corresponding to pink shaded areas on the map). Blue points indicate mean Δh values for every 100 m elevation band. Pléiades DEM of 2017 used as a background.
Glacier volume change ΔV (m3) was calculated as:
Where (m) is the average elevation change within the glacier in 1997-2017 and A1997 is the glacier surface area (m2) in 1997.
The area-average mass balance rate (m w.e. a−1) was calculated as:
where fρ is the conversion factor, Δt is the length of the period (20 years) and is the average glacier area between 1997 and 2017. Given the high spatial variability of snow/firn/ice density on Elbrus glaciers, which cover the elevation range of more than 3,000 m, the mean elevation changes were converted to mass change using the constant density conversion factor of 0.85 ± 0.06 (Huss, 2013).
Glacier Outlines
Outlines for the Elbrus glaciers were drawn manually using the orthoimage of 1997 and the Pléiades image of 2017, together with the SPOT 7 image obtained on 20 August 2016 for visual control and delineation of nunataks in areas covered with fresh snow on the Pléiades image. Additionally, we used a large database composed of aerial and ground photographs, field data, and RES measurements to confirm some boundaries for debris covered glaciers. Boundaries drawn using the 1997 image were corrected to include parts which showed considerable thinning from 1997 to 2017. Ice divides and drainage basins were determined using a hydrological analysis of the surface topography in ArcGIS.
We used a multiple digitizing approach to estimate the uncertainty in the glacier area (Paul et al., 2013). Glacier outlines were drawn independently by three people using all the available materials. The comparison revealed that the maximum difference of the total Elbrus glacier area was 0.65 km2, or <1% of the total area. For debris covered glaciers the uncertainty was up to 20% larger. The resulting uncertainty of each individual glacier represents the absolute maximum difference between three digitized outlines.
GPR
Airborne ice thickness measurements were carried out automatically at a frequency of 0.2 s; the average flight speed during the measurements was about 70–90 km/h while elevation above the glacier surface ranged from 15 to 700 m. A conventional GPS (Garmin GPSMap 76x) was used to record plane coordinates every 2 s. The average flight height above the glaciers was 132 m and best results were obtained when flight height was not <80 m. The mean distance between measurement points was 5.6 m in 2013 and 8.7 m in 2014. Ground-based measurements on the western plateau were performed by three persons carrying radar components in backpacks along a walking route. A Garmin GPSMap 78 was used to record plane coordinates while radar signals went through the media each 0.4 s automatically. GPR measurements at the eastern crater were collected with a ZOND-12e radar by moving shielded antenna on the surface of the glacier by a single operator. Data were acquired automatically at rate of 3.5 s. More than 6 and 1.3 km of profiles with bed returns were obtained on the western plateau and eastern crater, respectively.
For data processing RadexPro Basic 2011.1 we used software (www.radexpro.ru, Kulnitsky et al., 2000). Standard procedures of amplitude correction, bandpass filtering, 2-D spatial filtering, and Stolt-FK migration (to obtain the real geometry of the bedrock by correcting the position of the lateral reflections using Fourier analysis) were applied to the raw radar data. Picking was used for manual digitizing of the time delay of reflected signals in interactive mode.
Several types of reflected signals were detected on the obtained radargrams. The first type was the reflected signal from the air—glacial/ non-glacial surface interfaces. Reflections of the second type were from the surface and intraglacial inhomogeneities (e.g., crevasses and water impurities in temperate ice). These were sources of strong scattering of radio signals in ice saturated with melt water (which is typical for temperate glaciers), which in some cases significantly complicated the interpretation of radar records and often made it impossible to detect the bedrock. The third type of reflection was from the ice/subglacial bed interface (Figure 2c). These reflections were represented by hyperbolas from individual point reflectors at the basal layers, or continuous lines along the measurement profiles.
After data processing, a summary table of UTM-coordinates (x, y) and the delay time (τ) of the digitized bedrock was compiled and the glacier thickness was calculated using an average speed of 0.168 m/ns for radio wave propagation in the glacier (Dowdeswell and Evans, 2004). To account for the ice thickness changes between the measurements made in 2013-2014 and the DEM 2017, we applied an elevation dependent correction for ice-thickness points subject to the average annual elevation change between 1997 and 2017 reported in this paper. In the final step, ice-thickness point data, together with data on zero thickness at glacier margins, were used to construct the ice thickness map by means of the empirical Bayesian kriging interpolation (Krivoruchko, 2012). We used the following kriging parameters for interpolation of Elbrus ice thickness data: empirical transformation, K-Bessel semivariogram model, the subset size of 100, an overlap factor of 3, and the number of simulations set to 100. The search radius was set to 700 m, reflecting a maximum distance between GPR profiles.
Error Assessment
We evaluated several sources of uncertainties which contributed to the total uncertainty of the glacier volume changes (εΔv). The combination of uncertainties changes for different results and outcomes of this study. The average elevation change uncertainty (εΔh) over the given area depends on the accuracy of the DEMs and a number of included measurement points. The reported average annual mass balance error (εBa) is converted to volume, summed over the area of interest, and combined with the density assumption (ερ) and area uncertainty (εA). Finally, when reporting the relative glacier volume loss for a particular zone/area/glacier, the above errors are summarized with the total error of the volume calculation (εv), which in turn includes the GPR measurement error (εgpr) and interpolation error (εint).
Mass Balance Uncertainty
Errors in elevation change values were estimated as follows. Individual errors (εΔhi) for pixels were considered to be equal to the standard deviation of the DEM differences over the stable terrain (6.64 m). This should be regarded as a conservative estimation.
The errors in elevation changes over the elevation bins and glaciers were calculated by taking into account the standard deviation of Δh over non-glacier areas as well as the degree of spatial correlation. We follow the approach suggested earlier by Rolstad et al. (2009) and Fischer et al. (2015). It requires an estimation of the area (Acor) where errors are considered as spatially correlated using Equation 6:
Where R represents the radius of the circular area and is equal to the spatial correlation distance (120 m). The latter was estimated by producing the single spherical semivariogramm model for the DEM difference values over the stable terrain (Figure S2). Similar to Rolstad et al. (2009) the uncertainty of the average elevation difference over a given area was calculated as:
Where σΔh is the standard deviation of Δh over non-glacier areas and A1997 is the area in 1997.
When calculating the total Δh error the weighted errors over the elevation bins were summed over all Elbrus glaciers.
The uncertainty of the volume change (εv) and the area-average mass balance rate (εBa) was calculated for each glacier using Equations 8, 9 following (Fischer et al., 2015; Zhou et al., 2019).
Where fρis the density conversion factor (0.85) and ερ is the uncertainty of the conversion factor (0.06), εA represents the uncertainty of the glacier area (Table 2).
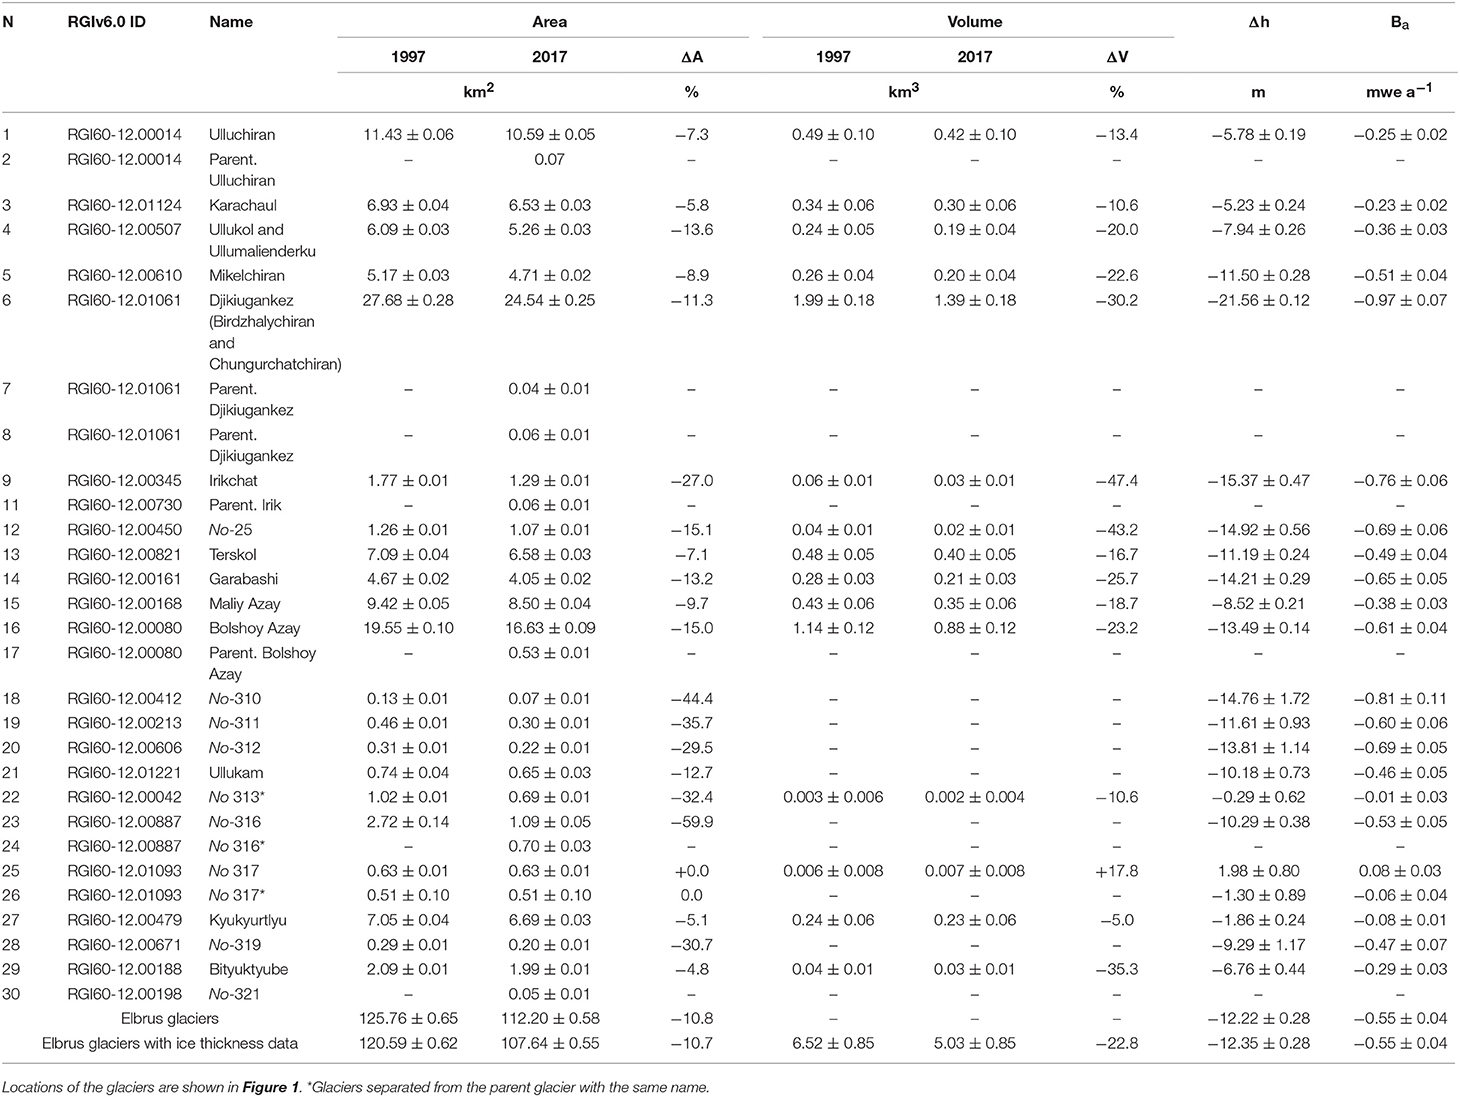
Table 2. Volume, area and elevation changes, together with geodetic mass balances, for the entire Elbrus area and individual glaciers.
GPR
Errors in average ice thickness values occur from measurement errors, which are related to the chosen time-to-depth conversion (εc) and to the reflection picking accuracy or timing error (ετ).
Airborne GPR data quality and consistency can be evaluated by comparing ice-thicknesses obtained at intersections of different profiles (Martín-Español et al., 2013). The standard deviation of the absolute differences at 107 intersections within the aerial survey is 6.0 m (8.9%). Additionally, we compared airborne and ground-based ice thickness data obtained on the western plateau of Elbrus and in the eastern crater (Figures 2b,c). Data from two independent surveys show a good correspondence at intersections, with a standard deviation of ice thicknesses of 7.8 m (6.9%).
Radio wave velocity varies over the glacier and depends mostly on density of the media (snow, firn, ice), and the presence of liquid water. The radar survey of the Elbrus glaciers covered both accumulation and ablation areas. Conditions vary from complete absence of melting and a thick firn cover of 50–60 m at the high elevated flat areas, to typical ablation zones in temperate glaciers. Here we used a constant velocity of 0.168 m ns−1 for time-to-depth conversion for all survey points except for the western firn plateau. Previous studies show that the average radio wave velocity for 180 m depth on the plateau is 0.180 m ns−1 (Lavrentiev et al., 2010). This was estimated from the density measurements of a 180.2 m ice core and from borehole temperature information. Therefore, the use of a constant velocity of 0.168 m ns−1 underestimates ice thickness by 6.6%. It should be noted that the western plateau, with its high accumulation, significant ice thickness and low temperatures, is atypical for Elbrus. Therefore we consider the measurement error related to the choice of constant radio wave velocity to be 5% as recommended for the radar surveys which cover both accumulation and ablation zones (Lapazaran et al., 2016a).
Another source of error in GPR measurements involves picking accuracy, or timing error (ετ), which can be estimated from the vertical resolution of the radar system and depends on the central frequency defined as ετ = 1/f. In our case ετ is equal to 50 ns or 4.2 m when using velocity of 0.168 m ns−1. The combined average measurement error (εgpr) for more than 60,000 points is 6.2 m (7.4% of average measured ice thickness) with a standard deviation of 2 m and maximum error of 12.9 m.
Interpolation Error
We evaluated the prediction of standard errors using an empirical Bayesian kriging (Krivoruchko, 2012). Cross-validation analysis showed that the kriging interpolation resulted in a root mean square error of 1.65 m for 60,000 measured points with a maximum error of 38 m. The EBK method implies an automated subsetting of measurements and numerous repeated semivariogram model calculations. The distribution of multiple semivariograms is then used to interpolate values and estimate prediction errors. Errors propagate depending on the spatial densities of the profiles and variability of ice thicknesses, and the largest errors correspond to the areas with the least data coverage. Another source of uncertainty involves large variations in ice thicknesses over short distances. For example, in some cases points with measured ice-thicknesses of several tens of meters were located close to glacier boundaries (Figure 5B).
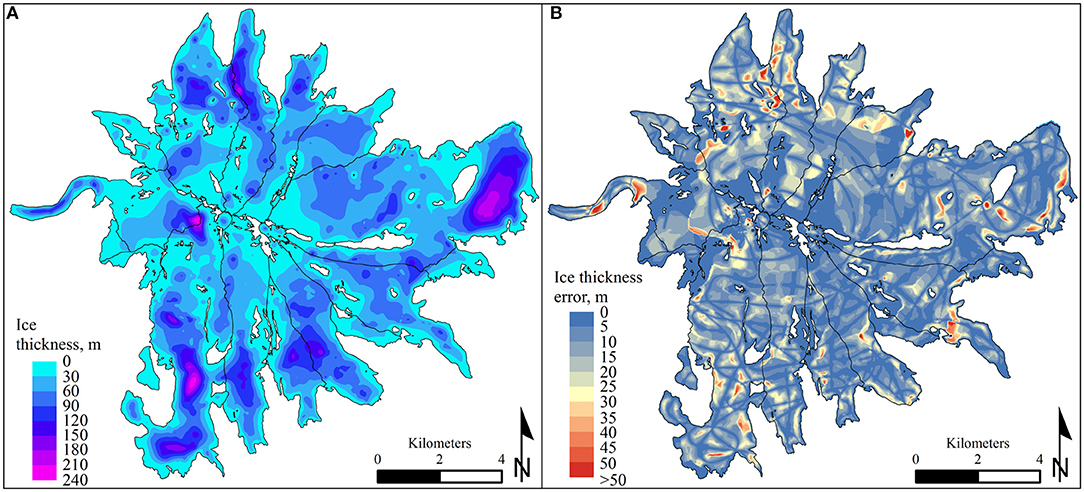
Figure 5. (A) Ice thickness distribution of Elbrus glaciers and (B) predicted ice thickness errors.
To estimate a total error in volume calculation due to interpolation we analyzed the difference between ice thickness DEMs constructed when using low (0.25 quantile) and high (0.75 quantile) estimates based on semivariogram distribution. The resulting difference gave the interpolation error corresponding to ± 4.9 m uncertainty in average thickness of the Elbrus glaciers. Combined with the measurement errors the final estimated error in total volume estimation for the Elbrus glaciers is ±0.85 km3, or ±17% of the total volume.
Results
Area Changes
From 1997 to 2017 the total area of the glaciers in the Elbrus system decreased from 125.76 ± 0.65 to 112.20 ± 0.58 km2 at a rate of 0.54% per year. Over this period five ice bodies with a combined area of 0.76 ± 0.01 km2 separated from the Elbrus glacier system (Figure 4). Area reduction was not only due to retreat of the glacier tongues, but also to the increasing exposure of existing nunataks and emergence of new rock outcrops below 4,500 m a.s.l.
The Elbrus glaciers were characterized by different relative surface area reductions. The maximum area reduction among the outlet glaciers of Elbrus was registered for Irikchat glacier (Figure 1a, No.9), which lost almost 30% of its area from 1997 to 2017 (Table 2). Two debris-covered glaciers (N316 and N317), located on the western slope (see Figure 1a, No. 23 and No. 26), were characterized by different behaviors. Despite the larger uncertainties of the boundaries of the debris covered glaciers, we suggest that between 1997 and 2017 the area of glacier N317 did not change while glacier N316 was divided in two. However, recently the eastern part (N316*) showed a surface elevation increase in the lower regions and a slight (50–70 m) advance (Figure S4).
Glacier Ice Thickness and Volume
In 2017 the total glacier volume of the measured Elbrus glaciers was 5.03 ± 0.85 or 4.53 ± 0.77 km3 of water in 2017. Considering that the unmeasured glacier area is only 4.5 km2, the total volume is assumed to be slightly larger but most likely within the uncertainty range. The average ice thickness of the Elbrus glaciers is 44.9 ± 7.3 m. The largest glacier is the Djikiugankez (Birdzhalychiran and Chungurchatchiran glaciers), with a total area of 24.54 ± 0.25 km2 in 2017, an average ice thickness of 56.8 ± 7.3 m, a maximum glacier thickness of 204.0 ± 11.0 m and contains 1.39 ± 0.18 km3 of ice. The next largest is the Bolshoy Azay glacier (16.63 ± 0.09 km2), with a maximum ice thickness of 237.0 ± 12.6 m and an average thickness of 49.7 ± 7.3 m. These two glaciers contain 45% of the total ice on Elbrus (Figure 5, Table 2). Of all the Elbrus outlet glaciers, the Irikchat glacier (1.29 ± 0.01 km2) has the smallest volume (0.03 ± 0.01 km3). More than 60% of the total volume of glaciers (3.16 ± 0.56 km3) is concentrated below 4,000 m. Ice thickness decreases at the upper elevations and only 14% of the total glacier volume is located above 4,500 m, mostly on the western Elbrus plateau (Figure 2b). The ice volume distribution for individual glaciers is presented in Figure S2. It should be noted that volume distribution is strongly influenced by the GRP data coverage, which is particularly evident for the middle parts of west oriented glaciers. The ice thickness over the steep slopes (25–40°) is expected to be relatively small, but the data coverage is sparse to confirm this.
Elevation Change and Glacier Mass Balance Rates
Over the 20 years between 1997 and 2017 the average elevation change of all the Elbrus glaciers was −12.22 ± 0.28 m. The most significant thinning occurred below 2,900 m a.s.l. where ice thickness decreased by 38.5 ± 1.8 m on average due to thinning of two low lying tongues of the Bolshoy Azau and Irik glaciers (Figure 4B). By 2017 only about 1% of total ice volume below 3,200 m a.s.l. still existed. The most significant elevation decrease occurred between 3,200 and 3,400 m a.s.l. on the vast flat plateaus of the Djikiugankez and Bolshoy Azau glaciers, where ice thicknesses decreased by 45.6 ± 1.5 and 30.5 ± 1.0 m, respectively.
From 1997 to 2017 glacier-wide mass balance of the Elbrus glaciers decreased at a rate of −0.55 ± 0.04 m w.e. a−1. The most negative average mass balance rate of −0.97 ± 0.07 m w.e. a−1 was observed for the Djikiugankez glacier, followed by the Irikchat glacier −0.76 ± 0.07 m w.e. a−1) and glacier N25 (−0.69 ± 0.05 m w.e. a−1) (Figure 6). The mass balance of the three northern glaciers changed at an average rate of −0.27 ± 0.04 m w.e. a−1, while five glaciers on the southern slope lost 0.54 ± 0.10 m w.e. per year. The least negative mass balance change rate was calculated for the Kyukyurtlyu glacier, and the only glacier that gained mass was N317, which is located above 3,700 m a.s.l. (Figure 6).
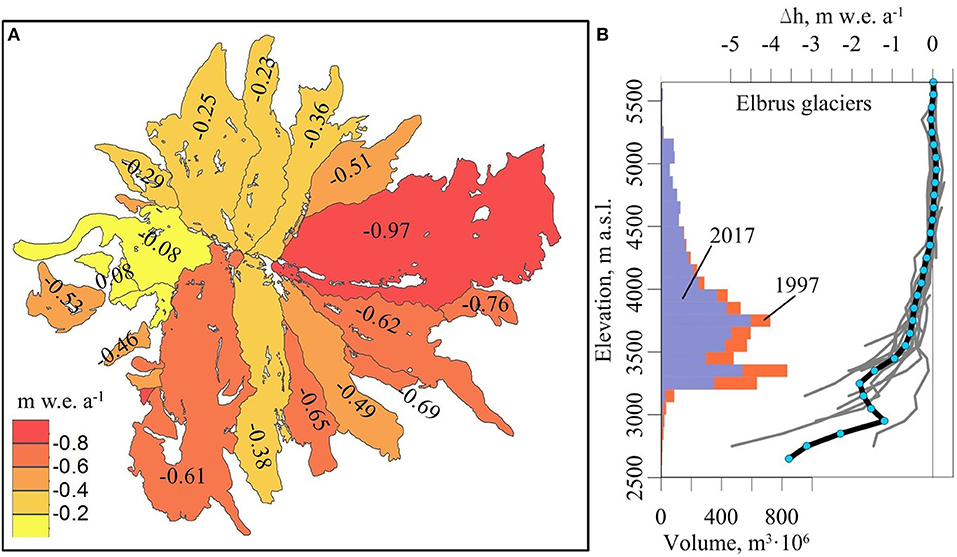
Figure 6. (A) Glacier wide average mass balances. (B) Elbrus glacier volume distribution with elevation in 1997 and 2017, together with average annual elevation change values for 100 m elevation bins (black curve). Elevation change values of 16 individual glaciers (gray lines) are also shown. Similar plots for individual glaciers are provided in Figure S1.
On average the Elbrus glaciers below 4,500 m a.s.l. lost mass. Glaciers on the northern slopes between 4,000 and 4,500 m a.s.l. were characterized by less negative values, while significant thinning rates occurred on the southern glaciers (Figure 6B, Figure S3).
By 2017 Elbrus glaciers lost 22.8% of the total volume they had in 1997. Individual glaciers on average lost 21.4% (σ = 12.4) of ice. Two glaciers on the southern slope, Irikchat and N25, lost the largest percentage of ice: 47.4% (2.4% a−1) and 43.2% (2.2% a−1), respectively. Ice losses from the largest glaciers (Djikiugankez and Bolshoy Azau) were responsible for 57.8% of the total reduction of Elbrus ice volume. Elbrus glaciers lost more than 42% of their total volume below 3,500 m a.s.l., 20% in the 3,500–4,000 m a.s.l. elevation range, and about 8% between 4,000 and 4,500 m a.s.l.
Discussion
The main sources of error in glacier volume estimation involve measurement and interpolation. GPR measurement errors can be reduced partly by improvement of radio wave velocity calculations. However, in practice when dealing with variable conditions and the topography of a mountain glacier, the manipulation of the velocity without exact knowledge of the underlying media properties may introduce additional errors. The problems involved with interpolation of scarce GPR data and prediction of errors are well-known. Several approaches exists, from manual drawing of bedrock topography based on expertize (Fischer and Kuhn, 2013) to more complex interpolation and cross validation techniques (Lapazaran et al., 2016b). Another method involves using a distributed ice thickness model, which can be validated and adjusted with available measurements (Feiger et al., 2018). Such an approach enables ice thickness estimation on parts of a glacier not covered by the GPR survey. Despite relatively good coverage of Elbrus glaciers, there are still some areas without any measurements or reliable bedrock reflections, which may lead to underestimation of the total glacier volume. We compared the estimated ice volume with the results of the ice thickness model based on characteristics of the surface (Kutuzov et al., 2015). The ice thickness was modeled using a GlabTop (Glacier bed topography) approach (Paul and Linsbauer, 2012). Calculated ice thicknesses were calibrated with available GPR data (Kutuzov et al., 2015). There are discrepancies between the spatial distributions of modeled and measured ice thickness, but the total volume of the Elbrus glaciers differs by <3% between the two estimates. It has been shown that ice thickness models work less effectively for ice caps, unlike for valley glaciers (Farinotti et al., 2017). The obtained dataset may be used for ice thickness model validation and future improvements of modeling approaches.
Reliable data on the ice thickness and volume of all the Elbrus glaciers were obtained for the first time. The first ice thickness map of Elbrus was compiled in 1967 and was based on ice cliff and ice crevasse measurements and assumptions on valley shapes. For the Elbrus glaciers, a total volume of 6 km3 and an average thickness of 50 m were estimated (Kravtsova, 1967). Later these estimates were criticized, and it was assumed that the ice thickness and volume of the glaciers were underestimated by a factor of two (Zolotarev, 2009). Knowing the ice volume in 2017 and its changes since 1957, we can conclude that the total glacier volume of Elbrus was about 7.6 km3 in 1957, closer to first estimates of Kravtsova (1967).
According to the results of the International Geophysical Year and the International Hydrological Decade, it was suggested that the thickness of most of the Dzhikiugankez ice field was about 13–25 m, which made it possible to predict rapid glacier disappearance in this area (Tushinskiy, 1968). However, a significant (> 200 m) thickness of the Djikiugankez ice field revealed by the GPR survey contradicts this hypothesis. Moreover, an ice thickness change of 30–40 m was registered in 1997-2017, and according to Zolotarev et al. (2005) the glacier thinned by 30–40 m during the previous period (1957-1997). In the 1950s the ice thickness could have been more than 320 m, much higher than the current maximum thickness of 260 m (Figure 5A). A significant volume of ice is concentrated in this low-lying area of the Elbrus glacier system. Assuming the current thinning rates and ice thickness distribution, the ice flux from the accumulation area may slow and potentially stop completely.
Two bedrock depressions were found in the middle of the Dzhikiugankez ice field (Figure 5A), which may lead to the development of large proglacial lakes in the case of complete ice melt. A similar scenario occurred on the left sector of the Djikiugankez snout during 1957-2005, when the area of proglacial lakes increased 6 fold, with a major expansion occurring in 1997-2001 (Petrakov et al., 2007). The cause was melting of stagnant ice which was detached from the accumulation area by a lava ridge.
The results of the glacier evolution since the mid-nineteenth century were published in a number of papers and summarized in Zolotarev (2009). The glacier mass changes were estimated by geodetic methods for two periods: 1887-1957 and 1957-1997. It was concluded that the glacier recession was gradual and the rate of volume loss decreased in the latter period. The rate of average surface elevation change was −0.29 m w.e. a−1 for the first period and −0.17 m w.e. a−1 between 1957 and 1997 (Zolotarev, 2009). Over those 40 years the total glacier volume decreased by 1.20 ± 0.02 km3, and 45% of this decrease was associated with recession of Dzhykiugankez glacier while 98% of the volume loss occurred below 4,000 m a.s.l. The geodetic balance of Marukh glacier in the western Caucasus was more negative (−0.34 m w.e.a−1) in the 1967-2011 period (Kutuzov et al., 2012).
In a number of publications that discuss changes of the surface area and glacier retreat, Elbrus glaciers were considered to be less sensitive to current climate changes due to their higher elevations and large accumulation areas (Shahgedanova et al., 2014; Tielidze and Wheate, 2018). Our results show that the volume of ice decreases twice as fast as the area, and that Elbrus glaciers are imbalanced (Table 2). The thinning rates of Elbrus glaciers tripled more recently (1997-2017) compared to the 1957-1997 period.
Our results are in agreement with the long-term mass balance measurements on two benchmark glaciers in the Caucasus. The Djankuat glacier, located 21 km east-south-east of Terskol airfield (Figure S1), has the longest mass balance record extending back to 1968 (Shahgedanova et al., 2007), while the mass balance record for the Garabashi outlet glacier on Elbrus extends back to 1983 (Rototaeva et al., 2019). Glacier-wide and cumulative mass balance records are presented in Figure 7, together with the geodetic estimate. Both methods show a good correspondence; Garabashi glacier lost 12.58 m w.e. and 12.92 ± 0.95 m w.e. (−0.63 and −0.65 ± 0.05 m w.e. a−1) estimated by glaciological and geodetic method, respectively. Over the same period the Djankuat glacier lost 12.15 m w.e. (−0.61 m w.e. a−1) according to direct glaciological measurements (www.wgms.ch). The detailed comparisons between geodetic and glaciological mass balances and reanalysis of the long-term mass balance records lie beyond the scope of this paper and will be provided in forthcoming publication.
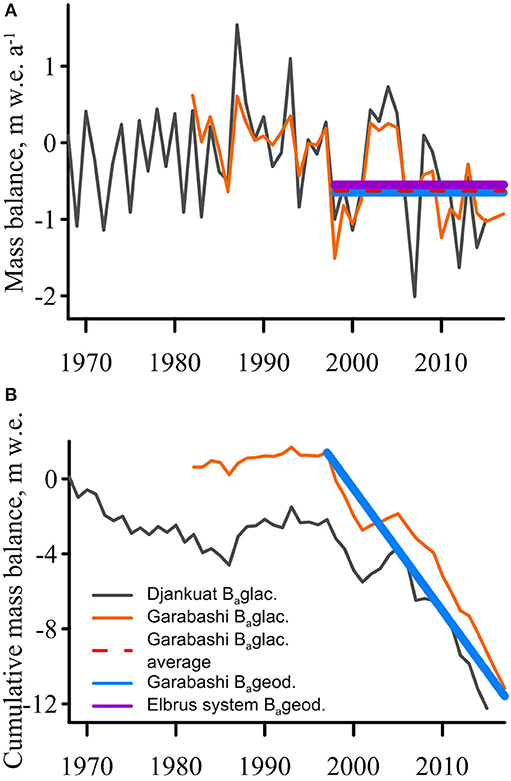
Figure 7. (A) Glacier-wide annual mass balance and (B) cumulative mass balance of the Garabashi and Djankuat glaciers. The geodetic mass balance calculated for Garabashi glacier and the entire Elbrus system as a result of this work is shown. Line thickness corresponds to the error of geodetic estimation.
The calculated geodetic mass balance of Elbrus glaciers accounts for components other than the surface mass balance. Elbrus is a dormant volcano and changes in the geothermal heat flux can potentially contribute to enhanced basal melt. Possibility of basal melting was estimated using the borehole temperature measurements and modeling results on the Elbrus plateau. It was shown that basal melting occurs when glacier ice thickness exceeds 220 m but the value is limited to ~ 0.01 m w.e. a−1 (Mikhalenko et al., 2015). We did not detect any specific features in surface elevation change distribution on Elbrus glaciers which can be attributed to subglacial volcanic and geothermal activity (e.g., Magnússon, 2005) during the studied period.
The trends in mass loss acceleration of glaciers since the end of the twentieth century are characteristic of both the Caucasus and many other mountain regions of Russia (Khromova et al., 2019). The intensified Elbrus glacier recession reflects the pronounced increase in summer temperatures, especially since 1995, which is accompanied by nearly consistent precipitation rates Rototaeva et al., 2019; Tashilova et al., 2019. The average summer temperature in the high-altitude regions of the Caucasus over the past 30 years has increased by 0.5–0.7°C (Toropov et al., 2019). It is possible that the increase in incoming shortwave radiation, noted since the 1980s, also played a significant role in the accelerated mass loss of glaciers in recent years (Toropov et al., 2016). The increasing trend of 10 W m−2 per decade in the shortwave radiation balance in the high-altitude regions of the Caucasus is related to the negative trend of general and lower cloud cover, which in turn is caused by increasing frequency of anticyclones during the warm season (Toropov et al., 2019).
Glacier behavior on different slopes of Mt. Elbrus was not homogenous. The most significant mass loss of −0.83 m w.e. a−1 was documented for the eastern (E) sector of Mt. Elbrus (Figure S3). The mass loss rate in the southern (S) sector was −0.54 m w.e. a−1, in the northern (N) sector it was −0.27 m w.e. a−1, and in the western sector (W) it was −0.12 m w.e. a−1. A similar situation was reported by Zolotarev (2009) for the periods of 1887-1957 and 1957-1987. During the earlier period the mean balance of glaciers in the S and E sectors was 50% more negative in comparison to the N and W sectors, while during the later period the mass balances in the N and W sectors were slightly positive. Significant spatial differences in mass loss rates can be explained primarily by aspect and hypsography. South-oriented glaciers tend to recede more rapidly in mountains located at similar latitudes, such as in the Tien Shan (Petrakov et al., 2016; Wang et al., 2016). This might be due to more pronounced effects of shortwave radiation changes (Toropov et al., 2016) on southern slopes. Large portions of the south and east oriented glaciers on Elbrus are located at lower elevations; about 50% of the Djikiugankez and 45% of the Bolshoi Azau glacier area are below 3,700 m a.s.l. For Ulluchiran, the largest glacier on the northern slope, 34% of the surface area is below 3,700 m a.s.l., as is 23% of the Kyukyurtli glacier. Glaciers in the S and especially in the E sectors are characterized by lower slopes below 4,000 m in comparison with glaciers in the N and W sectors. Even a small rise of equilibrium line altitude (ELA) at gentle slopes leads to a significant decrease in glacier accumulation area ratio (AAR) and results in higher sensitivity of such glaciers to climate change. Furthermore, glaciers in the W sector are affected by avalanches and thus are partially debris covered, while debris cover on glaciers in other sectors is almost absent, with the exception of Ulluchiran.
Increasing rates of glacier mass balance declines have been reported in other mountain regions of Eurasia. Significant mass balance changes were observed for Tien Shan mountain glaciers, where total area and mass decreased by 18 ± 6 and 27 ± 15%, respectively from 1961 to 2012 and glacier mass balance decreased at an average rate of −0.33 ± 0.18 m w.e. a−1 (Farinotti et al., 2015). For the 2000-2016 period the average glacier mass balance in the Tien Shan changed by −0.29 ± 0.21 m w.e. a−1 and more negative rates were estimated for the glaciers in Bhutan (−0.43 ± 0.26 m w.e. a−1) and the Nyainqentanglha mountains of Tibet (−0.63 ± 0.26 m w.e. a−1) (Brun et al., 2017). Although the surface mass balance for six glaciers in the European Alps were in steady-state conditions from 1962 to 1982, average mass balance changes of −0.85 m w.e. a−1 in 1983–2002 and −1.63 m w.e. a−1 in 2003-2013 were observed (Vincent et al., 2017). These rates correspond well with the accelerating glacier mass loss observed at Mt. Elbrus in 1997-2017 compared to previous periods. Mont-Blanc glaciers lost 1 ± 0.37 m w.e. a−1 between 2000 and 2014 (Berthier et al., 2016). On average, Elbrus glaciers were characterized by less negative mass balance loss then those in the Alps; however, some glaciers (e.g., Djikiugankez) were losing mass at a comparable rate (0.97 ± 0.07 m w.e. a−1) in 1997-2017. Area-averaged mass balance loss of the Elbrus glaciers (−0.55 ± 0.04 m w.e. a−1 in 1997-2017) is comparable with the mean annual loss rate of −0.66 ± 0.55 m w.e. a−1 that can be calculated for the same period using data reported by Zemp et al. (2019) for the Caucasus and Middle East region. Later work is based on extrapolation of glaciological and geodetic observations for the Caucasus region. Two long-term observational records from Djankuat and Garabashi glaciers were supplemented by new geodetic measurements over 52% of the glaciated area between 2000 and 2017 using ASTER DEMs, although the reported uncertainties in geodetic estimates are quite large (Zemp et al., 2019).
Conclusions
The combined analyses of the ice volume distribution of glaciers on Mt. Elbrus show that the total volume of Mt. Elbrus glaciers was 5.03 ± 0.85 km3 of ice in 2017 and a large proportion of ice lies below 4,000 m a.s.l. The rate of mass balance decrease of the Elbrus glaciers was −0.55 ± 0.04 m w.e. a−1 from 1997 to 2017, triple that of the 1957-1997 period.
The geodetic estimates are in agreement with the long-term mass balance measurements on the Garabashi outlet glacier on Elbrus which lost 12.58 m w.e. and 12.92 ± 0.95 m w.e. (−0.63 and −0.65 ± 0.05 m w.e. a−1) between 1997 and 2017 estimated by glaciological and geodetic method, respectively.
The most significant mass loss of −0.83 m w.e. a−1 was documented for the eastern facing glaciers of Mt. Elbrus. The mass loss rate in the southern slopes was −0.54 m w.e. a−1, in the northern sector it was −0.27 m w.e. a−1, and in the western sector it was −0.12 m w.e. a−1.
In relative terms the glaciers on Elbrus lost volume twice as fast than can be assumed from areal changes alone. Elbrus glaciers lost 29% of their volume below 4,000 m, where 68% of the total ice volume was concentrated in 2017. Two glaciers (Irikchat and N25) may disappear in the near future as they are losing mass over their entire areas and already have lost more than 40% of their combined volume in the 1997-2017 period.
The intensified Elbrus glacier mass loss likely occurred due to increase in summer temperatures, especially since 1995 accompanied by nearly consistent precipitation rates while an increase in shortwave radiation due to reduced cloud cover also contributed to acceleration in glacier recession.
Results of this work can be used in a number of future studies, including hydrological modeling of future runoff changes, validation and improvement of existing ice thickness modeling approaches, prediction of future proglacial lake growth, and reanalysis of the long term mass balance records of the Garabashi benchmark glacier.
Author Contributions
SK interpreted all the results and wrote the paper with contributions from all other co-authors. IL analyzed the GPR data. AS performed all the DEM analysis with inputs from IL and SK. SK, GN, and IL drew the glacier outlines. GN and DP contributed to the discussion.
Funding
This study was supported by RFBR grant (no. 18-05-00838). Glacier volume estimation and ground GPR measurements were funded by the RSF grant (project no. 17-17-01270). AS work was funded within the state assignment scientific theme (no. 0148-2019-0004).
Conflict of Interest Statement
The authors declare that the research was conducted in the absence of any commercial or financial relationships that could be construed as a potential conflict of interest.
The handling editor declared a past co-authorship with the authors SK and IL.
Acknowledgments
The Pléiades stereo-pair used in this study was provided by the Pléiades Glacier Observatory initiative of the French Space Agency (CNES). The 1997 DEM was provided by E. Zolotarev and E. Kharkovets from the laboratory of Aerocosmic methods, Faculty of Geography, Lomonosov Moscow State University. We are very grateful to HELIACTION Company and its pilots A. Boldyrev and A. Davydov. We thank Dr. M. E. Davis for English language editing.
Supplementary Material
The Supplementary Material for this article can be found online at: https://www.frontiersin.org/articles/10.3389/feart.2019.00153/full#supplementary-material
Figure S1. Imagery used in this study. (a) SPOT 7 satellite image acquired 20 August 2016. The location of Elbrus is shown by the red box and the location of Djankuat glacier is shown by the blue box. (b) Mosaic of aerial images obtained during the aerial survey of Elbrus glaciers 8 September 1997. (c) Pléiades image acquired 8 September 2017.
Figure S2. Single spherical semivariogramm model for the DEM1997 and DEM2017 difference over the stable terrain.
Figure S3. Elbrus glacier volume distributions with elevation in 1997 and 2017, together with average annual elevation change values for 100 m elevation bins. Glaciers arranged according to their aspect.
Figure S4. (a) Area and (b) surface elevation changes in the western sector of Elbrus. The elevation increase on glacier N316* is marked by an arrow.
Table S1. List of corrections made to the 1997 DEM and standard deviations (σ) of Δh values over the stable terrain.
References
Andreassen, L. M., Huss, M., Melvold, K., Elvehøy, H., and Winsvold, S. H. (2015). Ice thickness measurements and volume estimates for glaciers in Norway. J. Glaciol. 61, 763–775. doi: 10.3189/2015JoG14J161
Azam, M. F., Wagnon, P., Berthier, E., Vincent, C., Fujita, K., and Katgel, J. S. (2018). Review of the status and mass changes of Himalayan-Karakoram glaciers. J. Glaciol. 64, 61–74. doi: 10.1017/jog.2017.86
Bahr, D. B., Pfeffer, W. T., and Kaser, G. (2015). A review of volume-area scaling of glaciers. Rev. Geophys. 53, 95–140. doi: 10.1002/2014RG000470
Belart, J. M. C., Berthier, E., Magnússon, E., Anderson, L. S., Pálsson, F., Thorsteinsson, T., et al. (2017). Winter mass balance of Drangajökull ice cap (NW Iceland) derived from satellite sub-meter stereo images. Cryosphere 11, 1501–1517. doi: 10.5194/tc-11-1501-2017
Berthier, E., Cabot, V., Vincent, C., and Six, D. (2016). Decadal region-wide and glacier-wide mass balances derived from multi-temporal ASTER satellite digital elevation models. Validation over the Mont-Blanc Area. Front. Earth Sci. 4:63. doi: 10.3389/feart.2016.00063
Berthier, E., Vincent, C., Magnússon, E., Gunnlaugsson, P., Pitte, P., Le Meur, E., et al. (2014). Glacier topography and elevation changes derived from Pléiades sub-meter stereo images. Cryosphere 8, 2275–2291. doi: 10.5194/tc-8-2275-2014
Brun, F., Berthier, E., Wagnon, P., Kääb, A., and Treichler, D. (2017). A spatially resolved estimate of High Mountain Asia glacier mass balances from 2000 to 2016. Nat. Geosci. 10, 668–673. doi: 10.1038/ngeo2999
Dowdeswell, J. A., and Evans, S. (2004). Investigations of the form and flow of ice sheets and glaciers using radio-echo sounding. Reports Prog. Phys. 67, 1821–1861. doi: 10.1088/0034-4885/67/10/R03
Farinotti, D., Brinkerhoff, D. J., Clarke, G. K. C., Fürst, J. J., Frey, H., Gantayat, P., et al. (2017). How accurate are estimates of glacier ice thickness? Results from ITMIX, the Ice Thickness Models Intercomparison eXperiment. Cryosphtre 11, 949–970. doi: 10.5194/tc-11-949-2017
Farinotti, D., Huss, M., Fürst, J. J., Landmann, J., Machguth, H., Maussion, F., et al. (2019). A consensus estimate for the ice thickness distribution of all glaciers on Earth. Nat. Geosci. 12, 168–173. doi: 10.1038/s41561-019-0300-3
Farinotti, D., Longuevergne, L., Moholdt, G., Duethmann, D., Mölg, T., Bolch, T., et al. (2015). Substantial glacier mass loss in the Tien Shan over the past 50 years. Nat. Geosci. 8, 716–722. doi: 10.1038/ngeo2513
Feiger, N., Huss, M., Leinss, S., Sold, L., and Farinotti, D. (2018). The bedrock topography of Gries- and Findelengletscher. Geogr. Helv. 73, 1–9. doi: 10.5194/gh-73-1-2018
Fischer, A., and Kuhn, M. (2013). Ground-penetrating radar measurements of 64 Austrian glaciers between 1995 and 2010. Ann. Glaciol. 54, 179–188. doi: 10.3189/2013AoG64A108
Fischer, M., Huss, M., and Hoelzle, M. (2015). Surface elevation and mass changes of all Swiss glaciers 1980-2010. Cryosphere 9, 525–540. doi: 10.5194/tc-9-525-2015
Gardner, A. S., Moholdt, G., Cogley, J. G., Wouters, B., Arendt, A. A., Wahr, J., et al. (2013). A reconciled estimate of glacier contributions to sea level rise: 2003 to 2009. Science 340, 852–857. doi: 10.1126/science.1234532
Gärtner-Roer, I., Naegeli, K., Huss, M., Knecht, T., Machguth, H., and Zemp, M. (2014). A database of worldwide glacier thickness observations. Glob. Planet. Change 122, 330–344. doi: 10.1016/j.gloplacha.2014.09.003
Holobâcǎ, I. H. (2013). Glacier Mapper - a new method designed to assess change in mountain glaciers. Int. J. Remote Sens. 34, 8475–8490. doi: 10.1080/01431161.2013.843804
Huss, M. (2013). Density assumptions for converting geodetic glacier volume change to mass change. Cryosphere 7, 877–887. doi: 10.5194/tc-7-877-2013
Huss, M., and Hock, R. (2018). Global-scale hydrological response to future glacier mass loss. Nat. Clim. Change 8, 135–140. doi: 10.1038/s41558-017-0049-x
Khromova, T., Nosenko, G., Nikitin, S., Muraviev, A., Popova, V., Chernova, L., et al. (2019). Changes in the mountain glaciers of continental Russia during the twentieth to twenty-first centuries. Reg. Environ. Change 19, 1229–1247. doi: 10.1007/s10113-018-1446-z
Kravtsova, V. I. (1967). Atlas of the Elbrus glaciers. Maps of ice thickness. Mater. Glyatsiol. Issled. Data Glaciol. Stud. 13, 151–157.
Krivoruchko, K. (2012). Empirical Bayesian Kriging Implemented in ArcGIS Geostatistical Analyst. ArcUser, 6–10. Available online at: http://www.esri.com/news/arcuser/1012/files/ebk.pdf
Kulnitsky, L. M., Gofman, P. A., and Tokarev, M. Y. (2000). Matematicheskaya obrabotka dannykh georadiolokatsii i systema RADEXPRO (Mathematical processing of georadar data and RADEXPRO system). Razv. Okhrana Nedr 3, 6–11.
Kutuzov, S. S., Lavrentiev, I. I., Macheret, Y. Y., and Petrakov, D. A. (2012). Changes of marukh glacier from 1945 to 2011. Ice Snow 117, 123–127. doi: 10.15356/2076-6734-2012-1-123-127
Kutuzov, S. S., Lavrentiev, I. I., Vasilenko, E. V., Macheret, Y. Y., Petrakov, D. A., and Popov, G. V. (2015). Estimation of the Greater Caucasus glaciers volume, using radio-echo sounding data and modelling. Earths Cryosph. 19, 78–88.
Lapazaran, J. J., Otero, J., Martin-Español, A., and Navarro, F. J. (2016a). On the errors involved in ice-thickness estimates I: ground-penetrating radar measurement errors. J. Glaciol. 62, 1008–1020. doi: 10.1017/jog.2016.93
Lapazaran, J. J., Otero, J., Martín-Español, A., and Navarro, F. J. (2016b). On the errors involved in ice-thickness estimates II: errors in digital elevation models of ice thickness. J. Glaciol. 62, 1021–1029. doi: 10.1017/jog.2016.94
Lavrentiev, I. I., Mikhalenko, V. N., and Kutuzov, S. S. (2010). Tolshina l'da i podledny rel'ef zapadnogo lednikovogo plato Elbrusa (Ice thickness and subglacial relief of the Western ice plateau of Elbrus). Ice Snow 2, 12–18.
Macheret, Y. Y., Berikashvili, V. S., Vasilenko, E. V., and Sokolov, V. G. (2006). Shirokopolosniy impulsniy radar dlya zondirovaniya lednikov s opticheskim kanalom sinkhronizatsii i tsifrovoy obrabatkoy signalov (Broadband pulse radar for sounding glaciers with optical synchronization channel and digital signal processing). Sens. Syst. 12, 2–8.
Magnússon, E. (2005). Volume changes of Vatnajökull ice cap, Iceland, due to surface mass balance, ice flow, and subglacial melting at geothermal areas. Geophys. Res. Lett. 32:L05504. doi: 10.1029/2004GL021615
Marti, R., Gascoin, S., Berthier, E., de Pinel, M., Houet, T., and Laffly, D. (2016). Mapping snow depth in open alpine terrain from stereo satellite imagery. Cryosphere 10, 1361–1380. doi: 10.5194/tc-10-1361-2016
Martín-Español, A., Vasilenko, E. V., Navarro, F. J., Otero, J., Lapazaran, J. J., Lavrentiev, I., et al. (2013). Radio-echo sounding and ice volume estimates of western Nordenskiöld Land glaciers. Svalbard. Ann. Glaciol. 54, 211–217. doi: 10.3189/2013AoG64A109
Mikhalenko, V., Sokratov, S., Kutuzov, S., Ginot, P., Legrand, M., Preunkert, S., et al. (2015). Investigation of a deep ice core from the Elbrus western plateau, the Caucasus, Russia. Cryosphere 9, 2253–2270. doi: 10.5194/tc-9-2253-2015
Mikhalenko, V. N., Kutuzov, S. S., Lavrantiev, I. I., Toropov, P. A., Abramov, A. A., and Polyukhov, A. A. (2017). Glaciological studies of the Institute of Geography, RAS, on the Elbrus Mount in 2017. Ice Snow 57:292. doi: 10.15356/2076-6734-2017-3-292
Navarro, F., and Eisen, O. (2009). “Ground-penetrating radar in glaciological applications,” in Remote Sensing of Glaciers, eds P. Pellikka and W. G. Rees (London: Taylor & Francis), 195–229. doi: 10.1201/b10155-12
Nuth, C., and Kääb (2011). Co-registration and bias corrections of satellite elevation data sets for quantifying glacier thickness change. Cryosphere 5, 271–290. doi: 10.5194/tc-5-271-2011
Paul, F., Barrand, N. E., Baumann, S., Berthier, E., Bolch, T., Casey, K., et al. (2013). On the accuracy of glacier outlines derived from remote-sensing data. Ann. Glaciol. 54, 171–182. doi: 10.3189/2013AoG63A296
Paul, F., Escher-Vetter, H., and Machguth, H. (2009). Comparison of mass balances for Vernagtferner, Oetzal Alps, as obtained from direct measurements and distributed modeling. Ann. Glaciol. 50, 169–177. doi: 10.3189/172756409787769582
Paul, F., and Linsbauer, A. (2012). Modeling of glacier bed topography from glacier outlines, central branch lines, and a DEM. Int. J. Geogr. Inf. Sci. 26, 1173–1190. doi: 10.1080/13658816.2011.627859
Perov, V., Chernomorets, S., Budarina, O., Savernyuk, E., and Leontyeva, T. (2017). Debris flow hazards for mountain regions of Russia: regional features and key events. Nat. Hazards 88, 199–235. doi: 10.1007/s11069-017-2841-3
Petrakov, D., Shpuntova, A., Aleinikov, A., Kääb, A., Kutuzov, S., Lavrentiev, I., et al. (2016). Accelerated glacier shrinkage in the Ak-Shyirak massif, Inner Tien Shan, during 2003-2013. Sci. Total Environ. 562, 364–378. doi: 10.1016/j.scitotenv.2016.03.162
Petrakov, D. A., Krylenko, I. V., Chernomorets, S. S., Krylenko, I. N., Tutubalina, O. V., and Shakhmina, M. S. (2007). “Debris flow hazard of glacial lakes in the Central Caucasus,” in 4th International Conference on Debris-Flow Hazards Mitigation (Chengdu: Millpress, Rotterdam), 703–714.
Podozerskiy, K. I. (1911). Ledniki Kavakzskogo Khrebta (Glaciers of the Caucasus Range). Tiflis: Typography K.P Kozlovskogo.
Robson, B., Nuth, C., Nielsen, P., Girod, L., and Hendrickx, M. (2018). Spatial variability in patterns of glacier change across the Manaslu Range, Central Himalaya. Front. Earth Sci. 6:12. doi: 10.3389/feart.2018.00012
Rolstad, C., Haug, T., and Denby, B. (2009). Spatially integrated geodetic glacier mass balance and its uncertainty based on geostatistical analysis: application to the western Svartisen ice cap, Norway.J. Glaciol. 55, 666–680. doi: 10.3189/002214309789470950
Rototaeva, O. V., Nosenko, G. A., Kerimov, A. M., Kutuzov, S. S., Lavrentiev, I. I., Nikitin, S. A., et al. (2019). Mass balance changes of the Garabashy glacier, Mount Elbrus at the turn of the 20th and 21st centuries. Ice Snow 59, 5–20. doi: 10.15356/2076-6734-2019-1-5-20
Rutishauser, A., Maurer, H., and Bauder, A. (2016). Helicopter-borne ground-penetrating radar investigations on temperate alpine glaciers: a comparison of different systems and their abilities for bedrock mapping. Geophysics 81, WA119–WA129. doi: 10.1190/geo2015-0144.1
Shahgedanova, M., Nosenko, G., Kutuzov, S., Rototaeva, O., and Khromova, T. (2014). Deglaciation of the Caucasus Mountains, Russia/Georgia, in the 21st century observed with ASTER satellite imagery and aerial photography. Cryosphere 8, 2367–2379. doi: 10.5194/tc-8-2367-2014
Shahgedanova, M., Popovnin, V., Aleynikov, A., Petrakov, D., and Stokes, C. R. (2007). Long-term change, interannual and intra-seasonal variability in climate and glacier mass balance in the central Greater Caucasus, Russia. Ann. Glaciol. 46, 355–361. doi: 10.3189/172756407782871323
Shean, D. E., Alexandrov, O., Moratto, Z. M., Smith, B. E., Joughin, I. R., Porter, C., et al. (2016). An automated, open-source pipeline for mass production of digital elevation models (DEMs) from very-high-resolution commercial stereo satellite imagery. ISPRS J. Photogram. Remote Sens. 116, 101–117. doi: 10.1016/J.ISPRSJPRS.2016.03.012
Sold, L., Huss, M., Machguth, H., Joerg, P. C., Vieli, G. L., Linsbauer, A., et al. (2016). Mass Balance Re-analysis of Findelengletscher, Switzerland; Benefits of Extensive Snow Accumulation Measurements. Front. Earth Sci.4:18. doi: 10.3389/feart.2016.00018
Solomina, O., Bushueva, I., Dolgova, E., Jomelli, V., Alexandrin, M., Mikhalenko, V., et al. (2016). Glacier variations in the Northern Caucasus compared to climatic reconstructions over the past millennium. Glob. Planet. Change 140, 28–58. doi: 10.1016/j.gloplacha.2016.02.008
Tashilova, A., Ashabokov, B., Kesheva, L., and Teunova, N. (2019). Analysis of climate change in the caucasus region: end of the 20th–beginning of the 21st century. Climate 7:11. doi: 10.3390/cli7010011
Tielidze, L. G., and Wheate, R. D. (2018). The greater caucasus glacier inventory (Russia, Georgia and Azerbaijan). Cryosphere 12, 81–94. doi: 10.5194/tc-12-81-2018
Toropov, P. A., Aleshina, M. A., and Grachev, A. M. (2019). Large-scale climatic factors driving glacier recession in the Greater Caucasus, 20th-21st century. Int. J. Climatol. 6101. doi: 10.1002/joc.6101
Toropov, P. A., Mikhalenko, V. N., Kutuzov, S. S., Morozova, P. A., and Shestakova, A. A. (2016). Temperature and radiation regime of glaciers on slopes of the Mount Elbrus in the ablation period over last 65 years. Ice Snow 1, 5–19. doi: 10.15356/2076-6734-2016-1-5-19
Tushinskiy, G. K. (1968). Oledenenie Elbrusa (Elbrus Glaciation). ed G. K. Tushinskiy. Moscow: Moscow State University press.
Vasilenko, E. V., Machío, F., Lapazaran, J. J., Navarro, F. J., and Frolovskiy, K. (2011). A compact lightweight multipurpose ground-penetrating radar for glaciological applications. J. Glaciol. 57, 1113–1118. doi: 10.3189/002214311798843430
Vaughan, D., Comiso, J., Allison, I., Carrasco, J., Kaser, G., Kwok, R., et al. (2013). “Observations: Cryosphere,” in Climate Change 2013: The Physical Science Basis. Contribution of Working Group I to the Fifth Assessment Report of the Intergovernmental Panel on Climate Change, eds T. F. Stocker, D. Qin, G.-K. Plattner, S. K. M. Tignor, J. Allen, A. Boschung, et al. (Cambridge; New York, NY: Cambridge University Press, 317–382.
Vincent, C., Fischer, A., Mayer, C., Bauder, A., Galos, S. P., Funk, M., et al. (2017). Common climatic signal from glaciers in the European Alps over the last 50 years. Geophys. Res. Lett. 44, 1376–1383. doi: 10.1002/2016GL072094
Wang, P., Li, Z., Wang, W., Li, H., Wu, L., Huai, B., et al. (2016). Comparison of changes in glacier area and thickness on the northern and southern slopes of Mt. Bogda, eastern Tianshan Mountains. J. Appl. Geophys. 132, 164–173. doi: 10.1016/j.jappgeo.2016.07.009
Zemp, M., Huss, M., Thibert, E., Eckert, N., McNabb, R., Huber, J., et al. (2019). Global glacier mass changes and their contributions to sea-level rise from 1961 to 2016. Nature 568, 382–386. doi: 10.1038/s41586-019-1071-0
Zemp, M., Thibert, E., Huss, M., Stumm, D., Denby, C. R., Nuth, C., et al. (2013). The Cryosphere Reanalysing glacier mass balance measurement series. Cryosphere 7, 1227–1245. doi: 10.5194/tc-7-1227-2013
Zhou, Y., Hu, J., Li, Z., Li, J., Zhao, R., and Ding, X. (2019). Quantifying glacier mass change and its contribution to lake growths in central Kunlun during 2000–2015 from multi-source remote sensing data. J. Hydrol. 570, 38–50. doi: 10.1016/j.jhydrol.2019.01.007
Zolotarev, E. A. (2009). Evolucia Oledenenia Elbrusa (Evolution of Elbrus Glaciation). Moscow: Nauchnii mir.
Zolotarev, E. A., Aleynikov, A. A., and Kharkovets, E. G. (2005). Glaciers recession on Elbrus in XX century. Mater. Glyatsiol. Issled. Data Glaciol. Stud. 98, 162–166.
Zolotarev, E. A., and Kharkovets, E. G. (2000). Glaciation of Elbrus in the end of XX century (digital orthophoto map of Elbrus for 1997). Data Glaciol. Stud. 89, 175–181.
Keywords: mass change, ice thickness, GPR, geodetic method, Caucasus
Citation: Kutuzov S, Lavrentiev I, Smirnov A, Nosenko G and Petrakov D (2019) Volume Changes of Elbrus Glaciers From 1997 to 2017. Front. Earth Sci. 7:153. doi: 10.3389/feart.2019.00153
Received: 17 January 2019; Accepted: 03 June 2019;
Published: 20 June 2019.
Edited by:
Matthias Huss, ETH Zürich, SwitzerlandReviewed by:
Joaquín M. C. Belart, University of Iceland, IcelandTino Pieczonka, Dresden University of Technology, Germany
Copyright © 2019 Kutuzov, Lavrentiev, Smirnov, Nosenko and Petrakov. This is an open-access article distributed under the terms of the Creative Commons Attribution License (CC BY). The use, distribution or reproduction in other forums is permitted, provided the original author(s) and the copyright owner(s) are credited and that the original publication in this journal is cited, in accordance with accepted academic practice. No use, distribution or reproduction is permitted which does not comply with these terms.
*Correspondence: Stanislav Kutuzov, kutuzov@igras.ru