Abstract
Oxidative stress (OS) in the airway epithelium is associated with inflammation, cell damage, and mitochondrial dysfunction that may initiate or worsen respiratory disease. Redox regulation maintains the equilibrium of pro-oxidant/antioxidant reactions but can be disturbed by environmental exposures. The mechanism(s) underlying the induction and impact of OS on airway epithelium and how these influences on respiratory disease is poorly understood. The aim of this study was to develop a stress response model in primary human nasal epithelial cells (NECs) grown at the air-liquid interface (ALI) into a well-differentiated epithelium and to use this model to investigate the mechanisms underlying OS. Hydrogen peroxide (H2O2) was used to induce acute OS and the responses were measured with trans epithelial electrical resistance (TEER), membrane permeability, cell death (LDH release), mitochondrial reactive oxygen species (mtROS) generation, redox status (GSH/GSSG ratio), cellular ATP, and signaling pathways (SIRT1, FOXO3, p53, p21, PINK1, PARKIN, NRF2). Following 25 mM (sensitive) or 50mM (resistant) H2O2 exposure, cell integrity decreased (p<0.05), GSH/GSSG ratio reduced (p<0.05), and ATP production declined by 83% (p<0.05) in the sensitive and 55% (p<0.05) in the resistant group; mtROS production increased 3.4-fold (p<0.001). Significant inter-individual differences between healthy humans with regards to susceptibility to OS, and differential activation of various pathways (FOXO3, PARKIN) were observed. These intra-individual differences in susceptibility to OS may be attributed to resistant individuals having more mitochondria or greater mitochondrial function.
Keywords
Oxidative stress, Airway epithelium, Air-liquid interface culture, Signaling pathways, Mitochondria
Introduction
Oxidative stress (OS) arises when there is an imbalance between oxidative stressors and the ability of cells to detoxify oxidants or to repair oxidant-induced damage [1]. Oxidants can be generated from endogenous or exogenous sources. An endogenous source is respiration in mitochondrial electron transport; exogenous sources include environmental stressors [2]. The overall oxidant – antioxidant status is mediated and counteracted by enzymatic and non-enzymatic antioxidant defense systems including superoxide dismutase (SOD), catalase (CAT) and glutathione peroxidase (GPx) to maintain physiological homeostasis [3]. The oxidation-reduction (redox) reactions are regulated by redox signaling and redox control. The maintenance of a redox balance is named redox homeostasis [4].
Since the respiratory epithelium is directly exposed to the ambient environment, they are at high risk of OS. Antioxidant defense and OS play a critical role in various respiratory disorders such as asthma, chronic obstructive pulmonary disease (COPD), idiopathic pulmonary fibrosis (IPF), ataxia-telangiectasia (A-T) and respiratory infections. COPD is the third most common cause of death worldwide. The main risk factors of COPD are tobacco smoking and air pollution [5]. COPD is linked to increased mitochondrial reactive oxygen species (mtROS) production, reduced numbers of mitochondria and decreased intracellular antioxidants [6]. High OS levels were recorded in the lung and the breath of patients with COPD, partially explained by the multiple oxidants in cigarette smoke, but also results from release of oxidants from activated inflammatory cells such as neutrophils and macrophages. Even when patients stopped smoking OS persists [7].
Mitochondria are not only a powerhouse within the cell, but also involved in cell survival [8]. Most of the cellular reactive oxygen species (ROS) are generated by mitochondria. The main contributor to the oxidative damage is hydrogen peroxide (H2O2), which leaks from mitochondria. The accumulation of oxidative damage may lead to mitochondrial dysfunction [9]. Mitochondrial homeostasis involves the mitochondrial redox system, mitophagy, biogenesis and oxidative phosphorylation to maintain the health of mitochondria. Cellular homeostasis is also regulated through the membrane potential (?Ψm), producing acetyl coenzyme A by mitophagy. Mitochondrial function can be disrupted by multiple forms of endogenous and exogenous stress, which trigger an inflammatory response, increasing ROS production, and decreasing ?Ψm [9]. Mitophagy is a selective degradation of damaged mitochondria. Mitochondrial fission and fusion play the main role of selecting mitochondria for mitophagy. Substantial loss of ?Ψm promotes fission leading to mitophagy which may result in removal of excess mtROS, mitochondrial DNA (mtDNA) and other associated factors. The mitochondrial stress markers PINK1 and PARKIN are increased in patients with COPD [9]. Compared with wild-type mice, both Pink1 and Parkin knockout (KO) mice showed an increase in ROS levels and a decline in mitochondria function. Thus, Pink1 and Parkin seems to play an important role in removing mtROS [10,11].
OS activates multiple genes including sirtuin family members (SIRTs), they are closely associated with mitochondrial integrity, stress tolerance mediation and inflammation [8]. SIRT1 is an NAD+-dependent protein deacetylase which is involved in multiple molecular pathways including stress resistance, inflammation, DNA repair, apoptosis, mitochondrial regulation, and longevity [12]. One of key functions of SIRT1 is modulating mitochondrial biogenesis and functions through nuclear to mitochondrial signaling pathways [13]. SIRT1 can be activated by OS and plays an important role in regulating multiple molecular pathways including stress resistance, forkhead box O3 (FOXO3) and p53 [14]; and antioxidant responses, nuclear factor erythroid 2-related factor 2 (NRF2) [15].
The airway epithelium provides the first line of innate immune protection to defend against environmental stressors and infections [16]. OS in the airway epithelium induces inflammation, cell damage, and mitochondrial dysfunction that may initiate or worsen respiratory diseases such as acute lung injury, asthma, and COPD [17,18]. Appropriate cellular and mitochondrial stress responses are critical for maintaining tissue homeostasis, integrity, and function. The mechanism underlining the induction and impact of OS on airway epithelium remains unclear.
In the present study, we collected primary human nasal epithelial cells, grew them into well-differentiated epithelium in air-liquid interface (ALI) cultures, and used this model to investigate the effect of OS on airway epithelium as it provides a physiological relevant model of the human upper airways [19]. The nose is the point of first contact with environmental exposures, it is therefore important to understand the impact of OS on the nasal epithelium.
Materials and Methods
Cell collection
Healthy non-atopic, non-smoking adult volunteers between the ages of 18 and 65 years were recruited, and primary human nasal epithelial cells (NECs) were collected using Rhino-Pro Nasal Curette (Arlington Scientific, UT, USA). (Ethics approval: No.#UQ2017000520; HREC61894; UQ2020001742).
The nasal scrapings were taken from the inferior turbinate in each nostril by gently pressing the cupped tip on mucosal surface and moving outward to collect sample [20]. Cells were then seeded onto collagen coated 24-well plates. Cells were grown as submerged cultures in PneumaCult™-Ex Medium (STEMCELL Technologies, BC, Canada) for approximately two weeks until they reached passage 2 and were cryopreserved in FBS with 10% DMSO.
Air-liquid interface culture
Cells were seeded (4*104 cells/insert) onto 6.5 mm Transwell® with 0.4 μm Pore Polyester Membrane Inserts (Corning, NY, USA) in 24 well plates. After approximately three days of cell division, the cells were “air-lifted”, a process which involved removing media from the apical chamber and replacing the media in the basal chamber with PneumaCult-ALI Medium (STEMCELL Technologies, BC, Canada). Cells were maintained in ALI conditions for at least three weeks until beating cilia were observed under light microscopy and a high trans epithelial electrical resistance (TEER) was established. A successfully differentiated ALI culture contains basal cells, tight junctions, secretory cells (primarily mucus-secreting goblet cells) and ciliated epithelial cells (Figure S1).
Establishing a stress response model
The oxidant H2O2 was used to induce OS in the airway epithelium. Fully differentiated NECs were exposed to various concentrations of H2O2 (0, 10, 25, 50, 100 mM) in Hanks’ Balanced Salt solution (HBSS; Sigma-Aldrich, MI, USA) in the apical chamber for one hour as an acute exposure.
Trans-epithelial electric resistance
TEER is a widely accepted quantitative measurement to examine the integrity of tight junction dynamics in epithelial cell culture at ALI and can be performed in real-time without causing cell damage [21]. TEER value was measured using the EVOM2™ meter (World Precision Instruments, FL, USA) as per the manufacturers’ instructions at 0, 1, 4 and 24-hour time points relative to H2O2 exposure and the values were recorded as ohmic resistance.
Epithelial Permeability
A permeability assay was performed as per the method of Turksen [22]. In short, a 100 µl volume of media with 0.5 mg/ml FITC-dextran was added to the apical chamber and incubated for 2 hours at 37? with 5% CO2 at 0, 1, 4 and 24-hour time point relative to H2O2 exposure. The basal media was collected, and the fluorescence measured (excitation of 490 nm, emission of 520 nm) by CLARIOstar (BMG LABTECH, Offenburg, Germany) alongside FITC-dextran standards to calculate the amount of FITC-dextran that had migrated through the epithelium and the transwell during the incubation.
Cell death
A LDH release assay (CytoTox 96® Non-Radioactive Cytotoxicity Assay; Promega Corporation, WI, USA) was used to evaluate the level of cell damage or death. A 100 µl volume of HBSS was placed into the apical surface of differentiated epithelium for 10 minutes, and this HBSS was collected at 0, 1, 4 and 24-hour time point relative to H2O2 exposure and the amount of LDH secretion was quantified as per the manufacturer’s instructions.
Mitochondrial ROS
Red mitochondrial superoxide indicator (MitoSOX™, Invitrogen™, CA, USA) was used to detect the generation of mtROS and the fluorescence was determined by Zeiss Confocal LSM 710 (ZEISS, Oberkochen, Germany). Briefly, a 100 µl volume of 5 µM MitoSOX in HBSS was added onto the transwell membranes and incubated in 37? for one hour. Cells were fixed in 3.7% paraformaldehyde (PFA)/PBS for 10 minutes at room temperature and nuclei were stained with Hoechst 33342 (Invitrogen™, CA, USA). The membrane was then excised from the transwell insert and mounted directly on slide with 20 µl of ProLong™ Gold Antifade Mountant (Invitrogen™, CA, USA). Images were visualized and captured with confocal at 580 nm. Fluorescence intensity was subsequently quantitated with the ImageJ software (National Institutes of Health, Bethesda, MD) [23].
Glutathione
The ratio of reduced glutathione (GSH) to oxidized glutathione (GSSG) (GSH/GSSG ratio) can change over the time after oxidant exposure, basal H2O2 (1 mM) exposure was performed in this assay.
Cells were lysed with mammalian cell lysis buffer and deproteinized as per manufacturer’s instruction (Abcam, Cambridge, UK). Samples were then diluted 1:10 in H2O and GSH and total glutathione were measured according to manufacturer’s instruction (GSH/GSSG Ratio Detection Assay Kit II; Abcam, Cambridge, UK). GSSG was calculated as: GSSG = (Total Glutathione – GSH)/2.
ATP production
Cellular adenosine triphosphate (ATP) (Luminescent ATP Detection kit; Abcam, Cambridge, UK) was measured according to manufacturer’s instruction. Briefly, a 50 µl volume of detergent was added to each transwell and cells were scraped off from the transwell. Cell lysates were then transferred into microcentrifuge tubes and the tubes were shaken for 5 minutes in an orbital shaker at 700 rpm to lyse the cells and stabilize the ATP. Samples were diluted in H2O at 1:10 and transferred to a clear 96-well plate. 50 µl Substrate Solution was subsequently added to each well and the microplate was shaken for 5 minutes in an orbital shaker at 700 rpm. Luminescence was measured by CLARIOstar following 10 minutes incubation.
RNA extraction and quantitative Reverse Transcription PCR (qRT-PCR)
At the 24-hour time point post H2O2 exposure, total RNA was isolated from cells using TRIzol™ reagent (Invitrogen™, CA, USA) and RNeasy Mini Kit (Qiagen, Hilden, Germany). A total of 100 ng RNA from each sample was reverse-transcribed into cDNA using a High Capacity cDNA Reverse Transcription Kit (Applied Biosystems™, CA, USA). qPCR was performed with Taqman primers (Applied Biosystems™, CA, USA): SIRT1 (Hs01009005_m1), FOXO3 (Hs00818121_m1), CDKN1A (p21; Hs99999142_m1), TP53 (p53; Hs01034249_m1), and PINK1 (Hs00260868_m1) with FAM dye and housekeeping gene Eukaryotic 18S rRNA Endogenous Control (4319413E) with VIC dye.
Quantification of gene expression was performed using a ViiA™ 7 Real-Time PCR System (Applied Biosystems, MA, USA). The running conditions were as follow: 50? for 2mins, 95? for 20sec, followed by 40 cycles of 95? 1 sec and 60? 20 sec. The relative mRNA expression levels were normalized to 18s using the 2-ΔΔCq methods.
Western blot
Cells were lysed with a 100 µl of cold 2% sodium dodecyl sulfate (SDS)/PBS lysis buffer containing cOmplete™, Mini Protease Inhibitor Cocktail and PhosSTOP™, phosphatase inhibitor (Sigma-Aldrich, MI, USA). Protein concentration was measured by Pierce™ BCA Protein Assay Kit (Thermo Fisher Scientific, MA, USA). Samples were mixed with LDS sample buffer and sample reducing agent (Invitrogen™, CA, USA), and incubated at 70? for 10 minutes.
Equal quantities of protein were loaded to Bolt™ 4 to 12%, Bis-Tris Gel (Invitrogen™, CA, USA) and electrophoresed at 200V for 30 minutes. The gel was then transferred to Immobilon-P PVDF membrane (Merck KGaA, Darmstadt, Germany). Membranes were blocked in blocking buffer; 3% BSA (phosphorylated protein and PARKIN), 5% (w/v) nonfat dry milk (SIRT1) or 5% BSA (GAPDH) in tris-buffered saline with Tween 20 (TBST) for one hour at room temperature and subsequently incubated with primary antibodies, SIRT1 (1:1000) (8469S; Cell Signaling Technology, MA, USA), phosphorylated-SIRT1 (1:1000) (2314S; Cell Signaling Technology), phosphorylated-PARKIN (1:1000) (PA1-4735; Invitrogen™), GAPDH (1:1000) (2118S; Cell Signaling Technology); PARKIN (1:500) (39-0900; Invitrogen™) in blocking buffer at 4? overnight. The following day, membranes were incubated with appropriate fluorescent secondary antibodies, anti-rabbit (1:10,000) (5366P; Cell Signaling Technology) or mouse (1:5,000) (5257P; Cell Signaling Technology) at room temperature for one hour. The results were detected using the LI-COR Odyssey (BioAgilytix, NC, USA) and quanti?ed by ImageJ software.
NRF2 nuclear translocation assay
NRF2 nuclear translocation was examined by immunostaining as described previously [24]. In short, cells were fixed in 3.7% PFA/PBS for 10 minutes at room temperature and were permeabilized using 100 µl of 0.5% Triton X100/PBS for 10 minutes and blocked using 200µl of blocking buffer (2% bovine serum albumin (BSA), 0.2% Triton X100, PBS) for one hour at room temperature. A 100 µl of NRF2 antibody (sc-365949; Santa Cruz Biotechnology, TX, USA) in blocking buffer (1:100 dilution) was subsequently applied and incubated for four hours at room temperature and 4? overnight. The next day, a 100 µl of anti-mouse secondary antibody, Alexa Fluor 647 (A21235; Invitrogen™, CA, USA) in blocking buffer (1:250 dilution) was applied and incubated for one hour at 37? in a humidified incubator. Cells were then washed three times with PBS for three minutes and a 100 µl of Hoechst 33342 nuclei stain in PBS (1:10,000 dilution) was applied for 10 minutes. The transwell membrane containing the cells was excised from the insert using No.11 scalpel blade in a clockwise motion and mounted directly on a glass slide. 20 µl of ProLong™ Gold Antifade Mountant (Invitrogen™, CA, USA) was applied, and coverslip was placed gently on top. Images were visualized and captured on the Zeiss Confocal LSM 710 and the mean intensity of nuclear NRF2 was quantified by the Image J software.
Statistical analysis
All the graphs were plotted using GraphPad Prism 9.00 (GraphPad, CA, USA) and were expressed as the mean ± standard error of the mean (SEM).
Kruskal-Wallis rank test with Dunn's multiple-comparison test was performed to compare different conditions. Two-sample Wilcoxon rank-sum (Mann-Whitney) test was used to compare sensitive and resistant groups. P<0.05 was considered to indicate a statistically significant difference.
Results
H2O2 exposure reduces epithelial barrier integrity
Epithelial integrity was examined following H2O2 exposure (Figure 1). A dose-dependent decrease in TEER with increasing H2O2 concentration was observed (Figure 1A). Similarly, with an increase in H2O2 concentration, a dose-dependent increase in permeability and cell death rate occurred (Figures 1B and 1C). Differences in sensitivity to H2O2 between donors were observed.
To examine the differences in response, cells from 12 healthy donors were grown and differentiated at ALI. Following 50 mM H2O2 exposure, TEER and permeability assay were performed. A great variability between donors was observed (Figures S2A and 2B). Therefore, different concentrations of H2O2 were tested in each donor and the concentration required to achieve a comparable baseline response was reported. The permeability assay was used to determine the comparable baseline (Figure S2D). It was an interesting finding that one dose can be harmful for some donors while not for others. For example, 300 mM H2O2 exposure on Donor 3 had a similar effect to 25 mM H2O2 exposure on Donor 1. This means that a high dose of H2O2 can cause extreme damage to cells obtained from Donor 1 but not Donor 3. On the other hand, a low dose of H2O2 that did not affect Donor 3, was sufficient to cause damage in Donor 1. There was a 12-fold difference in H2O2 concentrations used to achieve a comparable baseline between Donor 3 and Donor 1.
Donors were then grouped into two groups, sensitive or resistant, according to the dose of H2O2 required to cause an increase in FITC-dextran concentration to greater than 10 µg/ml (Figures S2D & S3). Subjects in whom a concentration of H2O2 of ≤ 25 mM caused an increase in FITC-dextran concentration to >10 µg/ml were considered as sensitive to OS. Those that required >25 mM H2O2 to induce an increase in FITC-dextran concentration to >10 µg/ml were considered as resistant to OS. These groupings were used for subsequent examinations reported in this study as similar responses were observed within the group in multiple exposures and different measurements. Different concentrations of H2O2 were used in each group to achieve a comparable baseline response, with 25 mM H2O2 used in the sensitive group and 50 mM H2O2 in the resistant group. These concentrations were sublethal in both groups and allowed us to investigate the cellular responses. A single color was used in all figures to represent a single donor throughout the results in all sections. No differences in donor background between the groups were observed (Table S1).
Those in the sensitive group had lower TEER (p=0.001) and increased permeability (p=0.006) compared with those in the resistant group following 25 mM, 50 mM and 100 mM H2O2 exposure (Figures 1D, 1E, 1G, 1H). The overall differences in cell death were not statistically different, however, 100 mM H2O2 caused more cell death in the sensitive group than in the resistant group (p=0.301; Figures 1F, and 1I).
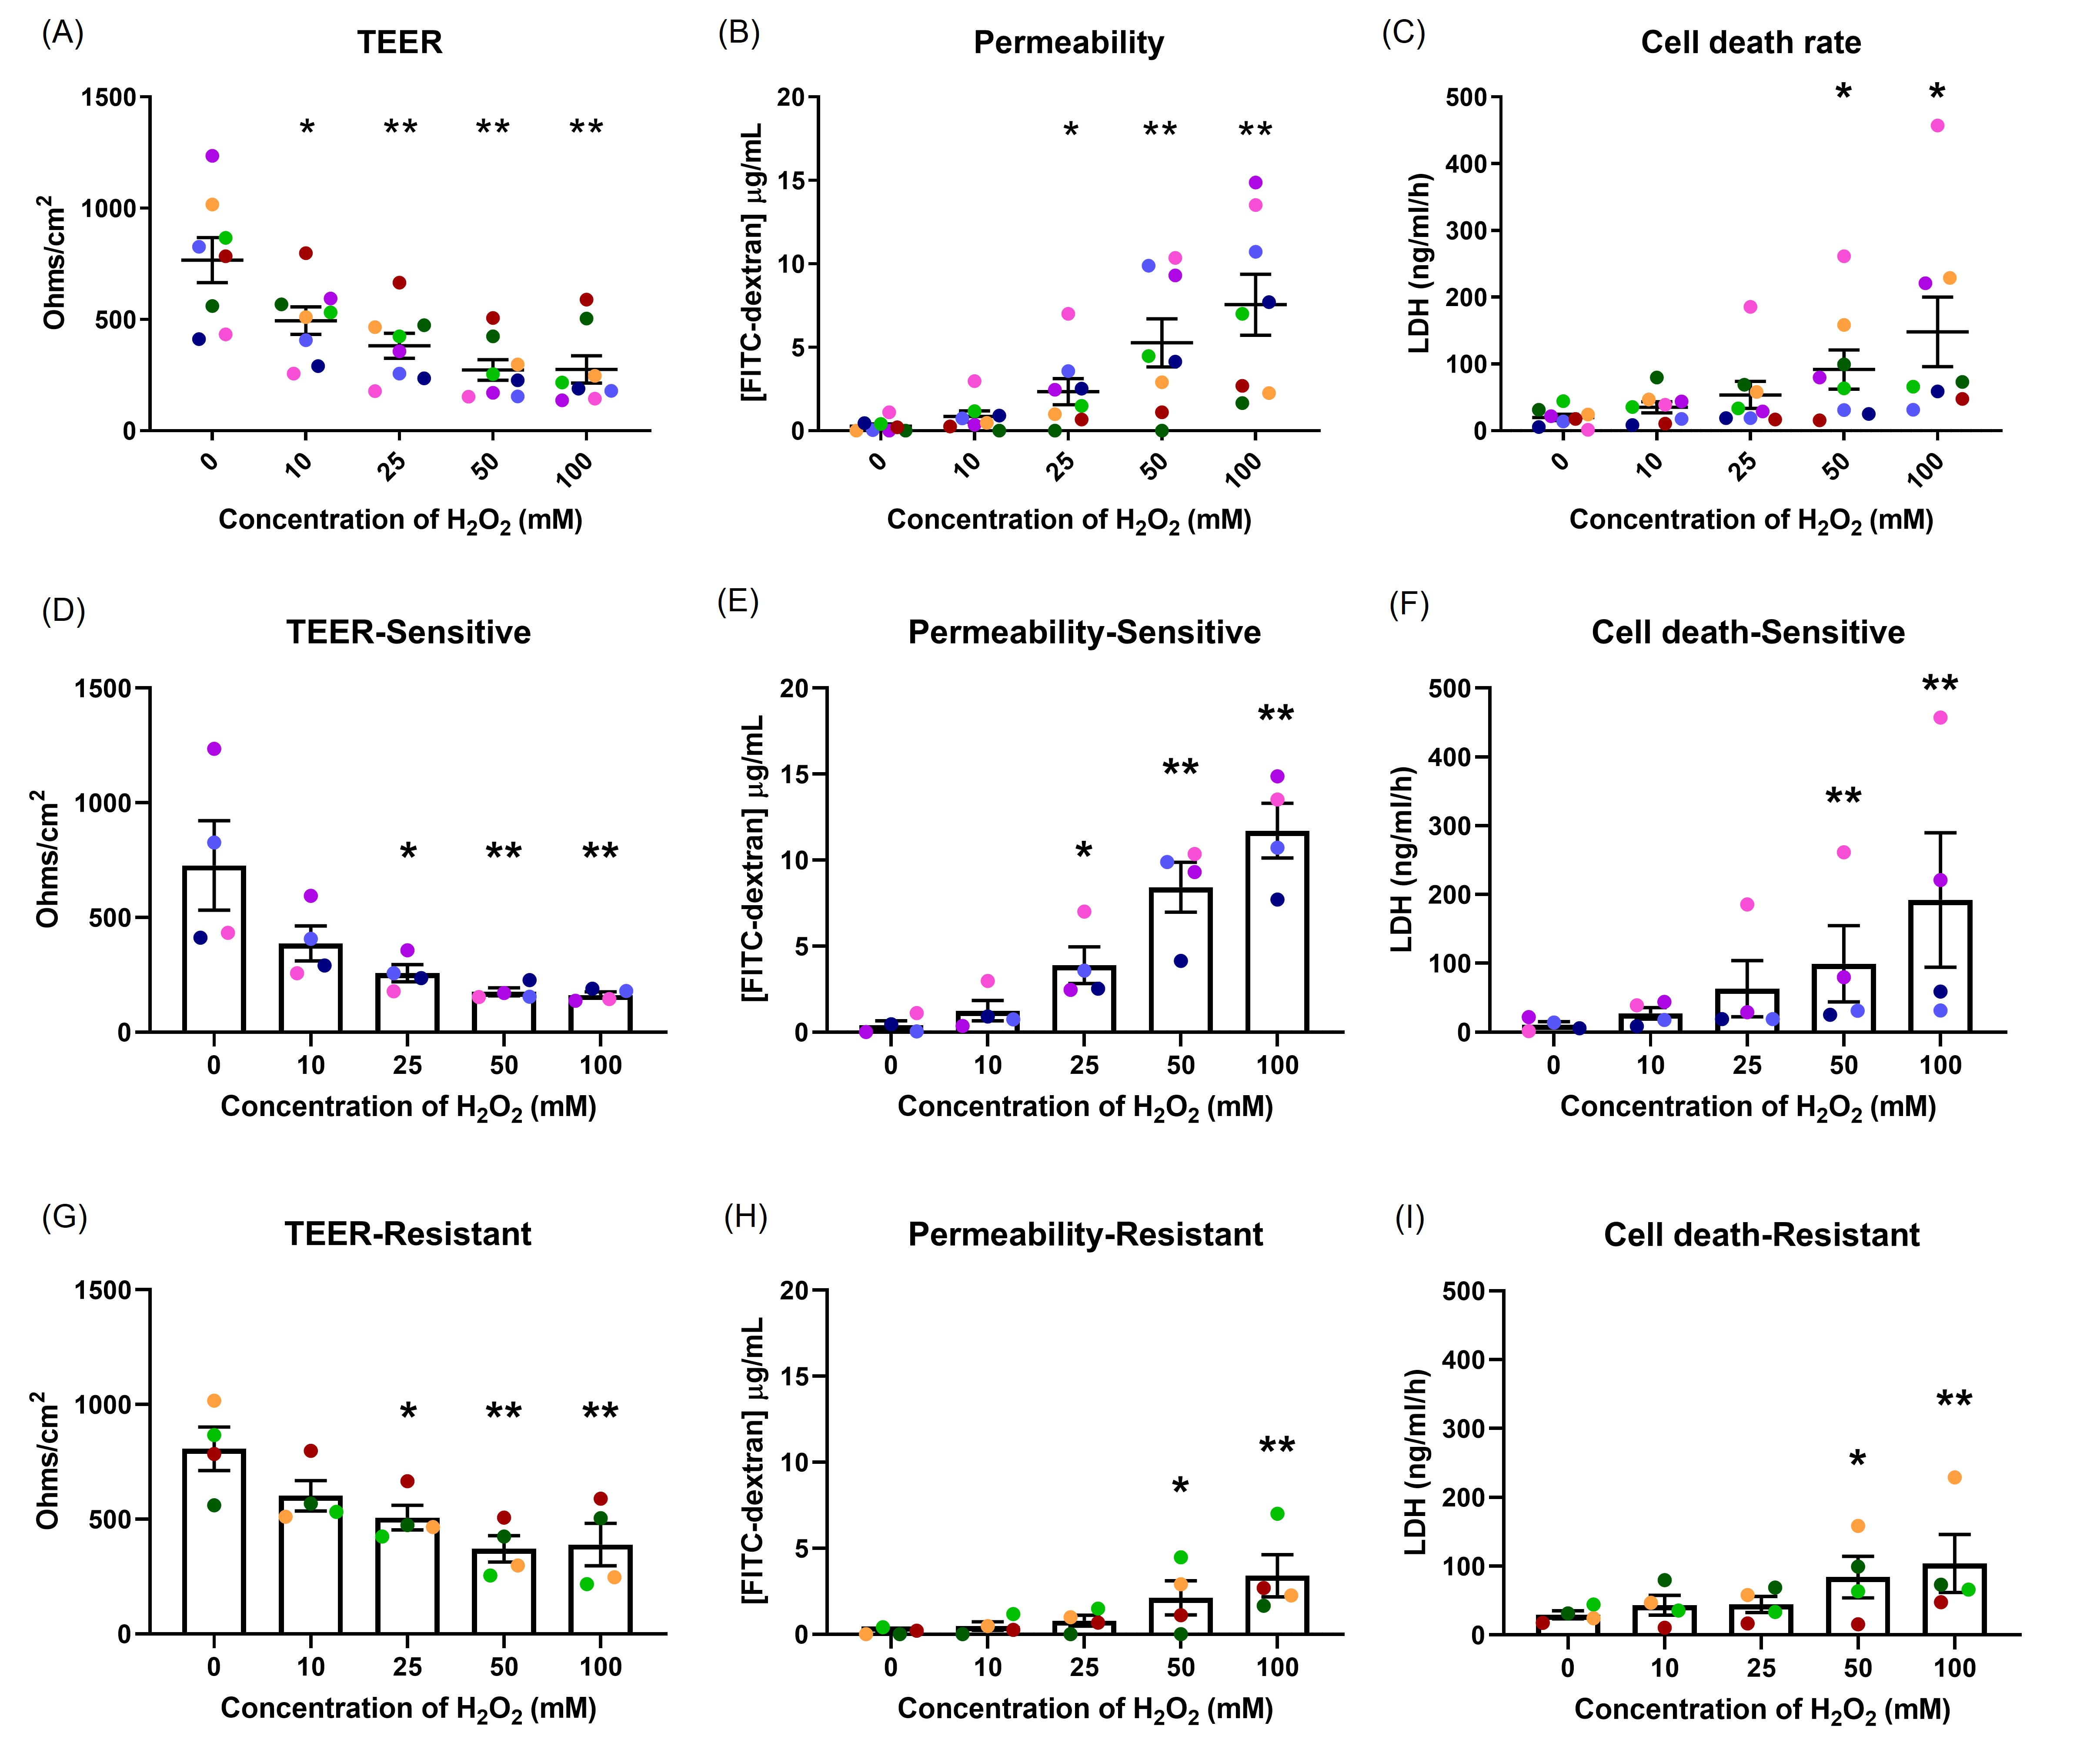
Figure 1. The effects of oxidant exposure on epithelial integrity. Well-differentiated NECs were exposed to different concentrations of H2O2, and the effects measured by TEER (A), permeability to FITC-dextran (B) and cell death, indicated by LDH secretion (C). Each concentration group was compared to control. There was a dose-dependent effect on epithelial integrity. Differences were seen in the responses in TEER (D, G) and permeability (E, H) between the sensitive and resistant groups, but not in cell death (F, I). Data presented as mean ± SEM (n=8; *p<0.05; ** p<0.01, compared with control). A single color was used in all figures to represent a single donor.
H2O2 exposure induced mitochondrial reactive oxygen species generation
As most of the intra-cellular ROS are generated by mitochondria (mtROS), mitochondrial homeostasis is critical for maintaining cell health. Increase in mtROS can cause mitochondrial dysfunction and lead to disease [17]. One hour after H2O2 exposure, mtROS production was significantly increased by 3.3-fold in the sensitive (p<0.001; Figure 2B) and 3.5-fold in the resistant donors (p<0.05; Figure 2C) (MitoSOX assay) compared with control (Figure 2).
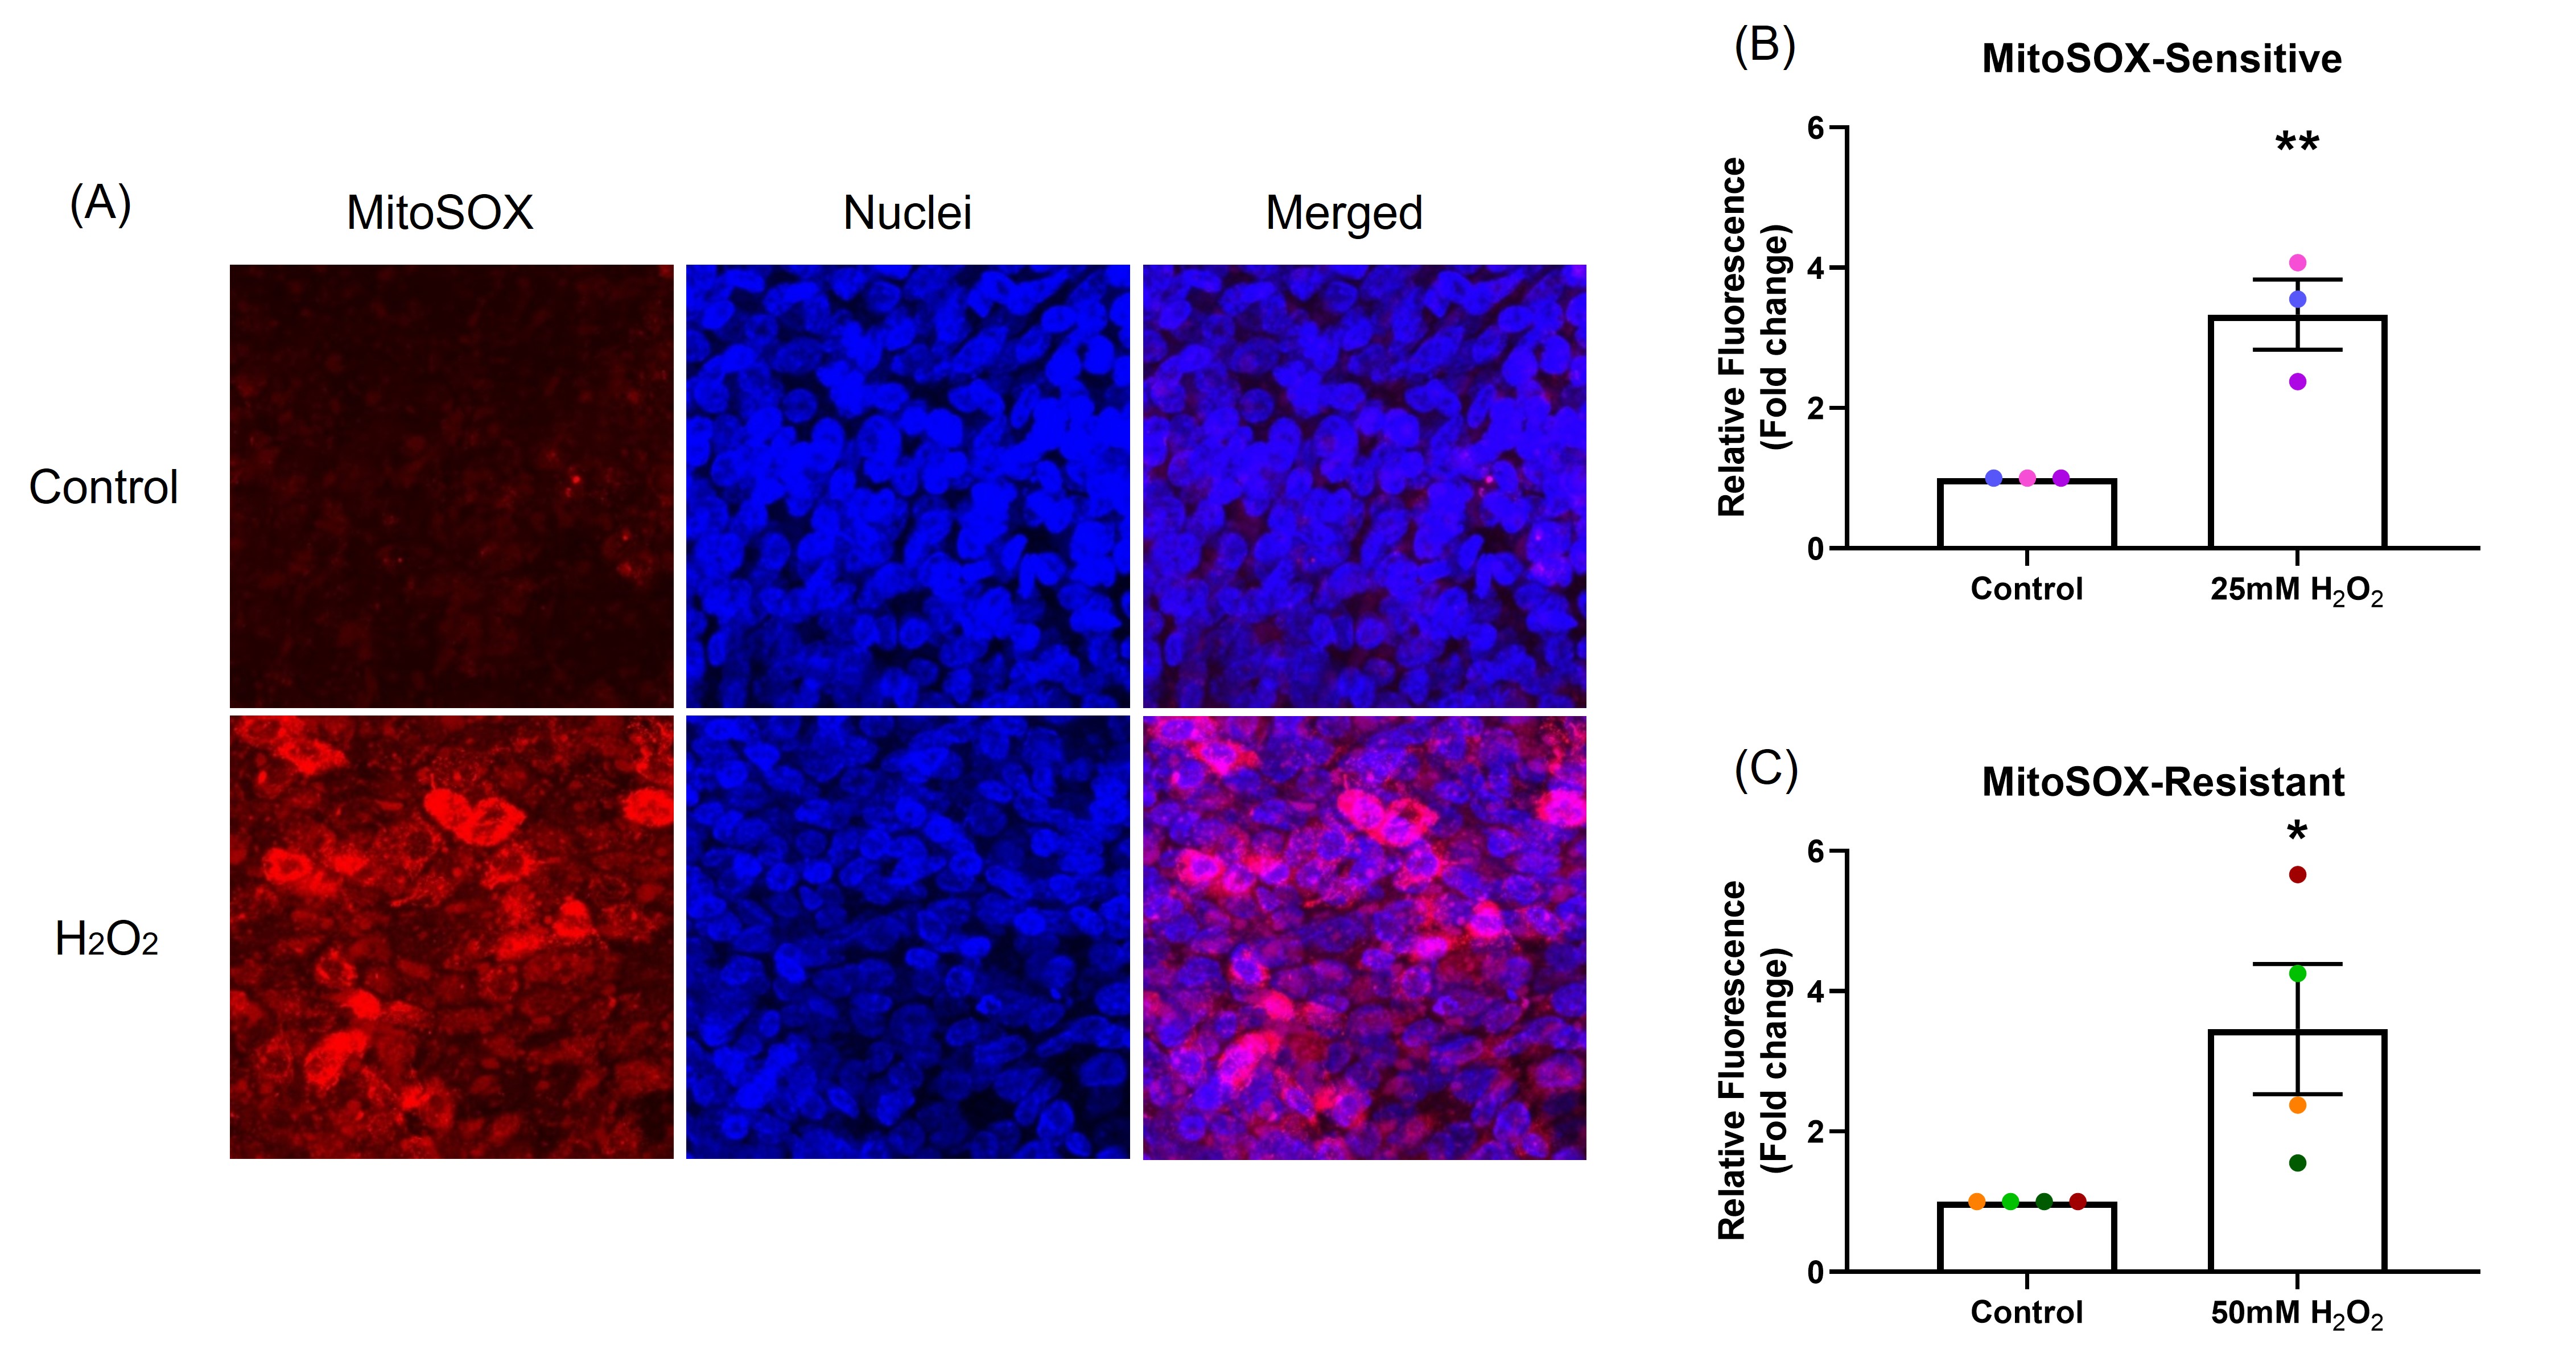
Figure 2. The effect of oxidant exposure on mitochondrial ROS production. After exposure to H2O2, mtROS generation was measured by MitoSOX and images captured by confocal microscopy, images are shown from representative sensitive donor (Red: mtROS; blue: nuclei). (A) mtROS can be seen in the cytoplasm (merged panel in A). Compared with control, mtROS production increased in NECs exposed to H2O2 in both sensitive (B) and resistant (C) groups. Data presented as mean ± SEM (n=7; *p<0.05; ** p<0.001, compared with control). A single color was used in all figures to represent a single donor.
H2O2 exposure caused a decrease in GSH/GSSG ratio
GSH/GSSG ratio was measured following 1, 3, 6 and 24-hour exposure to 1 mM H2O2 in the basal chamber (Figure 3). In the sensitive group (Figure 3A), GSH/GSSG ratio dropped significantly at 3 and 6-hours (p=0.024, p=0.018, respectively), with recovery observed by 24-hours. These data indicate the epithelium was able to recover from OS by 24 hours, presumably as the H2O2 stimulus had dissipated. In the resistant group (Figure 3B), two donors had reduction in GSH/GSSG ratio at 3-hours, overall, there was no significant differences in GSH/GSSG ratio at any time point (p=0.533).
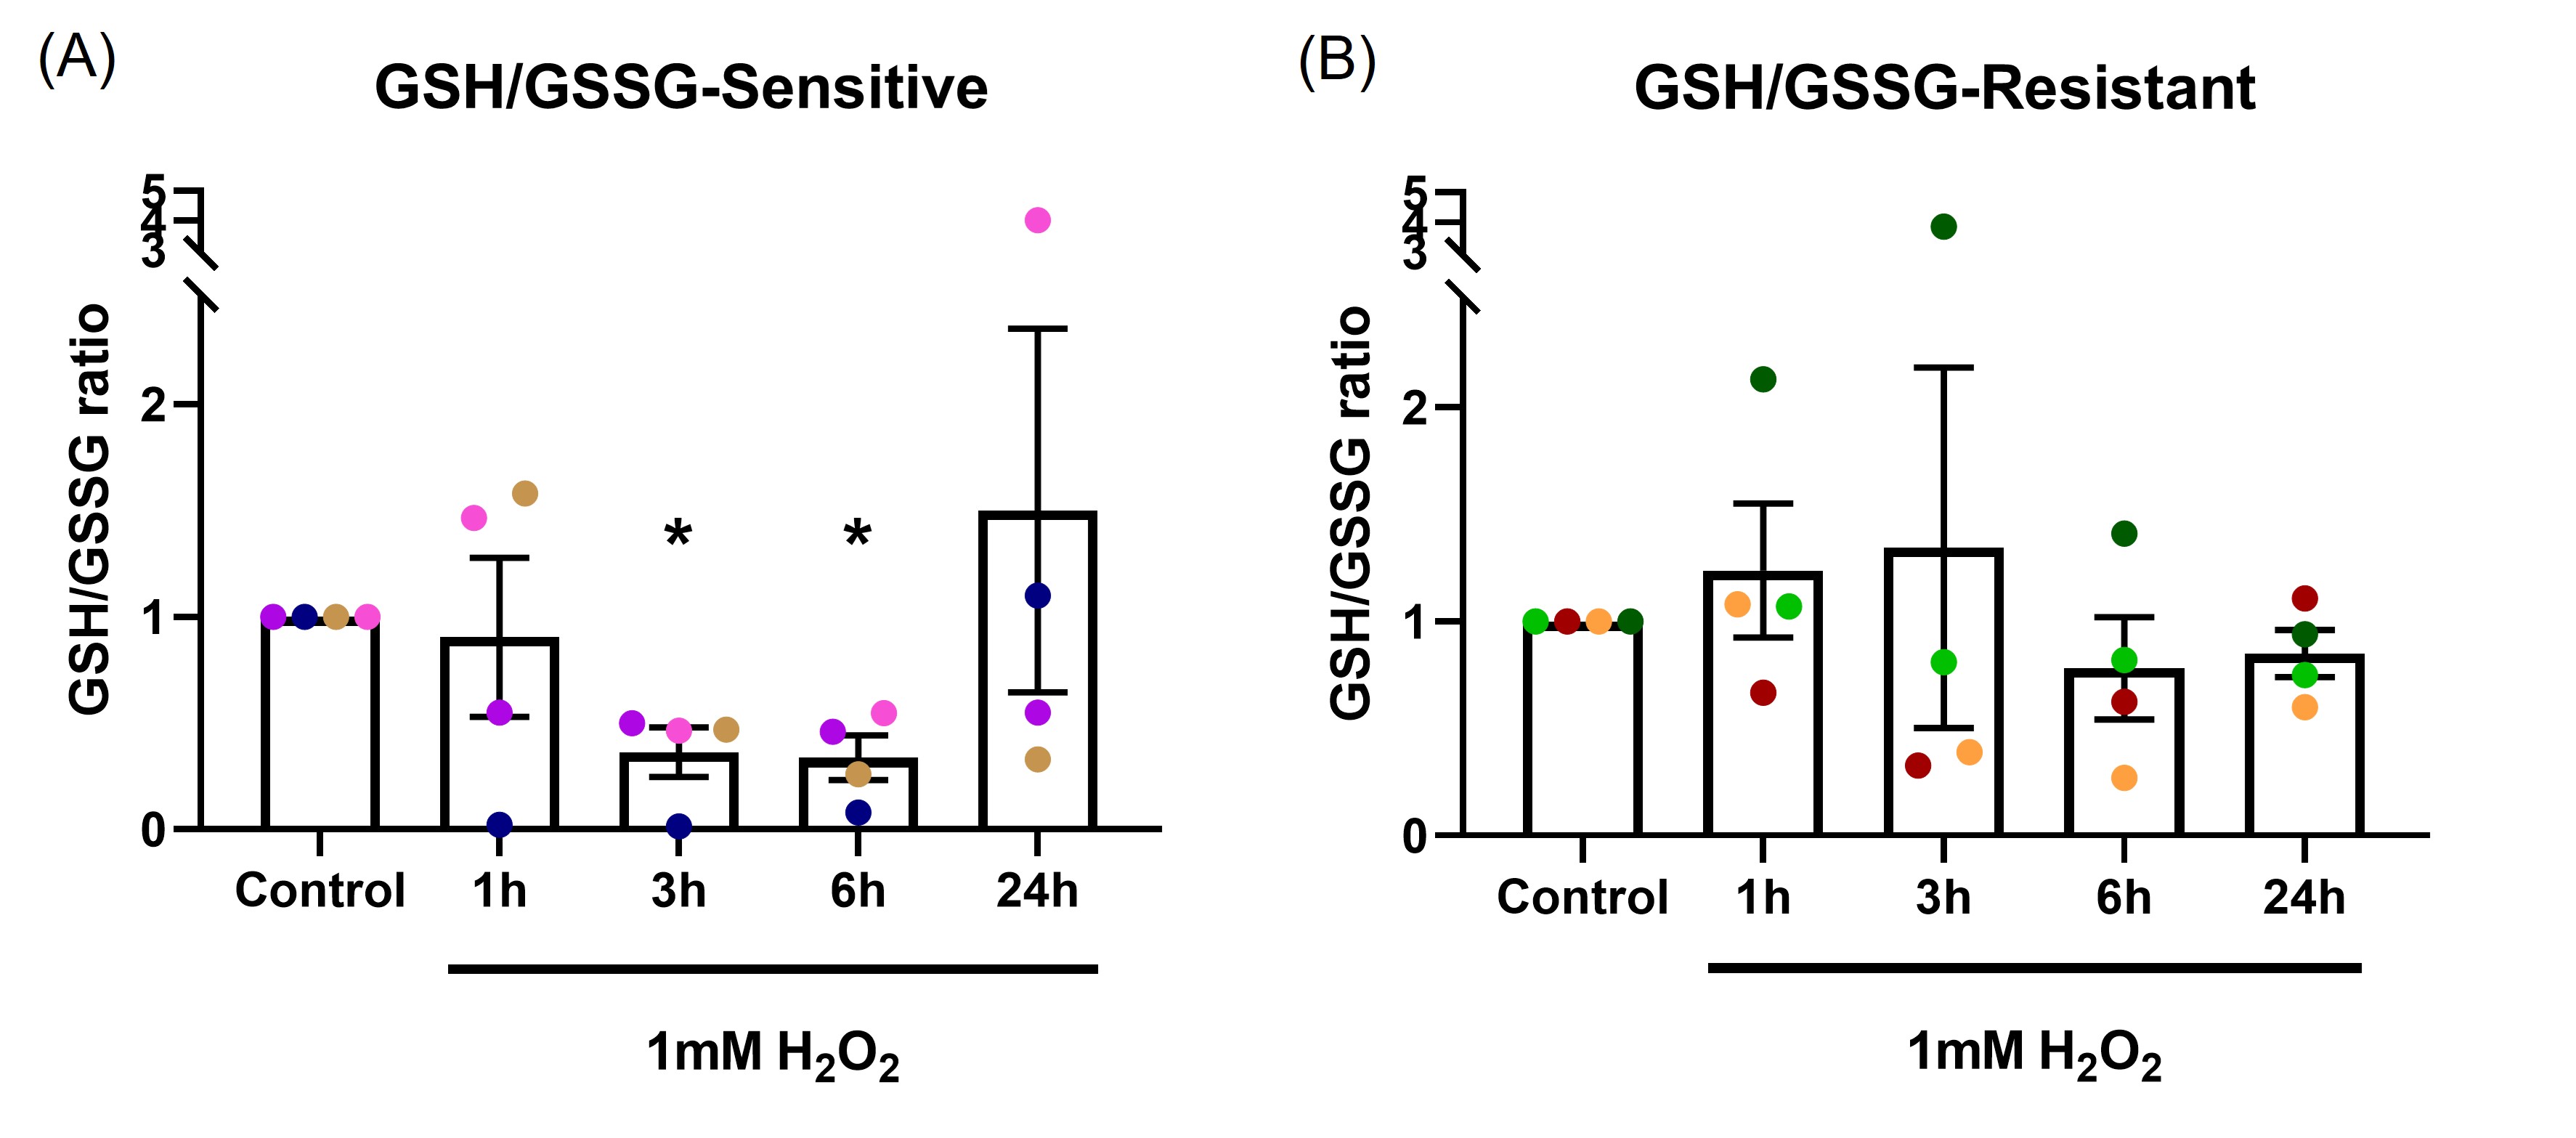
Figure 3. The effect of oxidant exposure on epithelial GSH/GSSG ratio. Following 1 mM H2O2 exposure in the basal chamber, GSH/GSSG ratio decreased at the 3 and 6-hour time points, recovering to baseline by 24 hours in the sensitive group (A). No significant change in GSH/GSSG ratio was seen in the resistant group (B). Data presented as mean ± SEM (n=8; *p<0.05, compared with control). A single color was used in all figures to represent a single donor.
H2O2 exposure decreased cellular ATP
Most of the intracellular ATP is produced in mitochondria. ATP production is an indicator of mitochondrial health. A decline in mitochondrial function can cause a decrease in ATP production [25].
After one-hour H2O2 exposure, ATP production was measured. Figure 4A shows the data as the raw luminescence reading. Interestingly, the resistant donors had much higher cellular ATP baseline compared with the sensitive donors (p=0.008). A dose-dependent decrease in cellular ATP in both sensitive (p=0.001; Figure 4B) and resistant (p=0.004; Figure 4C) groups were observed. The sensitive donors decreased ATP production to a much greater degree than the resistant donors at the same concentration of H2O2 (p<0.001). Antimycin (100 µM), an inhibitor of complex III in mitochondrial electron transport chain [25], was included as positive control. Antimycin induced a reduction in ATP production of the same magnitude in both groups (p=0.008, p=0.032, respectively). Data in Figures 4B and 4C are shown normalized to the baseline ATP concentration.
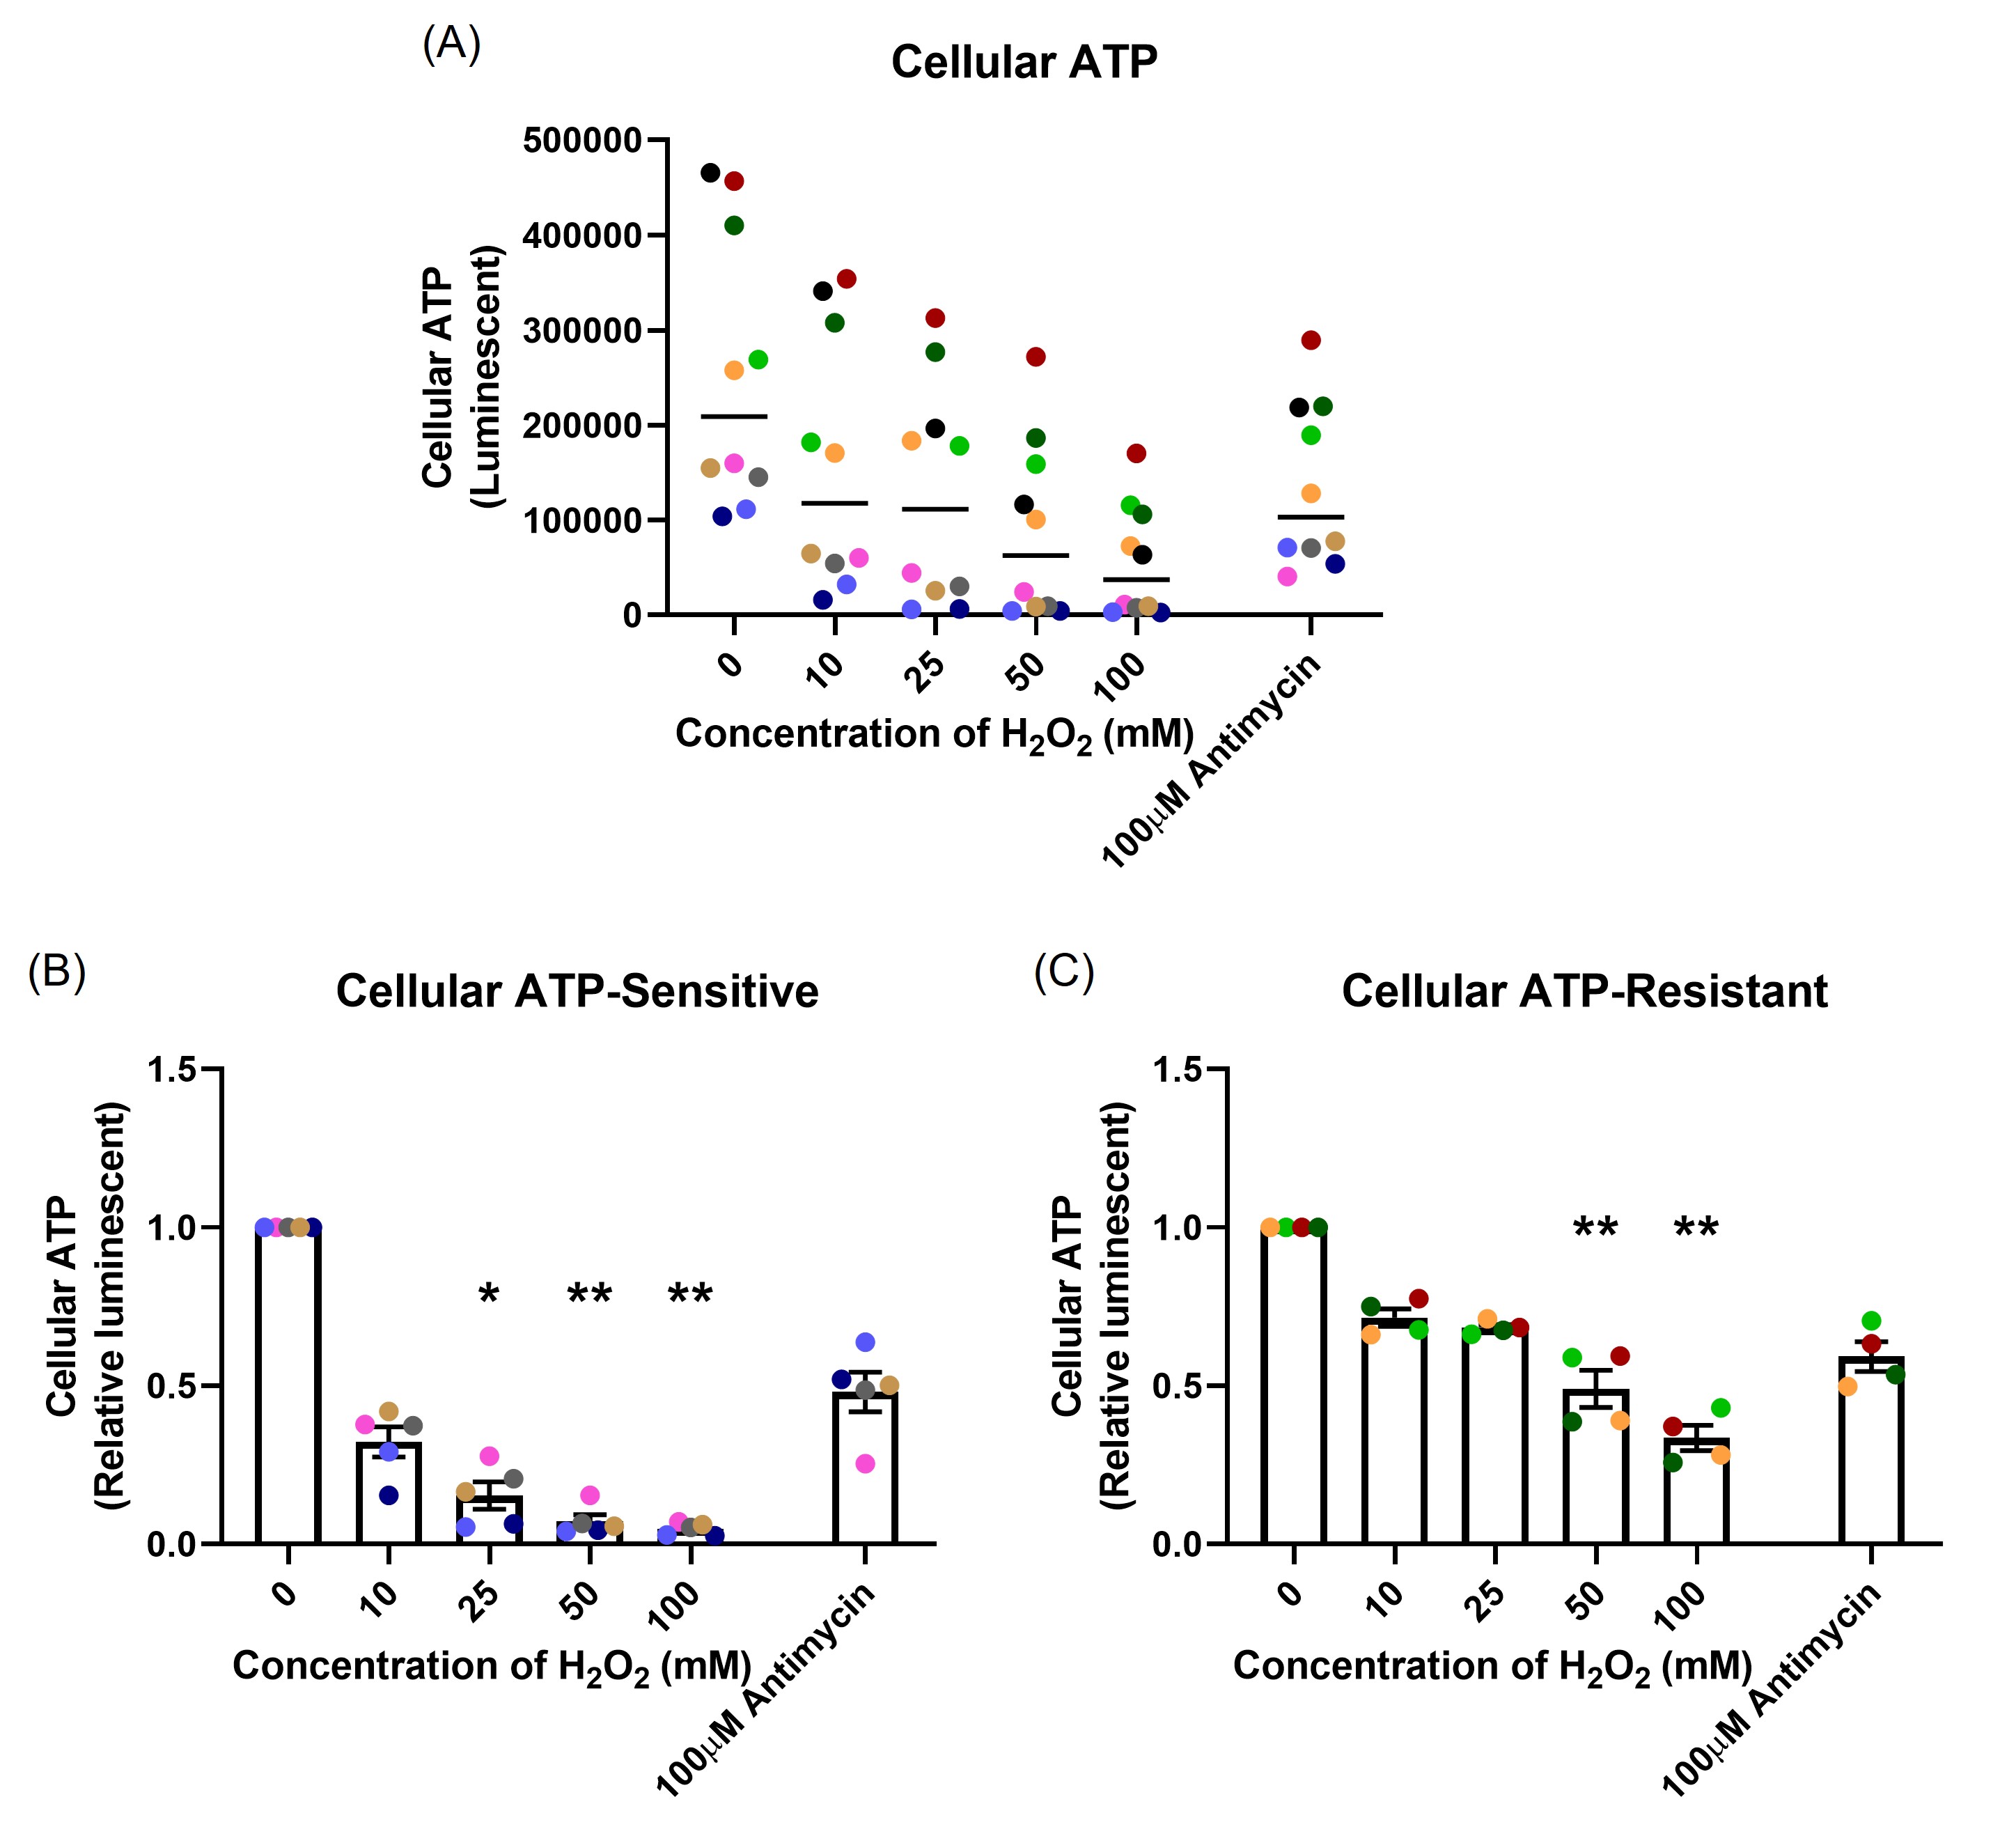
Figure 4. The effect of oxidant exposure on mitochondrial ATP production, measured following one-hour H2O2 exposure. The resistant individuals had significantly higher ATP baseline compared with the sensitive individuals presented as raw luminescent readings (A). There was a dose-dependent decrease in both sensitive (B) and resistant (C) groups. Data presented as mean ± SEM (n=10; *p<0.05; ** p<0.01, compared with control). A single color was used in all figures to represent a single donor.
Stress response signaling pathway
To determine changes in the SIRT1-mediated signaling pathways following oxidant exposure, mRNA expression (SIRT1, p53, p21, FOXO3, PINK1), protein expression (total and phosphorylated SIRT1 and PARKIN protein levels) and NRF2 nuclear translocation was examined.
mRNA expression: mRNA expression was measured at 24-hour following H2O2 exposure. In the sensitive group, there was a dose-dependent increase in SIRT1 (p=0.015; Figure 5A), FOXO3 (p=0.046; Figure 5C), and p21 (p=0.033; Figure 5G), no change in p53 mRNA expression (p=0.628; Figure 5E) and moderately increased PINK1 mRNA expression (p=0.518; Figure 5I). In the resistant group, H2O2 exposure only caused a dose-dependent increase in p21 mRNA expression (p=0.095; Figure 5H), with no significant differences in SIRT1 (p=0.106; Figure 5B), FOXO3 (p=0.718; Figure 5D), p53 (p=0.613; Figure 5F), or PINK1 (p=0.277; Figure 5J) mRNA expression.
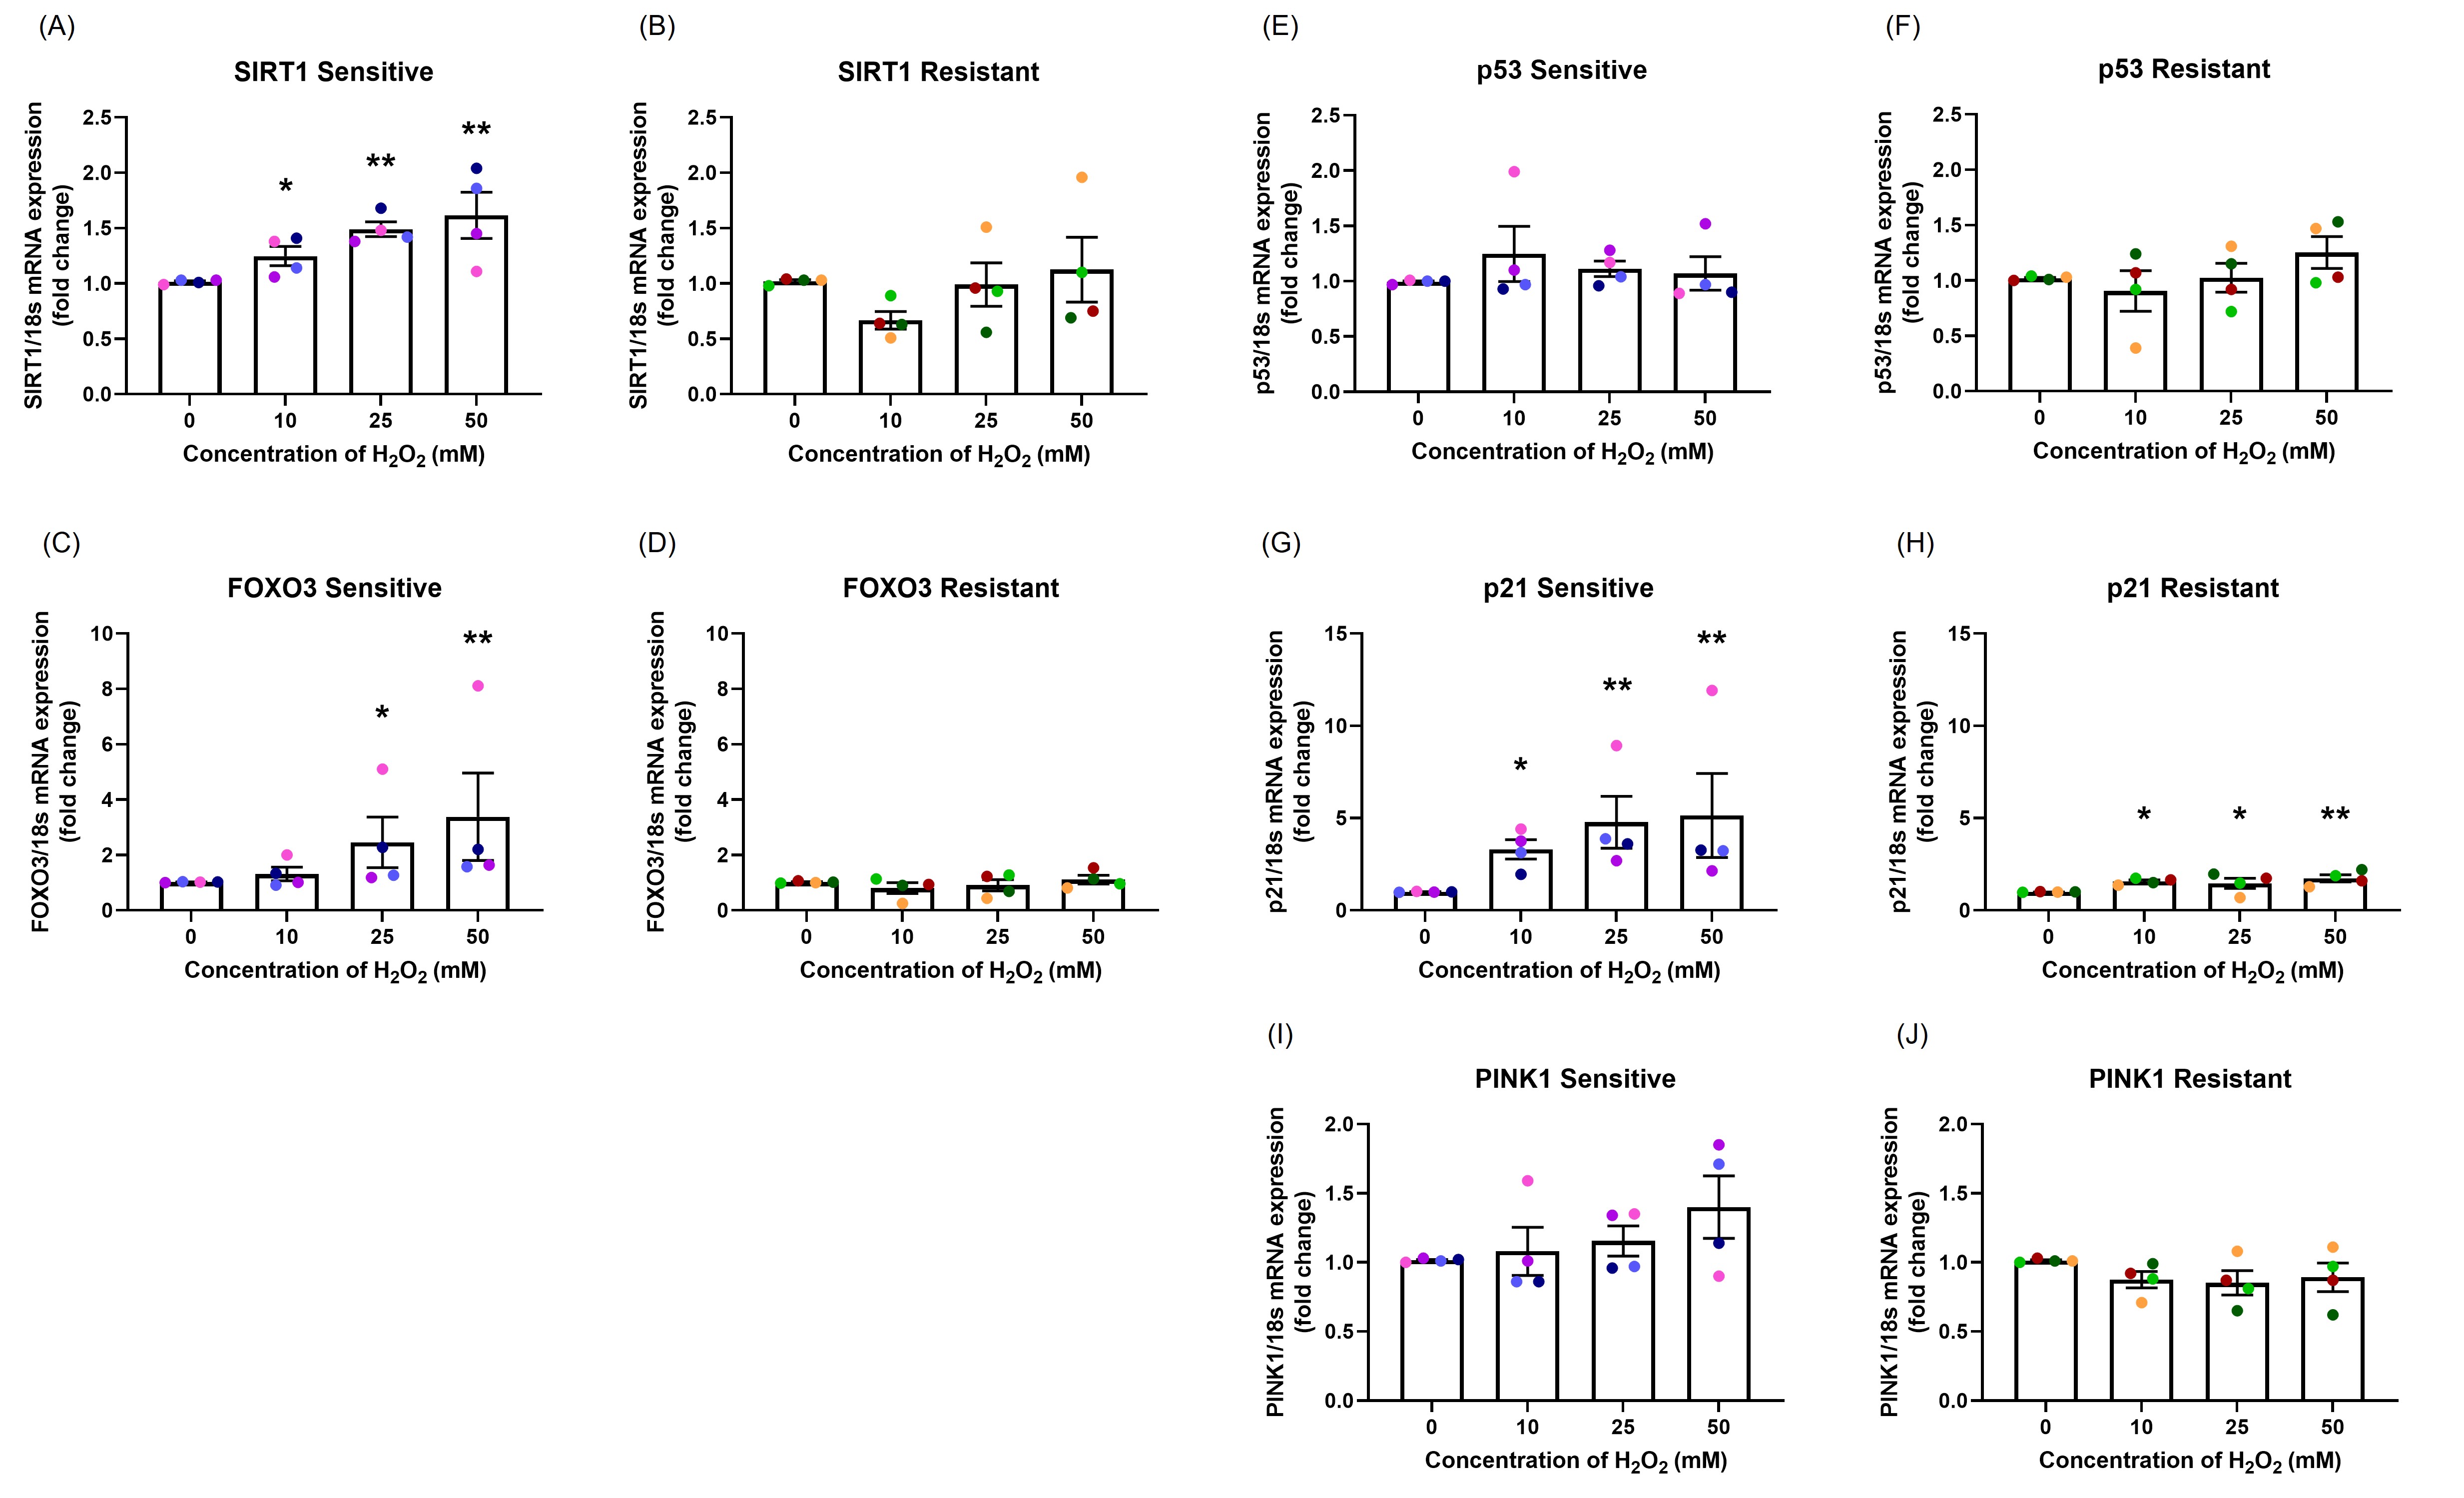
Figure 5. The effect of oxidant exposure on mRNA expression levels. Following H2O2 exposure, SIRT1 (A, B), FOXO3 (C, D), p53 (E, F), p21 (G, H), and PINK1 (I, J) mRNA expression levels were measured. There was a dose-dependent increase in SIRT1, FOXO3, p21, and PINK1 mRNA expression with no changes in p53 mRNA expression in the sensitive group. In the resistant group, H2O2 exposure up-regulated only p21 mRNA expression. There were significant differences between the groups in SIRT1, FOXO3, p21, and PINK1 mRNA expression. Data presented as mean ± SEM (n=8; *p<0.05; ** p<0.01, compared with control). A single color was used in all figures to represent a single donor.
The sensitive donors had significantly higher mRNA expression of SIRT1 (p=0.001; Figures 5A and 5B), FOXO3 (p=0.003; Figures 5C and 5D), p21 (p=0.005; Figures 5G and 5H), and PINK1 (p=0.023; Figure 5I and 5J) compared to resistant donors.
Protein expression: Protein phosphorylation was assessed by western blot at 1, 2, 4, 6, and 24-hour following H2O2 exposure. 50 µg of protein lysate was loaded in each lane (Figures 6A and 6B). Data are shown as the ratio of phosphorylated protein to total protein level (Figures 6C-6F). SIRT1 was maximally phosphorylated 2 to 4 hours after H2O2 exposure in both sensitive (p=0.022, p=0.015, respectively; Figure 6C) and resistant (p=0.002, p=0.007, respectively; Figure 6D) groups. PARKIN was phosphorylated at later time points, from 4 to 24-hour, in the sensitive group (p=0.018, p=0.008, p=0.002, respectively; Figure 6E). H2O2 exposure did not induce increases in phosphorylated or total PARKIN in the resistant group (p=0.498; Figure 6F). The sensitive donors had significantly higher PARKIN protein phosphorylation than the resistant donors (p<0.001; Figures 6E and 6F).
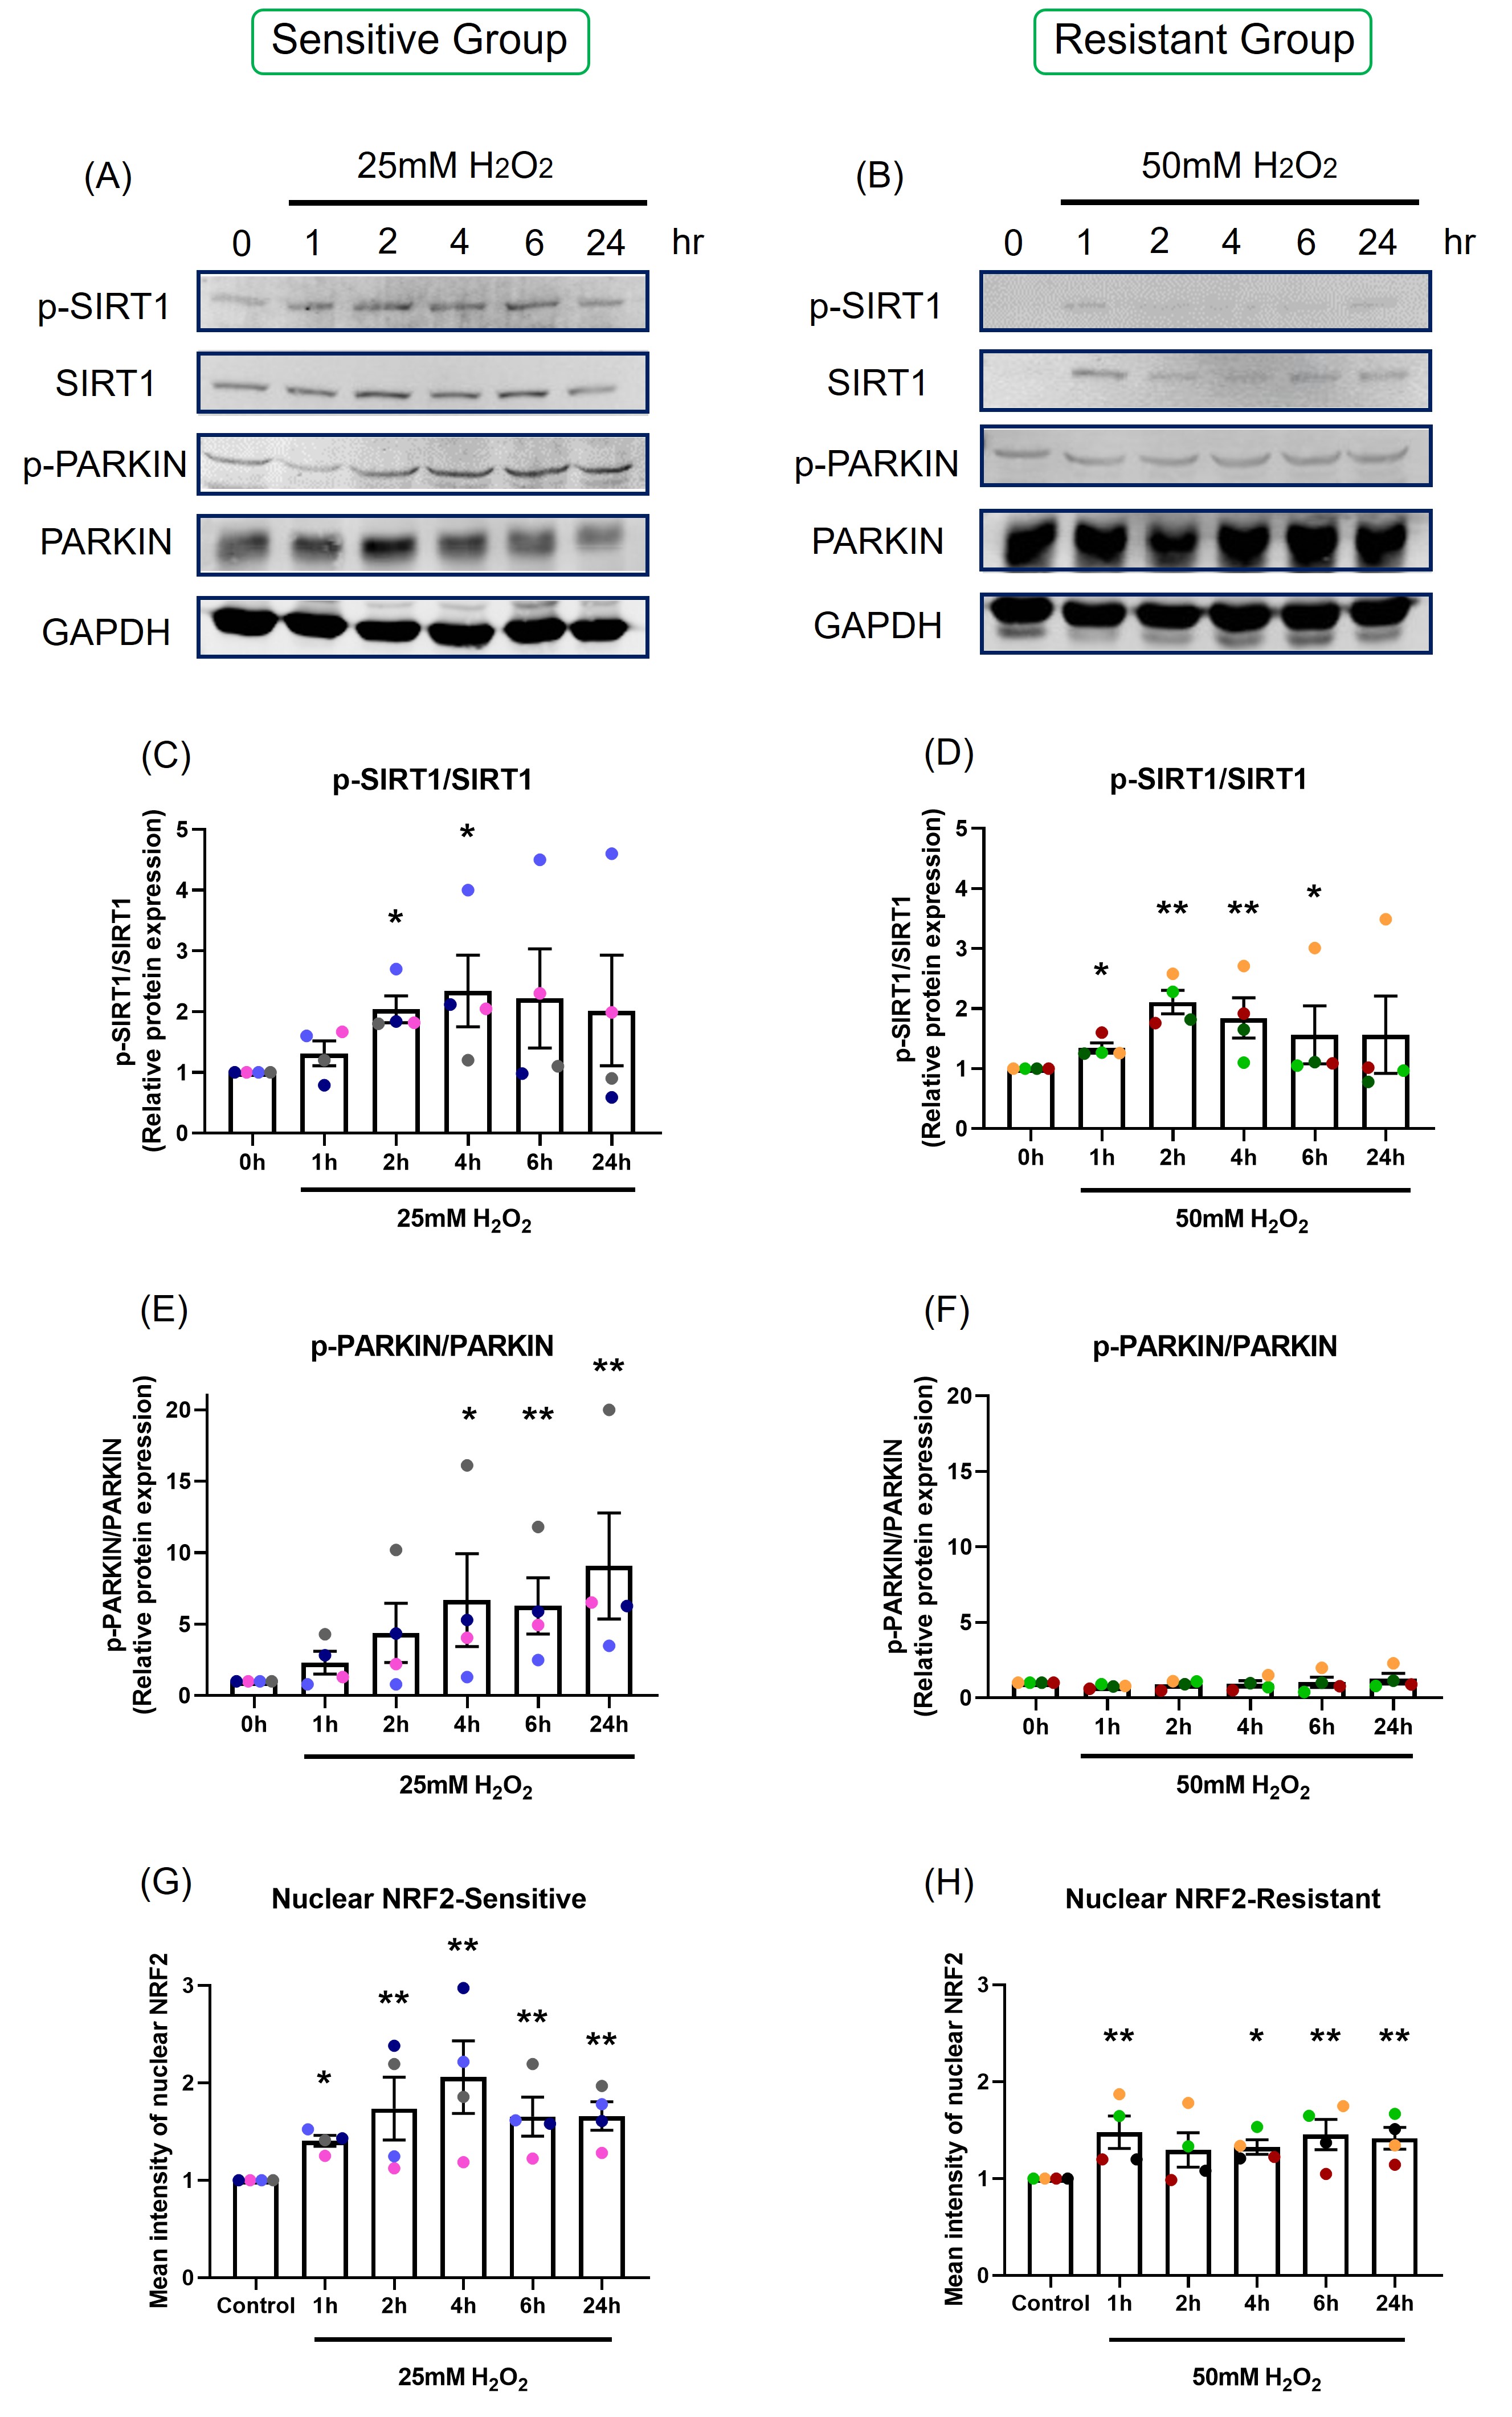
Figure 6. The effect of oxidant exposure on protein expression levels and nuclear NRF2 translocation. Following H2O2 exposure, SIRT1 and PARKIN phosphorylation was measured by western blot. Images are shown from representative sensitive (A) and resistant (B) donors. There was an increase in SIRT1 phosphorylation at 2 and 4-hour in both sensitive (C) and resistant groups (D). PARKIN phosphorylation rose at later time point, 4 to 24-hour in the sensitive group (E), but not in the resistant group (F). The difference between the groups in p-PARKIN/PARKIN was p<0.001. Following one-hour H2O2 exposure confocal images were taken and nuclear NRF2 was quantified. NRF2 translocation was increased following H2O2 exposure and peaked at 4-hour in the sensitive group (G). NRF2 translocation rose slightly in the resistant group (H). Data presented as mean ± SEM (n=8; *p<0.05; ** p<0.01, compared with control). A single color was used in all figures to represent a single donor.
NRF2 translocation: NRF2 translocation from the cytoplasm to the nucleus was assessed by immunofluorescence, with images captured by confocal microscopy (Figure S4), and nuclear NRF2 was quantified (Figures 6G and 6H).
Following H2O2 exposure, nuclear NRF2 increased and peaked at 4-hours in the sensitive group (p=0.046; Figure 6G). NRF2 translocation to the nucleus was less prominent in the resistant group, with only slight increases in nuclear NRF2 following H2O2 exposure (p=0.105; Figure 6H).
Discussion
The impact of oxidant exposure and the mechanisms underlining OS in human airway epithelium is not fully understood. A decline in airway epithelial innate immune system functionality is associated with many medical conditions and can result in chronic inflammation and compromised immunity of the lung [26]. Most previous studies have been conducted on cell lines using submerged monolayer culture which directly exposes cells to H2O2 into the culture media [27]. Submerged monolayer epithelial cell cultures consists only of basal cells. The human airway epithelium contains only around 30% of basal cells [28,29]. 2D monoculture is fast and most of the existing assays have been optimised for monolayer culture, however, compared with 3D differentiated cells, the outcomes may not represent a true epithelial response [30]. In the present study, the effects of oxidant exposure on well-differentiated human airway epithelium cultured at ALI was investigated using various outcome variables. ALI cultures are a physiologically relevant model to human upper airways, the outcomes provide a better picture of the true epithelial response [19].
Firstly, epithelial integrity was measured following H2O2 exposure. There was a reduction in TEER and a rise in permeability and cell death in a dose-dependent manner. Decreased TEER and increased permeability indicate tight junction damage. This damage impairs the epithelial barrier, weakens epithelial defense, and allows greater access of environmental stressors to sub-epithelial structures [18].
Donor-to-donor variation in response to H2O2 was seen. Two clear groups were observed with different dose-response curves in the response of TEER and epithelial permeability to H2O2. For this reason, there was a need to understand how each donor responded and how those differences should be interpreted. Individual susceptibility to environmental oxidant exposures has been recognized. Epidemiological data have shown that African Americans have lower levels of plasma glutathione compared to Caucasians [31]. Genetic diversity in different ethnicities [32] and single nucleotide polymorphisms in particular genes in different races have been demonstrated to be related with higher risk of developing several diseases such as cancer [33]. Thus, ethnicity may be a factor that drives susceptibility to OS. However, in the present study, most of the donors were Caucasian and there was no difference in ethnicity between the sensitive and resistant groups. Some other factors such as sex, age, smoking history, socioeconomic status, education, have been considered, but there was no significant difference in background between the sensitive and resistant individuals. This might be because of the small sample size used here. A larger sample size in future studies may help to identify factors predicting the variability in response to oxidant stimuli.
Reactive oxygen species produced by mitochondria include free radicals such as hydroxyl radicals (•OH) and superoxide anions (O2?−) and nonradicals such as H2O2 [34]. Increased mtROS can damage mitochondrial DNA, depolarize mitochondrial membranes resulting in reduced membrane potential, impair electron transport, and lead to mitochondrial dysfunction [35]. In the present study, exogenous H2O2 exposure significantly increased mtROS generation. This result is consistent with a study in cartilage endplate cell showed that H2O2 induced mtROS production [36].
Acute oxidant exposure can induce mitochondrial hormesis (mitohormesis), a concept first described in 2006 [37]. Mitohormesis describes a process where sublethal mitochondrial stress induces antioxidant enzymes and enhances redox homeostasis [38,39]. Redox homeostasis is essential for antioxidant responses and maintenance of cellular health [40]. Modest increases in ROS can be detoxified by antioxidant enzymes such as catalase and SODs [41]. There are several ways to measure redox status including the ratio of reduced to oxidized glutathione (GSH/GSSG). Glutathione is the major intracellular antioxidant buffer, with a concentration between 2 to 5mM [42]. Glutathione peroxidase (GPx) catalyses H2O2 reduction via H2O2 + 2GSH to GSSG + 2H2O, a reaction that can be reversed by glutathione reductase (GR) [43]. Our data show an initial reduction in GSH/GSSG ratio 3 to 6-hours after H2O2 exposure, with recovery by 24 hours in sensitive donors. This showed that sensitive donors were initially susceptible to OS. The recovery by 24 hours could be due to effective mitohormesis or to the oxidant stressor being consumed. In either case, our data suggest that antioxidant defenses of the epithelium in sensitive donors could cope with a short-term exposure. The epithelial GSH/GSSG ratio from resistant donors was not influenced by H2O2 exposure, demonstrating resistance to induction of OS.
The majority of ATP is synthesized by F1F0ATP synthase (complex V) in the mitochondrial electron transport chain [44]. Protons generated by complexes I, III, and IV drive oxidative phosphorylation of ADP to ATP [25]. Decreased mitochondrial membrane potential can cause a reduction in ATP production. Our data show that H2O2 exposure caused a dose-dependent decrease in cellular ATP. The level of reduction was greater in the sensitive individuals than in the resistant individuals. The most interesting aspect of this result, seen in Figure 4A, was the different baseline levels of cellular ATP between the groups. The resistant individuals had much higher cellular ATP baseline than the sensitive individuals. The ATP concentration is significantly different within different cell types [45], but there is no literature showing differences in cellular ATP levels between individual humans or other living organisms. Our hypothesis is that the resistant individuals have more mitochondria or a greater ability to generate ATP compared with the sensitive individuals. Since mitochondria are involved in cellular metabolic processes and redox regulation [39], this phenomenon might be the key reason for the variability of OS susceptibility that was found in the present study. However, this needs further investigation.
SIRT1 plays an important role in mediating redox signaling [46]. The SIRT1-FOXO3 pathway can enhance activity of antioxidant enzymes, MnSOD and catalase, and promote DNA damage repair [47]. In the present study, H2O2 exposure caused a dose-dependent increase in SIRT1 and FOXO3 mRNA expression in the sensitive group, but not in the resistant group. Up-regulation of SIRT1-FOXO3 signaling pathway indicated that the cells were trying to enhance antioxidant enzyme activity to prevent OS. This is in agreement with a previous study in renal tubular cells, where up-regulated SIRT1-FOXO3 expression protected cells from H2O2 induced apoptosis [48].
Oxidant exposure can induce p53-p21 apoptosis, cell cycle arrest and cellular senescence related pathways [49]. In the present study, H2O2 exposure did not change p53 mRNA expression and significantly increased p21 mRNA expression. This indicated that the oxidant induced increase in p21 might be regulated by a p53 independent pathway, such as PI3K-AKT-p21 pathway [50].
The SIRT1-NRF2 pathway is associated with enhancing the antioxidant enzymes such as glutathione peroxidase [51]. Our data show that H2O2 exposure upregulated SIRT1 mRNA expression, enhanced SIRT1 phosphorylation, NRF2 translocation at approximately 2 to 4-hour, and a recovery in the GSH/GSSG ratio at 24-hour was observed in the sensitive group.
The PINK1-PARKIN complex mediates mitophagy [52]. OS is associated with upregulation of the SIRT1-NRF2-PINK1-PARKIN mitophagy pathway to remove damaged mitochondria [12,53]. In the present study, H2O2 exposure induced PINK1 mRNA upregulation and PARKIN phosphorylation at around 4 to 24-hour, occurring later that up-regulation of SIRT1 and NRF2 nuclear translocation.
The logistics of using primary cells grown into a well-differentiated respiratory epithelium dictated a relatively small sample size compared with cell lines and rodent models. The complexity of the studies limited the numbers of samples that could be included. An increased sample size will be required in future studies to fully explore this phenomenon. Differential responses to oxidant exposure between healthy individuals were demonstrated in the present study. This raises the question of how to identify and protect vulnerable members of the population from environmentally induced OS. A comprehensive survey in a large population may identify factors predisposing individuals to OS.
In summary, the adverse impact of oxidant exposure on cellular and mitochondrial health were discussed in this study. The data presented have demonstrated the significant differences between healthy individual humans with differing susceptibility to OS. Major differences were shown in basal mitochondrial ATP production, activation of the p21 apoptosis pathway, and upregulation of the PINK-PARKIN complex mitophagy pathway. Differences were also shown in mitohormesis with different responses in GSH/GSSG balance following oxidant exposure. The differences between individuals in susceptibility to OS may be attributed to resistant donors having more mitochondria or greater mitochondrial function. These cellular differences may account for the susceptibility of individual humans to environmental stressors. A diagram summarizing the differential pathways between the sensitive and the resistant individuals is shown in Figure 7.
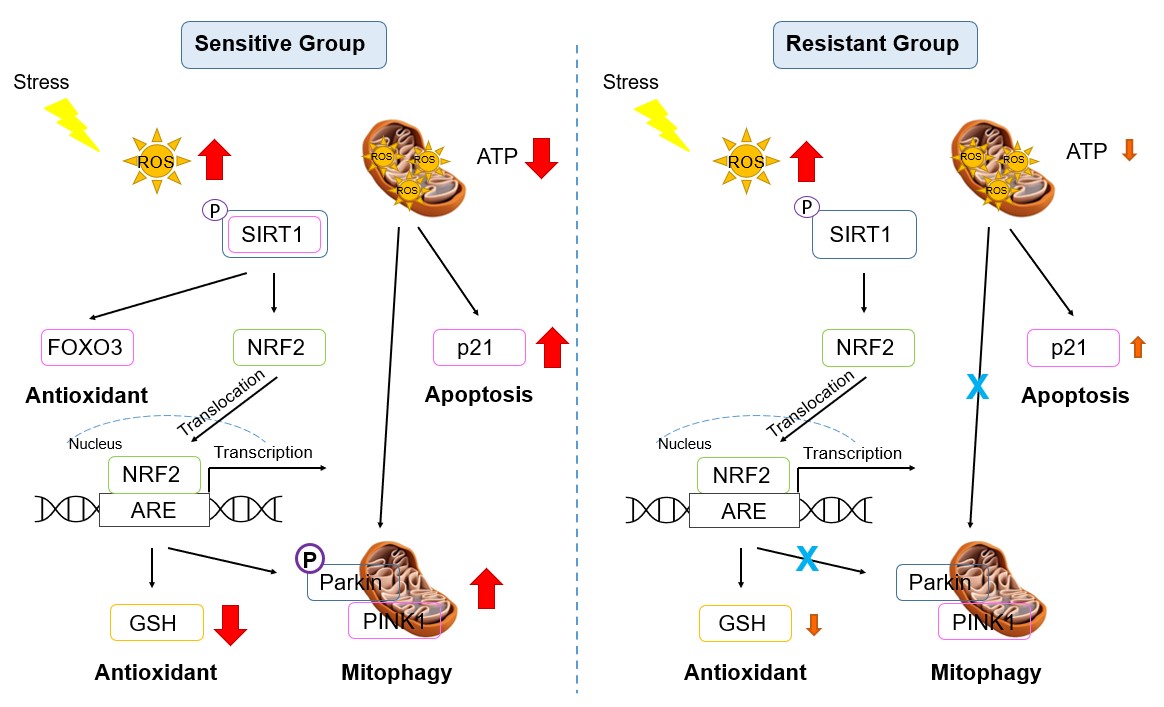
Figure 7. Signaling pathway diagram in the sensitive and resistant groups. Red: significant increase or decrease; Orange: mild increase or decrease.
Conflicts of Interest
The authors declare no competing interests.
Funding
This work was supported by the National Institute of Environmental Health Sciences, USA (3P42ES013648-08A1S1); PDS is supported by the National Health and Medical Research Council, Australia (1102590, 1193840).
Acknowledgments
We would like to extend sincere thanks to all the research participants. Without their passionate participation, the project could not have been successfully conducted.
Author Contributions
Conception and design: AY, PDS, and EF; participant recruitment: AY, PDS, and AH; experimental performance: AY; data analysis and interpretation: AY, PDS, AH, AJY, and EF; statistical analysis: PDS and NB; manuscript preparation: AY, PDS, AH, AJY, and EF.
References
2. Ursini F, Maiorino M, Forman HJ. Redox homeostasis: The Golden Mean of healthy living. Redox biology. 2016 Aug 1;8:205-15.
3. Finkel T, Holbrook NJ. Oxidants, oxidative stress and the biology of ageing. nature. 2000 Nov;408(6809):239-47.
4. Sies H. The concept of oxidative stress after 30 years. In:Biochemistry of oxidative stress. Springer, Cham. 2016; pp. 3-11.
5. Jindal SK. Oxidative stress and antioxidant imbalance: respiratory disorders. Oxidative Stress and Antioxidant Protection: The Science of Free Radical Biology and Disease. 2016 Apr 11:307-18.
6. Barnes PJ. Senescence in COPD and its comorbidities. Annual Review of Physiology. 2017 Feb 10;79:517-39.
7. Montuschi P, Collins JV, Ciabattoni G, Lazzeri N, Corradi M, Kharitonov SA, et al. Exhaled 8-isoprostane as an in vivo biomarker of lung oxidative stress in patients with COPD and healthy smokers. American journal of respiratory and critical care medicine. 2000 Sep 1;162(3):1175-7.
8. Kim SJ, Cheresh P, Jablonski RP, Williams DB, Kamp DW. The role of mitochondrial DNA in mediating alveolar epithelial cell apoptosis and pulmonary fibrosis. International Journal of Molecular Sciences. 2015 Sep 7;16(9):21486-519.
9. Lerner CA, Sundar IK, Rahman I. Mitochondrial redox system, dynamics, and dysfunction in lung inflammaging and COPD. The International Journal of Biochemistry & Cell Biology. 2016 Dec 1;81:294-306.
10. Gispert S, Ricciardi F, Kurz A, Azizov M, Hoepken HH, Becker D, Voos W, et al. Parkinson phenotype in aged PINK1-deficient mice is accompanied by progressive mitochondrial dysfunction in absence of neurodegeneration. PloS one. 2009 Jun 3;4(6):e5777.
11. Palacino JJ, Sagi D, Goldberg MS, Krauss S, Motz C, Wacker M, et al. Mitochondrial dysfunction and oxidative damage in parkin-deficient mice. Journal of Biological Chemistry. 2004 Apr 30;279(18):18614-22.
12. Qiao H, Ren H, Du H, Zhang M, Xiong X, Lv R. Liraglutide repairs the infarcted heart: The role of the SIRT1/Parkin/mitophagy pathway. Molecular Medicine Reports. 2018 Mar 1;17(3):3722-34.
13. Rodgers JT, Lerin C, Haas W, Gygi SP, Spiegelman BM, Puigserver P. Nutrient control of glucose homeostasis through a complex of PGC-1? and SIRT1. Nature. 2005 Mar;434(7029):113-8.
14. Donmez G, Outeiro TF. SIRT1 and SIRT2: emerging targets in neurodegeneration. EMBO Molecular Medicine. 2013 Mar;5(3):344-52.
15. Chung JY, Chen H, Zirkin B. Sirt1 and Nrf2: regulation of Leydig cell oxidant/antioxidant intracellular environment and steroid formation. Biology of Reproduction. 2021 Nov;105(5):1307-16.
16. Barnes PJ, Burney PG, Silverman EK, Celli BR, Vestbo J, Wedzicha JA, et al. Chronic obstructive pulmonary disease. Nature Reviews Disease Primers. 2015 Dec 3;1:15076.
17. van der Vliet A, Janssen-Heininger YM, Anathy V. Oxidative stress in chronic lung disease: From mitochondrial dysfunction to dysregulated redox signaling. Molecular aspects of medicine. 2018 Oct 1;63:59-69.
18. Sachdeva K, Do DC, Zhang Y, Hu X, Chen J, Gao P. Environmental exposures and asthma development: autophagy, mitophagy, and cellular senescence. Frontiers in Immunology. 2019 Nov 29;10:2787.
19. Pezzulo AA, Starner TD, Scheetz TE, Traver GL, Tilley AE, Harvey BG, et al. The air-liquid interface and use of primary cell cultures are important to recapitulate the transcriptional profile of in vivo airway epithelia. American Journal of Physiology-Lung Cellular and Molecular Physiology. 2011 Jan;300(1):L25-31.
20. Müller L, Brighton LE, Carson JL, Fischer II WA, Jaspers I. Culturing of human nasal epithelial cells at the air liquid interface. JoVE (Journal of Visualized Experiments). 2013 Oct 8(80):e50646.
21. Srinivasan B, Kolli AR, Esch MB, Abaci HE, Shuler ML, Hickman JJ. TEER measurement techniques for in vitro barrier model systems. SLAS Technology. 2015 Apr 1;20(2):107-26.
22. Turksen K. Permeability Barrier: Methods and Protocols. Methods in Molecular Biology, Springer Protocols, 2011; p.763.
23. Schindelin J, Arganda-Carreras I, Frise E, Kaynig V, Longair M, Pietzsch T, et al. Fiji: an open-source platform for biological-image analysis. Nature Methods. 2012 Jul;9(7):676-82.
24. Schagen J, Sly PD, Fantino E. Characterizing well-differentiated culture of primary human nasal epithelial cells for use in wound healing assays. Laboratory Investigation. 2018 Nov;98(11):1478-86.
25. Van der Bliek AM, Sedensky MM, Morgan PG. Cell biology of the mitochondrion. Genetics. 2017 Nov 1;207(3):843-71.
26. Parker D, Prince A. Innate immunity in the respiratory epithelium. American journal of respiratory cell and Molecular Biology. 2011 Aug;45(2):189-201.
27. Hsu JY, Chu JJ, Chou MC, Chen YW. Dioscorin pre-treatment protects A549 human airway epithelial cells from hydrogen peroxide-induced oxidative stress. Inflammation. 2013 Oct;36(5):1013-9.
28. Boers JE, Ambergen AW, Thunnissen FB. Number and proliferation of basal and parabasal cells in normal human airway epithelium. American Journal of Respiratory and Critical Care Medicine. 1998 Jun 1;157(6):2000-6.
29. Tam A, Wadsworth S, Dorscheid D, Man SP, Sin DD. The airway epithelium: more than just a structural barrier. Therapeutic Advances in Respiratory Disease. 2011 Aug;5(4):255-73.
30. Upadhyay S, Palmberg L. Air-liquid interface: relevant in vitro models for investigating air pollutant-induced pulmonary toxicity. Toxicological Sciences. 2018 Jul 1;164(1):21-30.
31. Morris AA, Zhao L, Patel RS, Jones DP, Ahmed Y, Stoyanova N, et al. Differences in systemic oxidative stress based on race and the metabolic syndrome: the Morehouse and Emory Team up to Eliminate Health Disparities (META-Health) study. Metabolic Syndrome and Related Disorders. 2012 Aug 1;10(4):252-9.
32. Ortega VE, Meyers DA. Pharmacogenetics: implications of race and ethnicity on defining genetic profiles for personalized medicine. Journal of Allergy and Clinical Immunology. 2014 Jan 1;133(1):16-26.
33. Zhang J, Ye ZW, Townsend DM, Hughes-Halbert C, Tew KD. Racial disparities, cancer and response to oxidative stress. Advances in Cancer Research. 2019 Jan 1;144:343-83.
34. Wright DT, Cohn LA, Li H, Fischer B, Li CM, Adler KB. Interactions of oxygen radicals with airway epithelium. Environmental Health Perspectives. 1994 Dec;102(suppl 10):85-90.
35. Liu X, Chen Z. The pathophysiological role of mitochondrial oxidative stress in lung diseases. Journal of Translational Medicine. 2017 Dec;15(1):1-3.
36. Han Y, Li X, Yan M, Yang M, Wang S, Pan J, et al. Oxidative damage induces apoptosis and promotes calcification in disc cartilage endplate cell through ROS/MAPK/NF-?B pathway: Implications for disc degeneration. Biochemical and Biophysical Research Communications. 2019 Aug 27;516(3):1026-32.
37. Tapia PC. Sublethal mitochondrial stress with an attendant stoichiometric augmentation of reactive oxygen species may precipitate many of the beneficial alterations in cellular physiology produced by caloric restriction, intermittent fasting, exercise and dietary phytonutrients:“Mitohormesis” for health and vitality. Medical Hypotheses. 2006 Jan 1;66(4):832-43.
38. Musci RV, Hamilton KL, Linden MA. Exercise-induced mitohormesis for the maintenance of skeletal muscle and healthspan extension. Sports. 2019 Jul 11;7(7):170.
39. Palmeira CM, Teodoro JS, Amorim JA, Steegborn C, Sinclair DA, Rolo AP. Mitohormesis and metabolic health: The interplay between ROS, cAMP and sirtuins. Free Radical Biology and Medicine. 2019 Sep 1;141:483-91.
40. Ayer A, Gourlay CW, Dawes IW. Cellular redox homeostasis, reactive oxygen species and replicative ageing in Saccharomyces cerevisiae. FEMS Yeast Research. 2014 Feb 1;14(1):60-72.
41. Checa J, Aran JM. Airway redox homeostasis and inflammation gone awry: from molecular pathogenesis to emerging therapeutics in respiratory pathology. International Journal of Molecular Sciences. 2020 Dec 7;21(23):9317.
42. Foyer CH, Noctor G. Redox homeostasis and antioxidant signaling: a metabolic interface between stress perception and physiological responses. The Plant Cell. 2005 Jul;17(7):1866-75.
43. Li S, Yan T, Yang JQ, Oberley TD, Oberley LW. The role of cellular glutathione peroxidase redox regulation in the suppression of tumor cell growth by manganese superoxide dismutase. Cancer Research. 2000 Jul 15;60(14):3927-39.
44. Zhao RZ, Jiang S, Zhang L, Yu ZB. Mitochondrial electron transport chain, ROS generation and uncoupling. International Journal of Molecular Medicine. 2019 Jul 1;44(1):3-15.
45. Bonora M, Patergnani S, Rimessi A, De Marchi E, Suski JM, Bononi A, et al. ATP synthesis and storage. Purinergic Signalling. 2012 Sep;8(3):343-57.
46. Ren Z, He H, Zuo Z, Xu Z, Wei Z, Deng J. The role of different SIRT1-mediated signaling pathways in toxic injury. Cellular & Molecular Biology Letters. 2019 Dec;24(1):1-0.
47. Brunet A, Sweeney LB, Sturgill JF, Chua KF, Greer PL, Lin Y, et al. Stress-dependent regulation of FOXO transcription factors by the SIRT1 deacetylase. Science. 2004 Mar 26;303(5666):2011-5.
48. Hasegawa K, Wakino S, Yoshioka K, Tatematsu S, Hara Y, Minakuchi H, et al. Sirt1 protects against oxidative stress-induced renal tubular cell apoptosis by the bidirectional regulation of catalase expression. Biochemical and Biophysical Research Communications. 2008 Jul 18;372(1):51-6.
49. Beyfuss K, Hood DA. A systematic review of p53 regulation of oxidative stress in skeletal muscle. Redox Report. 2018 Jan 1;23(1):100-17.
50. Karimian A, Ahmadi Y, Yousefi B. Multiple functions of p21 in cell cycle, apoptosis and transcriptional regulation after DNA damage. DNA Repair. 2016 Jun 1;42:63-71.
51. Jin X, Fu W, Zhou J, Shuai N, Yang Y, Wang B. Oxymatrine attenuates oxidized low?density lipoprotein?induced HUVEC injury by inhibiting NLRP3 inflammasome?mediated pyroptosis via the activation of the SIRT1/Nrf2 signaling pathway. International Journal of Molecular Medicine. 2021 Oct 1;48(4):1-2.
52. Tanaka K. The PINK1–Parkin axis: an overview. Neuroscience Research. 2020 Oct 1;159:9-15.
53. Murata H, Takamatsu H, Liu S, Kataoka K, Huh NH, Sakaguchi M. NRF2 regulates PINK1 expression under oxidative stress conditions. PloS one. 2015 Nov 10;10(11):e0142438.