
Parkinson’s disease classification with CWNN: Using wavelet transformations and IMU data fusion for improved accuracy
Abstract
BACKGROUND:
Parkinson’s disease (PD) is a chronic neurodegenerative disorder characterized by motor impairments and various other symptoms. Early and accurate classification of PD patients is crucial for timely intervention and personalized treatment. Inertial measurement units (IMUs) have emerged as a promising tool for gathering movement data and aiding in PD classification.
OBJECTIVE:
This paper proposes a Convolutional Wavelet Neural Network (CWNN) approach for PD classification using IMU data. CWNNs have emerged as effective models for sensor data classification. The objective is to determine the optimal combination of wavelet transform and IMU data type that yields the highest classification accuracy for PD.
METHODS:
The proposed CWNN architecture integrates convolutional neural networks and wavelet neural networks to capture spatial and temporal dependencies in IMU data. Different wavelet functions, such as Morlet, Mexican Hat, and Gaussian, are employed in the continuous wavelet transform (CWT) step. The CWNN is trained and evaluated using various combinations of accelerometer data, gyroscope data, and fusion data.
RESULTS:
Extensive experiments are conducted using a comprehensive dataset of IMU data collected from individuals with and without PD. The performance of the proposed CWNN is evaluated in terms of classification accuracy, precision, recall, and F1-score. The results demonstrate the impact of different wavelet functions and IMU data types on PD classification performance, revealing that the combination of Morlet wavelet function and IMU data fusion achieves the highest accuracy.
CONCLUSION:
The findings highlight the significance of combining CWT with IMU data fusion for PD classification using CWNNs. The integration of CWT-based feature extraction and the fusion of IMU data from multiple sensors enhance the representation of PD-related patterns, leading to improved classification accuracy. This research provides valuable insights into the potential of CWT and IMU data fusion for advancing PD classification models, enabling more accurate and reliable diagnosis.
1.Introduction
Parkinson’s disease (PD) is a progressive neurodegenerative disorder that affects movement, balance, and coordination. The symptoms of PD typically develop gradually over time, and can include tremor, rigidity, bradykinesia, and postural instability [1]. There is currently no cure for PD, but there are treatments that can help to manage the symptoms. Therefore, early diagnosis is playing a crucial role in optimizing treatment outcomes and improving the overall management of Parkinson’s disease [2], which can slow the progression of the disease and improve quality of life. Various traditional techniques are used for early diagnosis of Parkinson’s disease, including clinical assessment by using rating scales to assess the stage of Parkinson’s disease. The most two common used rating tools are the Hoehn and Yahr scale and the Unified Parkinson’s Disease Rating Scale (UPDRS) [3]. In addition, biomarkers and imaging are other types of diagnostic techniques that show any changes in the patient’s brain using Magnetic resonance imaging (MRI), Single-photon emission computed tomography (SPECT) or Positron emission tomography (PET) [2, 4]. However, there is no single test that can definitively diagnose Parkinson’s, so a combination of techniques is often used. In addition, there are a number of emerging technologies with the potential to improve the early diagnosis of Parkinson’s disease, including machine learning algorithms, which can be used to analyze data from clinical assessments, imaging tests, and biomarkers to identify patterns that are associated with Parkinson’s disease [5]. Also, wireless sensors which are used to track movement and other functions that can be affected by Parkinson’s disease. This data is used to monitor the progression of the disease and to identify early signs of relapse [6].
Inertial Measurement Unit (IMU) is a common wireless device that combines multiple sensors, such as accelerometers and gyroscopes, to measure and record motion-related data. IMUs play a significant role in assessing and analyzing movement patterns and gait for PD diagnosis and classification [7]. The key role of each sensor is that accelerometers measure the acceleration of the body, which is used to track tremor and bradykinesia, while gyroscopes measure the rotation of the body which is used to track gait and posture. This paper presents a PD classification approach based on deep learning using IMU data that was collected from IMU sensors attached to the lower limbs (thigh, shank, and foot) of both sides (right and left).
2.Related work
2.1Feature-based approaches
Feature-based methods are commonly used for PD classification with IMU data. These methods involve selecting specific features of the IMU sensor data that are relevant to PD classification and using machine learning algorithms to classify the data based on these features [7, 8]. The features selected can have a large variation depending on the study such as:
• Joint Range of Motion: This technique involves extracting features based on the range of motion of specific joints, such as the knee or ankle. It has been found to be more accurate than spatiotemporal parameters in PD classification [7].
• Spatiotemporal Parameters: These parameters capture the spatial and temporal characteristics of gait, such as step length, stride length, and gait speed. They can provide valuable information for PD classification [7].
• Time-Domain Features: Time-domain features include mean, variance, standard deviation, root mean square, zero or mean crossing rate, derivative, and peak counts. These features capture different aspects of the IMU data and can be used for PD classification [9].
• Angular Velocity: Angular velocity is a feature extracted from IMU data that measures the rate of change of the orientation of a body segment. It can provide valuable information about movement patterns and can be used for PD classification [10].
Feature based methods have been using several machine learning algorithms for PD classification including Support Vector Machine (SVM) which is the most common algorithm for classification tasks, it performs by finding the hyperplane that best separates the two classes of data. Trabassi et al. [8] show that SVM based classification method outperformed Decision Trees (DT) in predicting subjects with Parkinson’s from healthy subjects. DT is a simple yet effective algorithm for classification, it works by recursively partitioning the data into smaller subsets until the desired classification or regression is achieved. DT has been used in gait analysis studies for classifying gait abnormalities in people with Parkinson’s disease [8]. Random Forest (RF) is an set of learning algorithm that combines multiple DTs to improve the classification accuracy and make predictions [8], by randomly selecting features and splitting points when constructing the DTs. K-Nearest Neighbors (KNN) is a non-parametric algorithm that classifies data based on the majority vote of its k nearest neighbors. It has been explored for PD classification using IMU data [7]. The main problems related to using machine learning algorithms for PD classification is having lower classification accuracy compared to Deep Learning (DL) approaches and they may not be able to capture complex patterns in the IMU data.
2.2Deep learning approaches
Identify applicable funding agency here. If none, delete this text box.
Different deep learning algorithms used in literature for PD classification and are more suitable to IMU data:
• Convolutional neural networks (CNNs) typically have a number of convolutional layers, followed by a number of pooling layers. The convolutional layers learn to identify patterns in the data that are relevant for classification, while the pooling layers reduce the size of the data and help to prevent overfitting [11].
• Recurrent neural networks (RNNs) are able to learn long-term dependencies in the data [11]. It has a number of hidden layers containing neurons which they learn to represent the temporal dynamics of the data. This makes them well-suited for tasks such as PD classification, where the symptoms of PD can vary over time.
• Long short-term memory (LSTM) networks are a type of RNN that is specifically designed to learn long-term dependencies in the data. It has a number of gates that control the flow of information through the network. These gates allow LSTMs to learn to forget irrelevant information and remember relevant information over long periods of time [11].
• Gated recurrent unit (GRU) networks are a type of RNN that are similar to LSTMs but have fewer gates. The gates in GRUs are reset and update gates, which control the flow of information in the network [12].
Several research studies have investigated the use of CNNs for PD classification using IMU data. Yeon-Wook et al. [13] demonstrated a CNN-bidirectional-GRU model that showed better classification performance for clinical balance assessment using IMU data. In a study by Celik et al. [14], CNN architectures with a small number of deep layers achieved high accuracy for inertial sensor-based activity recognition in neurological populations. In a paper by Carvajal-Castaño et al. [15], raw gait signals captured using IMU sensors were used to assess the ability of different deep learning architectures to classify PD patients vs. healthy controls. The study found that CNN and GRU based model achieved the highest accuracy of 92.6% for temporal and spectral information extracted from IMU data. In the work suggested by Bikias et al. [16], a deep learning model was used to detect freezing of gait (FoG) episodes in PD patients using IMU data. The study found that the model achieved high accuracy and sensitivity in detecting FoG episodes. Alissa et al. [17] suggest to use used CNNs for PD diagnosis using figure-copying tasks. The study aimed to contribute to the PD diagnosis process by using CNNs to classify PD patients based on their ability to copy figures. A systematic review by Sigcha et al. [18] found that different deep learning models, including hybrid models, showed higher performance for the diagnosis and monitoring of PD using wearable sensors.
Convolutional wavelet neural network (CWNN) is a type of neural network that combines combine the spatial and frequency-domain processing capabilities of CNNs wavelet transformation (WT). This type of deep learning is usually used for pattern recognition tasks and image classification, which it shows higher performance and improved accuracy [19, 20]. To our knowledge, there is no study that shows the performance of CWNN for PD classification with IMU data. Therefore, this work shows preliminary performance results for PD classification based on CWNN.
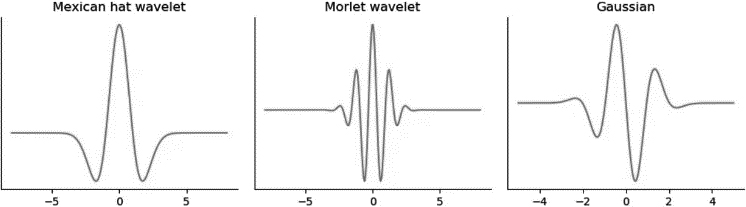
Figure 1.
Shape of the Mexican hat, Morlet and Gaussian mother wavelets.
3.Proposed method
3.1Background
Wavelet Transform (WT) is a transformation technique used for analyzing signals and data in both the time and frequency domains. It decomposes a signal into a set of wavelet functions, which are scaled and shifted versions of a mother wavelet function according to defined scale factor [21]. The general function of the WT can be described as follows. Given a signal
(1)
where
(2)
WT has several properties including: time-frequency localization where wavelets offer good localization properties by capturing both temporal and frequency information of a signal. This allows for a detailed analysis of signal characteristics at different scales. Multi-Resolution Analysis properties where WT can analyze the different levels of detail in the signal. This is achieved by dilating and translating the wavelet function to cover different time-frequency regions. Also, Shift Invariance property which is useful for analyzing signals with non-stationary properties. The above properties are suitable for the nature of signals collected from the IMU sensors. The scale factor defines signal scaling over time and it is inversely proportional to frequency, where small scale factor captures higher frequencies while large scale factor shows the lower frequencies in the signal [19]. Most common mother wavelet functions in continuous wavelet transformation (CWT) are Mexican hat, Morlet and Gaussian wavelet functions.
3.2Proposed method
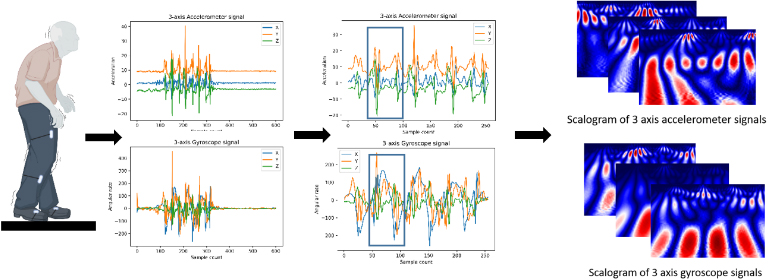
Two main steps constitute the proposed method. The first step is related to data collection and preprocessing. IMU sensors are attached to the lower limbs for both left and right side. The data collected is in the form of 3D accelerometer signals and 3D gyroscope signals along with x, y and z axis. The signals are segmented and synchronized. A sliding window with predefined size and 50% overlap is used to apply CWT on each signal to get 2D image representation with three channels for both accelerometer data and gyroscope data Fig. 2. The size of the sliding windows is chosen to be equal to the predefined scaling factor to get squared shape of the input images.
Figure 2.
Placement of IMU sensors and wavelet extraction from preprocessed IMU data.
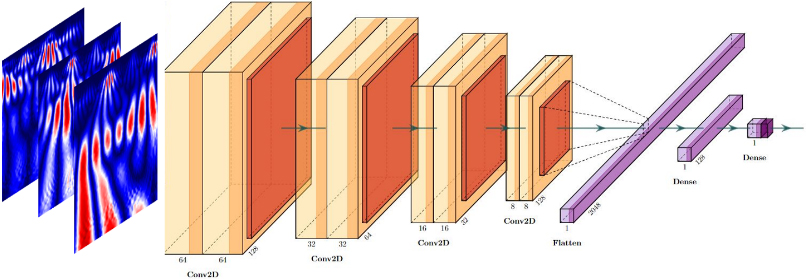
The second step is training the CNN model. The architecture contains four sets of convolutional layers, two sets of fully connected layers and max-pooling layers between each of the above layers Fig. 3.
4.Results
4.1Dataset
Lower limb kinematics data was collected at Vilnius University Hospital Santaros Klinikos Centre of Neurology, under the supervision of medical professionals [22]. The research involved two groups of subjects: (PD) group represents individuals with Parkinson’s disease, and (CO) group consisting of healthy control individuals. PD groups are characterized with UPDRS III as clinical assessment. The gait difficulty was defined as normal gait or walks slowly with possibility of shuffle with short steps, but no festination or propulsion and no major difficulties were found.
The PD group’s inclusion criteria comprised being an adult with a disease severity between 2 and 3 on the Hoehn and Yahr scale and having the ability to walk without assistance. Exclusion criteria included the presence of other movement-impairing diseases. For the CO group, participants were included if they had no injuries or illnesses that could affect their movement. All procedures adhered to the ethical guidelines set by the local (Vilnius University Hospital Santaros Klinikos).
Table 1
Subject demographic data
| Group |
| Age (mean | Total UPDRS score (mean | UPDRS III score (mean |
|---|---|---|---|---|
| PD | 14 | 61.05 | 39.17 | 26.45 |
| CO | 9 | 57.83 | – | – |
Figure 3.
CNN with LeNet-5 architecture with max pooling and ReLU activation.
To measure motor tasks, six wireless IMUs (Shimmer Research, Dublin, Ireland) was attached to the subjects’ limbs using mounting straps Fig. 2. The IMU’s kinematic data was sampled at a frequency of 51.2 Hz and transmitted via Bluetooth to a laptop for processing. The movement task involved walking five meters in a straight line, with clearly marked start and end points. Participants were instructed to begin walking upon a verbal command. Each participant performed the task three times at their chosen comfortable speed.
4.2Training and testing results
The scale factor chosen for this experiment is 64. In general, a smaller size of scales enables more focus of abrupt changes on the signal. These fast changes are usually the most important characteristics. In addition, a large range of scales provides more information about slow changes, which can produce better classification accuracy. However, it needs a deeper and complex CNN. After an exhaustive training of the model with different scaling factors, a scale of 64 helps to reach a good prediction accuracy.
Accordingly, sliding windows in the preprocessing steps are with size 64 and overlap of 50%. The proposed CWNN is trained for input data of 3D accelerometer signals, 3D gyroscope signals and data fusion which is a combination of accelerometer and gyroscope signals leading to have input image with six channels. The model was evaluated with different mother wavelet function such as Marlet, Mexican hat and Gaussian wavelets.
Table 2
Subject demographic data
| Signals | Morlet wavelet | Mexican hat wavelet | Gaussian wavelet |
|---|---|---|---|
| Accelerometer signals | Acc | Acc | Acc |
| Gyroscope signals | Acc | Acc | Acc |
| Fusion signals | Acc | Acc | Acc |
Figure 4.
Accuracy of the training and validation of CWNN with fusion data using Morlet function.
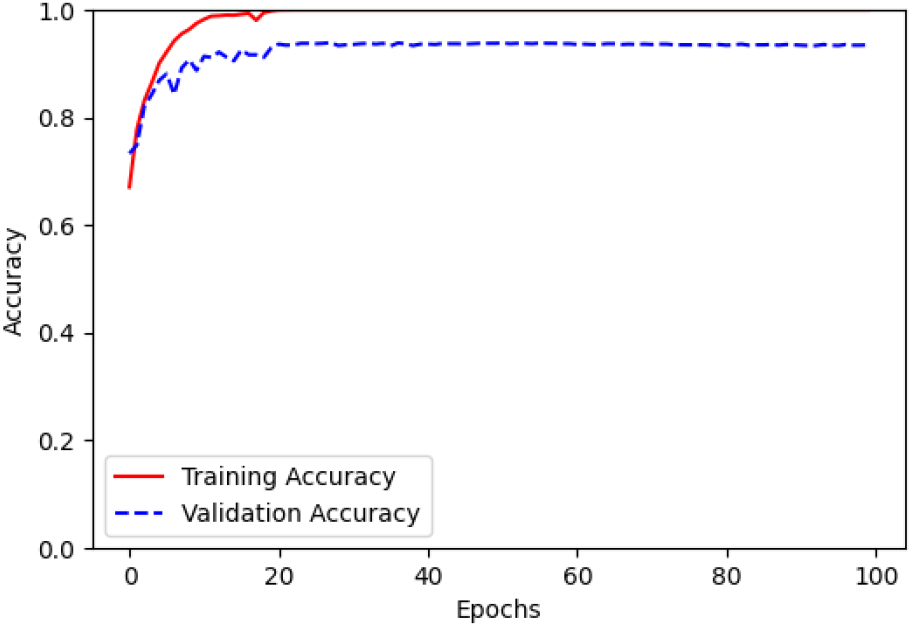
Figure 5.
Loss of the training and validation of CWNN with fusion data using Morlet function.
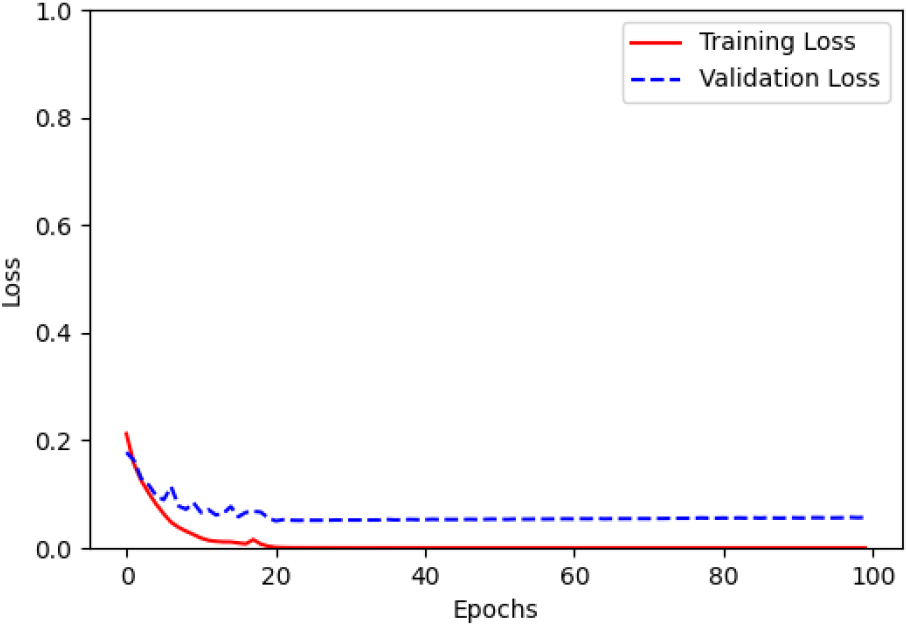
The comparison results are demonstrated in terms of several metric values such as: accuracy (acc), precision (Prec), recall, F1-score and loss functions Table 2. The above values in the comparison table shows that:
In general, CWNN achieves higher accuracy performance regardless of the many critical factors such as: type of signals (acceleration, angular rate or fusion), the position of the sensors in different part of lower limbs (thigh, shank or foot) and the type of mother wavelet function.
In particular, CWNN with fusion signals using Morlet function, outperform in term of predefined comparison metrics the other type of signals along with the remaining tested mother wavelet function.
5.Discussion and conclusion
This work introduces a CWNN approach for the classification of PD using MU data. PD is a chronic neurodegenerative disorder that requires early and accurate classification for timely intervention and personalized treatment. IMUs have emerged as a non-invasive and promising tool for collecting movement data and aiding in PD classification.
The objective of this study was to determine the optimal combination of wavelet transformation and IMU data type that achieves the highest classification accuracy for PD. The proposed CWNN architecture integrates convolutional neural networks and wavelet transformation to capture both spatial and temporal dependencies in the IMU data. Different wavelet functions, including Morlet, Mexican Hat, and Gaussian, were evaluated in the continuous wavelet transformation (CWT) step. The CWNN was trained and evaluated using various combinations of accelerometer data, gyroscope data, and fusion data. To assess the performance of the CWNN, extensive experiments were conducted using a comprehensive dataset of IMU data collected from individuals with and without PD. The evaluation metrics used included classification accuracy, precision, recall, and F1-score.
The results demonstrated the significant impact of different wavelet functions and IMU data types on PD classification performance. Notably, the combination of the Morlet wavelet function and IMU data fusion achieved the highest accuracy up to 94%. This suggests that integrating CWT-based feature extraction with the fusion of IMU data enhances the representation and discriminative power for PD classification using CWNNs.
6.Conclusion
The preliminary results of the research highlight the significance of leveraging the CWT approach along with raw IMU data fusion for accurate PD classification using CWNNs. The findings contribute valuable insights into the design of effective models for sensor data classification, which could have practical applications in early diagnosis and personalized treatment of PD patients. The proposed CWNN framework presents a promising direction for further advancements in PD classification and opens avenues for future research in the field of neurodegenerative disorder detection and management.
Acknowledgments
Special thanks are due to the Clinics of Neurology and Neurosurgery at Vilnius University Hospital Santaros Klinikos Centre of Neurology.
Conflict of interest
None to report.
References
[1] | Balestrino R, Schapira AH. Parkinson disease. European Journal of Neurology. (2020) Jan; 27: (1): 27-42. |
[2] | Pagan FL. Improving outcomes through early diagnosis of Parkinson’s disease. American Journal of Managed Care. (2012) Sep 1; 18: (7): S176. |
[3] | Kanellos FS, Tsamis KI, Rigas G, Simos YV, Katsenos AP, Kartsakalis G, Fotiadis DI, Vezyraki P, Peschos D, Konitsiotis S. Clinical Evaluation in Parkinson’s Disease: Is the Golden Standard Shiny Enough? Sensors. (2023) Apr 7; 23: (8): 3807. |
[4] | Hustad E, Aasly JO. Clinical and imaging markers of prodromal Parkinson’s disease. Frontiers in Neurology. (2020) May 8; 11: : 395. |
[5] | Mei J, Desrosiers C, Frasnelli J. Machine learning for the diagnosis of Parkinson’s disease: a review of literature. Frontiers in aging neuroscience. (2021) May 6; 13: : 633752. |
[6] | Lu R, Xu Y, Li X, Fan Y, Zeng W, Tan Y, Ren K, Chen W, Cao X. Evaluation of wearable sensor devices in Parkinson’s disease: A review of current status and future prospects. Parkinson’s Disease. (2020) Sep 23; 2020: : 1-8. |
[7] | Caramia C, Torricelli D, Schmid M, Muñoz-Gonzalez A, Gonzalez-Vargas J, Grandas F, Pons JL. IMU-based classification of Parkinson’s disease from gait: A sensitivity analysis on sensor location and feature selection. IEEE Journal of Biomedical and Health Informatics. (2018) Aug 13; 22: (6): 1765-74. |
[8] | Trabassi D, Serrao M, Varrecchia T, Ranavolo A, Coppola G, De Icco R, Tassorelli C, Castiglia SF. Machine learning approach to support the detection of Parkinson’s disease in IMU-based Gait analysis. Sensors. (2022) May 12; 22: (10): 3700. |
[9] | Steven Eyobu O, Han DS. Feature representation and data augmentation for human activity classification based on wearable IMU sensor data using a deep LSTM neural network. Sensors. (2018) Aug 31; 18: (9): 2892. |
[10] | Kwon SB, Park JH, Kwon C, Kong HJ, Hwang JY, Kim HC. An energy-efficient algorithm for classification of fall types using a wearable sensor. IEEE Access. (2019) Mar 4; 7: : 31321-9. |
[11] | Alzubaidi L, Zhang J, Humaidi AJ, Al-Dujaili A, Duan Y, Al-Shamma O, Santamaría J, Fadhel MA, Al-Amidie M, Farhan L. Review of deep learning: Concepts, CNN architectures, challenges, applications, future directions. Journal of big Data. (2021) Dec; 8: : 1-74. |
[12] | Cahuantzi R, Chen X, Güttel S. A comparison of LSTM and GRU networks for learning symbolic sequences. InScience and Information Conference (2023) Jul 13 (pp. 771-785). Cham: Springer Nature Switzerland. |
[13] | Kim YW, Joa KL, Jeong HY, Lee S. Wearable IMU-based human activity recognition algorithm for clinical balance assessment using 1D-CNN and GRU ensemble model. Sensors. (2021) Nov 17; 21: (22): 7628. |
[14] | Celik Y, Aslan MF, Sabanci K, Stuart S, Woo WL, Godfrey A. Improving inertial sensor-based activity recognition in neurological populations. Sensors. (2022) Dec 15; 22: (24): 9891. |
[15] | Carvajal-Castaão HA, Pérez-Toro PA, Orozco-Arroyave JR. Classification of parkinson’s disease patients – a deep learning strategy. Electronics. (2022) Aug 27; 11: (17): 2684. |
[16] | Bikias T, Iakovakis D, Hadjidimitriou S, Charisis V, Hadjileontiadis LJ. DeepFoG: an IMU-based detection of freezing of gait episodes in Parkinson’s disease patients via deep learning. Frontiers in Robotics and AI. (2021) May 7; 8: : 537384. |
[17] | Alissa M, Lones MA, Cosgrove J, Alty JE, Jamieson S, Smith SL, Vallejo M. Parkinson’s disease diagnosis using convolutional neural networks and figure-copying tasks. Neural Computing and Applications. (2022) Jan 1: : 1-21. |
[18] | Sigcha L, Borzì L, Amato F, Rechichi I, Ramos-Romero C, Cárdenas A, Gascó L, Olmo G. Deep learning and wearable sensors for the diagnosis and monitoring of Parkinson’s disease: A systematic review. Expert Systems with Applications. (2023) May 27: : 120541. |
[19] | Liu J, Li P, Tang X, Li J, Chen J. Research on improved convolutional wavelet neural network. Scientific Reports. (2021) Sep 9; 11: (1): 17941. |
[20] | Wang J, Deng Z. A deep graph wavelet convolutional neural network for semi-supervised node classification. In 2021 International Joint Conference on Neural Networks (IJCNN) 2021 Jul 18 (pp. 1-8). IEEE. |
[21] | Akansu AN, Haddad RA. Multiresolution signal decomposition: transforms, subbands, and wavelets. Academic press, (2001) . |
[22] | Lukšys D, Jatužis D, Jonaitis G, Griškevičius J. Application of continuous relative phase analysis for differentiation of gait in neurodegenerative disease. Biomedical Signal Processing and Control. (2021) May 1; 67: : 102558. |

