
Reconstruction and optimization of the 3D geometric anatomy structure model for subject-specific human knee joint based on CT and MRI images
Abstract
BACKGROUND:
Nowadays, the total knee arthroplasty (TKA) technique plays an important role in surgical treatment for patients with severe knee osteoarthritis (OA). However, there are still several key issues such as promotion of osteotomy accuracy and prosthesis matching degree that need to be addressed.
OBJECTIVE:
It is significant to construct an accurate three-dimensional (3D) geometric anatomy structure model of subject-specific human knee joint with major bone and soft tissue structures, which greatly contributes to obtaining personalized osteotomy guide plate and suitable size of prosthesis.
METHODS:
Considering different soft tissue structures, magnetic resonance imaging (MRI) scanning sequences involving two-dimensional (2D) spin echo (SE) sequence T1 weighted image (T1WI) and 3D SE sequence T2 weighted image (T2WI) fat suppression (FS) are selected. A 3D modeling methodology based on computed tomography (CT) and two sets of MRI images is proposed.
RESULTS:
According to the proposed methods of image segmentation and 3D model registration, a novel 3D knee joint model with high accuracy is finally constructed. Furthermore, remeshing is used to optimize the established model by adjusting the relevant parameters.
CONCLUSIONS:
The modeling results demonstrate that reconstruction and optimization model of 3D knee joint can clearly and accurately reflect the key characteristics, including anatomical structure and geometric morphology for each component.
1.Introduction
Reconstruction of three-dimensional (3D) object or 3D scene [1, 2, 3, 4, 5] is an active core research direction in computer vision and graphics fields. 3D reconstruction has vast applications in reverse engineering, unknown environment exploration of mobile robots, protection of cultural relics, film and television production, game development, architectural design, clinical medicine, etc. With the fast development of computer image processing technology and digital medical imaging technology, 3D model reconstruction based on medical images in the medical treatment field has great value and significance, such as in clinical diagnosis [6, 7], virtual surgical planning [8, 9, 10], implant design [11, 12, 13], finite element analysis [14, 15, 16, 17, 18], and so on.
Osteoarthritis (OA), also known as degenerative arthritis or degenerative joint disease [19, 20], is the major cause of joint pain and disability [21, 22]. It is reported that there are 355 million people suffering from different degrees of OA in the world, and the total number of OA in China has exceeded 150 million [23]. Clinically, the proportion of patients with knee OA is the highest among all OA. Knee OA is the most common form of arthritis [24], and its incidence rate increases with age and obesity [25]. The treatment of knee OA is considered as an urgent and pressing need for the middle-aged and elderly people, since it seriously affects the patients’ quality of life. At present, one of the most reliable and effective surgical treatments for patients with severe knee OA in clinical practice is total knee arthroplasty (TKA), which is used to restore the normal function of knee joint and alleviate knee pain [26, 27]. However, traditional TKA generally makes preoperative preparation and planning on the basis of patients’ two-dimensional (2D) X-ray image examination, and anatomical landmarks and axis of 3D knee joint are also only located by doctors’ clinical experience and subjective sensory judgment during surgery [28, 29]. There is a greater possibility of osteotomy error when osteotomy instrument is installed by locating device due to the large individual differences, which may considerably affect the recovery of knee joint function and service life of prosthesis after surgery. In addition, the current mismatch conditions of knee joint prosthesis still exist. Therefore, it is of great clinical value and academic significance to construct an accurate 3D digital geometric anatomy structure model of subject-specific human knee joint including major bone and soft tissue structures. For one thing, the intuitive and clear 3D digital anatomy structure model can be used to simulate virtual surgery, which is convenient for doctors to make a precise operative treatment planning and simulation exercise before surgery. For another, the geometric dimension parameters are measured by the reconstructed 3D knee joint model, so as to select the suitable size of prosthesis. Besides, the measured data is also used to obtain personalized osteotomy guide plate, which can assist doctors to complete the accurate osteotomy operation during TKA surgery.
To date, domestic and oversea scholars have done much research on reconstruction of 3D digital geometric anatomy structure model for human knee joint based on medical images. It can be found from the published literature that there are two main kinds of methods. The first method is 3D model reconstruction in accordance with single-modality medical image such as computed tomography (CT) [30, 31, 32, 33, 34, 35, 36] or magnetic resonance imaging (MRI) [37, 38, 39, 40, 41, 42, 43, 44, 45, 46]. The second method is to reconstruct more complete and accurate 3D model based on multi-modality medical images such as CT and MRI [47, 48, 49, 50, 51, 52, 53, 54, 55, 56, 57]. Considering that CT has high resolution for bone tissue, 3D bony structures model of human knee joint is generally reconstructed based on CT images. Because resolution and contrast of soft tissue are poor in CT images, early 3D model reconstruction of soft tissue structures is achieved by virtue of direct digitization and measurements [30], or laser-based 3D coordinate digitizing system [31]. Although 3D soft tissue structures model can also be reconstructed based on CT images, the selection of threshold value is vital for the modeling results [33, 34, 35]. That is, if the threshold is not selected appropriately, the accuracy of the reconstructed 3D model may be greatly affected. Compared with CT, MRI has a better resolution for soft tissue, but poorer for bone tissue. Moreover, the clarity of display soft tissue structures (e.g., menisci and articular cartilages) is different under the same MRI sequence images. In view of their respective shortcomings, a long time manual segmentation is spent or a complex segmentation algorithm is adopted on image segmentation of the corresponding tissues. Even so, the generated models are likely to be inaccurate. Thus, 3D reconstruction of bone and soft tissue structures by combining CT images with MRI images of different sequences can better utilize their advantages. The 3D reconstruction methods based on multi-modality medical images can also be divided into two cases. The first case is based on registration and fusion of CT and MRI images to construct a complete 3D knee joint model [49, 51, 52, 53]. In the second case, the reconstructed 3D bone and soft tissue models are imported into reverse engineering software such as Geomagic Studio or RapidForm to process and register, respectively [48, 50, 54, 55, 56].
The main objective of this study is to reconstruct an accurate 3D geometric anatomy structure model of subject-specific human knee joint including major bone and soft tissue structures through 3D computer aided design (CAD) digital modeling. The constructed 3D knee joint model consists of distal femur (DF), proximal tibia (PT), medial meniscus (MM), lateral meniscus (LM), femoral articular cartilage (FAC), medial tibial articular cartilage (MTAC) and lateral tibial articular cartilage (LTAC). In this paper, the selection of multiple scanning modalities depends on images resolution and clarity of different structures for knee joint. CT images have high resolution for bone tissue, but it is not good for soft tissue. MRI images are just the opposite compared with CT images. In order to ensure the high resolution and clarity of the corresponding soft tissue, two different MRI scanning sequences, 2D spin echo (SE) sequence T1 weighted image (T1WI) and 3D SE sequence T2 weighted image (T2WI) fat suppression (FS), are selected. By employing thin layer scanning, two sets of MRI images are acquired by 3.0 Tesla (T) MRI scanning device. 3D bones model, 3D menisci and skeleton model, and 3D articular cartilages model are reconstructed based on CT and the two sets of MRI images, respectively. An accurate 3D anatomical structure model is obtained by the combination of manual registration and automatic global registration for the reconstructed 3D geometric models, and it is further optimized by adjusting the relevant parameters.
By using CT and two sets of different sequences MRI images, a realistic and accurate 3D knee joint model is constructed in this work. The structure of this paper is organized as follows: Section 2 presents a 3D modeling methodology that is used to reconstruct and optimize 3D geometric anatomy structure model for subject-specific human knee joint. Section 3 describes the obtained results. Section 4 provides the comparative analysis research on accuracy of the constructed 3D knee joint model, and outlines the novelty of this study. Section 5 is a brief summary of this paper and the prospect of future work. Compared to the existing literature, the main contributions are as follows:
• This work aims to study 3D CAD modeling of a living subject for obtaining the authentic and accurate human knee joint model including major bone and soft tissue structures. A 3D modeling methodology based on CT and two sets of different MRI sequences images is proposed, and it is easy to be implemented.
• Compared with [47, 50, 53, 54], MRI (3D SE T2WI FS) images acquired by thin layer scanning are used for reconstruction of articular cartilages. On the basis of analyzing automatic threshold segmentation of CT and MRI images, the improved image segmentation methods are proposed. By the method of combining manual registration with automatic global registration, the reconstructed 3D models are assembled together to obtain a realistic and accurate 3D knee joint model.
• Inheriting their respective advantages of using CT or MRI images to reconstruct 3D models, the 3D reconstruction and optimization model in this paper possess clear anatomical structure of knee joint, and accurate geometric morphology for each component.
2.Materials and methods
To ensure the quality and resolution of two sets of different MRI sequences images, 3.0 T magnetic field intensity and thin layer scanning are employed. Using the selected scanning devices, medical images including CT, MRI (2D SE T1WI), and MRI (3D SE T2WI FS) are collected by scanning human knee joint (e.g., right) from a living subject. The acquired images are respectively imported into medical image processing software, for instance, Materialise’s interactive medical image control system (Mimics) version 16.0 (Materialise, Leuven, Belgium). On the basis of study on the automatic threshold segmentation of CT and MRI images, the improved image segmentation methods are proposed by further analysis. The corresponding 3D bones model, 3D menisci and skeleton model, and 3D articular cartilages model are reconstructed. By the method of combining manual registration with automatic global registration, a realistic and accurate 3D knee joint model is constructed, which includes distal femur, proximal tibia, menisci, and articular cartilages. Remeshing is used to further optimize each component in the 3D knee joint model by adjusting the relevant parameters. Finally, a 3D geometric anatomy structure optimization model of human knee joint is obtained.
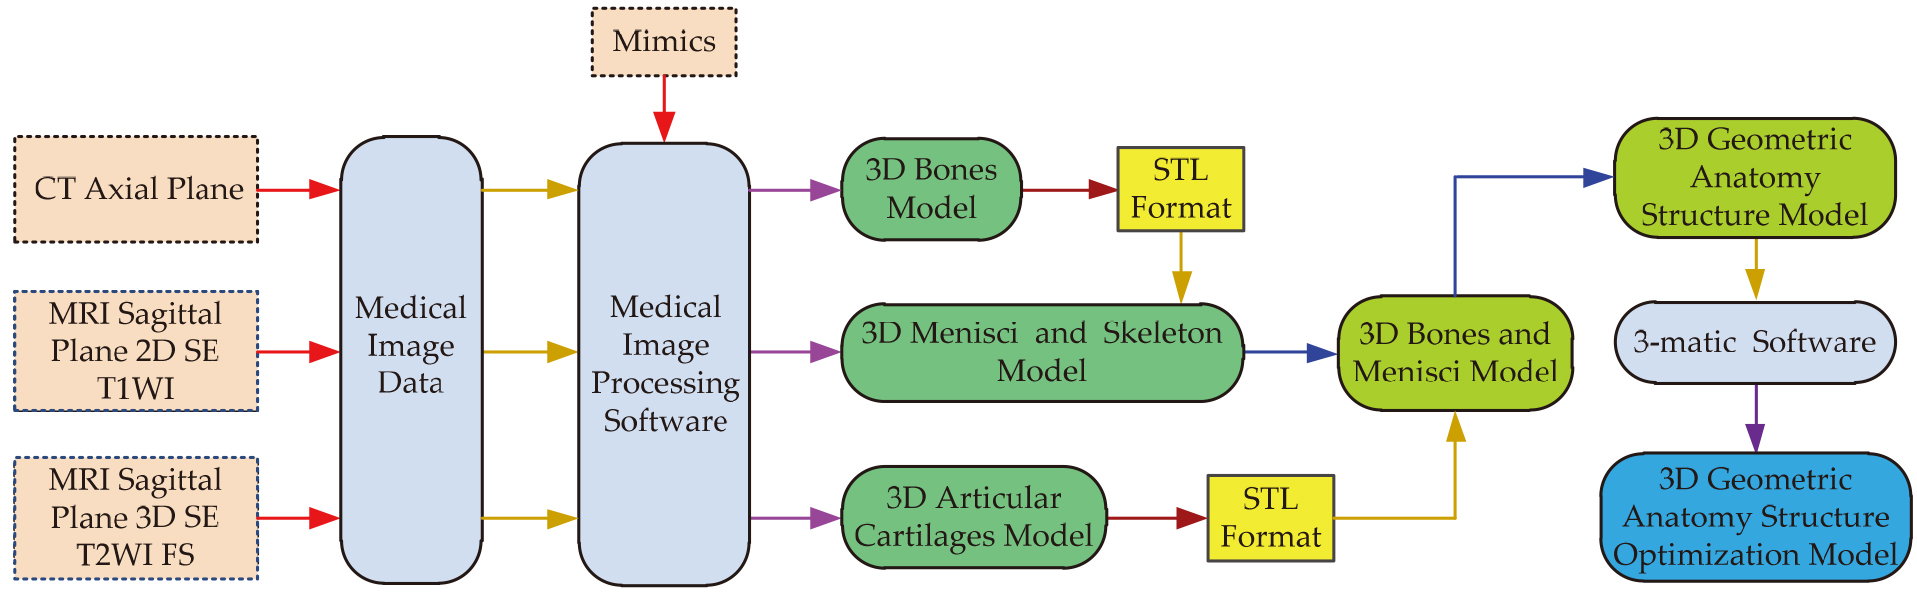
The framework of a 3D modeling methodology based on CT and two sets of different MRI sequences images is shown in Fig. 1. The main contents of this section are described in detail in the following five subsections. The first subsection collects data of CT and the two sets of MRI images. The second subsection proposes the improved segmentation methods, which are used for separating bone and soft tissues from CT or MRI images. 3D bones model, 3D menisci and skeleton model, and 3D articular cartilages model are reconstructed respectively in the third subsection. The fourth subsection describes registration methods of the reconstructed 3D geometric models. The fifth subsection aims to obtain a 3D optimization model of human knee joint.
Figure 1.
The framework of a 3D modeling methodology based on CT and two sets of different MRI sequences images.
2.1Data acquisition of CT and MRI images
In order to ensure the authenticity and accuracy of knee joint structure, a living subject is introduced to acquire CT and two sets of MRI images. A healthy adult human male subject (age: 31 years old, height: 170 cm, weight: 68 kg) without a history of knee injury is selected, and his right knee is scanned in the CT and MRI room of Xi’an Honghui Hospital Affiliated to Xi’an Jiaotong University. At the time of CT and MRI scanning, the subject lies on examining bed in supine position, feet go in first, and the left and right knees straighten naturally and close slightly together and keep still. When the right knee is performed MRI scanning, it needs to be fixed by filling a sponge pad in the coil, and an anti-vibration headset is worn on the subject’s head. After the scanning, CT and MRI images are stored on the hospital computer in digital imaging and communications in medicine (DICOM) format, and then they are saved on a DVD-R disk.
This study is approved by the Ethics Committee of Xi’an Honghui Hospital, and informed consent is obtained from the subject. To obtain a better clarity and contrast CT or MRI images, thin layer scanning is employed. The right knee is scanned in axial (transverse) plane using the 64 rows 128 layers Ingenuity helical CT machine (Royal Philips, Netherlands) with slice thickness of 1 mm, slice increment of 0.8 mm, and matrix size of 512
The same right knee is scanned in sagittal plane using the panoramic open 3.0 T superconducting MRI scanner Verio (Siemens Aktien Gesellschaft, Germany). Scanning range is from lateral to medial of the right knee. Sampling frequency of radio frequency (RF) signal is 3 MHz. For the 2D SE T1WI pulse sequence, the scanning parameters adopted are as follows: slice thickness
Table 1
The main scanning parameters of the acquired CT and two sets of different MRI sequences images
| Modality | Sequence | U (kV) | I (mA) | TR (ms) | TE (ms) | Slice thickness (mm) | Slice increment (mm) | Pixel | Total |
|---|---|---|---|---|---|---|---|---|---|
| CT | – | 120 | 156 | – | – | 1 | 0.8 | 512 | 220 |
| MRI | 2D SE T1WI | – | – | 2140 | 13 | 1.1 | 1.1 | 384 | 80 |
| MRI | 3D SE T2WI FS | – | – | 14.1 | 5 | 0.6 | 0.6 | 512 | 128 |
2.2Image segmentation and 3D model reconstruction
The 220 CT, 80 MRI (2D SE T1WI) and 128 MRI (3D SE T2WI FS) images of DICOM format are imported into Mimics 16.0 software, respectively. In the software, CT and the two sets of MRI images are translated into the corresponding binary images based on automatic threshold segmentation method. Compared with soft tissues, CT images have a better clarity and contrast for bone tissue. Since gray values of bone and soft tissues are of great difference, they can be rapidly and effectively segmented using threshold method. The automatic segmentation result shows that contour pixels of bony structure in a mask are not complete enough (very few pixels are missing). In order to obtain complete contour pixels, a threshold range of bone tissue is selected, and the expression is as follows:
(1)
where
The minimum threshold can be adjusted manually according to the current gray scale distribution curve, and an adequate threshold value is selected by observing the contour pixels. The mask can be further edited manually to obtain accurate contour pixels of bone tissue. On the basis of being familiar with bony structure, the missing contour pixels can be drawn, and the redundant pixels can be erased by three views including transverse view, coronal view, and sagittal view. However, pixels of the mask also include floating pixels, and contour pixels of examining table.
Region growing is used to segment the mask including complete and accurate contour pixels of tissues, floating pixels and other pixels. It can not only separate the tissue of the unconnected each other into independent parts and extract them, but also remove redundant pixels. For bony structure in CT images, the floating pixels and contour pixels of examining table are removed using region growing, and contour pixels of bone tissue substructures are also segmented to generate a new mask for region of interest. Hence, by manually selecting the appropriate minimum threshold and editing the mask, as well as combined with region growing method, accurate contour pixels of the required bony structure for human knee joint are obtained.
MRI (2D SE T1WI) and MRI (3D SE T2WI FS) images have high resolution and clarity for menisci and articular cartilages, respectively. Nevertheless, contrast of soft tissues in the anatomical structure of knee joint is low. Therefore, preprocessing is first performed to improve contrast before MRI images segmentation. The automatic segmentation result indicates that pixels in a mask not only include meniscal tissue but also other tissues and redundancy. However, pixels of meniscal tissue are seriously missing. In order to improve contour pixels of meniscal structure in MRI (2D SE T1WI) images, a threshold range of soft tissue is selected, and the expression is as follows:
(2)
where
It is necessary to manually adjust the initial low threshold and high threshold based on the current gray scale distribution curve, respectively. Simultaneously, a suitable threshold range is obtained by observing the change of the meniscal contour pixels in real time. To further obtain complete and accurate contour pixels of menisci and to eliminate other redundant pixels, the generated pixels in the mask can be edited manually by three views. The pixels of the other tissues and redundancy can be removed as many as possible for each layer by cropping the mask. Then, the missing pixels of menisci can be drawn, and the rest of redundant pixels can be erased. Similarly, region growing is used to segment the contour pixels of menisci, and a new mask for region of interest is generated. On the basis of preprocessing, by manually selecting the proper threshold range and editing the mask, as well as combined with region growing method, accurate contour pixels of meniscus for the knee joint structure are obtained finally. The MRI (3D SE T2WI FS) images are segmented using the similar MRI (2D SE T1WI) images processing methods, complete and accurate contour pixels of articular cartilages can be also obtained.
According to the above the CT and MRI images segmentation method, the accurate contour pixels of DF, PT, menisci, and articular cartilages are obtained. Similarly, the contour pixels of DF and PT are also obtained based on MRI (2D SE T1WI). Pena et al. [47] studied a similar segmentation method. Their manual segmentation accuracy is 0.3 mm. However, slice thickness of 1.5 mm is employed, and different soft tissues are segmented from the same MRI sequence images. Therefore, the segmentation accuracy of the required bone and soft tissue structures is guaranteed in this paper. The related parameters and corresponding structures of CT and two sets of different MRI sequences images reconstruction are listed in Table 2.
Table 2
The related parameters and corresponding structures of CT and two sets of different MRI sequences images reconstruction
| Images | Scan plane | Threshold range | Contrast | Structures | |
|---|---|---|---|---|---|
| Automatic | Manual | ||||
| CT | Axial | 1250–3016 | 1181–3016 | 0–3016 | Distal femur, and proximal tibia |
| MRI 2D SE T1WI | Sagittal | 324–1249 | 0–355 | 0–683 | Medial meniscus, and lateral meniscus |
| 1250–3327 | 672–3327 | 0–500 | Distal femur, and proximal tibia | ||
| MRI 3D SE T2WI FS | Sagittal | 324–723 | 129–688 | 0–331 | Femoral articular cartilage, medial tibial articular |
| cartilage, and lateral tibial articular cartilage | |||||
After CT and the two sets of MRI images are processed, 9 masks are generated. All the masks are calculated in 3D of the optimal quality, and the corresponding 3D geometrical model is reconstructed. The surface of the two sets of 3D bones model is still fairly rough, and there are some small holes and sharp features, which can be repaired by wrapping processing. Since the surface of the 3D menisci model and articular cartilage model are still rough, they are further processed by smoothing.
2.33D model registration
3D bones model, 3D menisci and skeleton model, and 3D articular cartilages model are reconstructed in different coordinate systems, so they need to be assembled together by the transformation relation of space. After two registrations of the reconstructed 3D geometric models, the desired knee joint model is obtained. The process of 3D model registration is outlined below.
The reconstructed 3D bones model based on CT images is exported in American standard code for information interchange (ASCII) code format of standard triangle language (STL) file and saved in the computer. The model is imported into the reconstructed 3D menisci and skeleton model. The 3D skeleton model is taken as a reference model, and the 3D bones model is repositioned by translation and rotation. The spatial position and orientation of the DF and PT in the 3D bones model is continuously changed to use for registration with the corresponding 3D skeleton model by repositioning, respectively. After the manual registration, the 3D skeleton model can be hidden, and a novel 3D bones and menisci model of human right knee joint including DF, PT, MM and LM is obtained.
The reconstructed 3D FAC model, 3D MTAC model and 3D LTAC model in ASCII code format of STL file are imported into the 3D bones and menisci model, respectively. The 3D bones model is taken as a reference model, and the FAC is assembled with the DF and PT by automatic global registration. Combined with the manual registration, a 3D bones and FAC model is obtained. In a similar way, the MTAC and LTAC are respectively registered with medial tibial condyle and lateral tibial condyle. After 3D articular cartilages model registration, a novel 3D geometrical anatomy structure model of human right knee joint including major bone and soft tissue structures is established.
2.4Optimization of 3D knee joint model
3D geometric models in knee joint are actually surface mesh models, which are composed of many triangles. There are some problems in triangles of 3D mesh models, such as large quantity, different sizes, and poor meshes quality, etc. In order to improve quality and calculation speed of biomechanical simulation for future, the established model is optimized by adjusting the relevant parameters. The purpose of 3D model optimization includes the reduction of the number of triangles, improvement of meshes quality, and uniformity of size. Taking the 3D MM model as an example, the main optimization process is outlined below.
Firstly, mesh quality and quantity of triangles are inspected by setting quality and histogram parameters. Secondly, to remove sharp edges, the model is smoothly processed (If the selected 3D model is a smoothing model, smoothing treatment can be omitted). Thirdly, geometrical error is set to 0.1, which is used to reduce the number of triangles mesh. Fourthly, to improve mesh quality of triangles, shape quality threshold, maximum geometrical error, maximum triangle edge length, and number of iterations is set to 0.4, 0.5, 5, and 4, respectively. Fifthly, under the condition of ensuring the quality of triangles, the number of triangles is reduced until it is no longer changed. Finally, volume mesh of the model is created. The remaining 3D models are optimized using similar procedures, respectively. A 3D geometric anatomy structure optimization model can be constructed.
3.Results
3.13D bones model
According to the proposed segmentation method of CT images, a 3D bones model including DF and PT is reconstructed and shown in Fig. 2. The 3D bones model after wrapping is shown in Fig. 3.
Figure 2.
The reconstructed 3D bones model based on CT images.
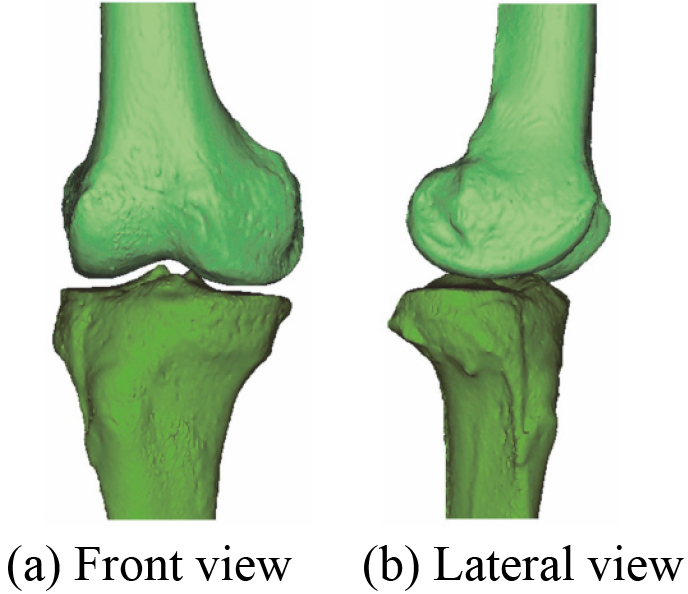
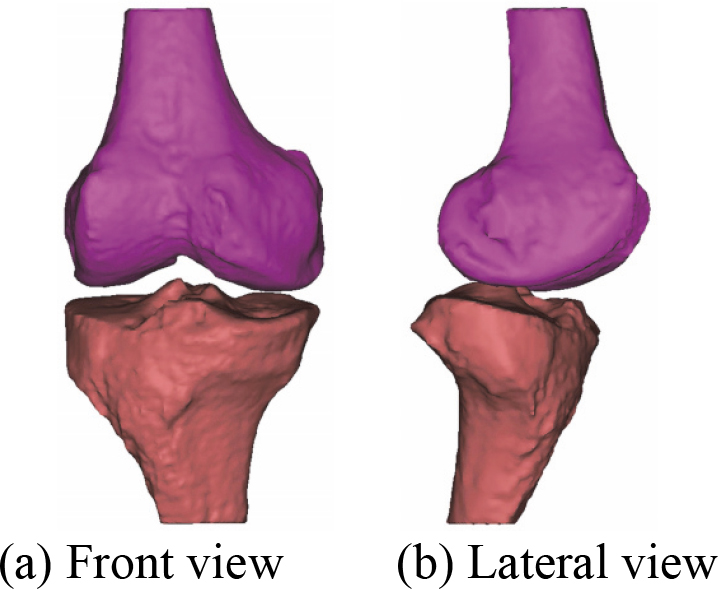
Figure 3.
3D bones model after wrapping.
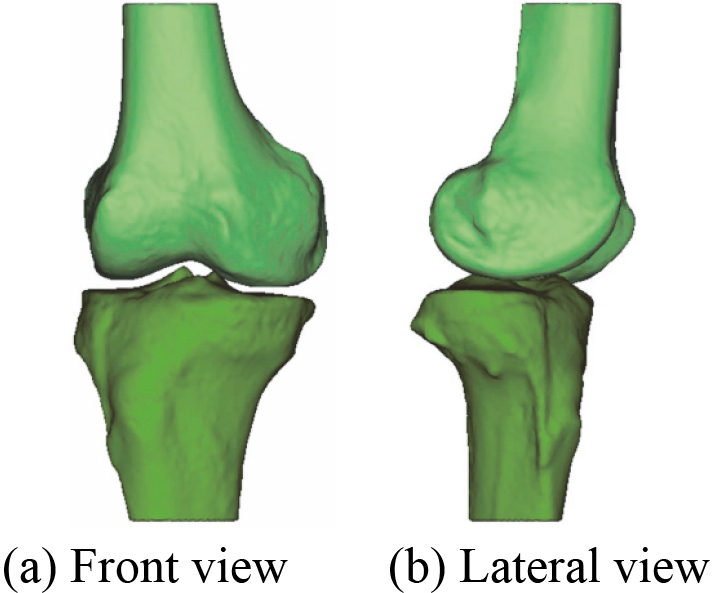
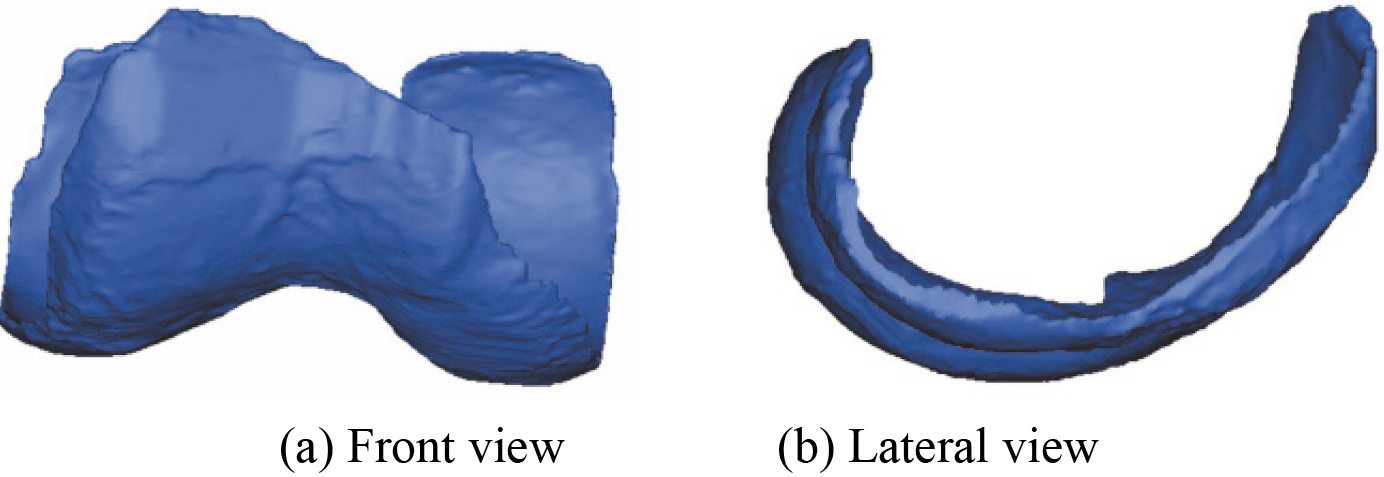
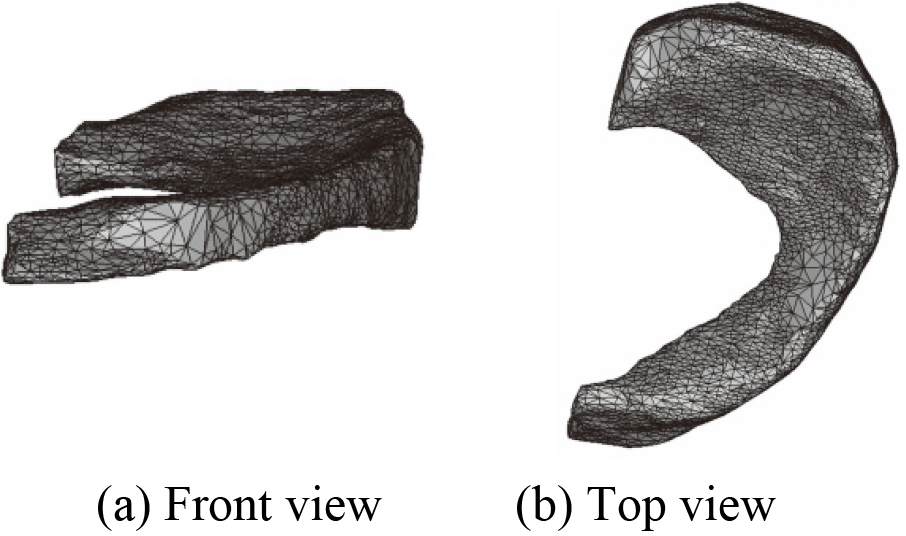
Figure 4.
The reconstructed 3D menisci model based on MRI (2D SE T1WI) images.

3.23D menisci and skeleton model
In the first place, 3D menisci model including MM and LM is reconstructed based on the acquired 80 MRI (2D SE T1WI) images. Figure 4 shows the reconstructed 3D menisci model. 3D menisci model after smoothing is shown in Fig. 5.
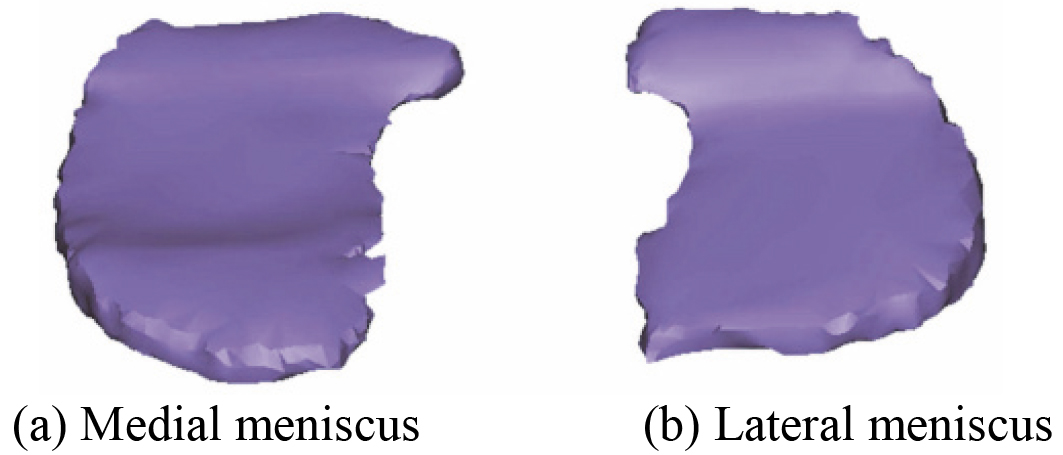
Figure 5.
3D menisci model after smoothing.
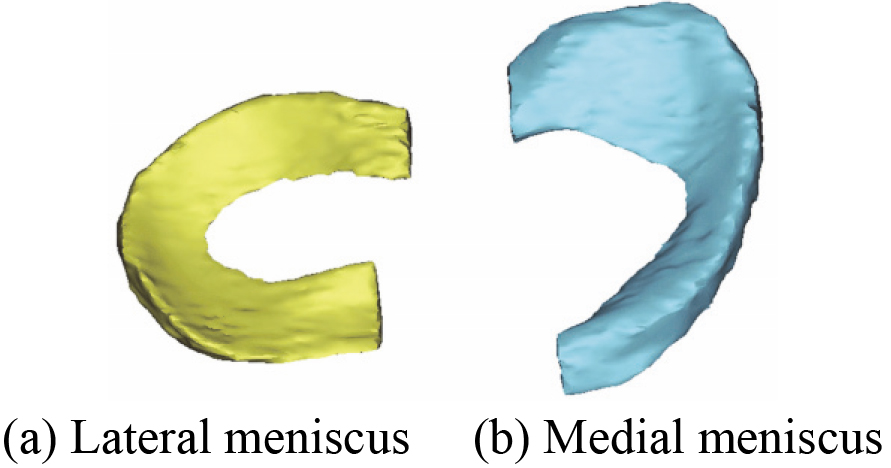
Figure 6.
The reconstructed 3D skeleton model based on MRI (2D SE T1WI) images.
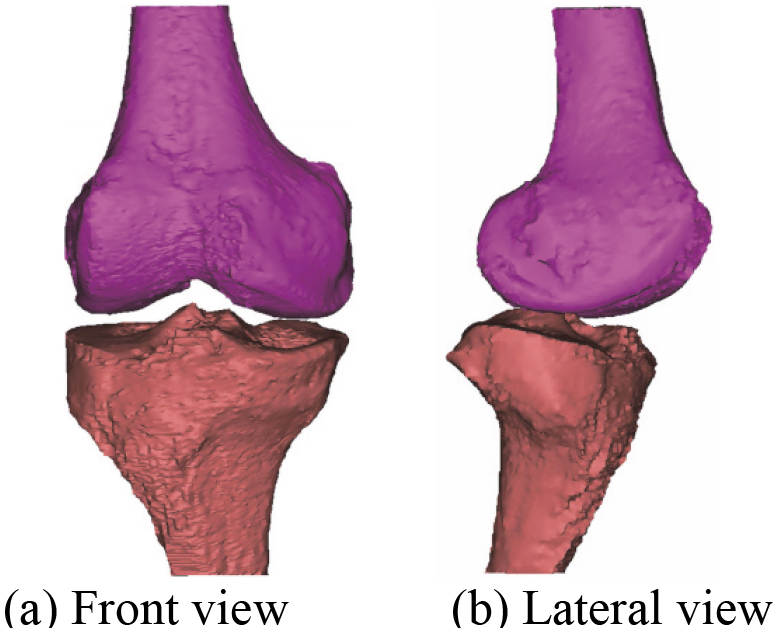
Figure 7.
3D skeleton model after wrapping.
In the second place, 3D skeleton model including DF and PT is also reconstructed based on the acquired 80 MRI (2D SE T1WI) images. Figure 6 shows the reconstructed 3D skeleton model. 3D skeleton model after wrapping is shown in Fig. 7.
3D geometric anatomy structure model of human right knee joint including DF, PT, MM and LM is obtained. The reconstructed 3D menisci and skeleton model based on MRI (2D SE T1WI) images is shown in Fig. 8.
Figure 8.
The final reconstructed 3D menisci and skeleton model based on MRI (2D SE T1WI) images.
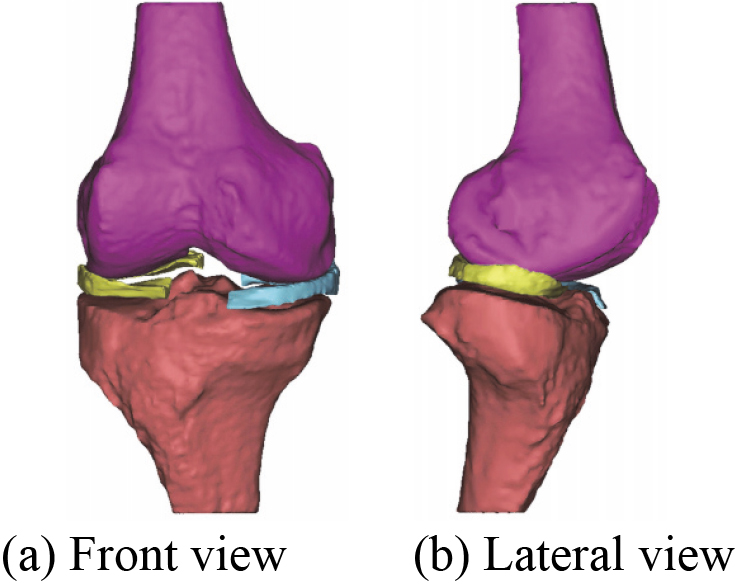
Figure 9.
The reconstructed 3D MTAC model based on MRI (3D SE T2WI FS) images.
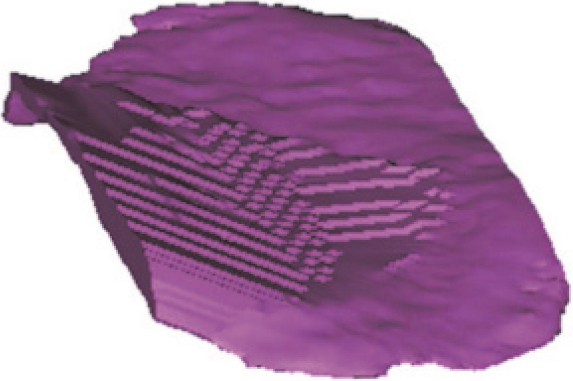
Figure 10.
The reconstructed 3D LTAC model based on MRI (3D SE T2WI FS) images.
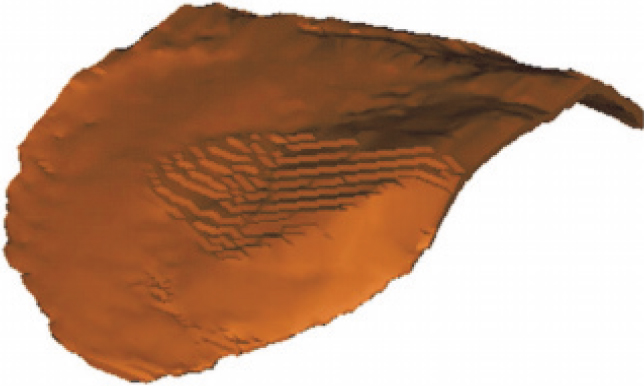
Figure 11.
The reconstructed 3D FAC model based on MRI (3D SE T2WI FS) images.
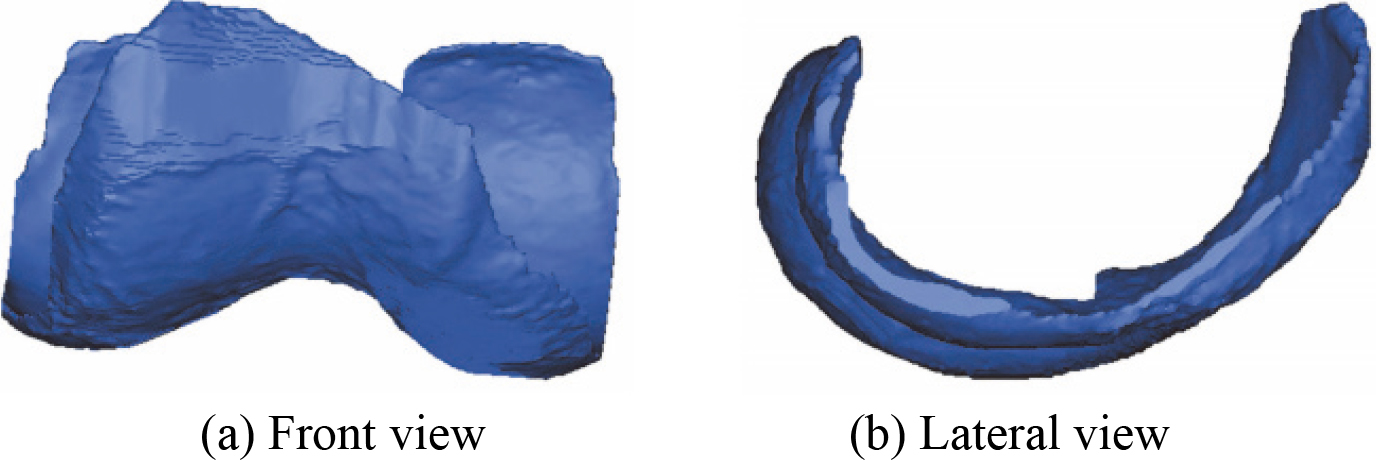
Figure 12.
The 3D MTAC model after smoothing.
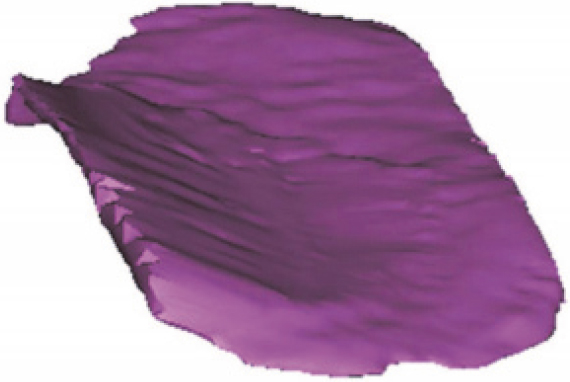
Figure 13.
The 3D LTAC model after smoothing.
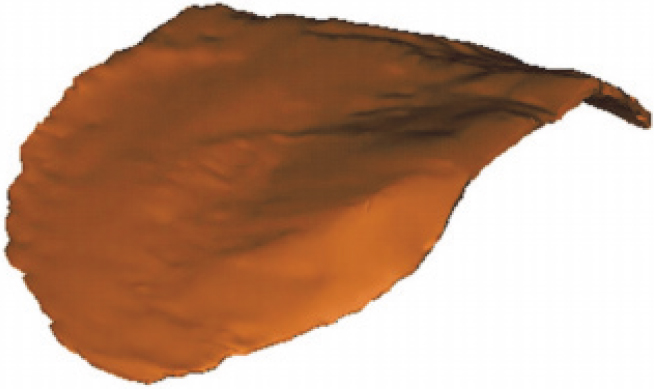
Figure 14.
The 3D FAC model after smoothing.
3.33D articular cartilages model
The reconstructed 3D MTAC model, 3D LTAC model, and 3D FAC model are shown in Figs 9–11 respectively. The corresponding smoothing models are shown in Figs 12–14.
3.43D knee joint model
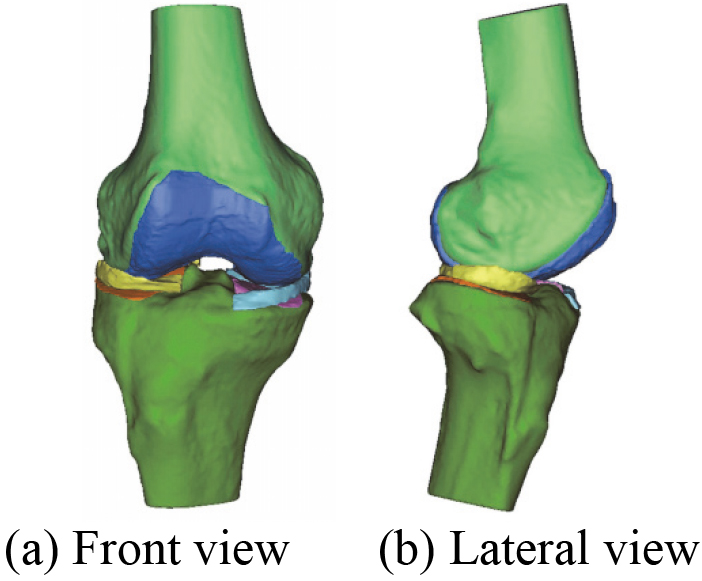
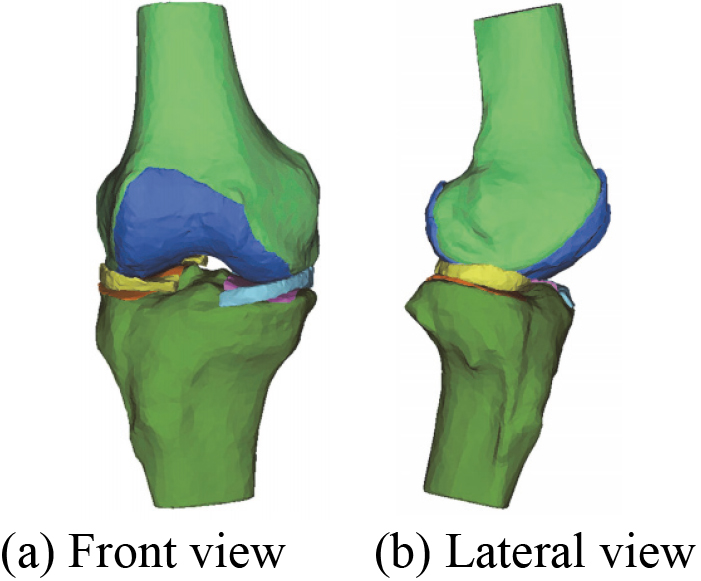
After the manual registration 3D bones model, a novel 3D bones and menisci model is constructed. Figure 15 shows a novel 3D bones and menisci model. After automatic global registration and manual registration the reconstructed 3D articular cartilages model, a novel 3D geometric anatomy structure model is constructed. Figure 16 shows a novel 3D geometric anatomy structure model of human right knee joint.
Figure 15.
A novel 3D bones and menisci model.
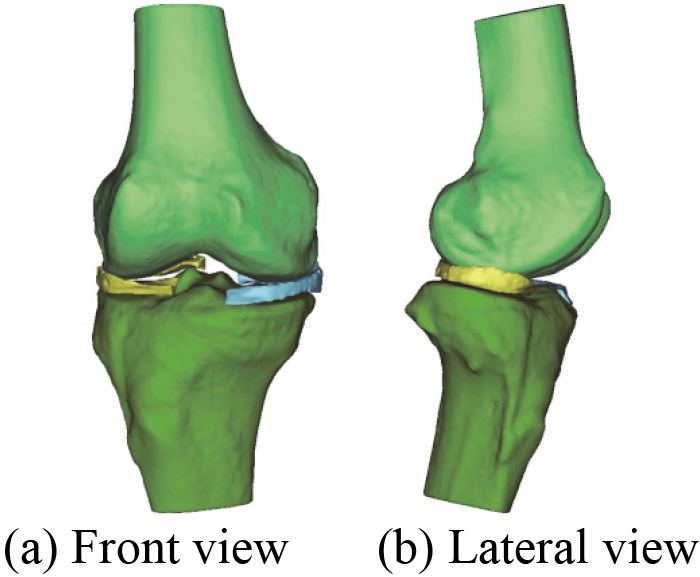
Figure 16.
A novel 3D geometric anatomy structure model of human right knee joint.
Taking the reconstructed 3D menisci model for example, meniscal dimensions are measured by the Mimics 16.0 software. They are lateral meniscus circumference (LMC), lateral meniscus width (LMW), lateral meniscus body width (LMBW), lateral meniscus length (LML), medial meniscus circumference (MMC), medial meniscus width (MMW), medial meniscus body width (MMBW), and medial meniscus length (MML) respectively. The main dimension parameters of menisci are shown in Fig. 17. The measurement values of dimension parameters of the medial and lateral meniscus are shown in Table 3.
Table 3
The measurement values of dimension parameters of the medial and lateral meniscus
| Measurement parameters | Value (mm) |
|---|---|
| LMC | 91.15 |
| LMW | 34.24 |
| LMBW | 11.78 |
| LML | 34.99 |
| MMC | 101.04 |
| MMW | 29.83 |
| MMBW | 9.65 |
| MML | 40.53 |
Figure 17.
The main dimension parameters of menisci.
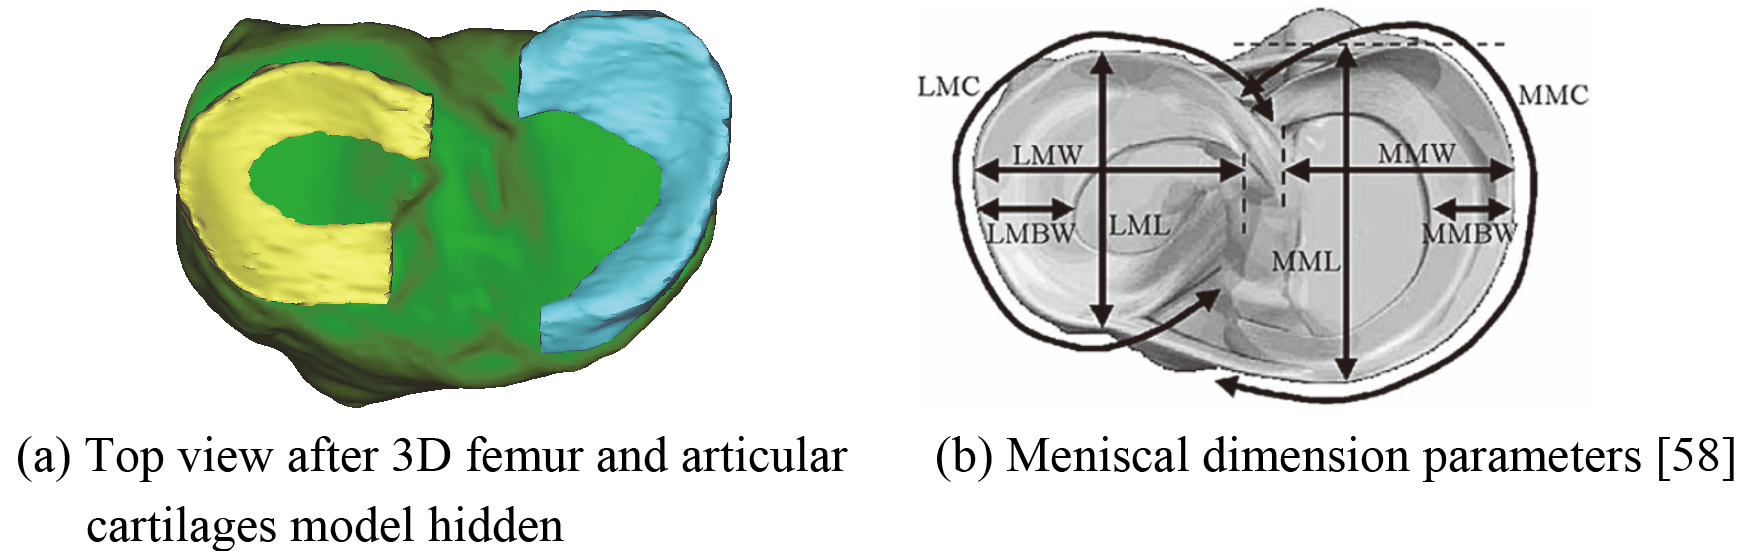
Figure 18.
3D mesh model of MM before optimization.
Compared with the study by McDermott et al. [58], according to the values for measured parameters of Table 3, the results demonstrate that the reconstructed 3D menisci model based on MRI (2D SE T1WI) images is valid and accurate.
3.53D knee joint optimization model
MM is taken for example to illustrate in this paper, mesh model before and after optimization of each component in the constructed 3D knee joint model is not given one by one. 3D mesh models of MM before and after optimization are shown in Figs 18 and 19.
The number of triangles of each component during the optimization process of 3D knee joint model is listed in Table 4. After optimization, a novel 3D geometric anatomy structure optimization model of human right knee joint is established. Figure 20 shows a 3D menisci optimization model. Figure 21 shows a novel 3D geometric anatomy structure optimization model of human right knee joint.
Table 4
The number of triangles of each component during the optimization process of 3D knee joint model
| 3D model | Initial triangles | Triangles after reducing | Triangles after remeshing | Final triangles |
|---|---|---|---|---|
| DF | 59406 | 8046 | 5452 | 4412 |
| PT | 47684 | 7596 | 4764 | 3730 |
| MM | 7090 | 3806 | 2084 | 1066 |
| LM | 7870 | 3796 | 2134 | 1042 |
| MTAC | 11926 | 3226 | 1778 | 868 |
| LTAC | 13836 | 3536 | 1940 | 908 |
| FAC | 65146 | 6826 | 6158 | 3914 |
Figure 19.
3D mesh model of MM after optimization.
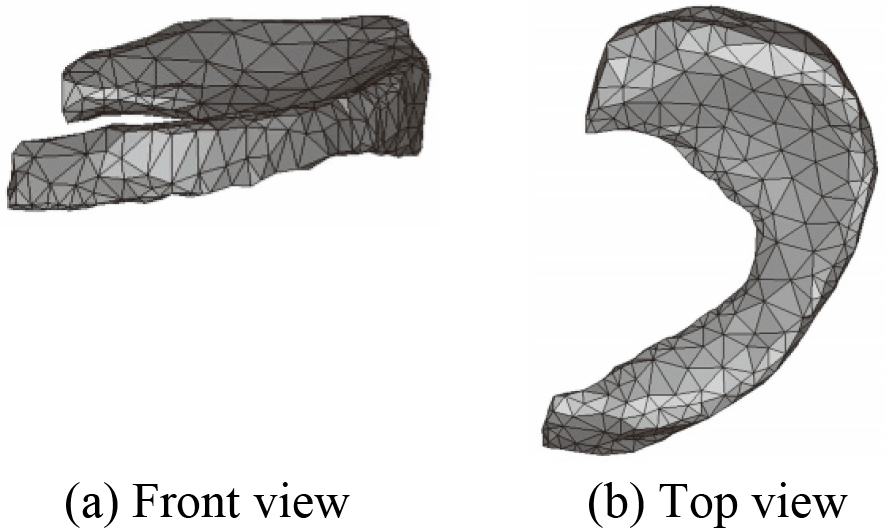
Figure 20.
3D menisci optimization model.
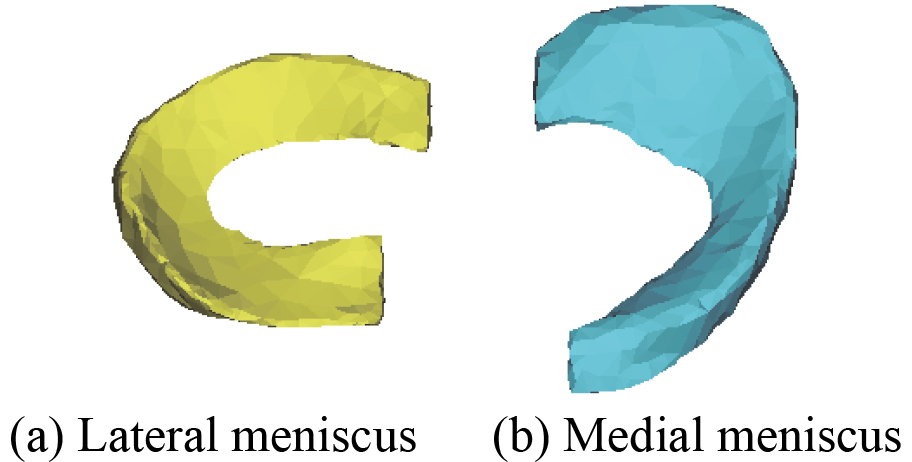
Figure 21.
A novel 3D geometric anatomy structure optimization model of human right knee joint.
4.Discussion
Human knee joint is mainly composed of bone and soft tissue structures, and its spatial structure is very complex. On the one hand, it is rather difficult to reconstruct a realistic and accurate 3D geometric anatomy structure model of subject-specific knee joint only using single-modality medical image such as CT or MRI. On the other hand, for different soft tissue structures, image clarity generated by the same MRI scanning sequence is not same. Therefore, this paper presents a 3D modeling methodology that is used to reconstruct and optimize 3D knee joint model from a living subject based on CT and two sets of different MRI sequences images.
At present, the commonly used CT or MRI scan slice thickness of knee joint for clinical diagnosis is mostly 3 to 5 mm. To obtain a better clarity and contrast CT images, thin layer scanning of 1 mm is employed. The purpose is to improve the spatial resolution of the images and reduce the influence of partial volume effect. Considering that the clarity of different soft tissues is different under the same MRI sequence images, and the clarity of same soft tissue is also different under the different MRI sequences images. MRI (2D SE T1WI) and MRI (3D SE T2WI FS) images are acquired by MRI scanning device, respectively. In order to improve image quality and signal to noise ratio (SNR), 3.0 T magnetic field intensity and thin layer scanning are employed. The acquisition of thin layer scanning data is the foundation of the successful establishment of soft tissue models, so how to set slice thickness is very important. Too thick scanning layer can produce partial volume effect, resulting in blurred image. Too thin scanning layer can reduce SNR and high resolution image quality. By repeated comparison, slice thickness of the two sets of MRI scanning sequences is determined to be 1.1 mm and 0.6 mm respectively.
The MRI (2D SE T1WI) images are better for meniscal tissue. The menisci are located between the DF articular surface and PT articular surface. They are shown as a low signal (black) in coronal view, transverse view and sagittal view under normal circumstances, most of which are clearly visible. In sagittal view, each layer is carefully observed from lateral to medial of the right knee joint. This process can be roughly divided into three stages: the first stage is shown as the state of the LM (from showing the black section of mid body to gradually appearing two small black triangles of anterior and posterior horn until they all disappeared). The second stage is shown as no meniscus state (between the MM and the LM). The third stage is shown as the state of the MM (from the end stage of showing no meniscus state to gradually appearing two small black triangles of anterior and posterior horn, and then to appearing the black section of mid body until they all disappeared).
There are two reasons for reconstruction 3D skeleton model based on MRI (2D SE T1WI) images, one is to compare it with the reconstructed 3D bones model based on CT images, and another is used as a reference model for manual registration. Comparing the 3D geometry model of Figs 2 and 6 as well as Figs 3 and 7, it can be seen that their geometric contours are slightly different from each other. It is shown that the reconstructed 3D bones model of human knee joint based on CT images is more accurate than MRI (2D SE T1WI). Although the 3D skeleton model in Fig. 7 is not accurate enough, it can be taken as a reference model during the process of 3D model registration. As shown in Fig. 15, 3D bones and menisci model with high accuracy is constructed in a global coordinate system. The result shows that the 3D skeleton model is completely replaced by the 3D bones model.
An accurate 3D skeleton optimization model of human left knee joint including DF and PT based on CT images has been reconstructed in the literature [59]. Later, on this basis, 3D menisci model of the knee joint is also further reconstructed by the Mimics 16.0 software. The reconstructed 3D menisci model based on CT images is shown in Fig. 22. After smoothing processing, 3D menisci smoothing model is obtained. Figure 23 shows 3D menisci model after smoothing. By comparing 3D menisci model in Figs 4 and 22, Figs 5 and 23, it is quite obvious that the reconstructed 3D menisci model based on MRI (2D SE T1WI) images is more accurate than the one based on CT.
Figure 22.
The reconstructed 3D menisci model based on CT images.
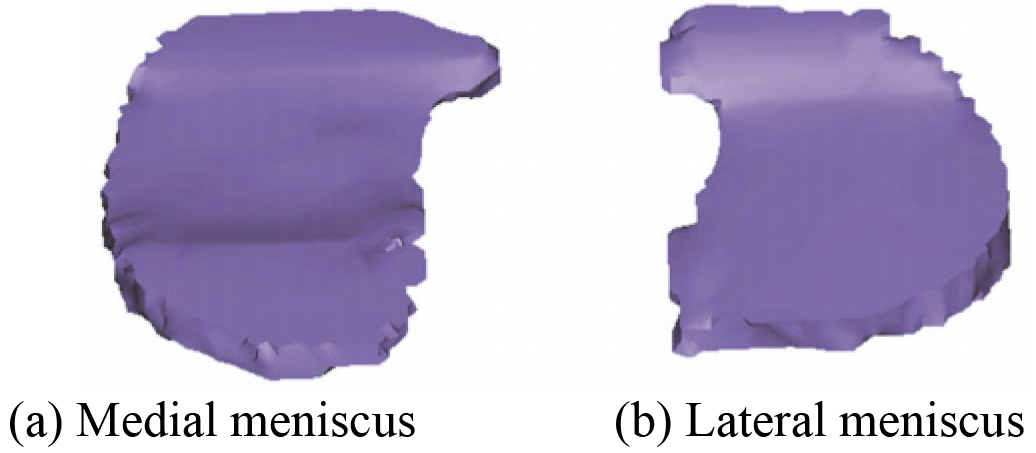
Figure 23.
3D menisci model after smoothing.
In order to obtain the clearer images of FAC, MTAC and LTAC, the same right knee joint is scanned in different sequences using the identical MRI device. The sequences include 3D dual echo steady state (DESS), 3D SE proton density weighted image (PDWI) FS, 3D fast low angle shot (FLASH) FS, 3D SE T2WI FS, and short T1 inversion recovery (STIR) FS. It is found that image data of MRI 3D SE sequence T2WI FS has better effect by comparing them with each other. In sagittal view, it can be observed that signal of femoral articular cartilage and tibial articular cartilage are between moderate signal (gray) and high signal (white) and most of their geometric contours of each layer are clearly shown. Fluid in knee joint shows high signal. Since the articular cartilage of the femur and the articular cartilage of the tibia are in close contact with each other, it is not so easy to segment them. However, on the basis of being familiar with articular cartilage structure, precise contours are obtained and separated from each other by the improved MRI image segmentation method. Finally, a relatively accurate 3D articular cartilages model is reconstructed based on MRI (3D SE T2WI FS) images.
When considering 3D model reconstruction of articular cartilage in human knee joint structure, 3D FAC model, 3D MTAC model and 3D LTAC model are respectively reconstructed according to the actual situation. The three models are imported to the accurate 3D bones and menisci model. The automatic global registration is performed first, and then the manual registration is carried out to make further slight adjustment. A realistic and accurate 3D knee joint model is constructed using the method of combining the automatic global registration and manual registration.
It can be seen from Table 4 that the number of triangles of each component in 3D knee joint model before and after the optimization. The triangles continue to decrease until it no longer changes. Compared with Figs 18 and 19 shows that the quality of the menisci mesh model is improved after optimization. The optimization model of 3D human knee joint in Fig. 21 can clearly and accurately reflect the key characteristics, including 3D anatomical structure of knee joint and 3D geometric morphology for each component. Since ligaments structure in human knee joint are not involved in this study, its 3D reconstruction model is not considered for the time being.
5.Conclusion
In this paper, a novel 3D geometric anatomy structure model for subject-specific human knee joint based on CT and two sets of different MRI sequences images is constructed. First of all, the acquisition of CT, MRI (2D SE T1WI) and MRI (3D SE T2WI FS) images is accomplished by the selected human right knee joint from a living subject. Secondly, according to the corresponding image data, 3D bones model, 3D menisci and skeleton model, 3D articular cartilages model is respectively reconstructed using automatic and manual threshold segmentation, manual editing mask, as well as combined with region growing method. And then, an accurate and realistic 3D geometric anatomy structure model of knee joint is obtained using registration methods for the reconstructed 3D models. Finally, the optimization model is further constructed by adjusting the relevant parameters of the authentic 3D knee joint model. The final model can clearly and accurately simulate the 3D geometrical morphology and position relations of DF, PT, MM, LM, FAC, MTAC and LTAC of knee joint. Next, 3D reconstruction model of four major ligaments in human knee joint structure will be reconstructed. In order to in-depth understand the kinematics and dynamics characteristics of human knee joint and meniscus, dynamic modeling and finite element simulation analysis will be developed on the basis of the constructed optimization model in the future.
Acknowledgments
This work was supported in part by the National Natural Science Foundation of China under Grants 51275413 and 51805438, in part by the Key Research and Development Program in Shaanxi Province of China under Grant 2016KTZDGY4-03, and in part by the Natural Science Basic Research Plan in Shaanxi Province of China under Grant 2017JM5050.
Conflict of interest
None to report.
References
[1] | Zheng JB, Zuo XX, Ren JC, Wang S. Multiple depth maps integration for 3D reconstruction using geodesic graph cuts. Int. J. Softw. Eng. Knowl. Eng. (2015) ; 25: (3): 473–492. doi: 10.1142/S0218194015400173. |
[2] | Aliakbarpour H, Prasath VBS, Palaniappan K, Seetharaman G, Dias J. Heterogeneous multi-view information fusion: review of 3-D reconstruction methods and a new registration with uncertainty modeling. IEEE Access. (2016) ; 4: : 8264–8285. doi: 10.1109/ACCESS.2016.2629987. |
[3] | Wang S, Zuo XX, Du C, Wang RX, Zheng JB, Yang RG. Dynamic non-rigid objects reconstruction with a single RGB-D sensor. Sensors. (2018) ; 18: (3): 886. doi: 10.3390/s18030886. |
[4] | Merras M, Saaidi A, ElAkkad N, Satori K. Multi-view 3D reconstruction and modeling of the unknown 3D scenes using genetic algorithms. Soft Comput. (2018) ; 22: (19): 6271–6289. doi: 10.1007/s00500-017-2966-z. |
[5] | Zuo XX, Wang S, Zheng JB, Pan ZG, Yang RG. Detailed surface geometry and albedo recovery from RGB-D video under natural illumination. IEEE Trans. Pattern Anal. Mach. Intell. (2019) ; 42: (10): 2720–2734. doi: 10.1109/TPAMI.2019.2955459. |
[6] | Gong YZ. Improving the accuracy of 3D reconstruction in robotic vision applications. Dept. Mech. Engn., Univ. Washington, Seattle, WA, USA; (2016) . |
[7] | Kumar S, Nayak KP, Hareesha KS. Quantification of spinal deformities using combined SCP and geometric 3D reconstruction. Biomed. Signal Process. Control. (2017) ; 31: : 181–188. doi: 10.1016/j.bspc.2016.08.004. |
[8] | Fadero PE, Shah M. Three dimensional (3D) modelling and surgical planning in trauma and orthopaedics. Surg. J. R. Coll. Surg. Edinb. Irel. (2014) ; 12: (6): 328–333. doi: 10.1016/j.surge.2014.03.008. |
[9] | Kraeima J, Dorgelo B, Gulbitti HA, Steenbakkers RJHM, Schepman KP, Roodenburg JLN, et al. Multi-modality 3D mandibular resection planning in head and neck cancer using CT and MRI data fusion: a clinical series. Oral Oncol. (2018) ; 81: : 22–28. doi: 10.1016/j.oraloncology.2018.03.013. |
[10] | Hua J, Aziz S, Shum JW. Virtual surgical planning in oral and maxillofacial surgery. Oral Maxillofac. Surg. Clin. N. Am. (2019) ; 31: (4): 519–530. doi: 10.1016/j.coms.2019.07.011. |
[11] | Singare S, Liu YX, Li DC, Lu BH, He SH. Individually prefabricated prosthesis for maxilla reconstruction. J. Prosthodont. (2008) ; 17: (2): 135–140. doi: 10.1111/j.1532-849X.2007.00266.x. |
[12] | Derand P, Rannar L-E, Hirsch J-M. Imaging, virtual planning, design, and production of patient-specific implants and clinical validation in craniomaxillofacial surgery. Craniomaxillofac. Trauma Reconstr. (2012) ; 5: (3): 137–144. doi: 10.1055/s-0032-1313357. |
[13] | Sindhu V, Soundarapandian S. Three-dimensional modelling of femur bone using various scanning systems for modelling of knee implant and virtual aid of surgical planning. Measurement. (2019) ; 141: : 190–208. doi: 10.1016/j.measurement.2019.04.017. |
[14] | Penrose JMT, Holt GM, Beaugonin M, Hose DR. Development of an accurate three-dimensional finite element knee model. Comput. Methods Biomech. Biomed. Eng. (2002) ; 5: (4): 291–300. doi: 10.1080/1025584021000009724. |
[15] | Li HY, Wang Z. Intervertebral disc biomechanical analysis using the finite element modeling based on medical images. Comput. Med. Imaging Graph. (2006) ; 30: (6–7): 363–370. doi: 10.1016/j.compmedimag.2006.09.004. |
[16] | Gu KB, Li LP. A human knee joint model considering fluid pressure and fiber orientation in cartilages and menisci. Med. Eng. Phys. (2011) ; 33: (4): 497–503. doi: 10.1016/j.medengphy.2010.12.001. |
[17] | Wang LX, Lin L, Feng Y, Fernandes TL, Asnis P, Hosseini A, et al. Anterior cruciate ligament reconstruction and cartilage contact forces – a 3D computational simulation. Clin. Biomech. (2015) ; 30: (10): 1175–1180. doi: 10.1016/j.clinbiomech.2015.08.007. |
[18] | Chae JM, Park JH, Kojima Y, Tai K, Kook YA, Kyung HM. Biomechanical analysis for total distalization of the mandibular dentition: a finite element study. Am. J. Orthod. Dentofac. Orthop. (2019) ; 155: (3): 388–397. doi: 10.1016/j.ajodo.2018.05.014. |
[19] | Yura S, Harada S, Kobayashi K. Diagnostic accuracy on magnetic resonance imaging for the diagnosis of osteoarthritis of the temporomandibular joint. J. Clin. Diagn. Res. (2015) ; 9: (7): ZC95–ZC97. doi: 10.7860/JCDR/2015/12302.6260. |
[20] | Chen W, Wei K, Zhao WL, Zhou XB. Estimation of key comorbidities for osteoarthritis progression based on the EMR-claims dataset. IEEE Access. (2019) ; 7: : 72431–72442. doi: 10.1109/ACCESS.2019.2919998. |
[21] | Ickinger C, Tikly M. Current approach to diagnosis and management of osteoarthritis. SA Fam. Pract. (2014) ; 56: (2): 102–108. doi: 10.1080/20786204.2010.10874013. |
[22] | Badlani JT, Borrero C, Golla S, Harner CD, Irrgang JJ. The effects of meniscus injury on the development of knee osteoarthritis: data from the osteoarthritis initiative. Am. J. Sports. Med. (2013) ; 41: (6): 1238–1244. doi: 10.1177/0363546513490276. |
[23] | Liu Y, Wang YF. The economics of osteoarthritis. Chin. J. Osteoporos. (2011) ; 17: (2): 181–184. doi: 10.3969/j.issn.1006-7108.2011.02.022. |
[24] | Mounach A, Nouijai A, Ghozlani I, Ghazi M, Achemlal L, Bezza A. et al. Risk factors for knee osteoarthritis in Morocco. A case control study. Clin. Rheumatol. (2008) ; 27: (3): 323–326. doi: 10.1007/s10067-007-0709-8. |
[25] | Cross M, Smith E, Hoy D, Nolte S, Ackerman I, Fransen M. et al. The global burden of hip and knee osteoarthritis: estimates from the global burden of disease 2010 study. Ann. Rheum. Dis. (2014) ; 73: (7): 1323–1330. doi: 10.1136/annrheumdis-2013-204763. |
[26] | Choi Y-J, Ra HJ. Patient satisfaction after total knee arthroplasty. Knee Surg. Relat. Res. (2016) ; 28: (1): 1–15. doi: 10.5792/ksrr.2016.28.1.1. |
[27] | Hast MW. Assessment of total knee replacement performance using muscle-driven dynamic simulations. Dept. Mech. and Nucl. Engn., Penn. State Univ., University Park, PA, USA; (2011) . |
[28] | Macdessi SJ, Jang B, Harris IA, Wheatley E, Bryant C, Chen DB. A comparison of alignment using patient specific guides, computer navigation and conventional instrumentation in total knee arthroplasty. Knee. (2014) ; 21: (2): 406–409. doi: 10.1016/j.knee.2013.11.004. |
[29] | Qiu B, Zhang MJ, Tang BS, Deng BY, Li DC, Liu F. Total knee arthroplasty based on the assistance of three-dimensional-printing personalized surgical navigation template. Chin. J. Tis. Eng. Res. (2015) ; 19: (48): 7731–7735. doi: 10.3969/j.issn.2095-4344.2015.48.004. |
[30] | Bendjaballah MZ, Shirazi-Adl A, Zukor DJ. Biomechanics of the human knee joint in compression: reconstruction, mesh generation and finite element analysis. Knee. (1995) ; 2: (2): 69–79. doi: 10.1016/0968-0160(95)00018-K. |
[31] | Donahue TLH, Hull ML, Rashid MM, Jacobs CR. A finite element model of the human knee joint for the study of tibio-femoral contact. J. Biomech. Eng. (2002) ; 124: (3): 273–280. doi: 10.1115/1.1470171. |
[32] | Guo Y, Zhang XS, Chen WY. Three-dimensional finite element simulation of total knee joint in gait cycle. Acta Mech. Solida Sin. (2009) ; 22: (4): 347–351. doi: 10.1016/S0894-9166(09)60283-4. |
[33] | Bao CY, Meng QH. Establishment of three-dimensional biomechanics model of knee joint and its analysis based on finite element method. J. Wuhan Inst. Phys. Educ. (2010) ; 44: (5): 56–59. doi: 10.3969/j.issn.1000-520X.2010.05.012. |
[34] | Mamat NNM, Aub ONA, Oshkour A. Numerical measurement of contact pressure in the tibiofemoral joint during gait. Proc. ICoBE. Penang, Malaysia, February 27–28, (2012) ; 38–43. doi: 10.1109/ICoBE.2012.6178951. |
[35] | Zhang QY, Zhang CQ, Ge HY, Meng D. Establishment of 3-dimensional finite element model of human knee joint and biomechanical analysis. J. Tianjin Univ. Tech. (2015) ; 31: (3): 27–30. doi: 10.3969/j.issn.1673-095X.2015.03.006. |
[36] | Wang JR, Du WJ, Wang CJ, Guo Y, Chen WY. Biomechanical characteristics of tibio-femoral joint under different flexion angles by finite element analysis. Chin. J. Tis. Eng. Res. (2018) ; 22: (31): 4975–4981. doi: 10.3969/j.issn.2095-4344.0336. |
[37] | Li G, Gil J, Kanamori A, Woo SLY. A validated three-dimensional computational model of a human knee joint. J. Biomech. Eng. (1999) ; 121: (6): 657–662. doi: 10.1115/1.2800871. |
[38] | Defrate LE, Sun H, Gill TJ, Rubash HE, Li GA. In vivo tibiofemoral contact analysis using 3D MRI-based knee models. J. Biomech. (2004) ; 37: (10): 1499–1504. doi: 10.1016/j.jbiomech.2004.01.012. |
[39] | Guess TM, Thiagarajan G, Kia M, Mishra M. A subject specific multibody model of the knee with menisci. Med. Eng. Phys. (2010) ; 32: (5): 505–515. doi: 10.1016/j.medengphy.2010.02.020. |
[40] | Kazemi M, Li LP. A viscoelastic poromechanical model of the knee joint in large compression. Med. Eng. Phys. (2014) ; 36: (8): 998–1006. doi: 10.1016/j.medengphy.2014.04.004. |
[41] | Zhang Y, Hao ZX, Jin DW, Sun MX. A method of vivo human knee joint 3D model reconstruction based on MR images. Chin. J. Rehabil. Med. (2007) ; 22: (4): 339–342. doi: 10.3969/j.issn.1001-1242.2007.04.021. |
[42] | Hao ZX, Jin DW, Zhang JC, Zhang Y, Sun MX. Finite element analysis of in vivo tibio-femoral contact features with menisci. J. Tsinghua Univ. (Sci. and Tech.). (2008) ; 48: (2): 176–179. doi: 10.3321/j.issn:1000-0054.2008.02.006. |
[43] | Wang TF, Hao ZX, Gao XF. Biomechanical properties of the anterior cruciate ligament and the effects of injuries on the knee joint stability. J. Tsinghua Univ. (Sci. and Tech.). (2010) ; 50: (7): 1005–1008. doi: 10.16511/j.cnki.qhdxxb.2010.07.033. |
[44] | Li Q, Tong L, Li YL. Three-dimensional finite element analysis of the tibial, femoral and meniscal articular cartilage at different angles of knee flexion. Chin. J. Sports Med. (2014) ; 33: (7): 692–696. doi: 10.3969/j.issn.1000-6710.2014.07.011. |
[45] | Wang YX, Fan YB, Zhang M. Comparison of stress on knee cartilage during kneeling and standing using finite element models. Med. Eng. Phys. (2014) ; 36: (4): 439–447. doi: 10.1016/j.medengphy.2014.01.004. |
[46] | Park S, Lee S, Yoon J, Chae SW. Finite element analysis of knee and ankle joint during gait based on motion analysis. Med. Eng. Phys. (2019) ; 63: : 33–41. doi: 10.1016/j.medengphy.2018.11.003. |
[47] | Pena E, Calvo B, Martinez MA, Doblare M. A three-dimensional finite element analysis of the combined behavior of ligaments and menisci in the healthy human knee joint. J. Biomech. (2006) ; 39: (9): 1686–1701. doi: 10.1016/j.jbiomech.2005.04.030. |
[48] | Li JY, Zhao WD, Yu ZH, Nie LY, Zhang GC, Tang L, et al. Three-dimensional reconstruction of articular cartilages in knee joint. Chin. J. Anat. (2007) ; 30: (6): 695–697. doi: 10.3969/j.issn.1001-1633.2007.06.009. |
[49] | Wang JP, Qian LW, Wang CT. Simulation of geometric anatomy model of human knee joint. J. Syst. Simul. (2009) ; 21: (10): 2806–2809. |
[50] | Wang DZ, Yu ZH, Zhou MQ, Li, JY. Three-dimensional knee joint model reconstruction. J. Clin. Rehabil. Tis. Eng. Res. (2010) ; 14: (48): 8945–8949. doi: 10.3969/j.issn.1673-8225.2010.48.005. |
[51] | Dong YF, Hu GH, Zhang LL, Hu Y, Dong YH, Xu QR. Accurate 3D reconstruction of subject-specific knee finite element model to simulate the articular cartilage defects. J. Shanghai Jiaotong Univ. (Sci.). (2011) ; 16: (5): 620–627. doi: 10.1007/s12204-011-1199-z. |
[52] | Kiapour AM, Kaul V, Kiapour A, Quatman CE, Wordeman SC, Hewett TE, et al. The effect of ligament modeling technique on knee joint kinematics: a finite element study. Appl. Math. (2014) ; 4: (5A): 91–97. doi: 10.4236/am.2013.45A011. |
[53] | Dong YF, Mou ZF, Huang ZY, Hu GH, Dong YH, Xu QR. Three-dimensional reconstruction of subject-specific knee joint using computed tomography and magnetic resonance imaging image data fusions. Proc. Inst. Mech. Eng. Part H: J. Eng. Med. (2013) ; 227: (10): 1083–1093. doi: 10.1177/0954411913493723. |
[54] | Carey RE, Zheng LY, Aiyangar AK, Harner CD, Zhang XD. Subject-specific finite element modeling of the tibiofemoral joint based on CT, magnetic resonance imaging and dynamic stereo-radiography data in vivo. J. Biomech. Eng. (2014) ; 136: (4): 041004. doi: 10.1115/1.4026228. |
[55] | Liu J, Zhang JY, Wu YZ, Huang HJ, Ouyang HB, Huang WH. Three-dimensional reconstruction of knee joint by combining CT and MRI. Chin. J. Anat. (2015) ; 38: (3): 316–318. doi: 10.3969/j.issn.1001-1633.2015.03.017. |
[56] | Kang KT, Kim SH, Son J, Lee YH, Chun HJ. In vivo evaluation of the subject-specific finite element model for knee joint cartilage contact area. Int. J. Precis. Eng. Manuf. (2015) ; 16: (6): 1171–1177. doi: 10.1007/s12541-015-0151-9. |
[57] | Beidokhti HN, Janssen D, Van De GS, Hazrati J, Van Den BT, Verdonschot N. The influence of ligament modelling strategies on the predictive capability of finite element models of the human knee joint. J. Biomech. (2017) ; 65: : 1–11. doi: 10.1016/j.jbiomech.2017.08.030. |
[58] | McDermott ID, Sharifi F, Bull AMJ, Gupte CM, Thomas RW, Amis AA. An anatomical study of meniscal allograft sizing. Knee Surg. Sports Traumatol. Arthrosc. (2004) ; 12: (2): 130–135. doi: 10.1007/s00167-003-0366-7. |
[59] | Niu JL, Qin XS, Hong J, Wang WJ, Li YZ. Reconstruction of three-dimensional skeleton optimization model of human knee joint based on CT images. Chin. J. Med. Phys. (2016) ; 33: (7): 700–703. doi: 10.3969/j.issn.1005-202X.2016.07.012. |

