
Estimates of Intracellular Dopamine in Parkinson’s Disease: A Systematic Review and Meta-Analysis
Abstract
Background:
The hallmark of Parkinson’s disease is depletion of dopamine in the basal ganglia. Models of Parkinson’s disease include dopamine as a contributor to disease progression. However, intraneuronal levels of dopamine have not been reported.
Objective:
Meta-analytic methods were utilized to determine intracellular dopamine levels in Parkinson’s disease.
Methods:
A systematic review of the literature and frequentist meta-analyses were performed. Dopamine levels were scaled for cell and axon numbers as well as VMAT2 protein levels.
Results:
Reduced tissue dopamine, dopaminergic cell bodies and VMAT2 protein were confirmed. The ratio of Parkinson’s to normal brain intracellular dopamine scaled for either cell or axon number, each with VMAT2 level in the caudate ranged from 1.49 to 1.87 (p = 0.51 and p = 0.12, respectively) and in the putamen from 0.75 to 4.61 (p = 0.40 and 0.001, respectively).
Conclusion:
Free, intracellular dopamine levels are not reduced in Parkinson’s disease compared to normals to a similar degree as are total tissue concentrations, supporting the relevance of modulating VMAT2, neuromelanin and/or dopamine synthesis as rational neuroprotective strategies.
INTRODUCTION
The hallmark biochemical abnormality in Parkinson’s disease is depletion of dopamine in the basal ganglia [1]. In that context, the clinical trial by Cotzias et al. established the utility of dopaminergic stimulation on the motor symptoms of Parkinson’s disease [2]. Dopaminergic therapies are standard of care for Parkinson’s disease [1, 3, 4].
In parallel to dopamine’s critical role in motor control, its neurotoxic metabolites are tightly controlled in normal neurons, primarily through vesicular sequestration intracellularly [5, 6]. In Parkinson’s disease, dopamine metabolism is altered and the cellular mechanisms to sequester toxic metabolites are impaired [7, 8], leading to a central role in models of disease [9–12]. While the likelihood of dopamine contributing to disease progression would appear more likely in the presence of significant cellular levels, absent from the literature are reports of intraneuronal and/or intracytoplasmic dopamine levels in Parkinson’s disease. This analysis leverages published pathology studies of patients with advanced Parkinson’s disease to determine intracellular dopamine levels utilizing meta-analytic methods.
MATERIALS AND METHODS
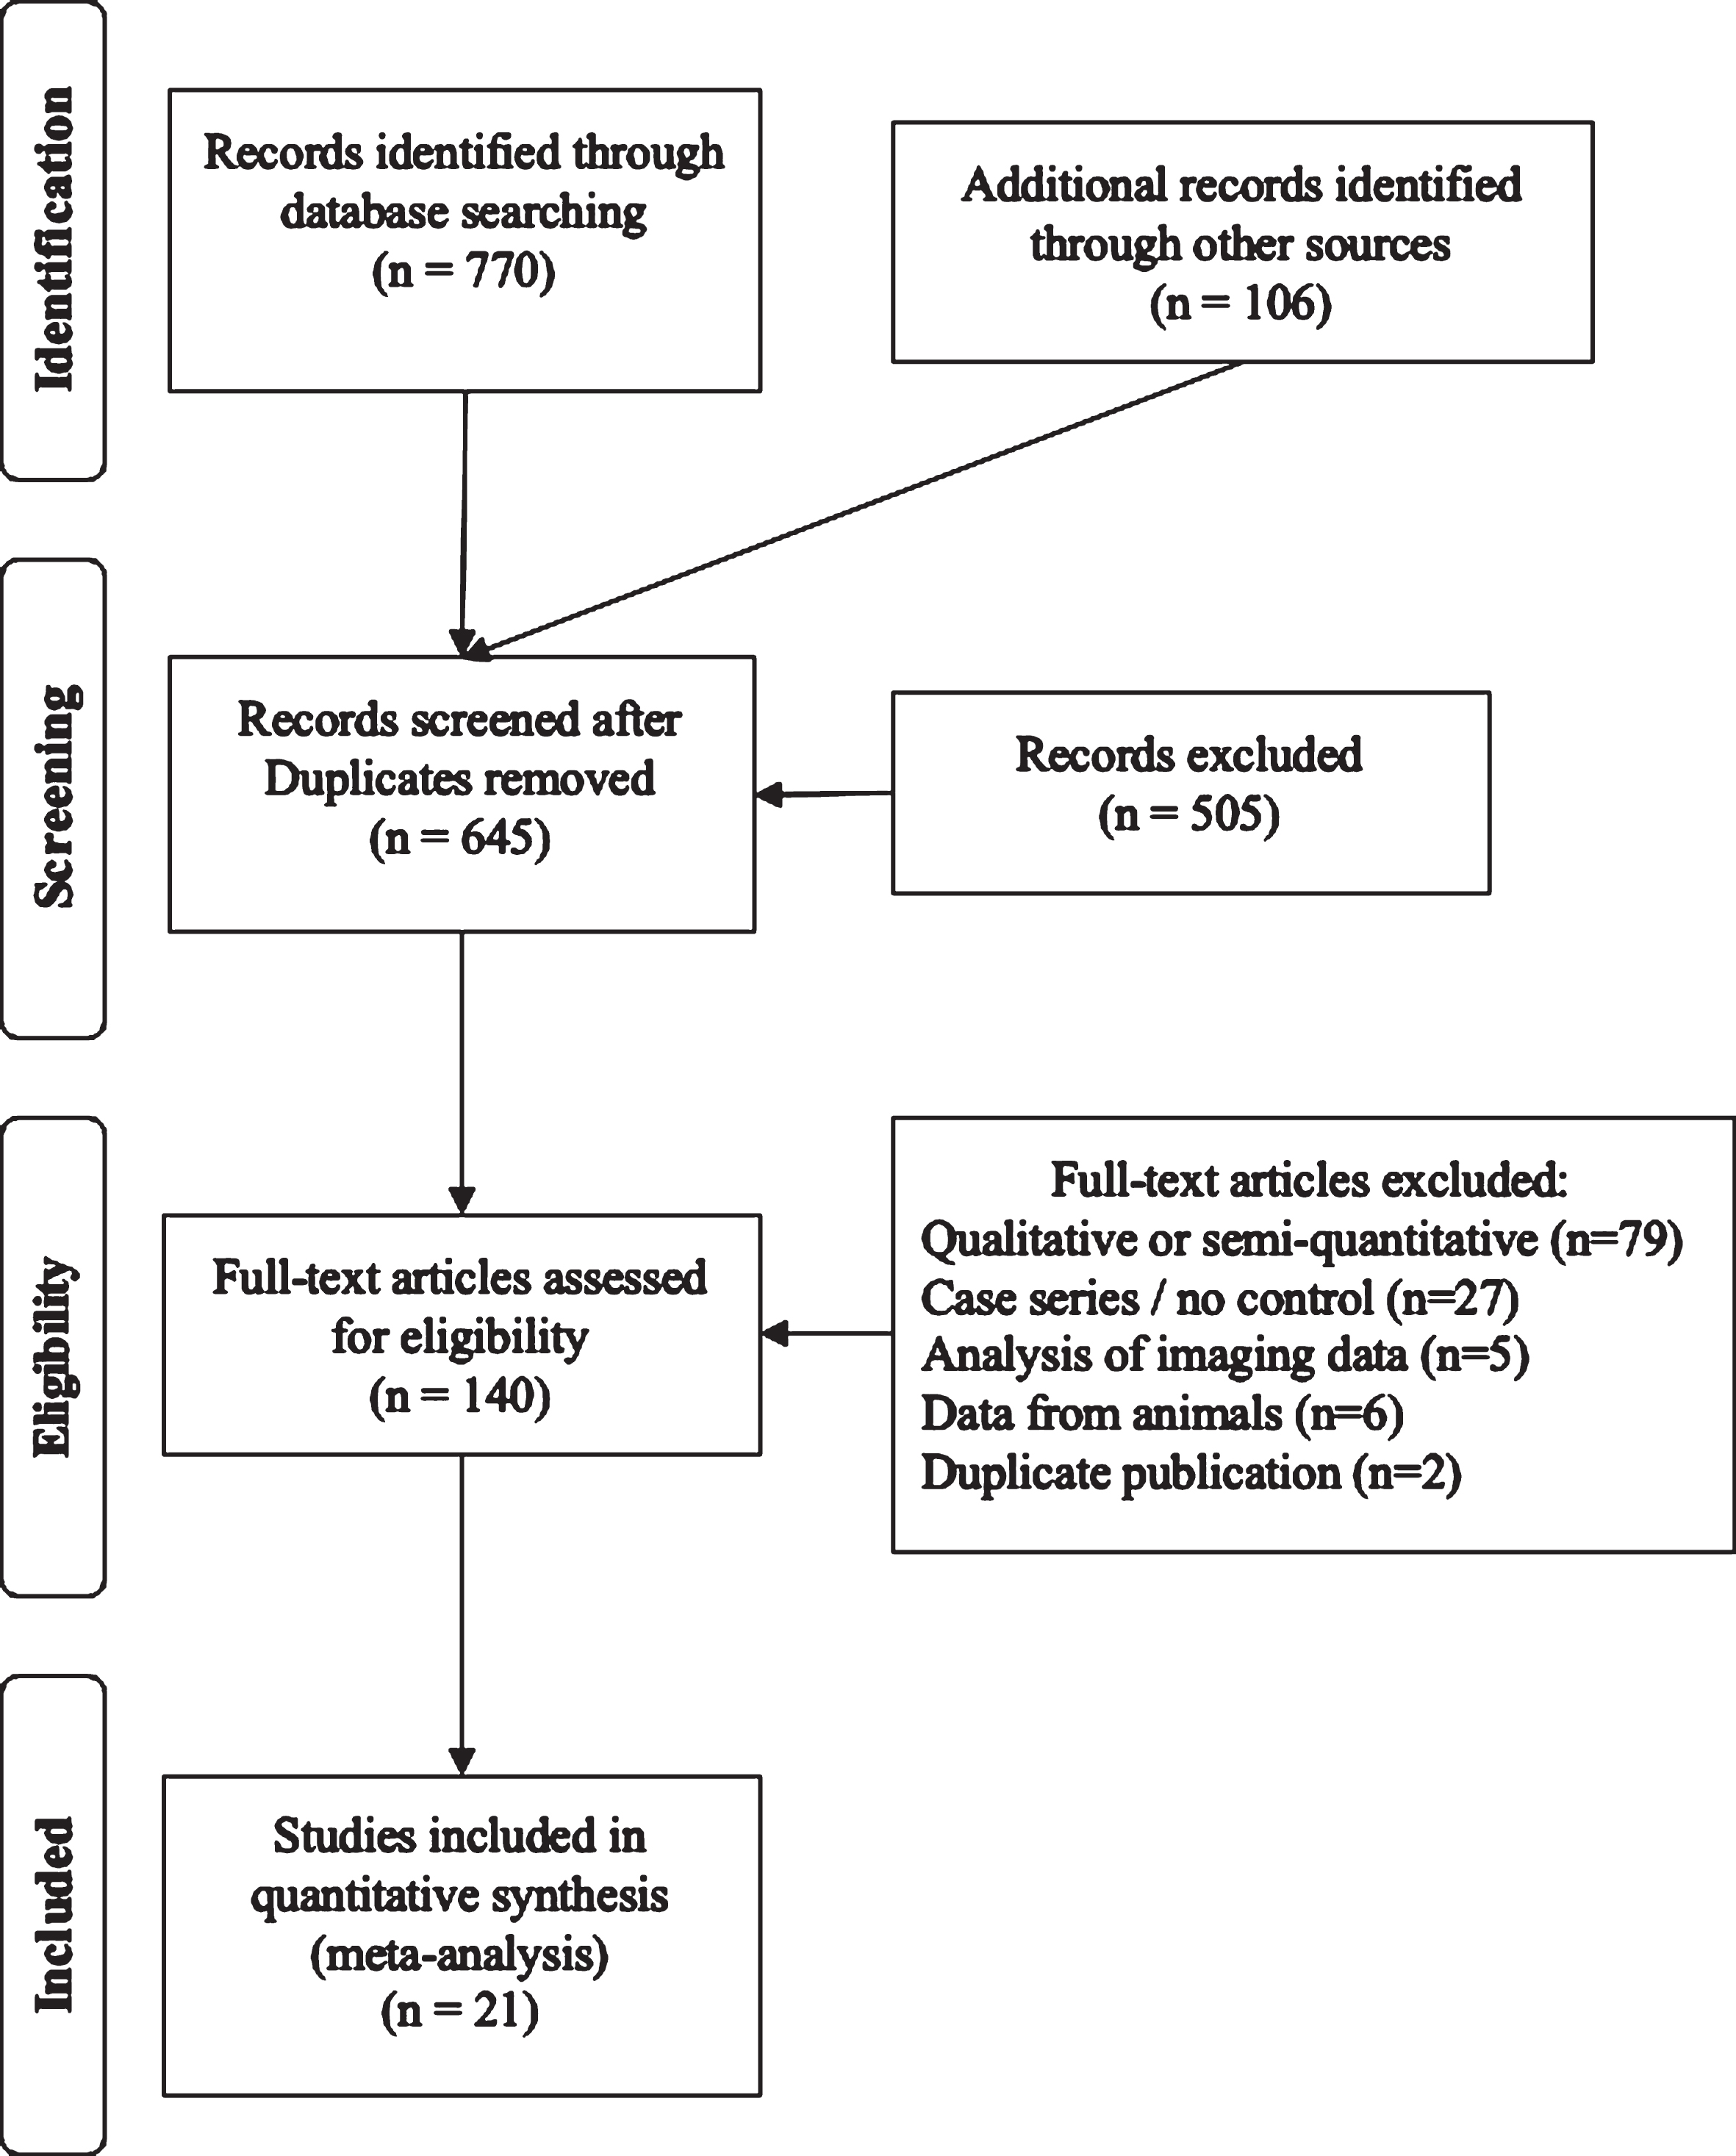
The PRISMA flow diagram summarizes the systematic review (Fig. 1). Search strategies on PubMed were: 1) Parkinson’s AND dopamine AND autopsy, 2) Parkinson’s AND substantia nigra AND autopsy, 3) Parkinson’s AND autopsy AND (caudate OR putamen), 4) Parkinson’s AND autopsy AND vmat2, and 5) Parkinson’s AND autopsy AND axon*. When it became evident that these search strategies failed to include relevant publications from the 1960s, the literature searches were supplemented by reviewing citations in the identified publications as well as PubMed’s feature to identify later citations of identified studies. Studies were included when reporting data from brains harvested within 24 hours of death from patients with Parkinson’s compared with normal brains focused on: 1) tissue dopamine concentration, 2) enumeration of dopaminergic cell bodies, 3) VMAT2 protein levels, 4) dopamine vesicular uptake function, and/or 5) quantification of axonal projections from the substantia nigra. In cases where raw data was represented graphically, images were digitized and values determined via use of GraphClick (Arizona Software, v.2.9b2) running on Mac OS X v.10.11.6 at 200%magnification [13]. Data were obtained via digitization for cell counts from two studies [14, 15] and from one for axon density [16]. Where variances were not reported for relevant data, it was imputed by using the maximum ratio of standard deviation relative to the mean value in the corresponding studies where standard deviations were reported.
Fig. 1
PRISMA diagram of the systematic review.
Frequentist meta-analyses were performed using random effects model using R and the metaphor package. (RStudio v.1.2.5033, R v.3.6.3, metafor v.2.4-0) First, dopamine tissue levels were analyzed, doing so separately for the caudate and putamen. Next, cell body counts in the substantia nigra were analyzed, as were VMAT2 protein levels for the caudate and putamen. Insufficient studies of vesicle function and axonal projection quantities were available for meta-analysis. The meta-analyses were performed on the ln-transformed mean differences and mean ratios of Parkinson’s disease to normal values and reported on a linear scale.
For analysis of dopamine levels on per cell, per axon or per VMAT2, and the combinations of per cell with per VMAT2 and per axon with per VMAT2, the dopamine value from Parkinson’s disease brains were scaled accordingly with that value used to determine the ratios of Parkinson’s disease to normal. The point estimates for the ratios of cell and axon numbers as well as VMAT2 levels from random effects meta-analysis of those data were used as scaling factors. As an example, the equation for the ratio of Parkinson’s disease to normal dopamine level, scaled for VMAT2 level and cell number is Scaled DopamineperVMAT2hboxcell # = (DopaminePD / VMAT2 ratio / Cell ratio) / DopamineNormal; where VMAT2 and cell ratios are the point estimates calculated in this meta-analysis.
The single published report of fiber density from the substantia nigra reported total density to the striatum. This fiber density was apportioned according to the point estimate of the relative content of dopamine within the caudate and putamen calculated in this analysis. The justification for not assuming equal innervation between caudate and putamen is based on imaging studies in Parkinson’s disease patients, both for treatment naïve [17] and L-dopa treated patients [18], which show more marked reduction in putamen innervation. To test this assumption, the analyses were repeated with innervation divided equally.
Ideally, meta-regression models would be built with dopamine as independent variable with cell/axon number and VMAT2 levels (caudate/putamen) as covariates. Because measurements of tissue dopamine and each of these other parameters were from different sets of brains (except as noted in Table 1), introducing these covariates is not possible. Development of these models using presynaptic axon terminals in the caudate and putamen would be expected to provide more precision in the estimates of intracellular and cytoplasmic levels in each region. However, due to the lack of such published data, the surrogate of cell bodies counted in the substantia nigra was used.
Table 1
Studies included in the analysis with indication of what data were available for this analysis
| Study | Year | Normal (n) | PD (n) | Caudate Dopamine | Putamen Dopamine | SN Cell Bodies | Caudate VMAT2 | Putamen VMAT2 | Vesicular Uptake | Axon Number |
| Ehringer [19] | 1960* | 12 | 2 | x | x | |||||
| Bernheimer [20] | 1963 | 3 | 6 | x | x | |||||
| Bernheimer [20] | 1965 | 6 | 7 | x | x | |||||
| Kish [33] | 1988 | 10 | 8 | x | x | |||||
| Rajput [22] | 2008 | 5 | 8 | x | x | |||||
| Pakkenberg [23] | 1965 | 10 | 10 | x† | ||||||
| McGeer [14] | 1977 | 5 | 4 | x‡ | ||||||
| Hirsch [24] | 1988 | 3 | 4 | x‡ | ||||||
| German [25] | 1989 | 3 | 4 | x† | ||||||
| Rinne [15] | 1989 | 18 | 12 | x† | ||||||
| Pakkenberg [26] | 1991 | 2 | 5 | x† | ||||||
| Fearnley [27] | 1991 | 35 | 20 | x† | ||||||
| Ma [28] | 1997 | 12 | 12 | x† | ||||||
| Damier [29] | 1999 | 5 | 5 | x‡ | ||||||
| Dickson [30] | 2008 | 17 | 16 | x‡ | ||||||
| Kordower [16] | 2013 | 9 | 28 | x†‡ | x | |||||
| Iacono [34] | 2015 | 6 | 6 | x‡ | ||||||
| Wilson [31] | 1996 | 10 | 12 | x | x | x | ||||
| Miller [32] | 1999 | 2 | 4 | x | x | |||||
| Pifl [7] | 2014 | 4 | 6 | x | x | x | x | |||
| Goldstein [8] | 2013 | 14 | 17 | x | x | x |
*This paper was republished in 1998 in English, †assessed by number of melanin positive cells, ‡assessed by number of tyrosine hydroxylase positive cells, PD, Parkinson’s disease; SN, substantia nigra; VMAT2, vesicular monoamine transporter 2.
Therefore, ratios were calculated for Parkinson’s disease relative to normal for dopamine, number of cells, level of VMAT2 protein and axonal projection amount. Dopamine levels were adjusted for the ratios between Parkinson’s disease and normal brains for these parameters, enabling calculation of dopamine/cell, dopamine/axon, dopamine/cell/VMAT2 and dopamine/axon/VMAT2. In each analysis of the ratio of Parkinson’s relative to normal, ratio of means was method used, and results reported here as linear transformed results, yielding description of Parkinson’s disease to normal ratios in dopamine on cellular, axonal and cytoplasmic basis.
Additional analysis was performed to test the role of dopaminergic therapy. Because studies did not uniformly report whether the medical regimen of patients included dopaminergic therapy, studies were selected from the pre-dopaminergic therapy era from those reporting tissue dopamine content [19–21].
RESULTS
Studies included in the analysis are listed in Table 1 [7, 8, 14–16, 19–34], along with the parameters included in each. Table 1 provides listings of data extracted from these studies. [Excel file supplementary material]. As shown, one study was identified that reported axonal projection quantity [16]. Two studies reported differences in vesicular function using different measures, uptake and binding studies in one [7] and indirect assessment in the other, based on dopamine to DOPA ratio [8], which was insufficient to perform a meta-analysis, thus, VMAT2 protein was used as a surrogate.
The meta-analysis confirmed tissue dopamine levels in the caudate were reduced to 18%of normal (95%CI: 10, 30%, p < 0.0001) and in the putamen to 4%of normal (95%CI: 2, 8%, p < 0.0001). Cell bodies in the substantia nigra were reduced to 29%of normal (95%CI: 22, 37%, p < 0.0001). VMAT2 levels in the caudate were reduced to 48%of normal (95%CI: 34, 69%, p < 0.0001) and in the putamen to 22%of normal (95%CI: 17, 29%, p < 0.0001) (Table 2). From digitizing graphs, axon density was calculated at 28%[16].
Table 2
Dopamine related biochemical parameters expressed as Parkinson’s to normal ratios as derived via meta-analyses
| Parameter | Mean Ratio | 95%CI | p |
| Dopamine: Caudate | 0.18 | 0.10, 0.30 | < 0.0001 |
| Dopamine: Putamen | 0.04 | 0.02, 0.08 | < 0.0001 |
| SN Cells | 0.29 | 0.22, 0.37 | < 0.0001 |
| VMAT2: Caudate | 0.48 | 0.34, 0.69 | < 0.0001 |
| VMAT2: Putamen | 0.22 | 0.17, 0.29 | < 0.0001 |
*p-value derived by random effects model of log transformed mean differences expressed on linear scale.
The proportion of axons to the each of the caudate and putamen was determined from the calculations of dopamine content of each region, apportioning the reported axon density at the same ratio (Table 2). As the reduction in putamen dopamine was 4.5x that of the reduction in the caudate (0.18 vs. 0.04), this ratio was used to allocate 82%of the axon fiber density to the caudate and 18%to the putamen, or a ratio of 0.23 and 0.05, respectively.
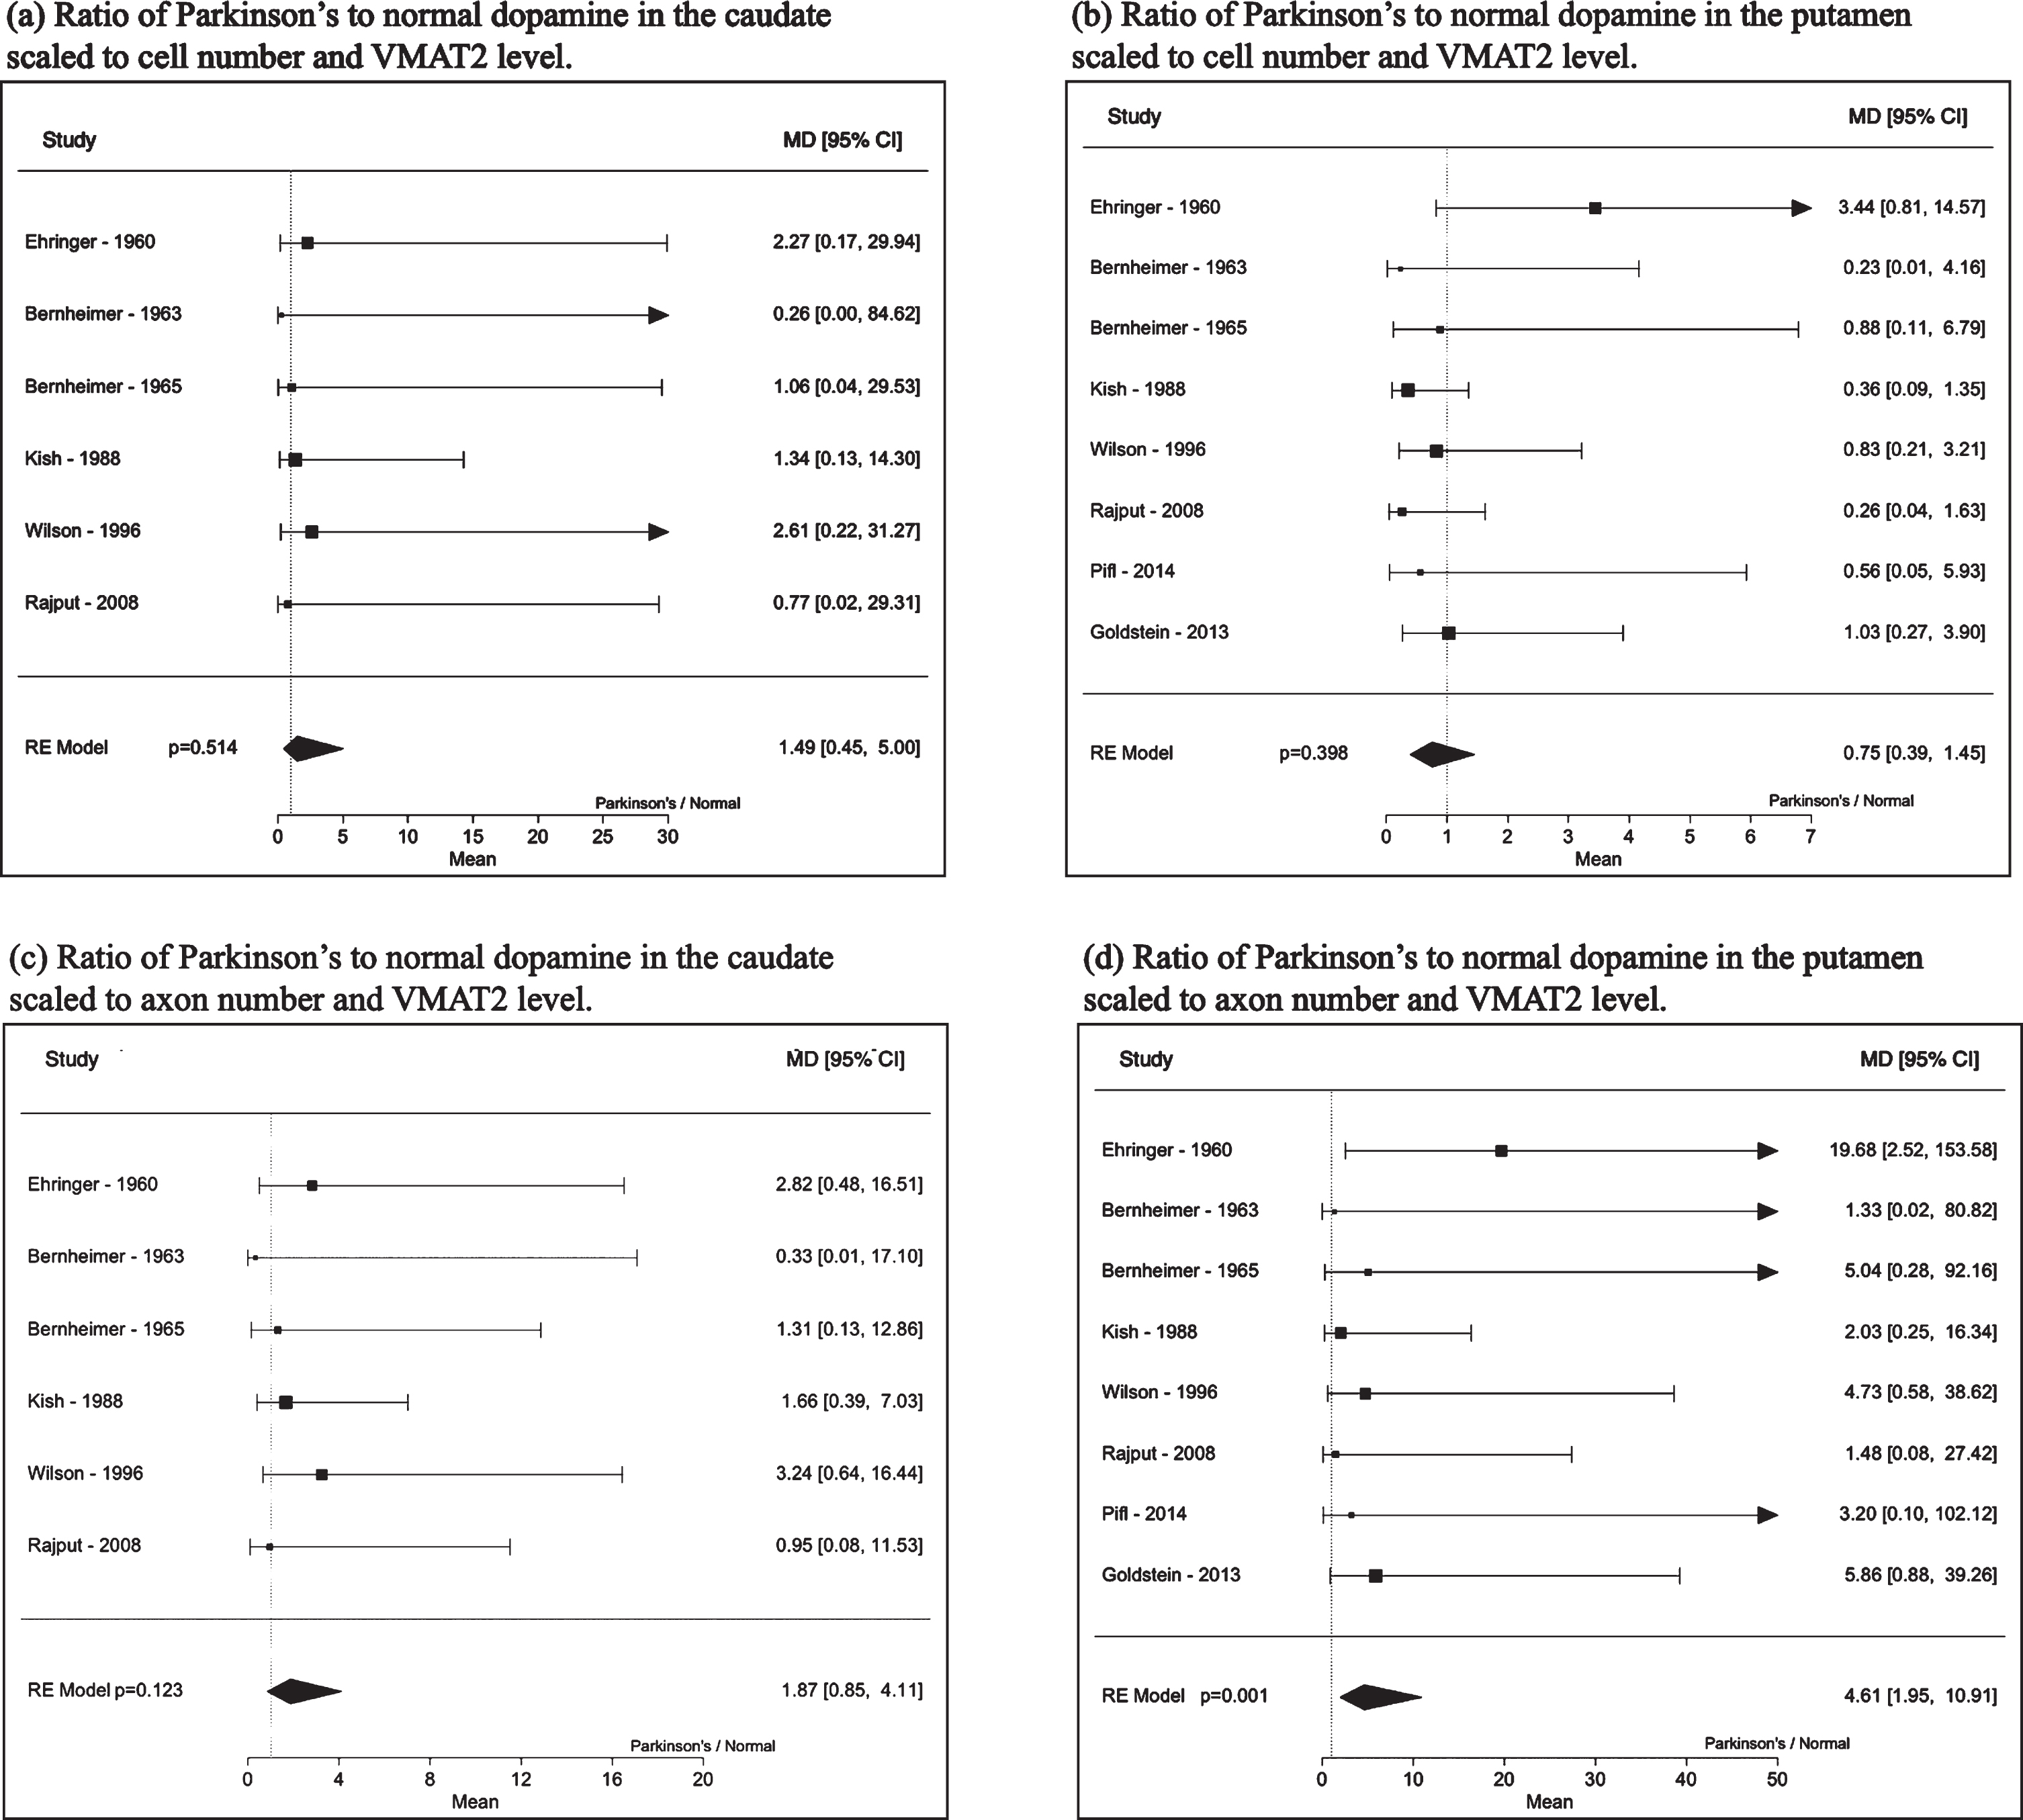
Analyses of dopamine levels scaled to cells, axons and VMAT2 are shown in Table 3. Accounting for the decrease in cell or axon numbers in Parkinson’s disease along with the decrease in VMAT2 levels shows that on a cellular level, the ratio of Parkinson’s disease to normal brain free, intracellular dopamine levels in the caudate appear unlikely to be reduced (adjusted for cell count and VMAT2 level: 1.49, 95%CI: 0.45, 5.00, p = 0.51 and for axon count and VMAT2 level: 1.87, 95%CI: 0.85, 4.11, p = 0.12). Those in the putamen adjusted for cell count and VMAT2 level were 0.75, 95%CI: 0.39, 1.45, p = 0.40 and for axon count and VMAT2 level were 4.61, 95%CI: 1.95, 10.91, p = 0.001. Forest plots are shown in Fig. 2.
Table 3
Dopamine ratio of Parkinson’s to normal in the caudate and putamen, scaled to the factor(s) shown as derived via meta-analyses
| Scaling Factor(s) | Caudate | Putamen | ||||
| Mean Ratio | 95%CI | p | Mean Ratio | 95%CI | p | |
| Cell | 0.71 | 0.43, 1.18 | 0.19 | 0.16 | 0.08, 0.30 | < 0.0001 |
| Axon | 0.82 | 0.50, 1.33 | 0.42 | 1.01 | 0.45, 2.24 | 0.99 |
| Cell &VMAT2 | 1.49 | 0.45, 5.00 | 0.51 | 0.75 | 0.39, 1.45 | 0.40 |
| Axon &VMAT2 | 1.87 | 0.85, 4.11 | 0.12 | 4.61 | 1.95, 10.91 | 0.001 |
| Pre-Rx Era Subset | ||||||
| Cell | 0.64 | 0.26, 1.61 | 0.34 | 0.26 | 0.06, 1.14 | 0.073 |
| Axon | 0.62 | 0.21, 1.87 | 0.40 | 1.99 | 0.47, 8.49 | 0.35 |
| Cell &VMAT2 | 1.38 | 0.20, 9.47 | 0.74 | 1.29 | 0.30, 5.58 | 0.73 |
| Axon &VMAT2 | 1.72 | 0.46, 6.43 | 0.42 | 9.07 | 1.92, 42.88 | 0.005 |
*p-value derived by random effects model of log transformed mean differences expressed on linear scale.
Fig. 2
Dopamine ratio (Parkinson’s to normal) of caudate and putamen (a) - (b) scaled to cell number and VMAT2 levels and (c) - (d) dopamine scaled to axon number and VMAT2 protein levels.
The assumption was tested that axonal fiber densities were equally distributed between the two regions. For the caudate, dopamine level in Parkinson’s disease relative to normal—adjusted for axon number and VMAT2 levels was 1.53 (95%CI: 0.72, 3.25, p = 0.26) and for the putamen was 0.73 (95%CI: 0.38, 1.83, p = 0.33).
The analyses were repeated using dopamine levels measured in human brains prior to the dopaminergic therapy era, allowing 3 studies published by 1965 [19–21] to be used as sources of dopamine levels. Dopamine levels in Parkinson’s disease relative to normal were calculated for the caudate as 0.13 (95%CI: 0.04, 0.42), p = 0.001 and for the putamen as 0.06 (95%CI: 0.01, 0.29), p < 0.001). Scaled to cell number and VMAT2 level, dopamine level in Parkinson’s disease relative to normal calculated for the caudate was 1.38 (95%CI: 0.20, 9.47), p = 0.74 and for the putamen was 1.29 (95%CI: 0.30, 5.58), p = 0.73). Scaled to axon number and VMAT2 level, dopamine level in Parkinson’s disease relative to normal calculated for the caudate was 1.72 (95%CI: 0.46, 6.43), p = 0.42 and for the putamen was 9.07 (95%CI: 1.92, 42.88), p = 0.005).
DISCUSSION
While irrefutable that the biochemical hallmarks of Parkinson’s disease is loss of dopamine in the basal ganglia [1, 3, 4] in parallel to loss of dopaminergic neurons [14–16, 23–30], this analysis provides the first evidence that intracellular and intracytoplasmic dopamine levels in dopaminergic neuron are not markedly reduced as they are for tissue levels, supporting a role for dopamine and its toxicity as a contributor to disease progression, as advocated by several proposed models of disease [9–12]. This analysis confirms that unadjusted levels of dopamine are markedly and significantly reduced in the caudate and even more so in the putamen. When dopamine levels are evaluated on a per cell or per axon basis, dopamine levels in the caudate trend lower and putamen levels are significantly lower than normal per cell, but not per axon. The magnitude of each reduction appears less than the tissue level reductions. When dopamine levels are evaluated based on the combination of cell number and VMAT2 protein level, the latter an indicator of the neuronal capability to sequester dopamine and minimize oxidative damage, dopamine cytosolic levels are not significantly reduced in the caudate or putamen of Parkinson’s disease relative to normal brains. When levels are evaluated based on the combination of axon number and VMAT2 level, caudate dopamine trends higher in Parkinson’s disease and putamen dopamine is significantly elevated relative to normal brains.
The identification of preserved free, intracellular dopamine levels means that the risk of cellular dysfunction and death due to dopamine-mediated toxicity may represent a novel therapeutic target, supporting its central role in postulated disease models and the therapeutic potential of increasing VMAT2 expression, improving cytoplasmic vesicle function [5, 6], modulating dopamine synthesis and/or modulating neuromelanin function [5, 35], as neuromelanin serves to sequester dopamine and reduce risk of neuronal toxicity. The results using dopamine tissue level data from patients not treated with dopaminergic therapies provide reassurance that the conclusions of preserved and/or elevated cytosolic dopamine levels are not merely a function of levodopa or other dopaminergic therapies and part of disease progression. Analyses performed assuming equal distribution of axons between caudate and putamen indicate a lack of intracellular or cytosolic dopamine depletion and represent an extreme assumption and thereby add credibility to the findings herein.
Dopamine causes neuronal cytotoxicity via: oxidative stress, adverse interaction with α-synuclein, mitochondrial dysfunction and vesicular dysfunction [10, 36, 37]. Several preclinical models emphasize the potential relevance of the dopaminergic toxicity, wherein the reversible, competitive tyrosine hydroxylase inhibitor metyrosine was introduced in order to decrease dopamine synthesis. In a rodent MPTP model, dopaminergic neuron survival was enhanced by tyrosine hydroxylase inhibition [38]. In a rodent 6-OHDA model, tyrosine hydroxylase inhibition preserved dopamine synthetic capacity when assessed 2 weeks after toxin exposure [39]. And in iPS dopaminergic neurons from DJ-1 homozygous patients, tyrosine hydroxylase inhibition reduced oxidative stress and α-synuclein deposition (whereas L-DOPA increased both and reduced neuron survival) [10]. Overexpression of VMAT2 blocked neurotoxic effects of MPTP [38]. Similarly, overexpression of VMAT2 in the mouse MPTP model reduced dopaminergic neuron toxicity and improved animal behavior [5, 6]. Together, these data show potential utility of modulating intracellular dopamine levels in Parkinson’s disease.
This analysis must be interpreted in the context of several limitations. First, these meta-analyses include a small number of studies for each parameter, with many including only a few data points. Second, cellular dopamine calculations were based on calculated ratios of cell counts, axon numbers and VMAT2 protein levels. The ratios were calculated from means and standard deviations for the values in Parkinson’s disease and normals, which required calculation of variance for the ratios, as the studies did not report variances for the ratios of Parkinson’s diseaseto normal brains. Calculating the standard deviation introduces greater uncertainty. Third, for the parameter of cell body numbers, identification could be based on melanin staining or presence of the rate-limiting step in dopamine synthesis –tyrosine hydroxylase. The data herein were based on the combination of measures of cell numbers via counting of melanin- or tyrosine hydroxylase-staining cells. Fourth, all the data in this analysis are derived from patients with advanced Parkinson’s disease, limiting the ability to infer that the findings are relevant in early disease. Fifth, differences in axon number were based on a single study, rather than meta-analysis of several. Nonetheless, the internal consistency of the findings suggests that the results are reliable, particularly when considering findings from imaging studies in clinical Parkinson’s disease [17, 18, 40, 41]. Sixth, because these different parameters were measured in distinct studies, it is not possible to perform meta-regression analysis with these parameters as covariates, thus the analyses use dopamine levels scaled to cell/axon numbers and VMAT2 levels. Seventh, the assay for measuring VMAT2 levels detect levels from both dopaminergic and serotonergic neurons. Pifl addressed this concern by showing the functional rate of uptake was similar when corrected for 5-HT nerve-derived VMAT2 protein [7].
Because vesicular uptake rates were not included in this analysis, the results should be interpreted in the context of basal dopamine levels, rather than dynamic changes. However, with any impairment of vesicular function, it is likely that additional elevation in cytoplasmic levels is likely. Pifl and colleagues report that vesicular uptake rate is estimated to be reduced by 56%in the caudate and 90%in the putamen [7]. Goldstein et al report putamen vesicular uptake rate is 88.5%lower in the putamen [8]. Thus, the data presented in this manuscript may underestimate peak levels of intracytoplasmic dopamine in the basal ganglia in advanced Parkinson’s disease. An additional implication relates to the observation that more extreme reduction in tissue dopamine content of the putamen is accompanied by significant elevations in calculated cytosolic dopamine, which supports role of dopamine in disease progression, though does not provide clarity on whether this is due to toxic effects on the mitochondria, cytosolic interactions with α-synuclein or other mechanism.
In summary, advanced Parkinson’s disease is associated with relatively preserved intracellular and intracytoplasmic dopamine in both the caudate and putamen when accounting for cell numbers, axon numbers and VMAT2 levels. These meta-analyses support the view that in advanced Parkinson’s disease, the putamen is more dramatically affected than the caudate in its dopamine content and VMAT2 levels. While critical for these observations to be confirmed in future studies, the findings support the relevance of modulating presynaptic cytoplasmic dopamine levels in Parkinson’s disease and support a central role of dopamine toxicity in models of disease progression.
CONFLICT OF INTEREST
Jonathan Sackner-Bernstein is sole inventor on a patent filing for use of tyrosine hydroxylase inhibitors as therapy for Parkinson’s disease.
SUPPLEMENTARY MATERIAL
[1] The supplementary material is available in the electronic version of this article: https://dx.doi.org/10.3233/JPD-212715.
REFERENCES
[1] | Fahn S ((2017) ) Parkinsonism and related disorders. The 200-year journey of Parkinson disease: Reflecting on the past and looking towards the future. Parkinsonism Relat Disord 46: , 1–5. |
[2] | Cotzias G , Van Woert M , Schiffer L ((1967) ) Aromatic amino acids and modification of parkinsonism. N Engl J Med 276: , 374–379. |
[3] | Lang AE , Marras C ((2014) ) Initiating dopaminergic treatment in Parkinson’s disease. Lancet 384: , 1164–1166. |
[4] | NICE (2017) Parkinson’s Disease in Adults. |
[5] | Segura-Aguilar J , Sulzer D , Zucca FA , Zecca L ((2020) ) Overexpression of vesicular monoamine transporter-2 may block neurotoxic metabolites from cytosolic dopamine: A potential neuroprotective therapy for Parkinson’s disease. Clin Pharmacol Trans Med 3: , 143–148. |
[6] | Lohr KM , Miller GW ((2014) ) VMAT2 and Parkinson’s disease: Harnessing the dopamine vesicle. Expert Rev Neurother 14: , 1115–1117. |
[7] | Pifl C , Rajput A , Reither H , Blesa J , Cavada C , Obeso JA , Rajput AH , Hornykiewicz O ((2014) ) Is Parkinson’s disease a vesicular dopamine storage disorder? Evidence from a study in isolated synaptic vesicles of human and nonhuman primate striatum. J Neurosci 34: , 8210–8218. |
[8] | Goldstein DS , Sullivan P , Holmes C , Miller GW , Alter S , Strong R , Mash DC , Kopin IJ , Sharabi Y ((2013) ) Determinants of buildup of the toxic dopamine metabolite DOPAL in Parkinson’s disease. J Neurochem 126: , 591–603. |
[9] | Sulzer D ((2007) ) Multiple hit hypotheses for dopamine neuron loss in Parkinson’s disease. Trends Neurosci 30: , 244–250. |
[10] | Burbulla LF , Song P , Mazzulli JR , Zampese E , Wong YC , Jeon S , Santos DP , Blanz J , Obermaier CD , Strojny C , Savas JN , Kiskinis E , Zhuang X , Krüger R , Surmeier DJ , Krainc D ((2017) ) Dopamine oxidation mediates mitochondrial and lysosomal dysfunction in Parkinson’s disease. Science 357: , 1255–1261. |
[11] | Burbulla LF , Krainc D ((2019) ) The role of dopamine in the pathogenesis of GBA1-linked Parkinson’s disease. Neurobiol Dis 132: , 104545. |
[12] | Nguyen M , Wong YC , Ysselstein D , Severino A , Krainc D ((2019) ) Synaptic, mitochondrial, and lysosomal dysfunction in Parkinson’s disease. Trends Neurosci 42: , 140–149. |
[13] | Boyle MA , Samaha AL , Rodewald AM , Hoffmann AN ((2013) ) Evaluation of the reliability and validity of GraphClick as a data extraction program. Comput Human Behav 29: , 1023–1027. |
[14] | McGeer PL , McGeer EG , Suzuki JS ((1977) ) Aging and extrapyramidal function. Arch Neurol 34: , 33–35. |
[15] | Rinne JO , Mlic JR , Paljärvi L , Rinne UK ((1989) ) Dementia in Parkinson’s disease is related to neuronal loss in the medial substantia nigra: Dementia in nigral degeneration. Ann Neurol 26: , 47–50. |
[16] | Kordower JH , Olanow CW , Dodiya HB , Chu Y , Beach TG , Adler CH , Halliday GM , Bartus RT ((2013) ) Disease duration and the integrity of the nigrostriatal system in Parkinson’s disease. Brain 136: , 2419–2431. |
[17] | Tissingh G , Booij J , Bergmans P , Winogrodzka A , Janssen AGM , van Royen EA , Stoof JC , Wolters EC ((1998) ) Iodine-123-N-omega-fluoropropyl-2beta-carbomethoxy-3beta-(4-iod ophenyl)tropane SPECT in healthy controls and early-stage, drug-naive Parkinson’s disease. J Nucl Med 39: , 1143–1148. |
[18] | Innis RB , Seibyl JP , Scanley BE , Laruelle M , Abi-Dargham A , Wallace E , Baldwin RM , Zea-Ponce Y , Zoghbi S , Wang S ((1993) ) Single photon emission computed tomographic imaging demonstrates loss of striatal dopamine transporters in Parkinson disease. Proc Natl Acad Sci U S A 90: , 11965–11969. |
[19] | Ehringer H , Hornykiewicz O ((1960) ) Distribution of norepinephrine and dopamine (3-hydroxytyramine) in the brain of humans and their behavior in diseases of the extrapyramidal system. Klin Wochensch 38: , 1236–1239. |
[20] | Bernheimer H , Birkmayer W , Hornykiewicz O ((1963) ) The biochemistry of Parklnson-syndrome of men. Influence of monoamine oxidase-inhibitor therapy on the concentration of dopamine, noradrenaline and 5-hydroxytryptamin in the brain. Klin Wochensch 41: , 465–469. |
[21] | Bernheimer H , Hornykiewicz O ((1965) ) Herabgesetzte konzentration der homovanillinsäure im gehirn von parkinsonkranken menschen als ausdruck der störung des zentralen dopaminstoffwechsels (Decreased concentration of homovanillic acid in the brain of people with Parkinson’s disease as an experssion of the disruption of the central dopamine metabolism). Klin Wochensch 43: , 711–715. |
[22] | Rajput AH , Sitte HH , Rajput A , Fenton ME , Pifl C , Hornykiewicz O ((2008) ) Globus pallidus dopamine and Parkinson motor subtypes: Clinical and brain biochemical correlation. Neurology 70: , 1403–1410. |
[23] | Pakkenberg H , Brody H ((1965) ) The number of nerve cells in the substantia nigra in paralysis agitans. Acta Neuropathol 5: , 320–324. |
[24] | Hirsch E , Graybiel AM , Agid YA ((1988) ) Melanized dopaminergic neurons are differentially susceptible to degeneration in Parkinson’s disease. Nature 334: , 345–348. |
[25] | German DC , Manaye K , Smith WK , Woodward DJ , Saper CB ((1989) ) Midbrain dopaminergic cell loss in parkinson’s disease: Computer visualization. Ann Neurol 26: , 507–514. |
[26] | Pakkenberg B , Moller A , Gundersen HJ , Mouritzen Dam A , Pakkenberg H ((1991) ) The absolute number of nerve cells in substantia nigra in normal subjects and in patients with Parkinson’s disease estimated with an unbiased stereological method. Journal of Neurology, Neurosurg Psychiatry 54: , 30–33. |
[27] | Fearnley JM , Lees AJ ((1991) ) Ageing and Parkinson’s disease: Substantia nigra regional selectivity. Brain 114: , 2283–2301. |
[28] | Ma SY , Röyttä M , Rinne JO , Collan Y , Rinne UK ((1997) ) Correlation between neuromorphometry in the substantia nigra and clinical features in Parkinson’s disease using disector counts. J Neurol Sci 151: , 83–87. |
[29] | Damier P , Hirsch EC , Agid Y , Graybiel AM ((1999) ) The substantia nigra of the human bra, II.atterns of loss of dopamine-containing neurons in Parkinson’s disease. Brain 122: , 1437–1448. |
[30] | Dickson DW , Fujishiro H , DelleDonne A , Menke J , Ahmed Z , Klos KJ , Josephs KA , Frigerio R , Burnett M , Parisi JE , Ahlskog JE ((2008) ) Evidence that incidental Lewy body disease is pre-symptomatic Parkinson’s disease. Acta Neuropathol 115: , 437–444. |
[31] | Wilson JM , Levey AI , Rajput A , Ang L , Guttman M , Shannak K , Niznik HB , Hornykiewicz O , Pifl C , Kish SJ ((1996) ) Differential changes in neurochemical markers of striatal dopamine nerve terminals in idiopathic Parkinson’s disease. Neurology 47: , 718–726. |
[32] | Miller GW , Erickson JD , Perez JT , Penland SN , Mash DC , Rye DB , Levey AI ((1999) ) Immunochemical analysis of vesicular monoamine transporter (vmat2) protein in Parkinson’s disease. Exp Neurol 156: , 138–148. |
[33] | Kish SJ , Shannak K , Hornykiewicz O ((1988) ) Uneven pattern of dopamine loss in the striatum of patients with idiopathic Parkinson’s disease. N Engl J Med 318: , 876–880. |
[34] | Iacono D , Geraci-Erck M , Rabin ML , Adler CH , Serrano G , Beach TG , Kurlan R ((2015) ) Parkinson disease and incidental Lewy body disease: Just a question of time? Neurology 85: , 1670–1679. |
[35] | Sulzer D , Bogulavsky J , Larsen KE , Behr G , Karatekin E , Kleinman MH , Turro N , Krantz D , Edwards RH , Greene LA , Zecca L ((2000) ) Neuromelanin biosynthesis is driven by excess cytosolic catecholamines not accumulated by synaptic vesicles. Proc Natl Acad U S A 97: , 11869–11874. |
[36] | Banerjee K , Munshi S , Sen O , Pramanik V , Roy Mukherjee T , Chakrabarti S ((2014) ) Dopamine cytotoxicity involves both oxidative and nonoxidative pathways in SH-SY5Y cells: Potential role of alpha-synuclein overexpression and proteasomal inhibition in the etiopathogenesis of Parkinson’s disease. Parkinsons Dis 2014: , 1–12. |
[37] | Conway KA ((2001) ) Kinetic stabilization of the alpha-synuclein protofibril by a dopamine-alpha-synuclein adduct. Science 294: , 1346–1349. |
[38] | Choi SJ , Panhelainen A , Schmitz Y , Larsen KE , Kanter E , Wu M , Sulzer D , Mosharov EV ((2015) ) Changes in neuronal dopamine homeostasis following 1-methyl-4-phenylpyridinium (MPP +) exposure. J Biol Chem 290: , 6799–6809. |
[39] | Axt KJ , Commins DL , Vosmer G , Seiden LS ((1990) ) a-Methyl-p-tyrosine pretreatment partially prevents methamphetamine-induced endogenous neurotoxin formation. Brain Res 515: , 269–76. |
[40] | Simuni T , Siderowf A , Lasch S , Coffey CS , Caspell-Garcia C , Jennings D , Tanner CM , Trojanowski JQ , Shaw LM , Seibyl J , Schuff N , Singleton A , Kieburtz K , Toga AW , Mollenhauer B , Galasko D , Chahine LM , Weintraub D , Foroud T , Tosun D , Poston K , Arnedo V , Frasier M , Sherer T , Chowdhury S , Marek K , the Parkinson’s Progression Marker Initiative ((2018) ) Longitudinal change of clinical and biological measures in early Parkinson’s disease: Parkinson’s Progression Markers Initiative Cohort: Early PD and MDS-UPDRS and DAT binding change. Mov Disord 33: , 771–782. |
[41] | Brooks DJ ((2010) ) Imaging approaches to Parkinson disease. J Nucl Med 51: , 596–609. |

