
Safety, Tolerability, Pharmacokinetics, and Pharmacodynamics of the Positive Modulator of HGF/MET, Fosgonimeton, in Healthy Volunteers and Subjects with Alzheimer’s Disease: Randomized, Placebo-Controlled, Double-Blind, Phase I Clinical Trial
Abstract
Background:
Fosgonimeton (ATH-1017) is being developed as a first-in-class regenerative therapy for people with Alzheimer’s disease (AD) and dementia; potentially improving dementia symptoms and altering disease progression by reversing synaptic disconnection and neuronal loss.
Objective:
This randomized, double-blind, placebo-controlled phase I trial (NCT03298672) evaluated the safety, tolerability, pharmacokinetics, and pharmacodynamics of fosgonimeton.
Methods:
Fosgonimeton was administered once daily via subcutaneous injection to 88 subjects. The single ascending dose study enrolled healthy young male subjects (n = 48; age, 33.4±6.3 years; dose, 2, 6, 20, 40, 60, or 90 mg); the multiple ascending dose study enrolled healthy elderly subjects (n = 29; age, 63.8±4.0 years; dose, 20, 40, 60, or 80 mg; 9-day duration); and the fixed-dose study enrolled AD subjects (n = 11; age, 69.2±7.1 years; dose, 40 mg; 9-day duration). Quantitative electroencephalogram (qEEG) and event-related potential (ERP) P300 measured neurophysiological signals following fosgonimeton treatment, supporting brain penetration and target engagement.
Results:
Fosgonimeton and placebo were shown to be safe and well-tolerated across all doses. Pharmacokinetic results for fosgonimeton were dose-proportional, with no sex effect or accumulation over 9 days. The main effect of fosgonimeton on qEEG was acute and sustained gamma power induction. In AD subjects, there was a significant effect toward ERP P300 latency normalization compared with placebo (p = 0.027; n = 7 at 40 mg fosgonimeton versus n = 4 placebo).
Conclusion:
These results support the continued development of fosgonimeton as a novel therapeutic for people with AD and dementia. The fast-onset normalization of ERP P300 latency in AD subjects suggests enhancement of synaptic function and potential procognitive effects.
INTRODUCTION
An estimated 50 million people are currently living with dementia worldwide [1]. Alzheimer’s disease (AD) accounts for the majority of these cases (i.e., 60% to 80%) and is associated with increased mortality, high caregiver burden, and substantial economic costs [2–4]. With the prevalence of AD on the rise due to rapid growth of the aging population, the World Health Organization has declared AD and other dementias to be a global public health priority [5, 6].
AD is characterized by a progressive decline in memory and cognition that ultimately affects a person’s ability to perform daily activities and function independently [7]. The pathophysiology of AD is complex and multifactorial, with cumulative data suggesting that protein aggregation, chronic inflammation, vascular impairment, decreased energy metabolism, and immune dysregulation all play a role [8–11]. While amyloid plaques and neurofibrillary tangles have long been established as pathological hallmarks of AD, mounting evidence suggests that both synaptic dysfunction and loss may be the core biological mechanisms underlying the clinical syndrome and directly correlating with dementia symptom onset and decline [12–14]. In line with this view, studies have shown that changes in synaptic density can occur prior to neurodegeneration in AD and these changes represent the best pathological correlate of cognitive decline in patients across different stages [12, 14–17].
Failure to conceptualize AD as a complex disease with systemic failure involving synaptic dysfunction and neurodegeneration has hindered the development of new and effective treatments to date. The currently approved “symptomatic” therapeutics for people with AD (e.g., cholinesterase inhibitors, the N-methyl-D-aspartic acid (NMDA) receptor antagonists, such as memantine) focus on singular neurotransmitter systems; these agents have modest and transient effects on cognitive performance and functional capacity [7, 18, 19]. More recent antibody-based approaches aim to modify the disease course by clearing amyloid-β or tau accumulation in the brain [7, 19]. However, while immunotherapies may clear protein accumulation, substantial clinical benefit has not yet been established [20, 21]. Novel treatments with the ability to address the multifaceted nature of the neurodegenerative processes in AD, and to restore the synaptic connectivity, are thus urgently needed. The lack of predictive biomarkers that are directly correlated with cognitive function further hampers translational AD drug development, relegating drug-discovery programs to the lengthy sequence of phase I, II, and III studies, which has resulted in multiple late-stage failures.
Neurotrophic factors, like the hepatocyte growth factor (HGF), represent a novel therapeutic target to treat AD and dementia by protecting existing neurons, promoting synaptogenesis, addressing neuroinflammation, and inducing regenerative mechanisms [22, 23]. Pharmacological stimulation of neurotrophic systems has the potential to treat all stages of AD by restoration of synaptic connectivity, thus improving cognitive function and addressing multiple aspects of AD pathology, including cerebral perfusion [22, 24–27]. HGF is the exclusive ligand for the MET receptor tyrosine kinase (MET). Central nervous system (CNS) MET expression is crucial in maintaining the healthy adult brain [28], and is reduced in people with AD, particularly in the hippocampus and cortex [29]. Activation of the HGF/MET pathway exhibits potent neurotrophic effects on different types of neurons (e.g., hippocampal, cortical) and glial cells [30]. HGF activation is neuroprotective in models of neurodegenerative disorders, including AD [31], Parkinson’s disease [32, 33], amyotrophic lateral sclerosis [34, 35], and multiple sclerosis [36]. Although early attempts to administer neurotrophic factors, such as nerve growth factor and brain-derived neurotrophic factor, have been unsuccessful primarily due to substantial challenges in delivering large proteins or gene therapy to the CNS, more recent data suggest that small-molecule neurotrophic modulators may be able to overcome these challenges [25, 37].
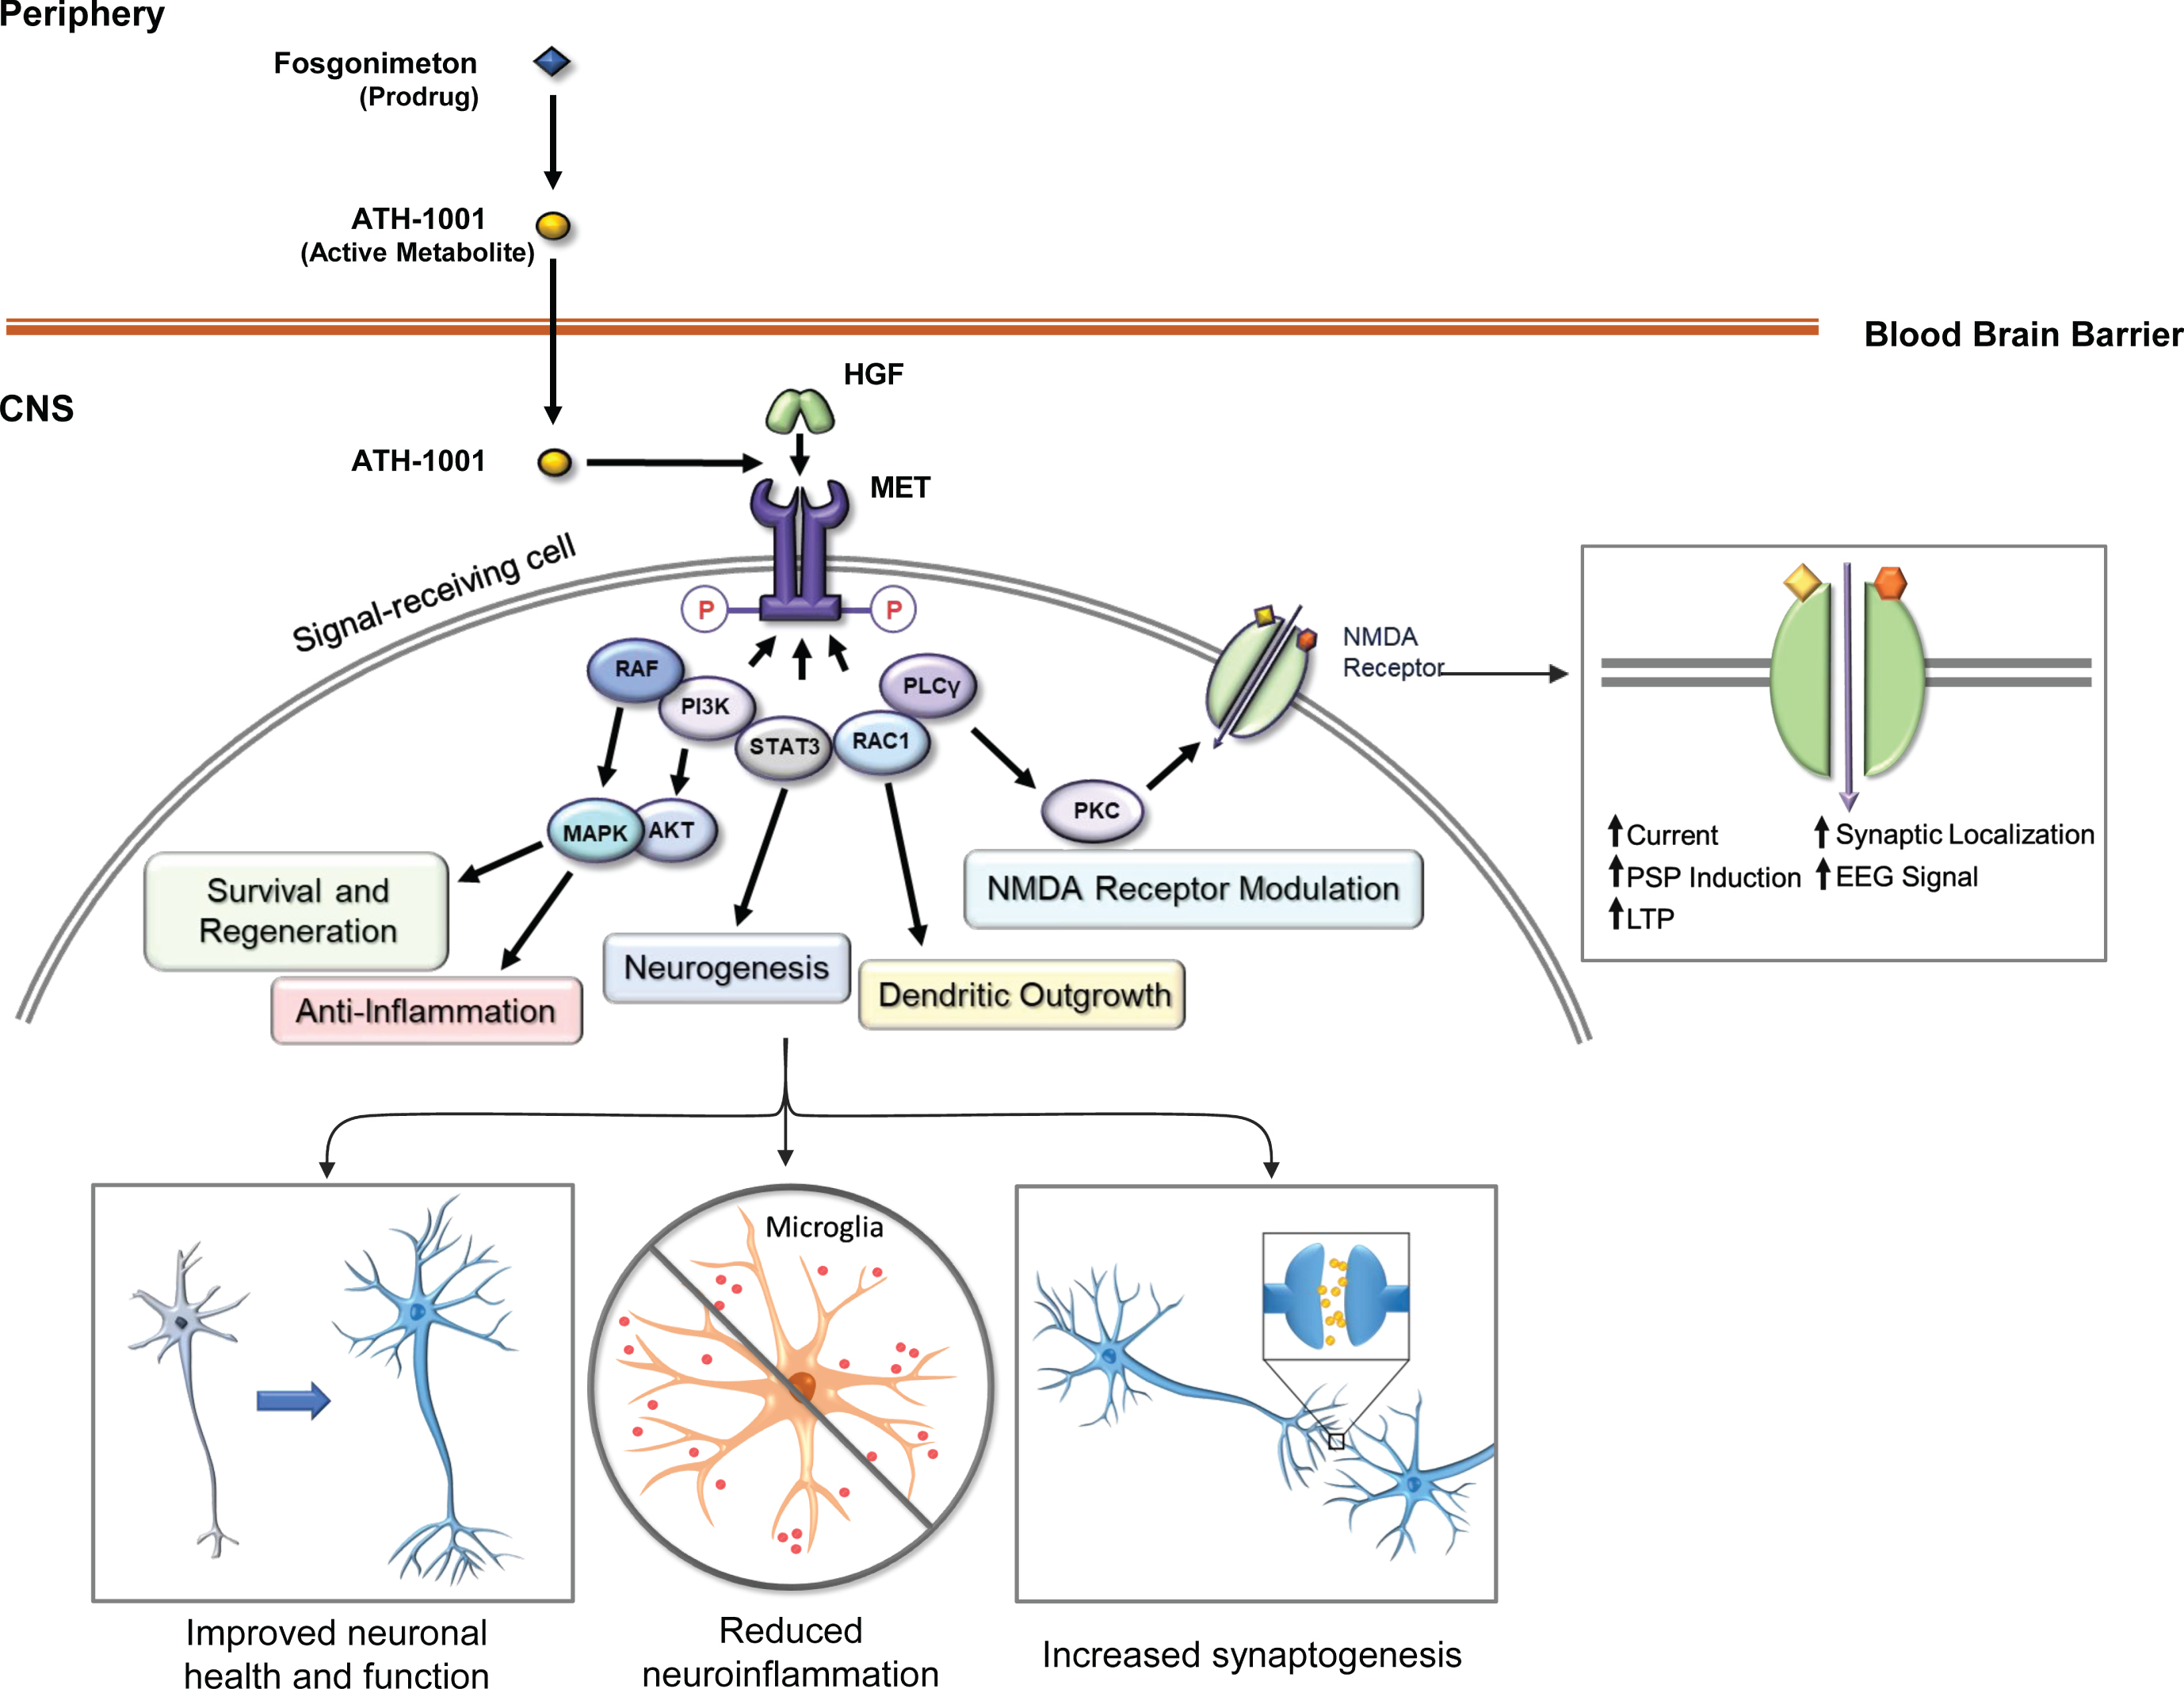
Fosgonimeton (ATH-1017), a highly specific, small-molecule positive modulator of the HGF/MET neurotrophic system, is a prodrug that is optimized for subcutaneous (SC) administration and is rapidly converted into the active metabolite ATH-1001 in plasma (Johnston J, unpublished data). ATH-1001 crosses the blood-brain barrier and enhances the interaction of HGF with its receptor tyrosine kinase MET, inducing downstream signaling through PI3k/Akt and MAPK pathways and augmenting NMDA receptor-mediated long-term potentiation through protein kinase C [38, 39] (Fig. 1). In nonclinical studies, this approach has been shown to activate the neurotrophic HGF/MET system, reverse spatial memory deficits in rat models of dementia, and stimulate changes in quantitative electroencephalogram (qEEG). CNS penetration was also shown in rodent nonclinical studies (Johnston J, unpublished data).
Fig. 1
Fosgonimeton mechanism of action. The prodrug fosgonimeton is converted to the active metabolite ATH-1001. ATH-1001 enters the brain and enhances the HGF/MET neurotrophic system. HGF binding to MET induces phosphorylation of intracellular tyrosines on the MET receptor. MET activation results in changes in gene expression to stimulate various cell behaviors including regenerative and anti-inflammatory processes as well as neurotransmitter modulation. AKT, protein kinase B; EEG, electroencephalogram; HGF, hepatocyte growth factor; LTP, long-term potentiation; MAPK, mitogen-activated protein kinase; MET, MET receptor tyrosine kinase; NMDA, N-methyl D-aspartate; P, phosphorylated; PI3K, phosphoinositide 3-kinase; PKC, protein kinase C; PLCγ, phospholipase C-gamma; PM, plasma membrane; PSP, post-synaptic potential; RAC1, Ras-related C3 botulinum toxin substrate 1; RAF, rapidly accelerated fibrosarcoma (RAF) kinase; STAT3, signal transducer and activator of transcription 3.
HGF signaling through MET is a pulsatile signaling system, as phosphorylation of MET decays over time in the presence of its HGF ligand, and regulation of MET activation after signaling is a well-studied process [40]. Activation of the HGF/MET system initiates intracellular signaling cascades that lead to downstream transcriptional and translational impacts, promoting survival and regenerative mechanisms [31]. These impacts on gene expression likely outlast the duration of the drug-target interaction and may lead to persistent effects. This pulsatile method of fosgonimeton (prodrug) administration, once daily (OD), is aligned with the natural regulatory mechanisms of HGF/MET activity, and suggests a steady state plasma level of ATH-1001 (active metabolite) may not be required for a lasting therapeutic effect.
This phase I trial included qEEG as a translatable biomarker to confirm CNS penetration and target engagement in humans. Event-related potential (ERP) P300 latency was included in the protocol to enhance confidence of a potential procognitive effect within this dose range in AD subjects. The phase I trial data support dose selection for phase II/III studies.
MATERIALS AND METHODS
Study design
The phase I clinical trial (NCT03298672) was designed as a series of randomized, placebo-controlled, double-blind studies to evaluate the safety, pharmacokinetics (PK), and pharmacodynamics of fosgonimeton. The first part (part A) consisted of a single ascending dose study in healthy young male subjects; the second part (part B) consisted of a multiple ascending dose study in healthy elderly subjects, and a fixed-dose study in AD subjects.
Data were collected between October 9, 2017 and September 5, 2019 across two sites in the United States and France. Part A and Part B healthy volunteer cohorts were completed at a single site, Phase 1 unit at Biotrial Inc., Newark, NJ, USA; Part B – AD subjects only, were performed at two separate Phase 1 units with centralized randomization (Biotrial Inc., Newark, NJ, USA; Biotrial, Rennes, France). The EEG equipment and training were centrally provided by Biotrial Core Lab (Rennes, France). Both sites were equipped and accredited to perform the qEEG and ERP P300 data collection, and the data were transmitted to the Biotrial Core Lab for centralized quality check and analysis.
The protocol was approved by the institutional review board or independent ethics committee at each site, and the study was conducted in accordance with the Declaration of Helsinki and International Conference on Harmonization Good Clinical Practice Guideline. All subjects, or their legally appointed representative, gave written informed consent prior to study initiation. At screening, safety EEGs were performed to exclude subjects with brain anomalies that may interfere with the qEEG and ERP data interpretation.
Fosgonimeton, formulated at a concentration of 10 mg/mL, and placebo drug products were both clear and colorless sterile solutions. Single or multiple syringes, each containing volumes up to 3 mL, were prepared by unblinded pharmacists. Total daily injection volumes ranged from 0.2 mL to 9 mL of solution to achieve doses of 2 mg to 90 mg.
Single Ascending Dose Study: Healthy young subjects (Part A) – Doses: 2, 6, 20, 40, 60, 90 mg (or Placebo), SC
Male subjects aged 18–45 years were eligible to participate in part A. All subjects were nonsmokers with body mass index (BMI) between 18.0 and 30.0 kg/m2. Dose escalation was conducted in 6 sequential cohorts of 8 subjects each, for a total of 48 subjects. Within each cohort, 6 subjects were randomly assigned to receive a single dose of fosgonimeton, and 2 subjects were randomly assigned to receive a single dose of matching placebo. An adaptive design with sentinel dosing was used, and the final dose levels administered ranged from 2 mg to 90 mg. The adaptive design refers the flexibility to adjust dose and add/reduce dose cohorts based on human PK and safety data, to enable dose exploration in this Phase I study. Dose escalation was guided by emerging human PK and safety data with reference to preclinical data. Subjects remained in the clinical unit from the time of admission (day -1) to discharge (day 3), with safety, PK, pharmacodynamics (qEEG), and clinical assessments performed throughout their inpatient stay. A final outpatient follow-up was performed on day 10 (+2 days).
Multiple Ascending Dose Study: Healthy elderly subjects (Part B) – Doses: 20, 40, 60, or 80 mg (or Placebo), SC, OD, 9 consecutive days
Healthy elderly subjects (men or women) aged 60–85 years, with BMIs of 18.0–30.0 kg/m2, and no reported changes in cognition in the past year, were eligible to participate in part B.
Part B evaluated dose levels lower than or equal to those previously examined in part A. Prior to dosing on day 1, subjects were randomly assigned, to receive fosgonimeton or matching placebo at dose levels that ranged from 20 mg to 60 mg (6 active versus 2 placebo) and at 80 mg (4 active versus 1 placebo), SC, OD over 9 consecutive days. Subjects remained in the clinical unit from the time of admission (day -1) to discharge (day 10), with safety, PK, pharmacodynamics (qEEG and ERP P300), and clinical assessments performed throughout their inpatient stay. A final outpatient follow-up was performed on day 17 (+2 days).
Multiple Fixed-Dose Study: AD subjects (Part B) – Dose: 40 mg (or Placebo), SC, OD, 9 consecutive days
The primary focus of this study was safety, PK, and pharmacodynamics (qEEG and ERP P300); therefore, the inclusion of the AD subjects was based on a previously established and documented diagnosis, including amnestic mild cognitive impairment, AD, or mixed dementia (as per the protocol inclusion criteria; hereafter referred to as AD subjects). AD subjects were either treatment-naïve, or willing and able to discontinue symptomatic treatment for AD prior to randomization. All AD subjects received a fixed fosgonimeton dose of 40 mg (n = 7) or placebo (n = 4). Subjects remained in the clinical unit from the time of admission (day -1) to discharge (day 10), with safety, PK, pharmacodynamics (qEEG and ERP P300), and clinical assessments performed throughout the inpatient stay. A final outpatient follow-up was performed on day 17 (±2 days).
In both the healthy elderly and AD subject populations, use of acetylcholinesterase inhibitors, memantine, aripiprazole, brexpiprazole, selective serotonin reuptake inhibitors, or quetiapine were prohibited. Xanthine-containing products (coffee, tea, chocolate) were prohibited from admission until the end of the study. Subjects experiencing dose-limiting toxicities and/or adverse events (AEs) of severe intensity and related causality could be discontinued from the study prior to receipt of all 9 doses.
The screening window for healthy young and elderly subjects was 28 days, and the window for AD subjects was extended to 90 days if washout of prohibited medications was necessary. All subjects were required to be nonsmokers; smoking and use of other nicotine-containing products were prohibited throughout the studies. Women of childbearing potential were excluded.
Safety assessments
Safety assessments were conducted throughout the trial and included 12-lead electrocardiogram (ECG), 10–20 standard montage qEEG, clinical laboratory tests (hematology, blood chemistry including aspartate aminotransferase, alanine aminotransferase, alkaline phosphatase, albumin, direct and indirect total bilirubin), urinalysis, vital sign measurements, concomitant medication assessments, Columbia-Suicide Severity Rating Scale (C-SSRS), and physical and neurological examinations. qEEG was a dual-purpose endpoint for safety and pharmacodynamic evaluation. A neurologist evaluated the qEEG data throughout the trial for assessing safety.
AEs were recorded after dosing until the end of the subject’s participation in the study (i.e., the subject had discontinued or completed the study); any AEs identified after signing the informed consent and before dosing were recorded as prior medical history. AEs were assessed by the investigator with regard to intensity (mild, moderate, severe) and causality (related, probably related, possibly related, unlikely to be related, unrelated) and were coded according to MedDRA version 20.1.
To rule out a potential detrimental effect on cognition, the trail making test (TMT) A&B was included as an exploratory cognitive endpoint assessed after a single dose (day 1 at approximately 2 h postdose) and after multiple doses (day 4 at approximately 2 h postdose) compared to individual baseline. The Mini-Mental State Exam (MMSE) was included as a safety endpoint for AD subjects, measured at baseline and on day 4 approximately 2 h postdose.
PK assessments
For the single-dose study (part A), blood samples were collected at predose and 0.083, 0.167, 0.25, 0.5, 1, 1.5, 2, 3, 4, 6, 8, 12, 24, and 48 h postdose. For the multiple-dose study (part B), blood samples were collected predose on days 1–9 and 0.083, 0.167, 0.25, 0.5, 1, 1.5, 2, 3, 4, 6, 8, and 12 h postdose on day 1 and day 9. A 24 h postdose sample was also collected on day 10.
Blood samples were analyzed for plasma concentrations of the prodrug fosgonimeton and the active metabolite ATH-1001. PK parameters were calculated using plasma concentrations of fosgonimeton and ATH-1001 by noncompartmental methods.
The assessed plasma PK parameters included but were not limited to: maximum observed concentration (Cmax); time to maximum observed concentration (Tmax); area under the plasma concentration-time curve (AUC)0 - t, AUC0 - 24, and AUC0 - inf; apparent terminal elimination rate constant (λz); apparent terminal elimination half-life (t1/2); and accumulation ratio at steady state (Rss). Time to reach steady state for fosgonimeton and ATH-1001 was assessed for each dose group by one-way analysis of variance with Helmert contrasts using log-transformed predose and 24 h postdose plasma concentrations.
Pharmacodynamic assessments: qEEG and ERP P300 functional biomarkers
The novel mechanism of fosgonimeton that targets the multifaceted HGF/MET regenerative system including NMDA receptors enabled a prospective biomarker strategy leveraging the functional measures qEEG and ERP P300 to support CNS penetration and target engagement at exposures predicted by preclinical research, thus bridging the gap between early- and late-stage clinical development.
Exploratory pharmacodynamic assessments examined the effects of fosgonimeton administration on qEEG power spectra (parts A and B) and ERP P300 latency (part B only). qEEG data were acquired on day 1 of the single-dose study (predose, 1 h postdose). qEEG and ERP P300 data were acquired on days 1, 4, and 8 of the multiple-dose study (predose, 1 h postdose, and 3 h postdose).
The training and accreditation of the acquisition system, central data quality review, and supplies for qEEG and ERP P300 assessments were provided by Biotrial Core Lab (Rennes, France). A cap with embedded electrodes (10–20 system) was fitted on the subjects and used to record the electrical signals outside the scalp. Electrodes’ impedance was checked before each recording session. The qEEG and ERP P300 data were obtained from 20 electrodes at the pre-frontal (Fp), frontal (F), central (C), temporal (T), parietal (P), and occipital (O) areas (Fp1, Fp2, F7, F3, Fz, F4, F8, T3, T4, T5, T6, C3, Cz, C4, P3, Pz, P4, O1, Oz, O2), and 2 reference electrodes at left and right mastoids.
qEEG power spectra
At each time point, qEEG was recorded in the resting condition for a total of 10 min, with 5 min eyes-closed followed by 5 min eyes-open. Data were bandpass-filtered between 0.1 and 100 Hz and sampled at 400 Hz. After preprocessing and data quality verification, artifact-free epochs were selected for the spectral analysis. Frequency spectra were calculated using the fast Fourier transform algorithm. qEEG parameters were calculated for the following spectra: delta (1.5–6 Hz), theta (6–8.5 Hz), alpha (8.5–12.5 Hz), beta (12.5–30 Hz), and gamma (30–58 Hz). The gamma band was also separated into gamma 1 (30–40 Hz) and gamma 2 (41–58 Hz) sub-bands.
ERP P300 latency
Auditory ERP studies were performed using the auditory oddball paradigm, with standard tones of 500 Hz and oddball/target tones of 2000 Hz, each with 100 ms in duration. The sound level was 85 dB, presented through Sennheiser HD25 headphones. The inter-stimulus interval was randomized between 1200 and 1900 ms. Oddball made up 15% of presentations. The test lasts approximately 7 min with eyes closed. ERP P300 latency (ms) and amplitude (μV) were estimated by extracting the time point corresponding to the largest positive peak within the time interval of 260 ms and 480 ms. Given the auditory nature of the task, all subjects participating in the P300 assessment completed a brief hearing test during the screening visit to ensure their ability to detect and differentiate the two different tones without hearing aids.
Statistical analyses
Demographic, safety, and PK data were summarized using descriptive statistics. Safety was analyzed in all subjects who received at least 1 treatment dose, with all subjects allocated to placebo pooled into a single comparator group. PK was analyzed in all subjects who received at least 1 dose of fosgonimeton and did not have a major protocol deviation thought to interfere with the absorption, distribution, metabolism, and/or excretion of fosgonimeton. Subjects receiving placebo were not included in the summary and analysis of PK parameters. Analyses were performed using Phoenix WinNonlin version 7.0 (Certara, Princeton, NJ, USA; PK data only) and SAS software version 9.4 (SAS Institute Inc., Cary, NC, USA; demographic, PK, and safety data). Pharmacodynamic data were analyzed in all subjects who received at least 1 dose of fosgonimeton or placebo and had at least 1 baseline and 1 postbaseline assessment of qEEG or ERP P300.
In the single-dose study (part A), the effect of each fosgonimeton treatment dose versus placebo was estimated for each electrode and each qEEG parameter using analysis of covariance (ANCOVA) on log-transformed data, with treatment as a fixed effect, and parameter value at baseline as a covariate.
In the multiple-dose study (part B), the effect of each fosgonimeton treatment dose versus placebo was estimated using a mixed model for repeated measures on log-transformed data for qEEG and on percent changes from baseline for ERP P300, with treatment, time point (measurement days and hour-H [i.e., day 1 H0 predose, H1, and H3 postdose; day 4 H0 predose, H1, and H3 postdose; and day 8 H0 predose, H1, and H3 postdose]), treatment by time point interaction as fixed effects, parameter value at baseline as a covariate (qEEG analysis only), and subject as a random effect. A compound symmetry covariance structure was assumed, and time was a categorical term in the model. In case of evident violation of the normality assumptions for ERP parameters, analyses of differences between each dose and placebo were performed using nonparametric tests (Kruskall Wallis test) on changes from baseline values.
Brain maps were generated representing the result of these comparisons on all 20 electrodes and were coded according to whether they achieved statistical significance (at a 5% level), with red colors showing an increase for the active doses compared to placebo and blue colors showing a decrease. There was no adjustment for multiple comparisons since p-values were used descriptively. Analyses were performed on each electrode and each set of electrodes grouped anatomically.
RESULTS
Subjects and demographics
A total of 88 subjects were enrolled in the phase I clinical trial of fosgonimeton, including 48 healthy young male subjects (mean age = 33.4±6.3), 29 healthy elderly subjects (mean age = 63.8±4.0; 14 male, 15 female), and 11 AD subjects (mean age = 69.2±7.1; 5 male, 6 female, median [range] MMSE = 20 [5–29]) (Fig. 2). Baseline characteristics for all study participants are summarized in Table 1.
Fig. 2
Study design. The phase I trial enrolled a total of 88 subjects, including the single ascending dose study (part A, 20–90 mg fosgonimeton versus placebo) and the multiple ascending dose study (part B, 20–80 mg fosgonimeton versus placebo) including a fixed-dose study in Alzheimer’s disease (AD) subjects.
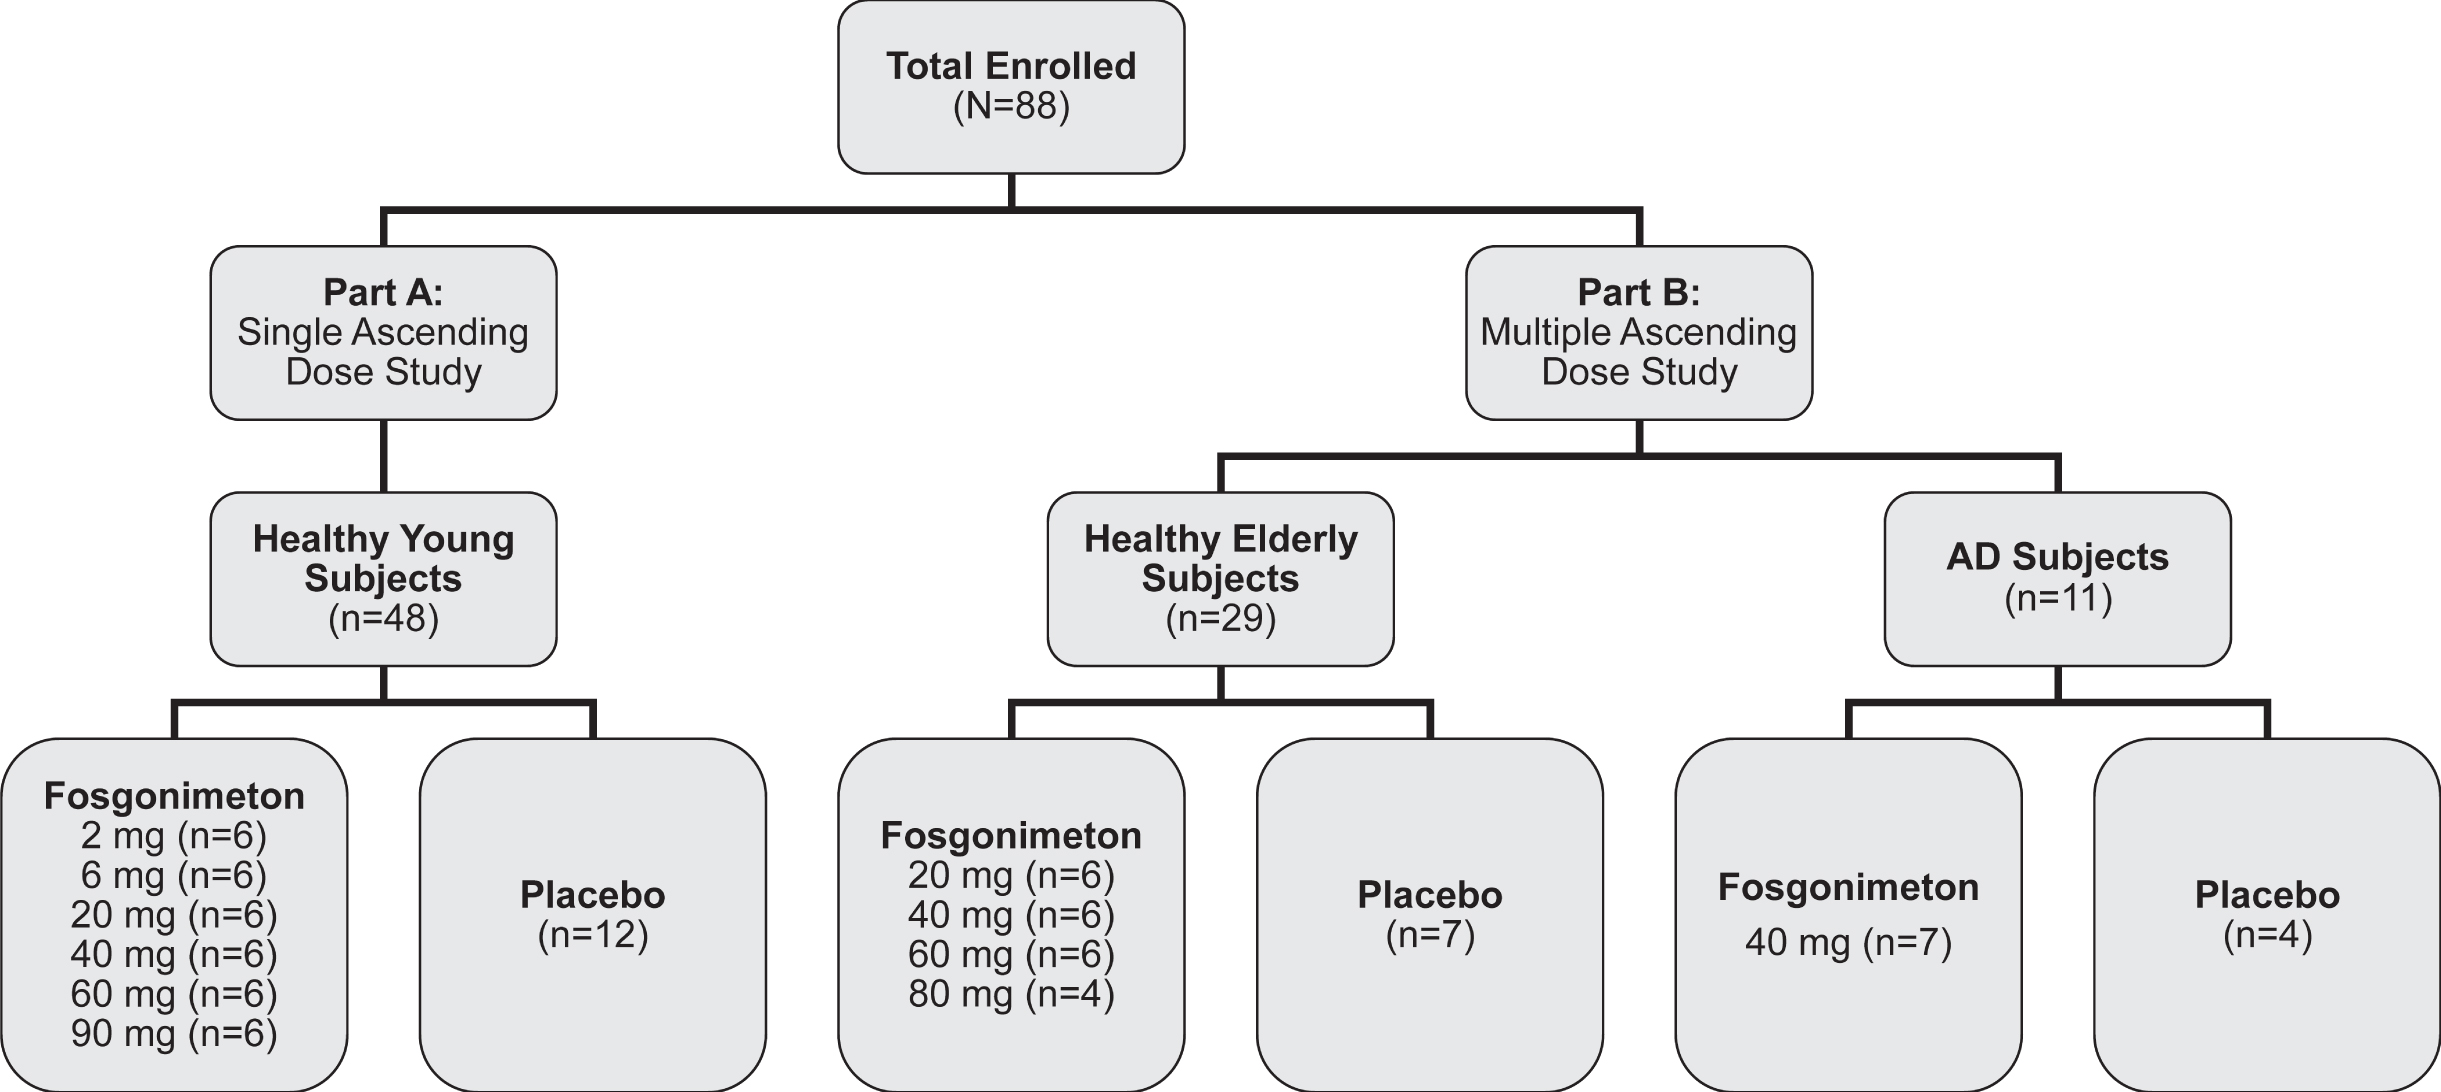
Table 1
Baseline characteristics
| Characteristics | Healthy young adult subjects n = 48 | Healthy elderly subjects n = 29 | AD subjects n = 11 |
| Age (y), mean (SD) | 33.4 (6.3) | 63.8 (4.0) | 69.2 (7.1) |
| Sex, n (%) | |||
| Male | 100 (0) | 14 (48.3) | 5 (45.5) |
| Female | 0 (0) | 15 (51.7) | 6 (54.5) |
| Race, n (%) | |||
| American Indian or Alaska Native | 2 (4.2) | 0 (0) | 0 (0) |
| Asian | 0 (0) | 1 (3.4) | 0 (0) |
| Black or African American | 37 (77.1) | 13 (44.8) | 0 (0) |
| White | 9 (18.8) | 15 (51.7) | 11 (100) |
| Ethnicity, n (%) | |||
| Hispanic or Latino | 11 (22.9) | 4 (13.8) | 1 (9.1) |
| Not Hispanic or Latino | 37 (77.1) | 25 (86.2) | 10 (90.9) |
| BMI (kg/m2), mean (SD) | 26.1 (2.7) | 27.0 (2.2) | 25.9 (3.9) |
| Education (y), mean (SD) | 13.5 (2.0) | 14.2 (3.7) | 12.7 (5.2) |
| MMSE, median (range) | NA | NA | 20 (5–29) |
AD, Alzheimer’s disease; BMI, body mass index; MMSE, Mini-Mental State Exam; NA, not applicable; SD, standard deviation.
Safety assessments
Fosgonimeton was shown to be safe and well-tolerated across all doses tested. There were no serious AEs, or clinically relevant findings reported in blood chemistry, urinalysis, vital signs, ECG, EEG, physical, or neurological examinations. A maximum tolerated dose was not achieved.
Treatment-emergent AEs (TEAEs) classified as related to treatment included injection site pain and injection site pruritus. Most TEAEs were mild in nature and resolved by the end of the study without sequelae. Two TEAEs (1 moderate neutropenia in the healthy elderly subject 40 mg fosgonimeton dose group; 1 moderate hypersensitivity (verbatim term: allergic skin reaction) in the healthy elderly subject 80 mg fosgonimeton dose group) led to treatment discontinuation and study withdrawal; the events were classified as unlikely to be related to treatment and probably related to treatment, respectively. The overall incidence of TEAEs was similar across the placebo- and fosgonimeton-treated groups and did not appear to increase proportionally with dose level (see Supplementary Tables 1 and 2 for details). In AD subjects, no “related” TEAEs were reported; injection site erythema and injection site hematoma were reported in both placebo and active treatment groups (see Supplementary Table 3 for details).
No detrimental effect on cognition was observed based on the TMT A&B test in healthy young subjects after a single dose (2 mg to 90 mg) nor was one observed in healthy elderly subjects after multiple doses (20 mg to 80 mg). There were no clinically relevant changes or trends noted for the TMT A&B test, total MMSE or sub-domain scores in AD subjects with multiple doses (40 mg).
PK assessments
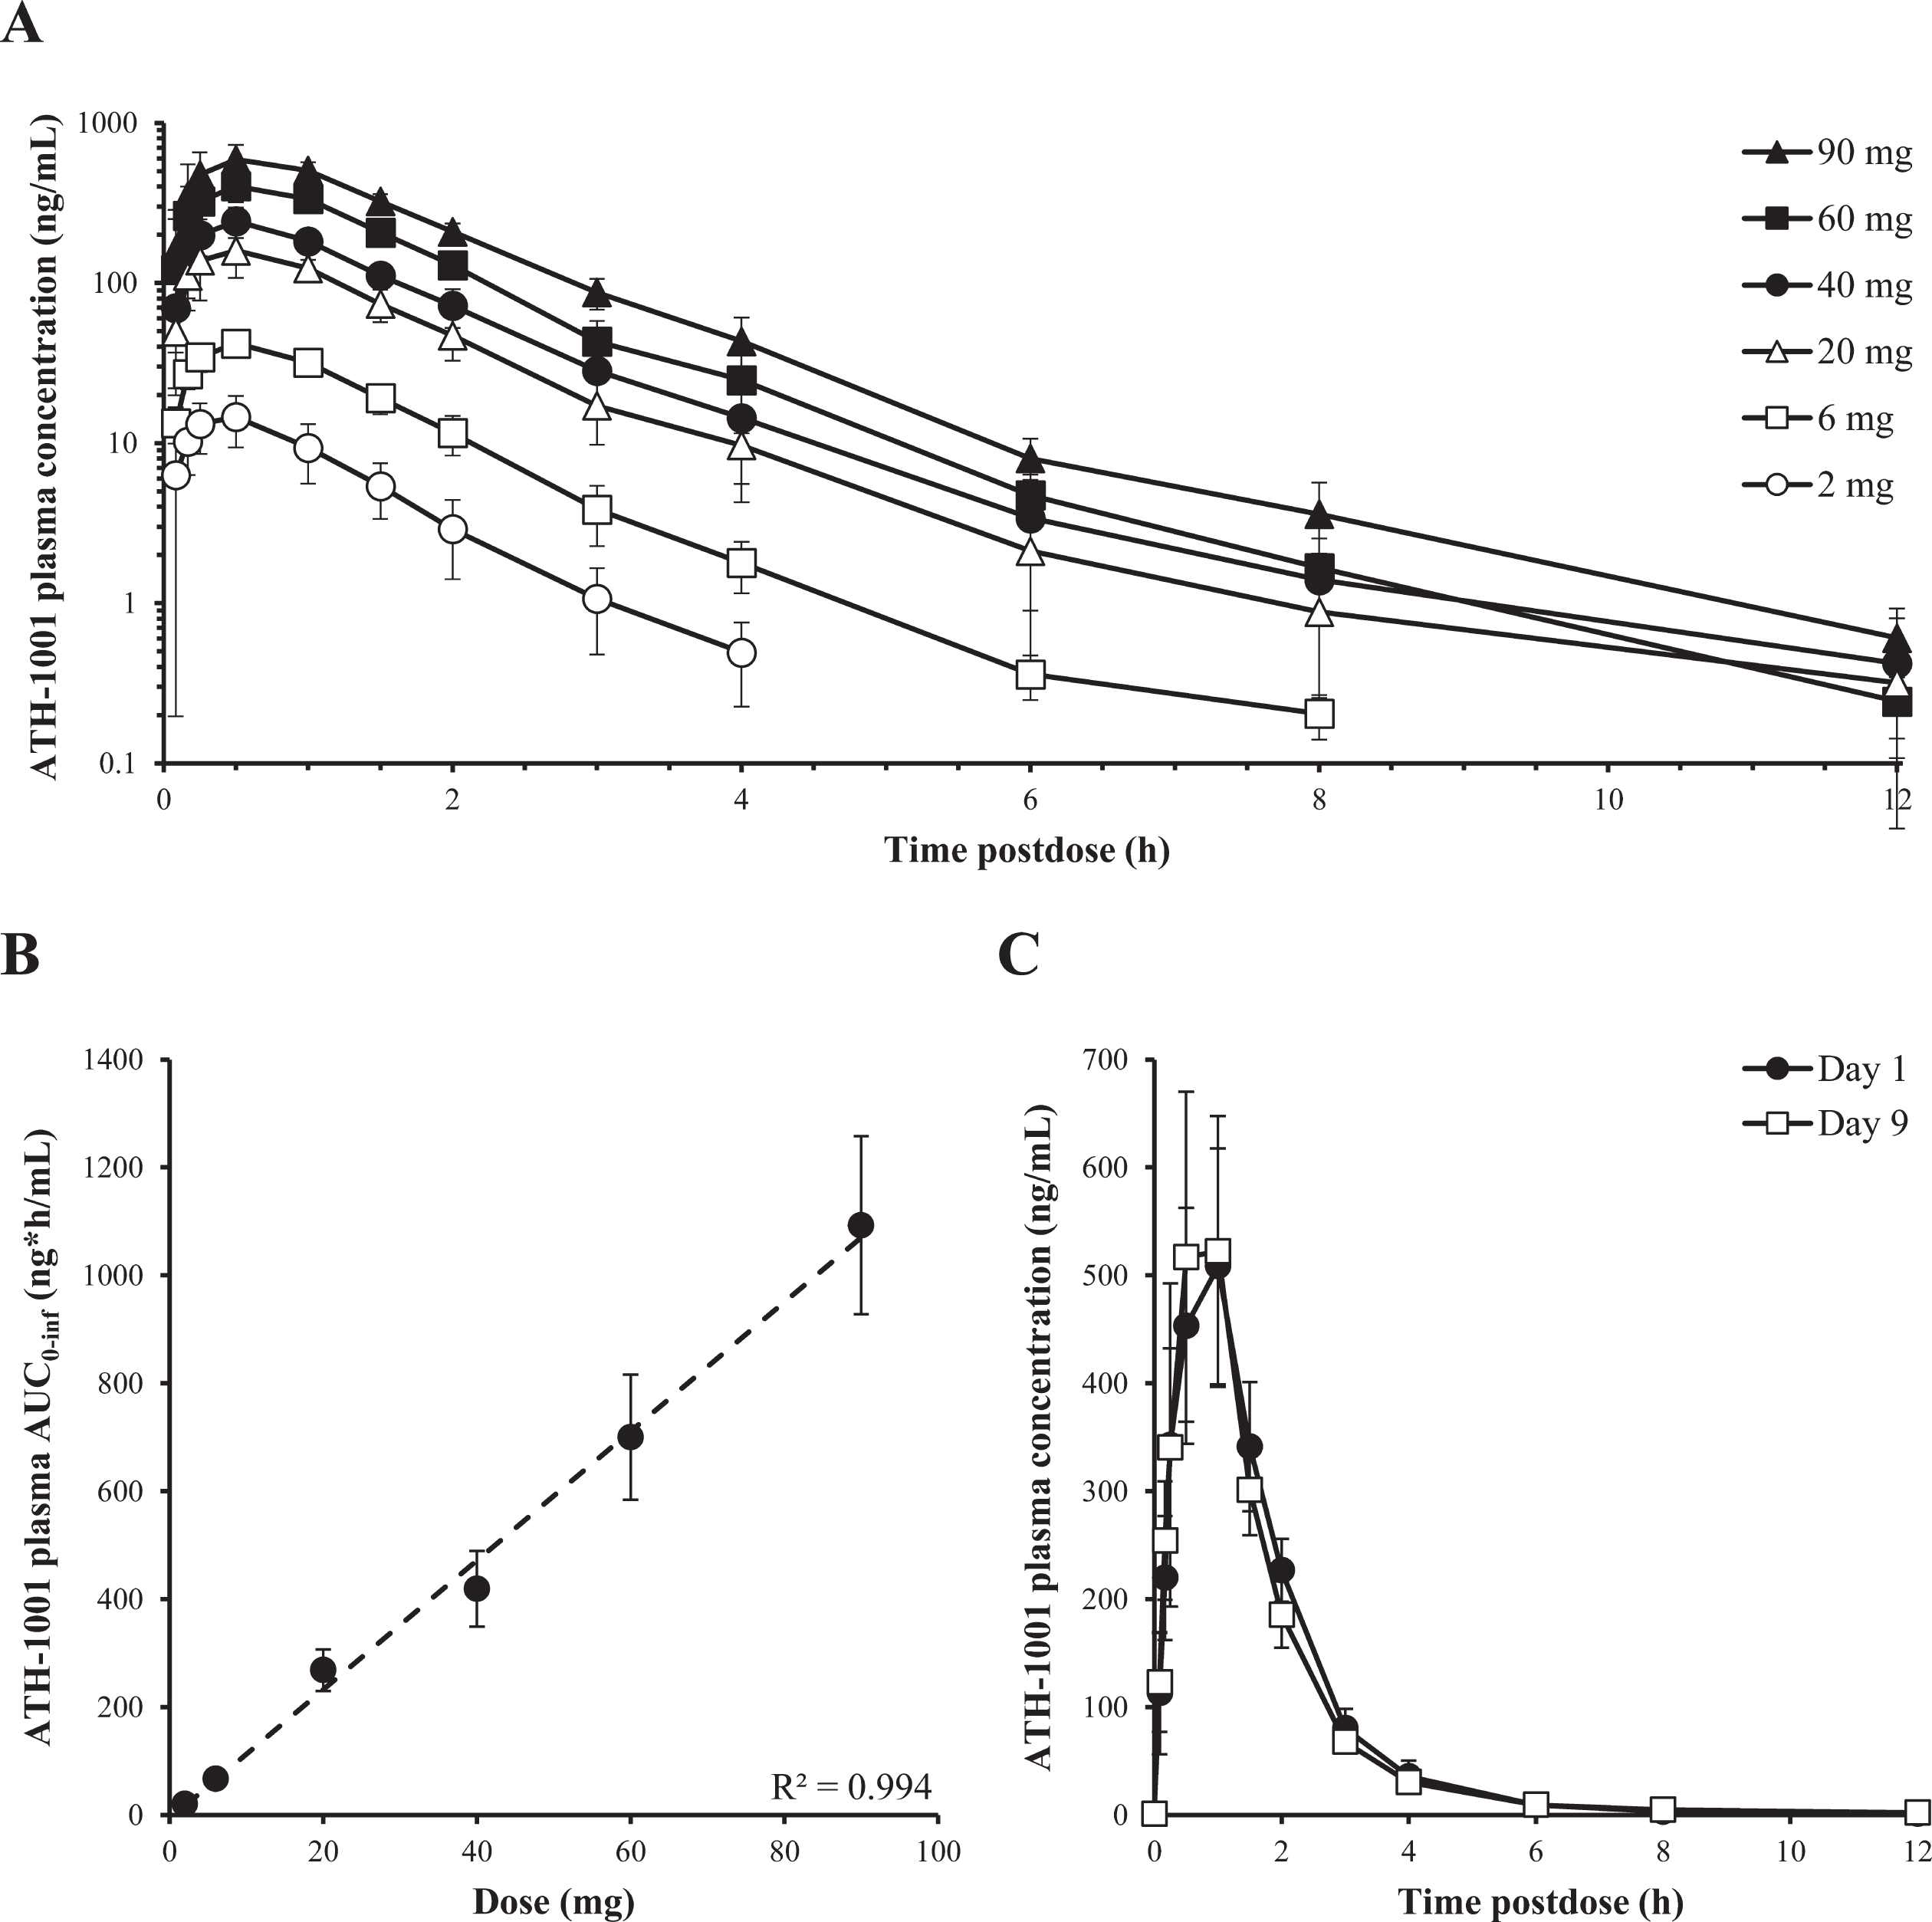
Fosgonimeton was rapidly absorbed (Tmax ∼0.25 h) after SC injection and converted in plasma to the active metabolite ATH-1001 (Tmax ∼0.5 h). Both the prodrug fosgonimeton and active metabolite ATH-1001 were rapidly eliminated in plasma with t1/2 of approximately 0.3 and 1.5 h, respectively. A terminal elimination phase for ATH-1001 with a t1/2 of 5 h was occasionally observed at doses≥40 mg when plasma concentrations of ATH-1001 dropped to ∼1% of that for Cmax.
After administration of single SC doses of 2 mg to 90 mg fosgonimeton and multiple once-daily SC doses of 20 mg to 80 mg fosgonimeton, plasma Cmax and AUC of fosgonimeton and ATH-1001 generally increased in a dose linear manner. After multiple once-daily SC doses, the peak plasma concentration and exposure of the active metabolite ATH-1001 were between 3-fold and 12-fold higher than those of the prodrug fosgonimeton, depending on the day and the dose group. Inter-subject variability in Cmax and AUC exposure was generally moderate for fosgonimeton and low for ATH-1001, with % CV ranging from 24% to 117% for fosgonimeton and 15% to 41% for ATH-1001. Fosgonimeton and ATH-1001 were eliminated from plasma within 24 h; no apparent accumulation was observed. There was no obvious effect of age or sex on fosgonimeton and ATH-1001 PK parameters. The PK profile of the active metabolite ATH-1001 is illustrated in Fig. 3. The PK profile of fosgonimeton is illustrated in Supplementary Figure 1. Please see PK parameter data tables for ATH-1001 and fosgonimeton after a single and multiple-dose SC injection of fosgonimeton in Supplementary Tables 4 and 5, respectively.
Fig. 3
Pharmacokinetic profile of the active metabolite ATH-1001 after single and multiple once-daily SC doses of fosgonimeton. A) Plasma concentration of ATH-1001 in healthy young volunteers after single SC dose of 2 to 90 mg fosgonimeton (arithmetic mean±SD). B) Plasma AUC0 - inf of ATH-1001 in healthy young volunteers after a single SC dose of fosgonimeton demonstrated dose linearity (R2 = 0.994, arithmetic mean±SD). C) Plasma concentrations of ATH-1001 in healthy elderly volunteers on Day 1 (black circle) and Day 9 (open square) after once-daily SC injections of 60 mg fosgonimeton showed no appreciable accumulation and similar exposures between Day 1 and Day 9 (arithmetic mean±SD). AUC0 - inf, area under the plasma concentration-time curve from time zero to infinity; SC, subcutaneous; SD, standard deviation.
Pharmacodynamic assessments
qEEG power spectra
qEEG was analyzed in healthy young and elderly subjects to assess effects of fosgonimeton and support dose ranging.
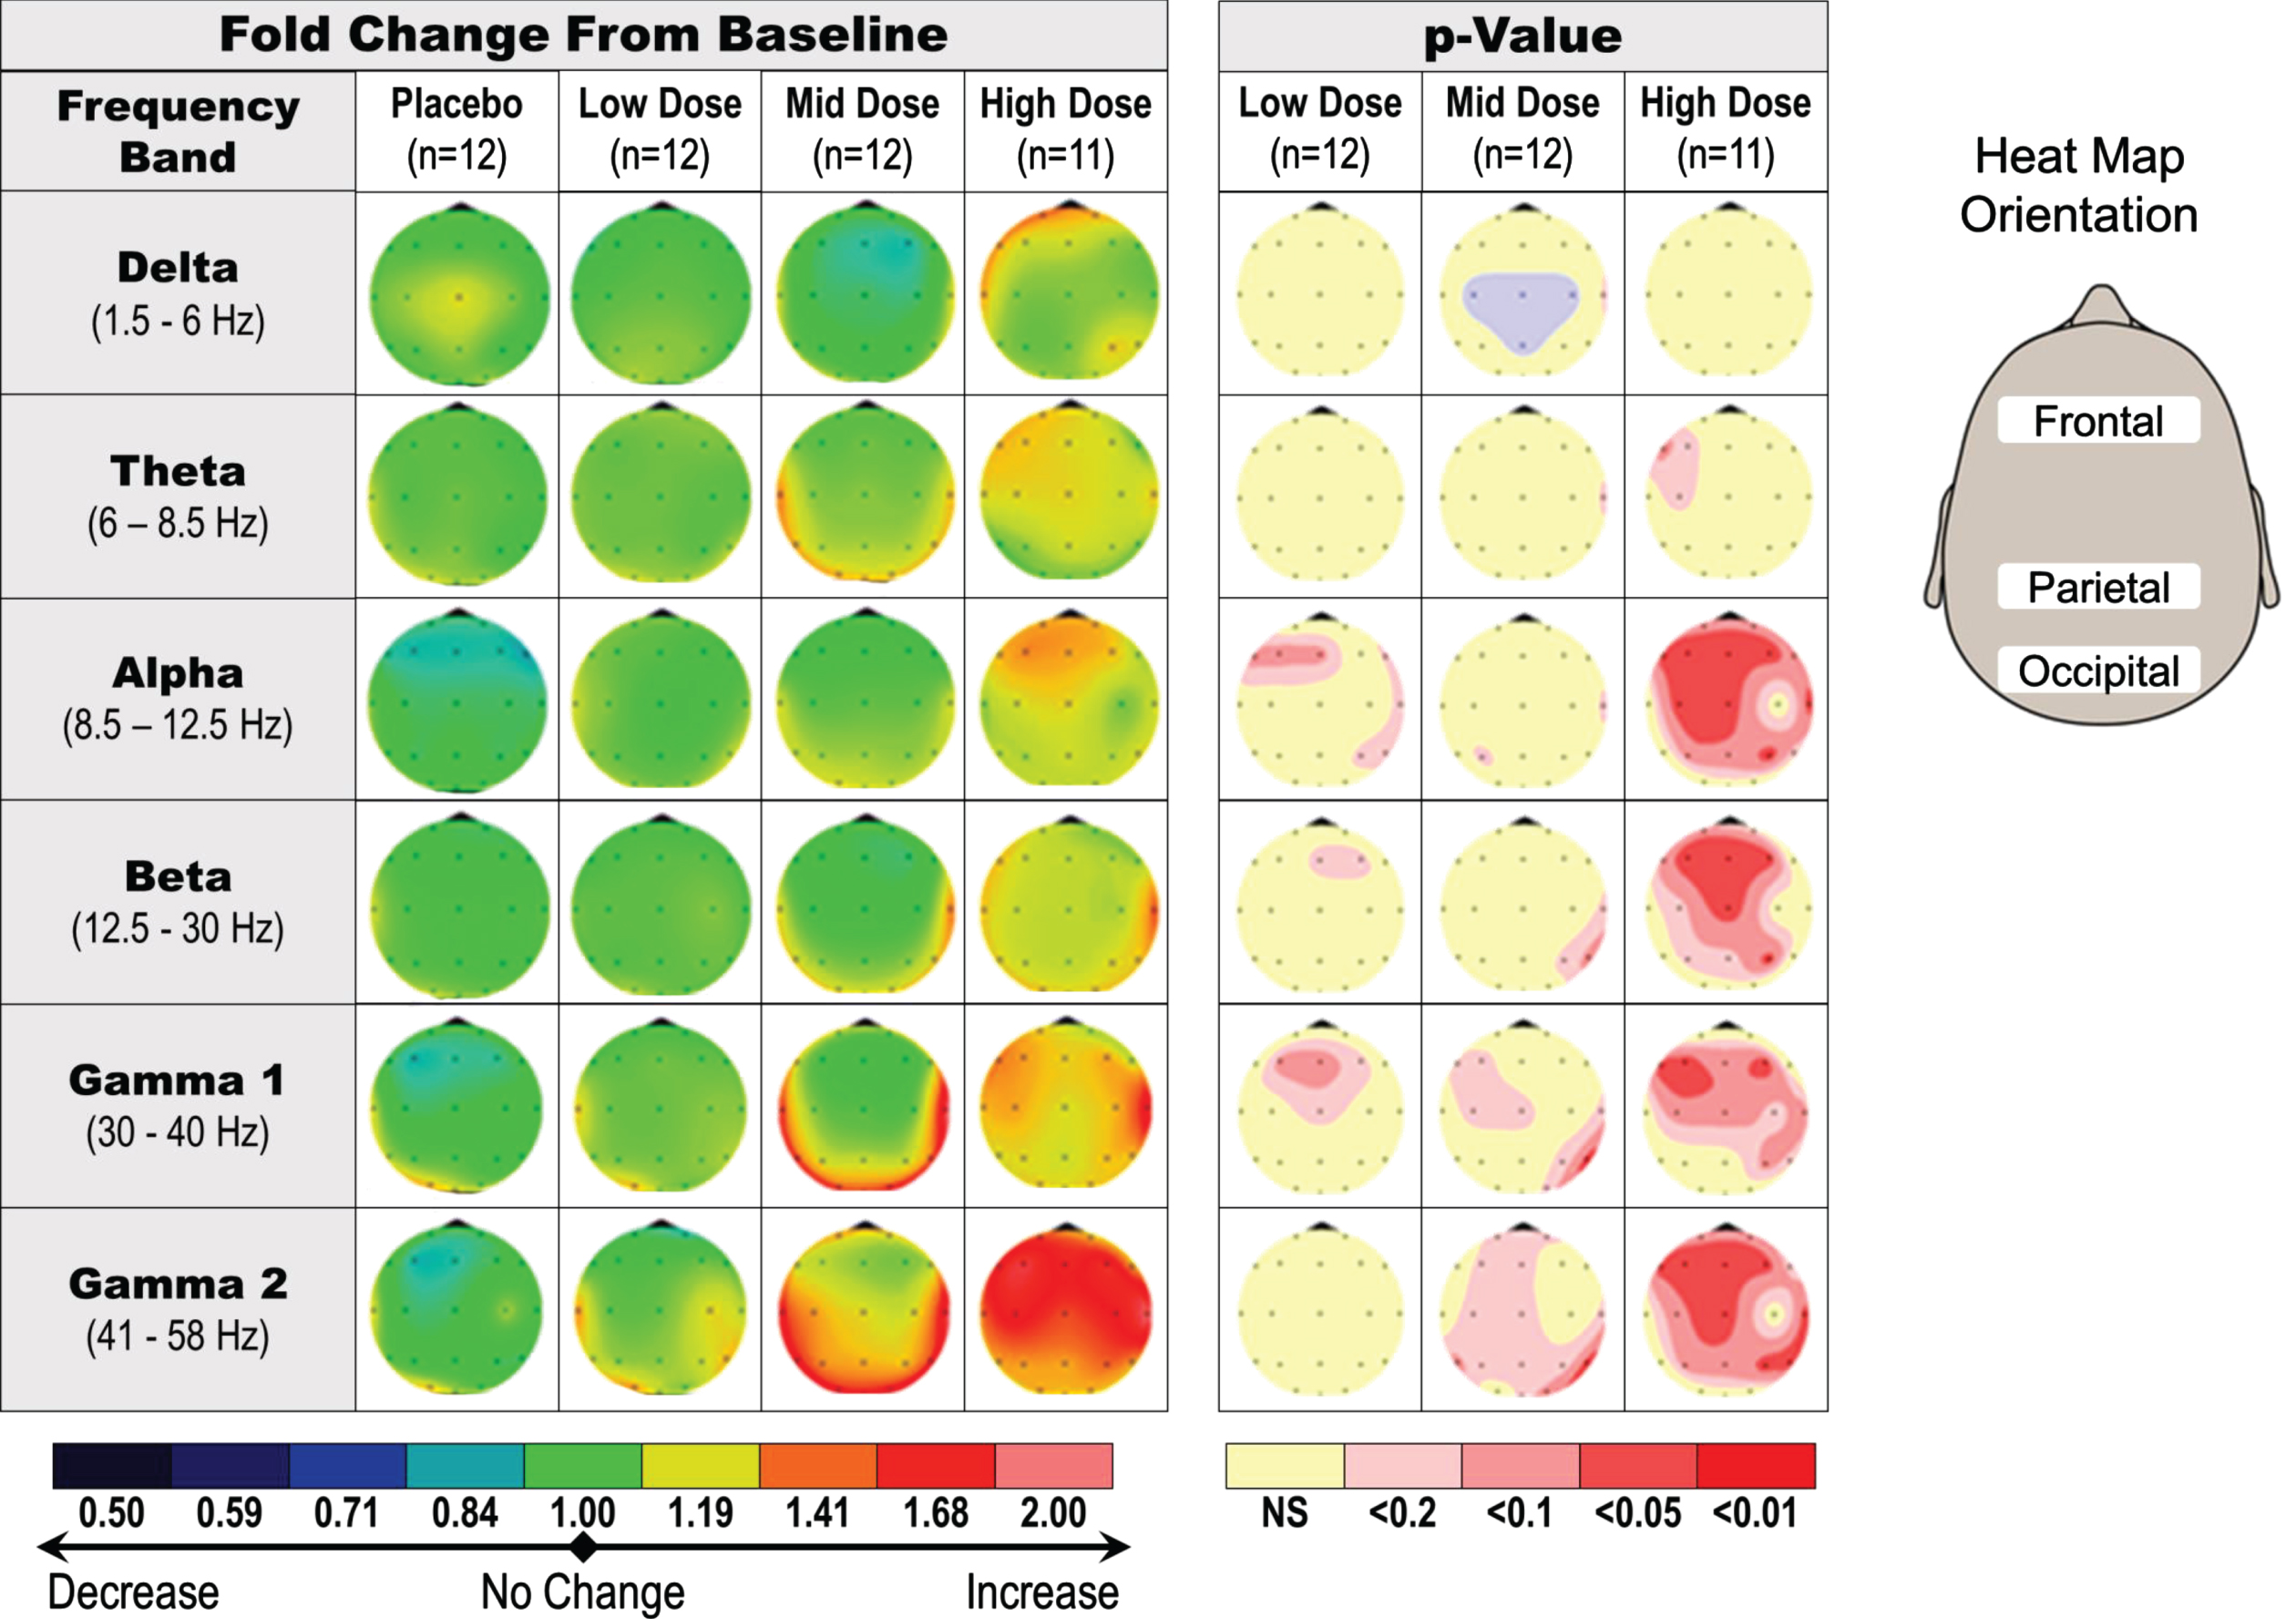
In the single dose studies of healthy young subjects, qEEG was assessed at predose and 1 h postdose. The main qEEG effect was an increase in gamma power, suggestive of a dose response (20 mg to 90 mg), observed in absolute and relative power in eyes closed, resting condition (Fig. 4). The change in gamma power with the 90 mg single dose was statistically significant in the frontal area of the brain when compared with placebo (p < 0.05; not corrected for multiple comparisons).
Fig. 4
Dose-dependent increase in qEEG gamma induction in healthy young subjects receiving a single dose of fosgonimeton. SAD qEEG results illustrate the average change in absolute qEEG power from predose (baseline) to postdose, or the baseline ratio, for pooled placebo group, low doses (2 and 6 mg), middle doses (20 and 40 mg), and high doses (60 and 90 mg). Heat maps illustrate the average change in absolute qEEG power following administration of fosgonimeton (left) and associated p values from ANCOVA analysis (right; not corrected for multiple comparisons). ANCOVA, analysis of covariance; SAD, single ascending dose; qEEG, quantitative electroencephalogram.
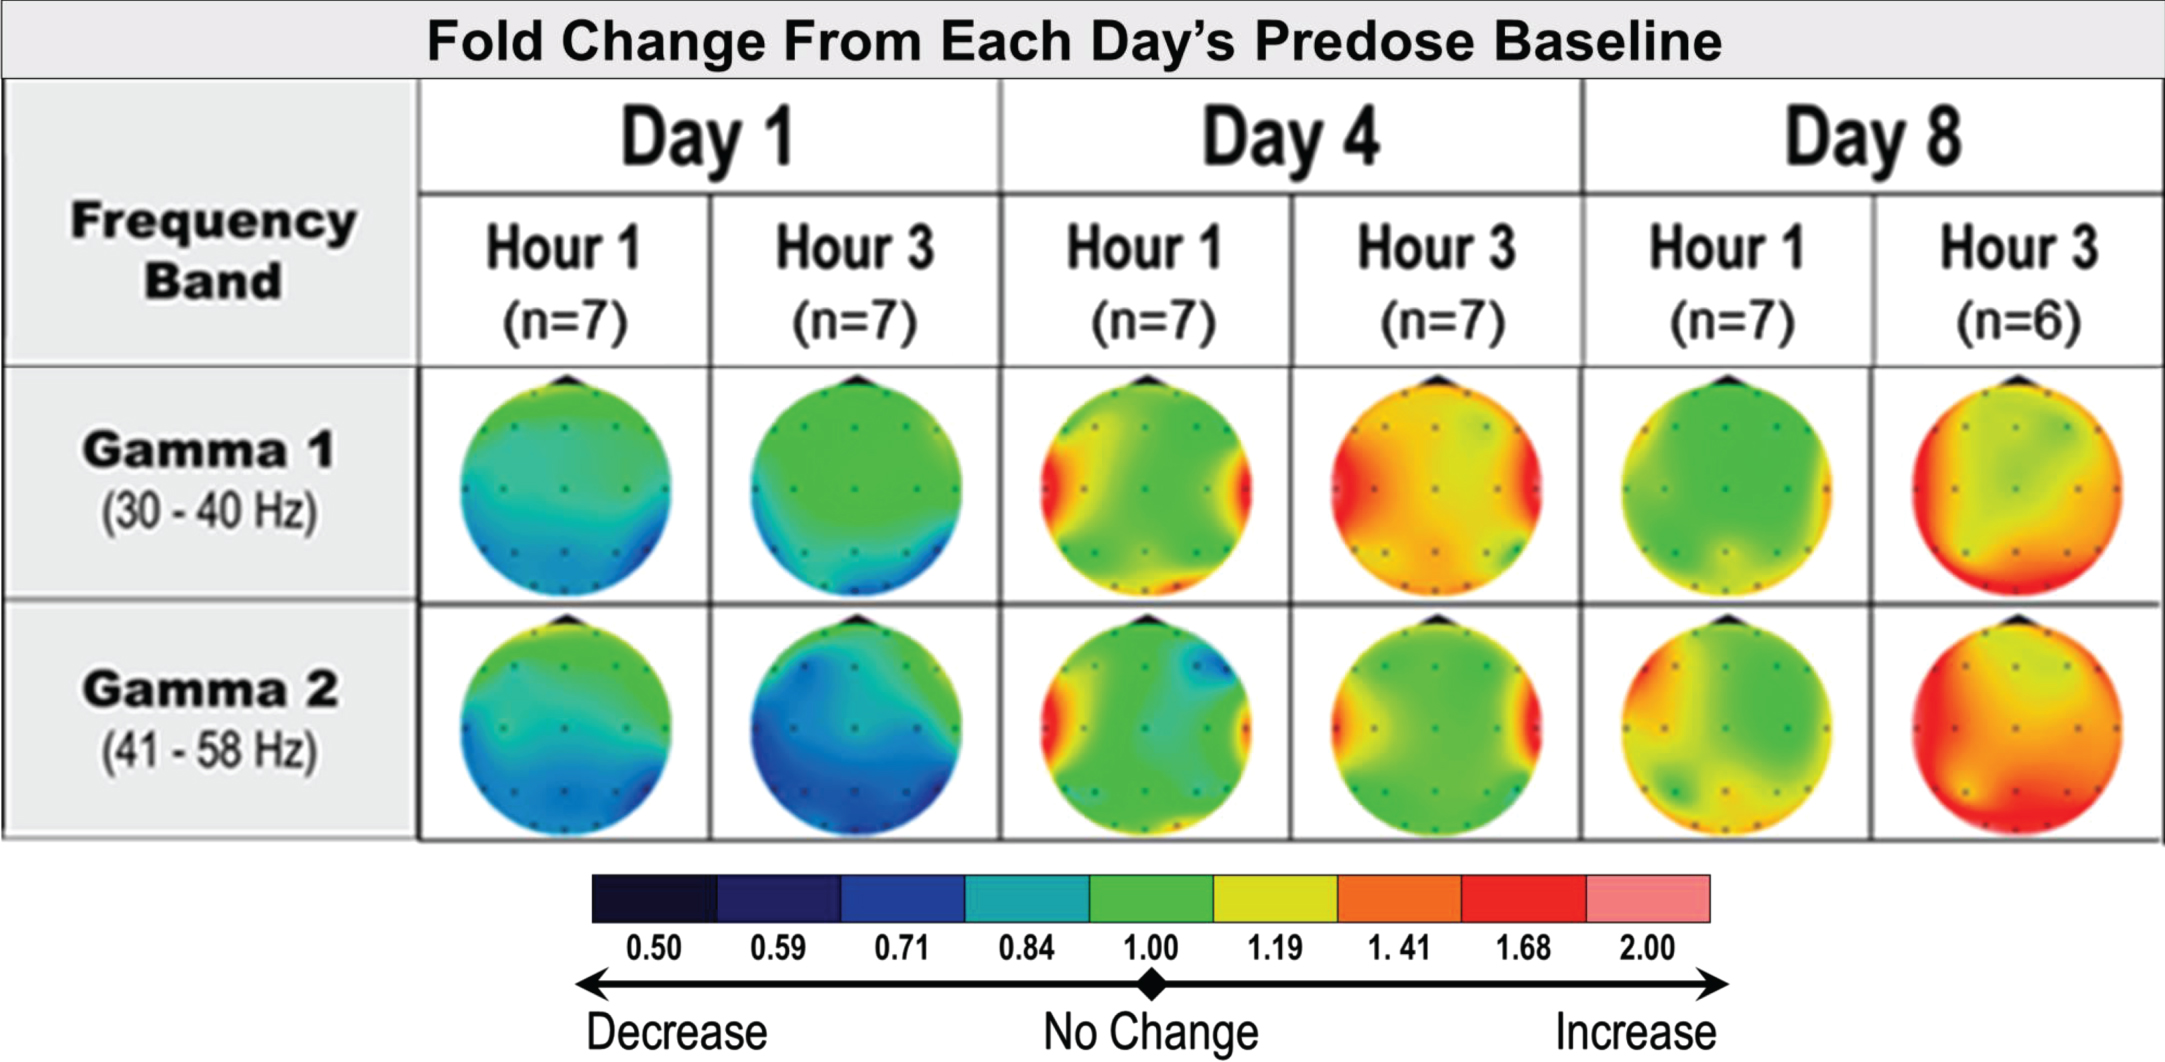
In the multiple dose studies of healthy elderly subjects, qEEG assessments were conducted at predose, 1 h, and 3 h postdose, on days 1, 4, and 8. Similarly, the main qEEG effect was gamma power enhancement, both at 3 h postdose on day 1 and across multiple time points collected on days 4 and 8 at 20 mg (Fig. 5). Similar effects were observed at 40 mg and 60 mg OD doses of fosgonimeton (data not shown); data for the 80 mg dose level were not analyzed due to technical issues during data collection and a smaller sample size. The lasting effect on gamma power detectable at predose on days 4 and 8 (i.e., 24 h since the last dose) may suggest a sustained pharmacodynamic effect of fosgonimeton beyond 5×half-life (ATH-1001 plasma elimination half-life=1.5 h). Increase in gamma power was specific to the active treatment groups as no gamma power increase was observed in subjects receiving placebo.
Fig. 5
Acute and sustained increase in qEEG gamma induction in healthy elderly subjects receiving multiple doses of fosgonimeton at 20 mg (SC, OD, 9 days). qEEG assessments were conducted at predose, and 1 hour and 3 hours postdose, on days 1, 4, and 8. The heat maps illustrate the average change in relative qEEG power from baseline (day 1 predose) to each qEEG recording after treatment start (change from study baseline ratio). Only gamma power shown; fosgonimeton did not induce consistent and substantial changes in any other waveform. OD, once daily; qEEG, quantitative electroencephalogram; SC, subcutaneous.
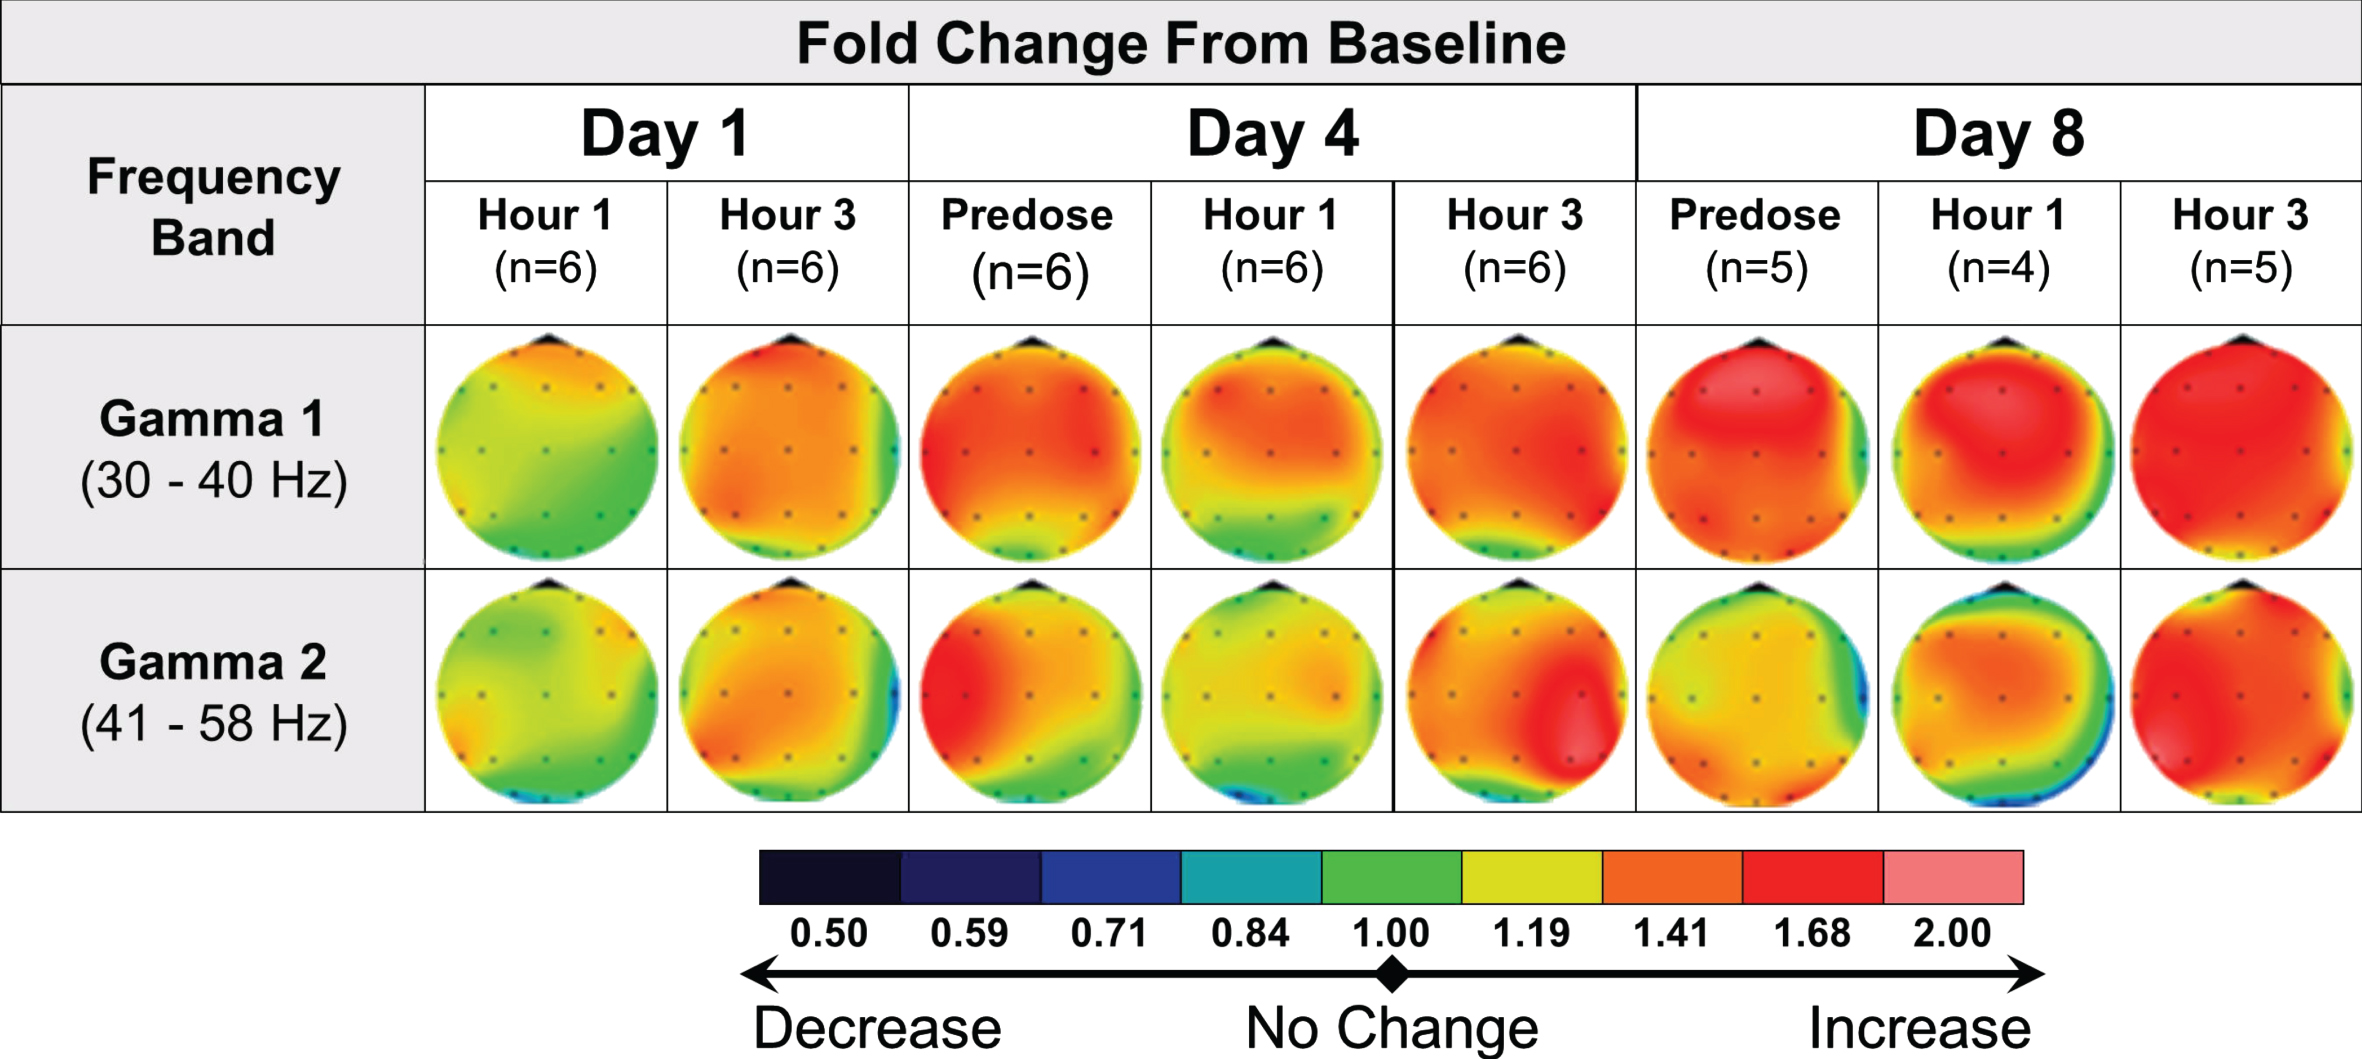
In AD subjects, the protocoled qEEG analysis comparing postdose recordings to Day 1 predose did not show relevant effects of multiple administrations of 40 mg fosgonimeton once daily over 8 days. A post hoc analysis of intra-day qEEG changes from predose to postdose on each recording day (i.e., day 1, day 4 and day 8) pointed to increased gamma power over time, a pattern not observed in the placebo group (Fig. 6). More variability was observed in AD subjects compared with healthy subjects.
Fig. 6
qEEG effects of repeat dose fosgonimeton in AD subjects (40 mg, SC, OD, 9 days). qEEG analysis of AD subjects (n = 7) demonstrates an increase in gamma power following daily fosgonimeton (40 mg, OD, SC) administration. qEEG was assessed at predose, and 1 hour and 3 hours postdose on treatment day 1, 4, and 8. Data are expressed as qEEG relative power normalized to each day’s predose recording. AD, Alzheimer’s disease; OD, once daily; qEEG, quantitative electroencephalogram; SC, subcutaneous.
ERP P300 latency
ERP P300 recordings were conducted at predose, 1 h, and 3 h postdose on days 1, 4, and 8, in healthy elderly and AD subjects using an auditory oddball paradigm. As expected, healthy elderly subjects receiving active doses of fosgonimeton (20, 40, 60 mg) did not show a change in ERP P300 latency, since there was no impairment in neuronal connectivity.
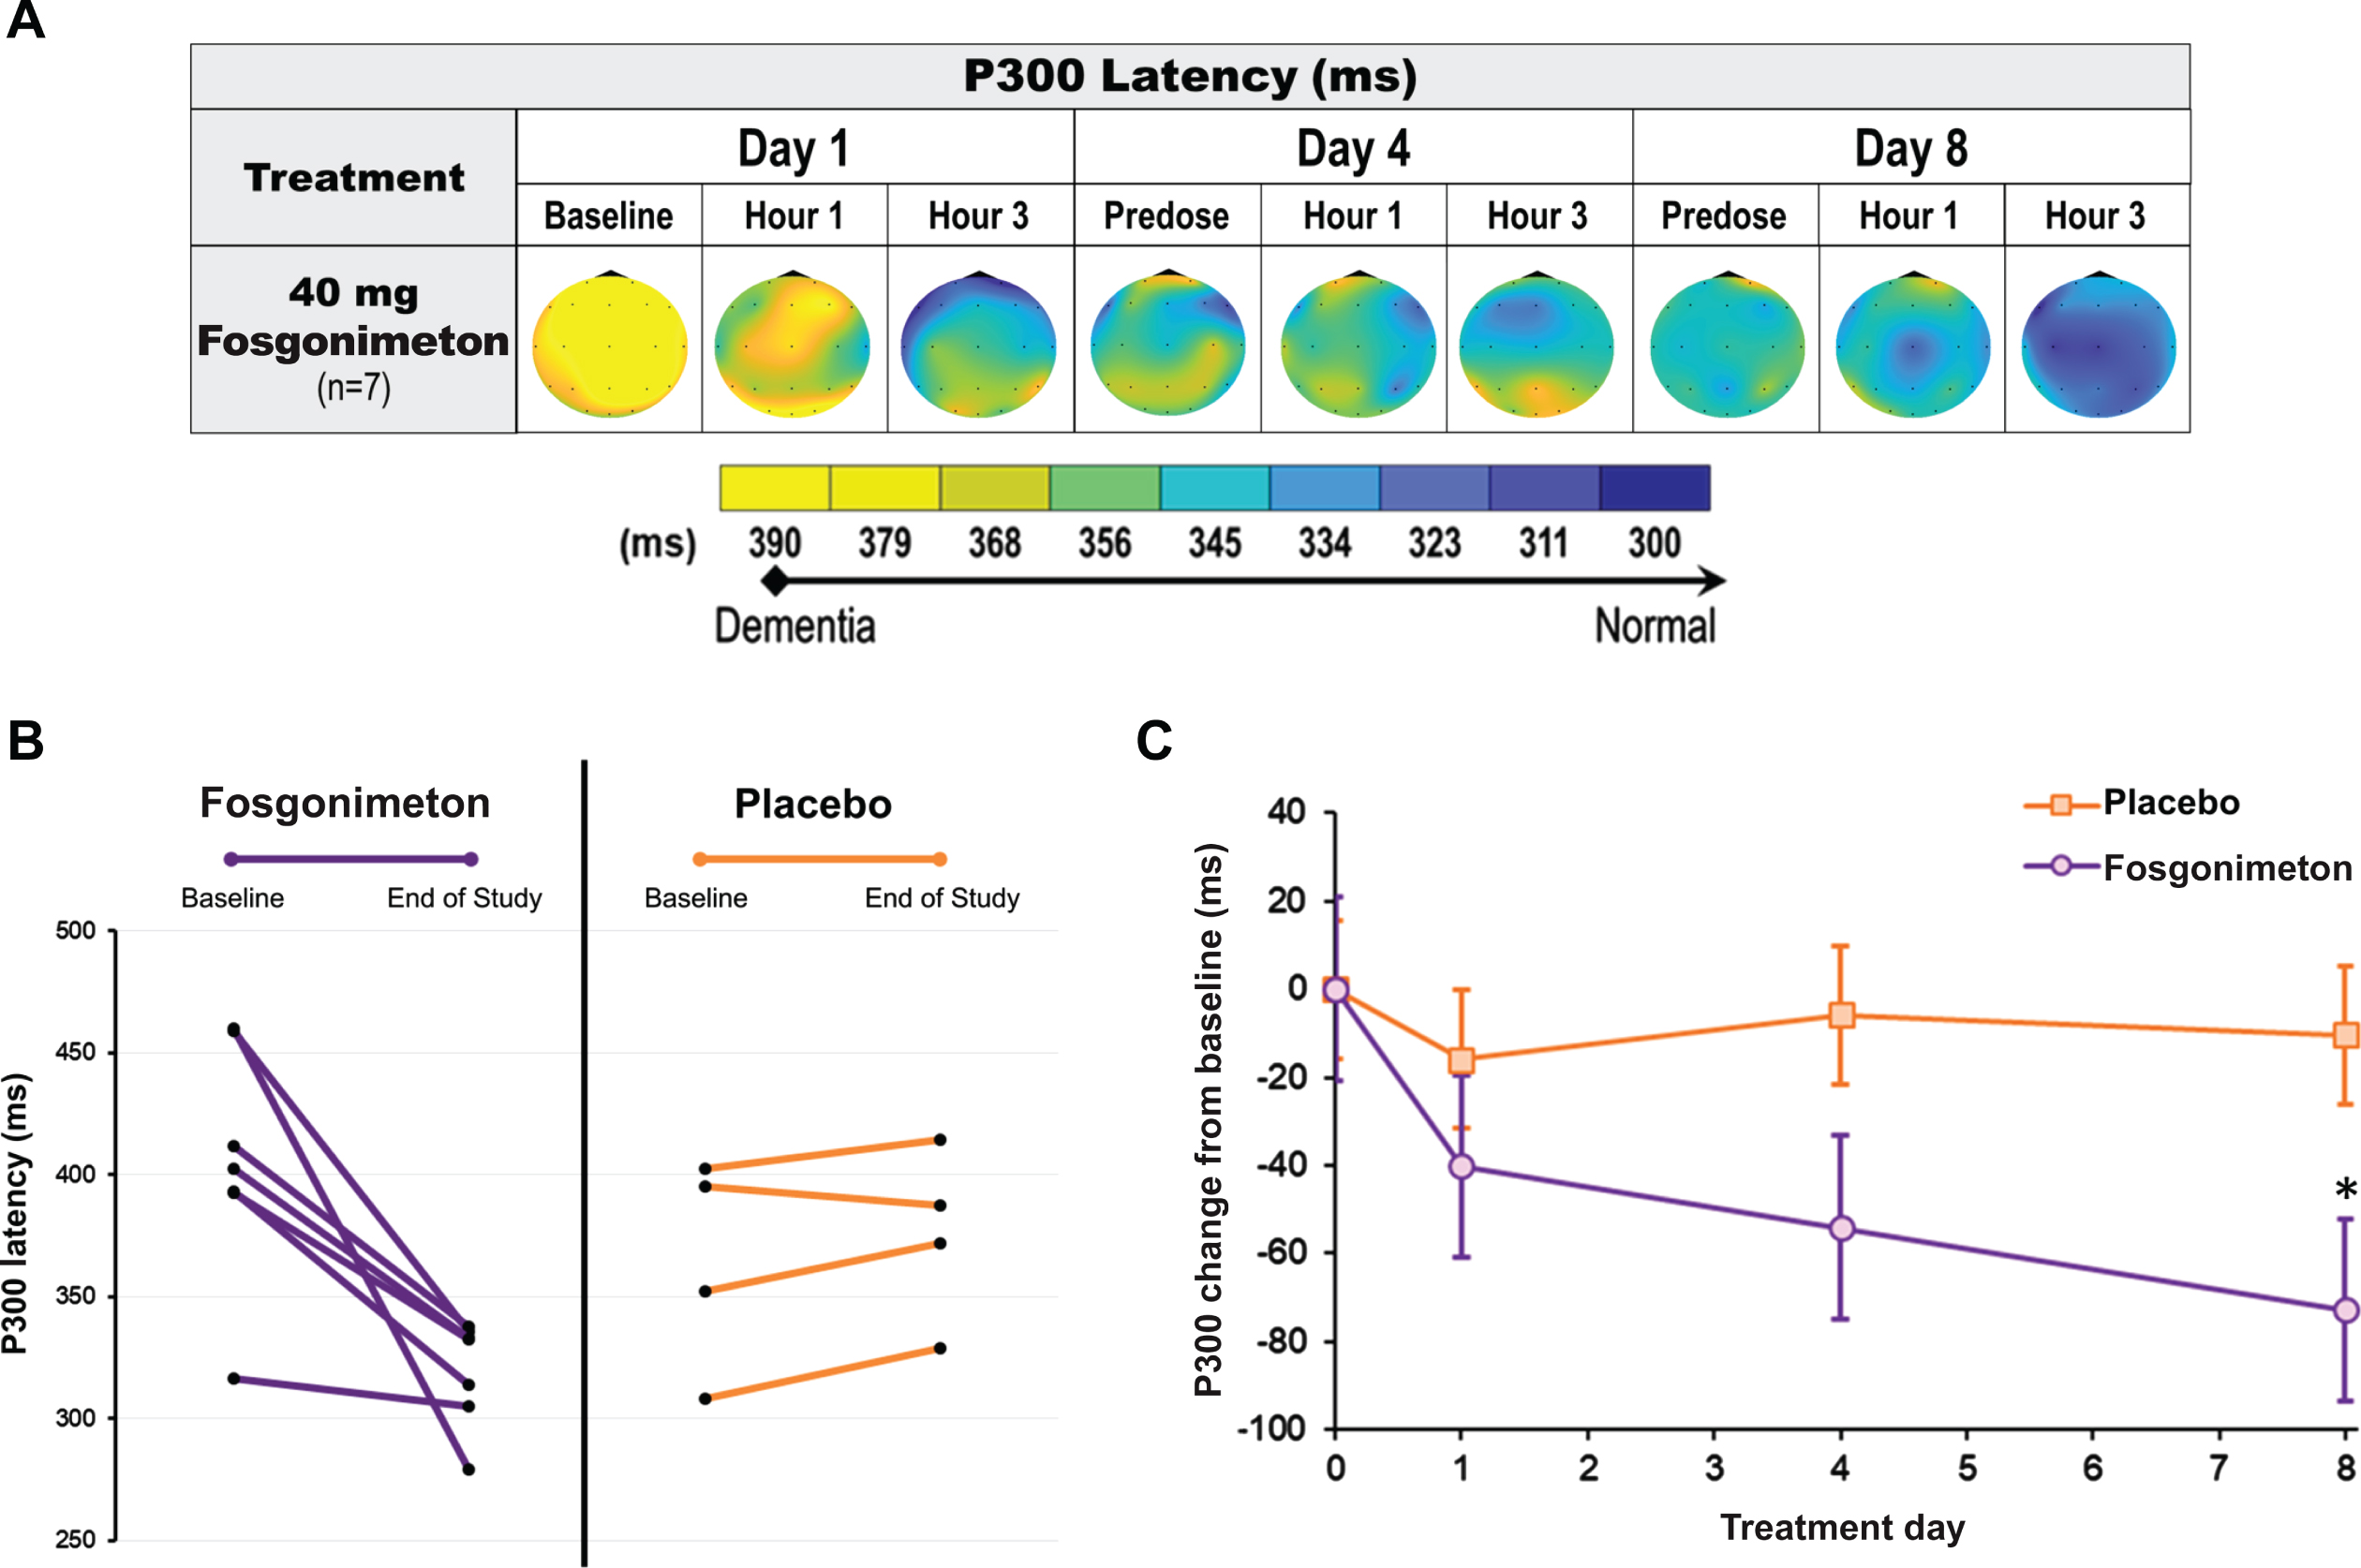
All AD subjects showed a clearly prolonged ERP P300 latency at baseline (n = 11; mean: 390.4±48.9 ms). The active group received fosgonimeton at 40 mg (n = 7; SC, OD, 9 consecutive days) and showed gradual normalization of ERP P300 latency with repeat dosing. ERP P300 latency was reduced by 72.8±48.8 ms on day 8 from a mean baseline of 405±48.5 ms on day 1 predose (Fig. 7A). All 7 AD subjects in the active treatment group individually responded to 40 mg fosgonimeton and contributed to the group effect of reduced P300 latency over 8 days, while none of the 4 subjects in the placebo group showed any consistent change in ERP P300 latency over the course of treatment (Fig. 7B). Compared with placebo, there was a significant separation of the fosgonimeton treatment effects on percent change in ERP P300 latency on day 8, with the mixed model for repeated measures analysis (p = 0.027) (Fig. 7C).
Fig. 7
Effect of fosgonimeton on ERP P300 latency in AD subjects. ERP P300 analysis of AD subjects demonstrates a significant reduction in ERP P300 latency following fosgonimeton (40 mg, OD, SC) administration. ERP (auditory oddball paradigm) was assessed at predose, and 1 hour and 3 hours postdose on treatment day 1, 4, and 8. A) Heat maps of the group average ERP P300 latency data expressed in milliseconds (ms) for the AD subjects received fosgonimeton active treatment (n = 7). B) All subjects receiving fosgonimeton (n = 7) demonstrated reduced ERP P300 latency from baseline to end of study for ERP on day 8, while subjects receiving placebo demonstrated no consistent change from baseline. C) ERP P300 latency changes from baseline over the 8-day treatment for fosgonimeton (n = 7) compared to placebo (n = 4). Data shown are mean ERP P300 values from Fz, Cz, Pz electrodes±SEM. *p = 0.027 with MMRM analysis. AD, Alzheimer’s disease; ERP, event-related potential; MMRM, mixed effect model repeat measurement; OD, once daily; SC, subcutaneous; SEM, standard error of the mean.
DISCUSSION
Activation of the HGF/MET neurotrophic system represents a novel, multipronged approach to treat patients with AD and dementia. Several aspects distinguish this approach from therapeutic avenues explored in the past: it is neither based on a monocausal pathophysiological hypothesis of AD, nor does it address only a single neurotransmitter disturbance. Because this approach is agnostic to the underlying singular causes, it is orthogonal to the current development mainstay, and thus, the selection of the trial population is not critically dependent on experimental diagnostic criteria and invasive, less accessible investigations. At the same time, HGF/MET activation was shown in a broad body of literature to address many of the known contributing factors in AD (e.g., synaptic loss, neurodegeneration, neuroinflammation, and reduced perfusion) [28, 29, 31]. Synaptic relocalization of NMDA receptors in the synaptic cleft is an additional feature of HGF/MET activation, counteracting excitotoxicity and improving long-term potentiation [41]. Fosgonimeton represents a new potential approach to treat patients with AD and dementia by addressing the complex system failure of synaptic function and neurodegeneration.
The results of the phase I trial of fosgonimeton, including a total of 88 healthy young and elderly subjects, and a cohort of AD subjects, showed that single and repeat SC administration of fosgonimeton was safe and well-tolerated. A maximum tolerated dose was not achieved. The incidence of TEAEs was similar across active and placebo-treated groups, with injection site pain and injection pruritus being the single TEAEs classified as “related” to fosgonimeton treatment. Injection site reactions are common with drugs administered subcutaneously [42, 43]. All injection site reactions resolved without sequelae prior to study completion.
The active metabolite ATH-1001 is a specific, highly potent compound that increases phosphorylation of the MET receptor. The prodrug fosgonimeton was not detected in the brain or any other tissue in preclinical studies (Johnston J, unpublished data). Fosgonimeton was developed as a water-soluble prodrug of ATH-1001 to allow SC dosing in aqueous vehicles. In keeping with preclinical studies, fosgonimeton was rapidly absorbed and converted to ATH-1001 in human plasma. Fosgonimeton and ATH-1001 also demonstrated increasing exposure with increasing dose levels (i.e., approximate dose linearity in Cmax and AUC) with no obvious accumulation over time (Johnston J, unpublished data).
Modulation of qEEG spectral power by pharmacological agents indicates CNS penetrance and suggests target engagement; qEEG can serve as a noninvasive translational biomarker from preclinical to clinical studies [44]. In AD patients, qEEG spectral power is shifted from high frequency activity (beta, gamma) to slower wave forms (delta, theta) [45]. In preclinical studies, fosgonimeton was shown to induce high-frequency gamma power in the APP/PS1 AD mouse model, with an acute effect observed within 1 h postdose and a persistent effect still observed 7 days off-drug after a 14-day treatment period. Fosgonimeton exposures that induced qEEG changes overlap with the range of exposures that are active in animal models of dementia, suggesting the utility of qEEG as translatable pharmacodynamic signal to guide dose optimization in human clinical trials (Johnston J, unpublished data). Overall, the qEEG results from the phase I trial are indicative of CNS target engagement, suggesting an active dose range of fosgonimeton between 20 mg and 90 mg, inclusive. Doses higher than 90 mg have not been tested.
ERP is a method of recording brain activity elicited by external stimuli (e.g., an oddball auditory stimulus), and P300 is a well-established functional biomarker of cognition, particularly of working memory access [46, 47]. ERP P300 is characterized by a stereotyped series of voltage deflections occurring after the end of the respective odd tone to be counted, with early features (<100 ms) corresponding to unconscious sensory transmission (auditory cortex, N100), and later features produced by cognitive processing in the ventral attentional network (i.e., P300, referring to the large positive deflection at roughly 300 ms in healthy adults). ERP P300 latency is sensitive to detecting reduced synaptic transmission related to cognitive decline in AD patients and other dementias [47] and has been shown to occur pharmacologically (e.g., after scopolamine or benzodiazepines administration, resulting in transiently increased latencies) [48–52]. Conversely, cholinergic drugs reduce ERP P300 latency in AD [53, 54]. Increased ERP P300 latency has been consistently demonstrated in AD patients, likely due to either synapse loss or synaptic dysfunction and impaired neuronal network connectivity [46, 55–58]. The novel observation of fosgonimeton reversing pathologically increased ERP P300 latency in AD subjects over a treatment course of 8 days may indicate restoration of network connectivity and/or improvement in neuronal function. These results also further corroborate CNS penetration and target engagement.
There are several limitations to our study. Due to the small number of subjects, there was no stratification based on sex or site in MAD. Although all assessments, including ERP P300 latency, were prospective, the AD cohort was rather limited in size, which was also due to the phase I nature of the trial. While in line with phase I study design, the observation period of 8 days was rather short for pharmacodynamic effects on cognition and their extrapolation toward long-term treatment effects requires confirmation of phase II studies. On the other hand, the active group response was consistent and robust compared with ERP P300 latency changes induced by marketed AD drugs over longer exposure periods [59]. Further, the AD cohort was tested at a fixed dose only (40 mg, 9 days). Finally, a maximum tolerated dose was not determined, although this may not be necessary considering the overlap of the effective dose range in translation from preclinical to clinical studies.
The safety and PK results clearly support continued development of fosgonimeton. The hypothesis of tangible procognitive benefit as suggested by the ERP P300 latency results is currently being tested in two late-stage, 26-week double-blind, placebo-controlled trials in mild to moderate AD (ACT-AD: NCT04491006 and LIFT-AD: NCT04488419).
ACKNOWLEDGMENTS
The authors thank the subjects and study-site personnel for their participation in the study. The study was funded by Athira Pharma, Inc. and an Alzheimer’s Drug Discovery Foundation (PACT) grant (PI: Kawas; Co-PI: Hua). We would like to thank Dr. Leen Kawas for her support of the research teams involved in these studies and acknowledge her contributions to the conceptualization, design, and work on this study, including the qEEG and ERP P300 methods. Larry Ereshefsky provided input for study design and qEEG and ERP P300 methods. Steve Smith supported PK study design and data interpretation. Medical writing and editorial support, conducted in accordance with Good Publication Practice (GPP3) and the International Committee of Medical Journal Editors (ICMJE) guidelines, were provided by Oxford PharmaGenesis Inc., Newtown, PA, USA, and funded by Athira Pharma, Inc., Bothell, WA, USA.
Authors’ disclosures available online (https://www.j-alz.com/manuscript-disclosures/21-5511r1).
SUPPLEMENTARY MATERIAL
[1] The supplementary material is available in the electronic version of this article: https://dx.doi.org/10.3233/JAD-215511.
REFERENCES
[1] | Scheltens P , De Strooper B , Kivipelto M , Holstege H , Chetelat G , Teunissen CE , Cummings J , van der Flier WM ((2021) ) Alzheimer’s disease. Lancet 397: , 1577–1590. |
[2] | D’Onofrio G , Sancarlo D , Addante F , Ciccone F , Cascavilla L , Paris F , Picoco M , Nuzzaci C , Elia AC , Greco A , Chiarini R , Panza F , Pilotto A ((2015) ) Caregiver burden characterization in patients with Alzheimer’s disease or vascular dementia. Int J Geriatr Psychiatry 30: , 891–899. |
[3] | Rhodius-Meester HFM , Tijms BM , Lemstra AW , Prins ND , Pijnenburg YAL , Bouwman F , Scheltens P , van der Flier WM ((2019) ) Survival in memory clinic cohort is short, even in young-onset dementia. J Neurol Neurosurg Psychiatry 90: , 726–728. |
[4] | Alzheimer’s Association ((2021) ) 2021 Alzheimer’s disease facts and figures. Alzheimers Dement 17: , 327–406. |
[5] | Prince M , Wimo A , Guerchet M , Ali G , Wu Y , Prina M ((2015) ) World Alzheimer Report 2015. The global impact of dementia: An analysis of prevalence, incidence, cost and trends.. Alzheimer’s Disease International, London. |
[6] | World Health Organization ((2017) ) Global action plan on the public health response to dementia: 2017–2025. World Health Organization, Geneva. |
[7] | Knopman DS , Amieva H , Petersen RC , Chetelat G , Holtzman DM , Hyman BT , Nixon RA , Jones DT ((2021) ) Alzheimer disease. Nat Rev Dis Primers 7: , 33. |
[8] | De Strooper B , Karran E ((2016) ) The cellular phase of Alzheimer’s disease. Cell 164: , 603–615. |
[9] | Karch CM , Goate AM ((2015) ) Alzheimer’s disease risk genes and mechanisms of disease pathogenesis. Biol Psychiatry 77: , 43–51. |
[10] | Johnston ECB , Dammer EB , Duong DM , Ping L , Zhou M , Yin L , Higginbotham LA , Guajardo A , White B , Troncoso JC , Thambisetty M , Montine TJ , Lee EB , Trojanowski JQ , Beach TG , Reiman EM , Haroutunian V , Wang M , Schadt E , Zhang B , Dickson DW , Ertekin-Taner N , Golde TE , Petyuk VA , De Jager PL , Bennett DA , Wingo TS , Rangaraju S , Hajjar I , Shulman JM , Lah JJ , Levey AI , Seyfried NT ((2020) ) Large-scale proteomic analysis of Alzheimer’s disease brain and cerebrospinal fluid reveals early changes in energy metabolism associated with microglia and astrocyte activation. Nat Med 26: , 769–780. |
[11] | Solis E Jr. , Hascup KN , Hascup ER ((2020) ) Alzheimer’s disease: The link between amyloid-beta and neurovascular dysfunction. J Alzheimers Dis 76: , 1179–1198. |
[12] | Koffie RM , Hyman BT , Spires-Jones TL ((2011) ) Alzheimer’s disease: Synapses gone cold. Mol Neurodegener 6: , 63. |
[13] | Chen Y , Fu AKY , Ip NY ((2019) ) Synaptic dysfunction in Alzheimer’s disease: Mechanisms and therapeutic strategies. Pharmacol Ther 195: , 186–198. |
[14] | Jackson J , Jambrina E , Li J , Marston H , Menzies F , Phillips K , Gilmour G ((2019) ) Targeting the synapse in Alzheimer’s disease. Front Neurosci 13: , 735. |
[15] | Terry RD , Masliah E , Salmon DP , Butters N , DeTeresa R , Hill R , Hansen LA , Katzman R ((1991) ) Physical basis of cognitive alterations in Alzheimer’s disease: Synapse loss is the major correlate of cognitive impairment. Ann Neurol 30: , 572–580. |
[16] | Scheff SW , Price DA , Schmitt FA , Scheff MA , Mufson EJ ((2011) ) Synaptic loss in the inferior temporal gyrus in mild cognitive impairment and Alzheimer’s disease. J Alzheimers Dis 24: , 547–557. |
[17] | Scheff SW , Price DA , Schmitt FA , Mufson EJ ((2006) ) Hippocampal synaptic loss in early Alzheimer’s disease and mild cognitive impairment. Neurobiol Aging 27: , 1372–1384. |
[18] | Blanco-Silvente L , Castells X , Saez M , Barcelo MA , Garre-Olmo J , Vilalta-Franch J , Capella D ((2017) ) Discontinuation, efficacy, and safety of cholinesterase inhibitors for Alzheimer’s disease: A meta-analysis and meta-regression of 43 randomized clinical trials enrolling 16 106 patients. Int J Neuropsychopharmacol 20: , 519–528. |
[19] | Cummings J , Aisen PS , DuBois B , Frolich L , Jack CR Jr. , Jones RW , Morris JC , Raskin J , Dowsett SA , Scheltens P ((2016) ) Drug development in Alzheimer’s disease: The path to 2025. Alzheimers Res Ther 8: , 39. |
[20] | Knopman DS , Jones DT , Greicius MD ((2021) ) Failure to demonstrate efficacy of aducanumab: An analysis of the EMERGE and ENGAGE trials as reported by Biogen, December 2019. Alzheimers Dement 17: , 696–701. |
[21] | Cummings JL , Morstorf T , Zhong K ((2014) ) Alzheimer’s disease drug-development pipeline: Few candidates, frequent failures. Alzheimers Res Ther 6: , 37. |
[22] | Reichardt LF ((2006) ) Neurotrophin-regulated signalling pathways. Philos Trans R Soc Lond B Biol Sci 361: , 1545–1564. |
[23] | Funakoshi H , Nakamura T ((2011) ) Hepatocyte growth factor (HGF): Neutrophic functions and therapeutic implications for neuronal injury/disease. Curr Signal Tranduct Ther 6: , 156–167. |
[24] | Calissano P , Matrone C , Amadoro G ((2010) ) Nerve growth factor as a paradigm of neurotrophins related to Alzheimer’s disease. Dev Neurobiol 70: , 372–383. |
[25] | Kazim SF , Iqbal K ((2016) ) Neurotrophic factor small-molecule mimetics mediated neuroregeneration and synaptic repair: Emerging therapeutic modality for Alzheimer’s disease. Mol Neurodegener 11: , 50. |
[26] | Funakoshi H , Nakamura T ((2003) ) Hepatocyte growth factor: From diagnosis to clinical applications. Clin Chim Acta 327: , 1–23. |
[27] | Date I , Takagi N , Takagi K , Tanonaka K , Funakoshi H , Matsumoto K , Nakamura T , Takeo S ((2006) ) Hepatocyte growth factor attenuates cerebral ischemia-induced increase in permeability of the blood-brain barrier and decreases in expression of tight junctional proteins in cerebral vessels. Neurosci Lett 407: , 141–145. |
[28] | Hawrylycz M , Miller JA , Menon V , Feng D , Dolbeare T , Guillozet-Bongaarts AL , Jegga AG , Aronow BJ , Lee CK , Bernard A , Glasser MF , Dierker DL , Menche J , Szafer A , Collman F , Grange P , Berman KA , Mihalas S , Yao Z , Stewart L , Barabasi AL , Schulkin J , Phillips J , Ng L , Dang C , Haynor DR , Jones A , Van Essen DC , Koch C , Lein E ((2015) ) Canonical genetic signatures of the adult human brain. Nat Neurosci 18: , 1832–1844. |
[29] | Hamasaki H , Honda H , Suzuki SO , Hokama M , Kiyohara Y , Nakabeppu Y , Iwaki T ((2014) ) Down-regulation of MET in hippocampal neurons of Alzheimer’s disease brains. Neuropathology 34: , 284–290. |
[30] | Maina F , Klein R ((1999) ) Hepatocyte growth factor, a versatile signal for developing neurons. Nat Neurosci 2: , 213–217. |
[31] | Takeuchi D , Sato N , Shimamura M , Kurinami H , Takeda S , Shinohara M , Suzuki S , Kojima M , Ogihara T , Morishita R ((2008) ) Alleviation of Abeta-induced cognitive impairment by ultrasound-mediated gene transfer of HGF in a mouse model. Gene Ther 15: , 561–571. |
[32] | Koike H , Ishida A , Shimamura M , Mizuno S , Nakamura T , Ogihara T , Kaneda Y , Morishita R ((2006) ) Prevention of onset of Parkinson’s disease by in vivo gene transfer of human hepatocyte growth factor in rodent model: A model of gene therapy for Parkinson’s disease. Gene Ther 13: , 1639–1644. |
[33] | Liu XS , Li JF , Wang SS , Wang YT , Zhang YZ , Yin HL , Geng S , Gong HC , Han B , Wang YL ((2014) ) Human umbilical cord mesenchymal stem cells infected with adenovirus expressing HGF promote regeneration of damaged neuron cells in a Parkinson’s disease model. Biomed Res Int 2014: , 909657. |
[34] | Sun W , Funakoshi H , Nakamura T ((2002) ) Overexpression of HGF retards disease progression and prolongs life span in a transgenic mouse model of ALS. J Neurosci 22: , 6537–6548. |
[35] | Sun W , Funakoshi H , Nakamura T ((2002) ) Localization and functional role of hepatocyte growth factor (HGF) and its receptor c-met in the rat developing cerebral cortex. Brain Res Mol Brain Res 103: , 36–48. |
[36] | Cohen JA ((2013) ) Mesenchymal stem cell transplantation in multiple sclerosis. J Neurol Sci 333: , 43–49. |
[37] | Rocco ML , Soligo M , Manni L , Aloe L ((2018) ) Nerve growth factor: Early studies and recent clinical trials. Curr Neuropharmacol 16: , 1455–1465. |
[38] | Organ SL , Tsao MS ((2011) ) An overview of the c-MET signaling pathway. Ther Adv Med Oncol 3: , S7–S19. |
[39] | Akimoto M , Baba A , Ikeda-Matsuo Y , Yamada MK , Itamura R , Nishiyama N , Ikegaya Y , Matsuki N ((2004) ) Hepatocyte growth factor as an enhancer of NMDA currents and synaptic plasticity in the hippocampus. Neuroscience 128: , 155–162. |
[40] | Nakamura T , Sakai K , Nakamura T , Matsumoto K ((2011) ) Hepatocyte growth factor twenty years on: Much more than a growth factor. J Gastroenterol Hepatol 26 Suppl 1: , 188–202. |
[41] | Akita H , Takagi N , Ishihara N , Takagi K , Murotomi K , Funakoshi H , Matsumoto K , Nakamura T , Takeo S ((2008) ) Hepatocyte growth factor improves synaptic localization of the NMDA receptor and intracellular signaling after excitotoxic injury in cultured hippocampal neurons. Exp Neurol 210: , 83–94. |
[42] | Stewart TM , Tran ZV ((2012) ) Injectable multiple sclerosis medications: A patient survey of factors associated with injection-site reactions. Int J MS Care 14: , 46–53. |
[43] | St Clair-Jones A , Prignano F , Goncalves J , Paul M , Sewerin P ((2020) ) Understanding and minimising injection-site pain following subcutaneous administration of biologics: A narrative review. Rheumatol Ther 7: , 741–757. |
[44] | Leiser SC , Dunlop J , Bowlby MR , Devilbiss DM ((2011) ) Aligning strategies for using EEG as a surrogate biomarker: A review of preclinical and clinical research. Biochem Pharmacol 81: , 1408–1421. |
[45] | Jeong J ((2004) ) EEG dynamics in patients with Alzheimer’s disease. Clin Neurophysiol 115: , 1490–1505. |
[46] | Ally BA , Jones GE , Cole JA , Budson AE ((2006) ) The P300 component in patients with Alzheimer’s disease and their biological children. Biol Psychol 72: , 180–187. |
[47] | Olichney JM , Yang JC , Taylor J , Kutas M ((2011) ) Cognitive event-related potentials: Biomarkers of synaptic dysfunction across the stages of Alzheimer’s disease. J Alzheimers Dis 26 Suppl 3: , 215–228. |
[48] | Lai CL , Lin RT , Liou LM , Liu CK ((2010) ) The role of event-related potentials in cognitive decline in Alzheimer’s disease. Clin Neurophysiol 121: , 194–199. |
[49] | Fruehwirt W , Dorffner G , Roberts S , Gerstgrasser M , Grossegger D , Schmidt R , Dal-Bianco P , Ransmayr G , Garn H , Waser M , Benke T ((2019) ) Associations of event-related brain potentials and Alzheimer’s disease severity: A longitudinal study. Prog Neuropsychopharmacol Biol Psychiatry 92: , 31–38. |
[50] | Meador KJ , Loring DW , Adams RJ , Patel BR , Davis HC , Hammond EJ ((1987) ) Central cholinergic systems and the P3 evoked potential. Int J Neurosci 33: , 199–205. |
[51] | Potter DD , Pickles CD , Roberts RC , Rugg MD ((2000) ) Scopolamine impairs memory performance and reduces frontal but not parietal visual P3 amplitude. Biol Psychol 52: , 37–52. |
[52] | Pompeia S , Manzano GM , Galduroz JC , Tufik S , Bueno OF ((2003) ) Lorazepam induces an atypical dissociation of visual and auditory event-related potentials. J Psychopharmacol 17: , 31–40. |
[53] | Vaitkevicius A , Kaubrys G , Audronyte E ((2015) ) Distinctive effect of donepezil treatment on P300 and N200 subcomponents of auditory event-related evoked potentials in Alzheimer disease patients. Med Sci Monit 21: , 1920–1927. |
[54] | Werber EA , Gandelman-Marton R , Klein C , Rabey JM ((2003) ) The clinical use of P300 event related potentials for the evaluation of cholinesterase inhibitors treatment in demented patients. J Neural Transm (Vienna) 110: , 659–669. |
[55] | Cecchi M , Moore DK , Sadowsky CH , Solomon PR , Doraiswamy PM , Smith CD , Jicha GA , Budson AE , Arnold SE , Fadem KC ((2015) ) A clinical trial to validate event-related potential markers of Alzheimer’s disease in outpatient settings. Alzheimers Dement (Amst) 1: , 387–394. |
[56] | Howe AS , Bani-Fatemi A , De Luca V ((2014) ) The clinical utility of the auditory P300 latency subcomponent event-related potential in preclinical diagnosis of patients with mild cognitive impairment and Alzheimer’s disease. Brain Cogn 86: , 64–74. |
[57] | Jiang S , Qu C , Wang F , Liu Y , Qiao Z , Qiu X , Yang X , Yang Y ((2015) ) Using event-related potential P300 as an electrophysiological marker for differential diagnosis and to predict the progression of mild cognitive impairment: A meta-analysis. Neurol Sci 36: , 1105–1112. |
[58] | Juckel G , Clotz F , Frodl T , Kawohl W , Hampel H , Pogarell O , Hegerl U ((2008) ) Diagnostic usefulness of cognitive auditory event-related p300 subcomponents in patients with Alzheimer’s disease? J Clin Neurophysiol 25: , 147–152. |
[59] | Thomas A , Iacono D , Bonanni L , D’Andreamatteo G , Onofrj M ((2001) ) Donepezil, rivastigmine, and vitamin E in Alzheimer disease: A combined P300 event-related potentials/neuropsychologic evaluation over 6 months. Clin Neuropharmacol 24: , 31–42. |

