
Cortical Thickness and Its Association with Clinical Cognitive and Neuroimaging Markers in Cerebral Amyloid Angiopathy
Abstract
Background:
Cerebral amyloid angiopathy (CAA) contributes to brain neurodegeneration and cognitive decline, but the relationship between these two processes is incompletely understood.
Objective:
The purpose of this study is to examine cortical thickness and its association with cognition and neurodegenerative biomarkers in CAA.
Methods:
Data were collected from the Functional Assessment of Vascular Reactivity study and the Calgary Normative Study. In total, 48 participants with probable CAA, 72 cognitively normal healthy controls, and 24 participants with mild dementia due to AD were included. Participants underwent an MRI scan, after which global and regional cortical thickness measurements were obtained using FreeSurfer. General linear models, adjusted for age and sex, were used to compare cortical thickness globally and in an AD signature region.
Results:
Global cortical thickness was lower in CAA compared to healthy controls (mean difference (MD) –0.047 mm, 95% confidence interval (CI) –0.088, –0.005, p = 0.03), and lower in AD compared to CAA (MD –0.104 mm, 95% CI –0.165, –0.043, p = 0.001). In the AD signature region, cortical thickness was lower in CAA compared to healthy controls (MD –0.07 mm, 95% CI –0.13 to –0.01, p = 0.02). Within the CAA group, lower cortical thickness was associated with lower memory scores (R2 = 0.10; p = 0.05) and higher white matter hyperintensity volume (R2 = 0.09, p = 0.04).
Conclusion:
CAA contributes to neurodegeneration in the form of lower cortical thickness, and this could contribute to cognitive decline. Regional overlap with an AD cortical atrophy signature region suggests that co-existing AD pathology may contribute to lower cortical thickness observed in CAA.
INTRODUCTION
Cerebral amyloid angiopathy (CAA) is a cerebral small vessel disease characterized by amyloid-β (Aβ) accumulation in the small vessels and leptomeninges in the brain [1]. It is a leading cause of intracerebral hemorrhage (ICH) and also contributes to cognitive decline [2]. The Boston Criteria are pathologically validated for the diagnosis of CAA during life, based on clinical [3] and magnetic resonance imaging (MRI) findings including the presence of ICH and cortical superficial siderosis (cSS) [4].
Previous studies suggest that lower brain volume, a hallmark of neurodegenerative diseases, is seen in CAA, and may contribute to the development of dementia for which CAA patients are at risk even without new ICH [5, 6]. Recent research has also shown that CAA is associated with neurodegeneration in the form of thinner cerebral cortex [7, 8], a biomarker of neurodegeneration in related diseases such as Alzheimer’s disease (AD) [9, 10]. However, regional distributions of cortical thinning, and the overall relationship of cortical thickness with cognition and other biomarkers in CAA is not yet fully understood. The aim of this study was therefore to: 1) examine global and regional cortical thickness in CAA; 2) determine how cortical thickness in CAA correlates with cognition; and 3) examine how cortical thickness in CAA relates to biomarkers of CAA pathology, primarily cerebral microbleed (CMB) count and white matter hyperintensity (WMH) volume.
METHODS
Study population
Data supporting the findings of this study are available for qualified researchers upon reasonable request. The data was collected from CAA, AD, and healthy control participants who consecutively enrolled in the prospective Functional Assessment of Vascular Reactivity in Small Vessel Disease (FAVR) study [11, 12], which had two study iterations. Healthy control data were collected from both FAVR and the Calgary Normative Study, which examines longitudinal changes in brain structure in healthy individuals [13, 14], CAA and AD participants were recruited from stroke, memory, and geriatric psychiatry clinics, while healthy controls were recruited from the community using print advertising and word of mouth. Testing occurred over a period from February 2010 to May 2018, with visits including a baseline MRI scan, clinical assessment, and neuropsychological testing.
CAA participants were required to have a diagnosis of probable CAA according to the validated Boston Criteria [3]. This included multiple hemorrhages restricted to lobar, cortical, or corticosubcortical regions, or a single lobar, cortical, or subcortical hemorrhage and evidence of focal disseminated superficial siderosis. CAA participants were also required to be free of symptomatic stroke within the previous year. Participants with mild dementia due to AD were diagnosed according to the National Institute on Aging and Alzheimer’s Association clinical criteria [15]. Exclusion criteria included: presence of other chronic neurological diseases, ongoing alcohol or drug abuse, not having a study partner that could provide corroborative information (not required for healthy control participants enrolled in the Calgary Normative Study), not sufficiently proficient in English, unable to undergo an MRI scan, and having a total score on the Montreal Cognitive Assessment of < 13. Healthy controls were required to have no prior history of stroke, no other central nervous system diseases, and have a Montreal Cognitive Assessment score of≥25. The study was approved by the University of Calgary Conjoint Health Research Ethics Board, and participants gave written informed consent prior to study participation.
MRI acquisition and processing
Scanning for both FAVR and the Calgary Normative Study was conducted on a 3.0 Tesla MR Scanner (GE Signa VH/I or Discovery 750; GE Healthcare, Waukesha, Wisconsin) with a 12-channel head coil. The scanner was upgraded in January 2011; therefore, 27 participants underwent a scan on the GE Signa VH/I scanner while 117 had a scan on the Discovery 750 scanner. Detailed image parameters can be found in Supplementary Table 1. Participants in the Calgary Normative Study underwent the same imaging protocol as participants in the first (legacy) iteration of the FAVR study.
Cortical thickness measurements were obtained by processing 3D T1-weighed images with FreeSurfer (v6.0.0, surfer.nmr.mgh.harvard.edu) [16, 17]. Visualization of regions of thinning was achieved by aligning images to a common surface template and registering them to the Desikan-Killiany atlas, which parcellates the cortex into 34 gyral regions per hemisphere [18]. For twelve CAA participants with large residual lesions from past ICH we used results from the unaffected hemisphere only, similar to a previous study [7]. Freesurfer output was assessed visually (by AS) for quality. We excluded data from 5 CAA participants due to poor image quality (n = 4) and a missing baseline MRI scan (n = 1). Data was also excluded from one healthy control due to a missing baseline MRI scan. WMH volumes were measured on T2-weighted fluid attenuated inversion recovery images using the semi-automated software Quantomo (Version 1.0; Cybertrials, Inc, Calgary, Canada) [19], in accordance with consensus standards [20]. CMBs and cSS were assessed on susceptibility weighted images by a trained neurologist (EES) using previously published guidelines [21]. Images from participants with AD were reviewed for evidence of amyloid-related imaging abnormalities (ARIA) [22], while images from participants with CAA were reviewed for evidence of CAA-related inflammation [23]. Enlarged perivascular spaces (EPVS) were rated on T2-weighted images by a trained reviewer (EES) on a 4-point visual rating scale [24]. The CAA-Small Vessel Disease (CAA-SVD) score was calculated based on the number of CMBs, cSS, WMH, and EPVS, as previously described [25]. The amplitude of the blood oxygen level dependent (BOLD) signal in primary visual cortex in response to visual stimulation, a surrogate of vascular reactivity, was measured as described in a previous study [11].
Neuropsychological test battery
CAA participants completed a 1.25 h neuropsychological test battery based on harmonization standards for research on vascular cognitive impairment [26]. For each test, z-scores were derived from published norms stratified by age and then grouped into domains of memory, executive, function and processing speed. To harmonize individual tests with a national study [27], the test battery was changed in November 2016 after 37 participants were enrolled; the other 11 participants had the new battery. The memory domain score was derived from either the average of the delayed recall portion of the California Verbal Learning Test: Second Edition [28] and Rey-Osteireith Complex Figure Test [29] (first iteration of FAVR), or the delayed recall portion of the Rey Auditory Verbal Learning Test [30] and Brief Visuospatial Memory Test [31] (second iteration). The executive function domain score was based on the average of the Trail Making Test-B [32] and Control Oral Word Association Test-FAS [33], or the average of Trail Making Test-B and the Delis-Kaplan Executive Function [34] Letter Fluency tests. The processing speed domain score was based on the average of the Trail Making Test-A [32] and the Digit Symbol Coding test from the Wechsler Adult Intelligence Scale-Third Edition [35], or the Trail Making Test-A and the Digit Symbol Coding from Wechsler Adult Intelligence Scale-Fourth Edition [36].
Statistical analyses
Chi-square and Fisher’s exact test were used for categorical variables, while t-tests, one-way analyses of variance and their non-parametric equivalents (Wilcoxon rank-sum and Kruskal Wallis tests) were used for continuous variables. Pearson correlations were used to assess the relationship between cortical thickness and cognition, while Spearman rank correlations were used to assess the association between cortical thickness and WMH and CMB count. Cortical thickness was calculated as the average of the left and right hemisphere. WMH volume and hippocampal volume were expressed as a percentage of the total estimated intracranial volume to correct for intracranial size. Separate univariable analyses were conducted to determine which variables were correlated with cortical thickness, after which general linear models were built to compare thickness between the three groups. For continuous predictors, we computed adjusted partial correlation coefficients. We also compared cortical thickness in two pre-specified regions of interest: the occipital lobe (atlas regions lateral occipital, pericalcarine, cuneus, and lingual) and an AD signature region (consisting of the entorhinal cortex, fusiform, inferior parietal, inferiortemporal, mid-temporal, and precuneus) as proposed by a prior study [37]. Data were analyzed using SAS version 9.4 (SAS Institute, Cary, NC). Statistical significance was set at p≤0.05, and all tests were 2-tailed.
Regional comparisons of thinning, adjusted for age and sex, were conducted using the command line group analysis stream in FreeSurfer, which utilizes a general linear model at each point on the inflated cortical surface. Data were smoothed using a 10 mm full-width at half-maximum smoothing kernel and corrected for multiple comparisons using 10,000 Monte Carlo Simulations [38]. Maps were thresholded using a liberal vertex-cluster forming threshold of p < 0.05 due to the exploratory nature of the study.
RESULTS
Participant characteristics
In total, the final dataset included 72 healthy controls (40 FAVR, 32 Calgary Normative Study), 48 CAA, and 24 AD participants. Participant characteristics are shown in Table 1. CAA participants were more likely to have hypertension and greater WMH volume, while AD participants had lower hippocampal volume. None of the participants with AD had ARIA. Cognitive scores across all domains were lowest in the AD group (Table 1). CAA participants presented with either ICH (19/48), transient focal neurological episodes (17/48), or cognitive symptoms (12/48) (Table 2). The four participants with a history of CAA-related inflammation were clinically in remission at the time of assessments, with no evidence of vasogenic edema on their imaging.
Table 1
Characteristics of the patient population
| Characteristic | Control (n = 72) | CAA (n = 48) | AD (n = 24) | p |
| Age | 71.7±8.2 | 74.1±6.6 | 70.4±7.5 | 0.10 |
| Female, n (%) | 50 (69%) | 22 (46%) | 11 (46%) | 0.02 |
| Education | 15.1±3.1 | 13.5±2.9 | 15.8±3.2 | 0.004 |
| Hypertension, n | 21 | 31 | 8 | 0.0004 |
| Hypercholesterolemia, n | 28 | 22 | 3 | 0.06 |
| Diabetes, n | 7 | 10 | 3 | 0.23 |
| Smoker, n | 2 | 2 | 1 | 0.90 |
| WMH volume | 0.18 (0.08–0.46) | 1.47 (0.74–2.60) | 0.31 (0.16–0.56) | < 0.0001 |
| Hippocampal volume | 0.25 (0.22–0.27) | 0.23 (0.22–0.27) | 0.20 (0.19–0.23) | 0.0007 |
| BOLD visual response* | 2.66 (2.09–3.16) | 1.96 (1.33–2.62) | 2.18 (1.48–2.77) | 0.007 |
| Memory, z-score† | 0.61±0.80 | –0.81±1.18‡ | –2.07±0.79§ | < 0.0001 |
| Executive function, z-score† | 0.14±0.92 | –1.30±1.05 | –1.49±0.88§ | < 0.0001 |
| Processing speed, z-score† | 0.59±0.87 | –1.05±1.04 | –1.41±1.06§ | < 0.0001 |
| Occipital lobe thickness | 2.05±0.10 | 2.04±0.12 | 2.00±0.15 | 0.29 |
| AD signature thickness | 2.72±0.13 | 2.63±0.15 | 2.44±0.24 | < 0.0001 |
| Global thickness | 2.41±0.10 | 2.35±0.10 | 2.27±0.16 | < 0.0001 |
AD, Alzheimer’s disease; CAA, cerebral amyloid angiopathy; WMH, white matter hyperintensities; BOLD, blood oxygen level dependent. Values are represented as mean±standard deviation, median (interquartile range), or number. WMH and hippocampal volume are expressed as a percent of the total estimated intracranial volume. *Only available for the 79 participants in the first iteration of the FAVR study. †Neuropsychiatric data only available for healthy controls enrolled in FAVR. ‡Available for 45 CAA participants. §Available for 23 AD participants.
Table 2
CAA biomarker and CAA-SVD score distribution among CAA participants
| Characteristic | N or median [25th percentile, 75th percentile] | |
| cSS | 29 | |
| CMB | 21 [5, 51] | |
| CAA-SVD score (n = 40)* | 0 | 0 |
| 1 | 3 | |
| 2 | 7 | |
| 3 | 12 | |
| 4 | 10 | |
| 5 | 7 | |
| 6 | 1 | |
| Centrum semiovale EPVS category (n = 44)a | 0 | 1 |
| 1 | 16 | |
| 2 | 18 | |
| 3 | 8 | |
| 4 | 1 | |
| CAA Syndrome | ICH | 19 |
| Cognitive Symptoms | 12 | |
| TFNE | 17 |
cSS, cortical superficial siderosis; CMB, cerebral microbleeds; CAA-SVD, cerebral amyloid angiopathy-small vessel disease; EPVS, enlarged perivascular spaces; ICH, intracerebral hemorrhage; TFNE, transient focal neurological episodes. *Interpretable susceptibility weighted imaging was unavailable for some participants due to motion artifacts.
Cortical thickness comparison
Global cortical thickness was lowest in AD, intermediate in CAA, and highest in controls (p < 0.0001, Table 1). Thickness in the AD signature region also differed across groups (p < 0.0001, Table 1). Age and sex were significantly associated with cortical thickness in univariable analyses (Table 3), therefore they were entered into the multivariable model. Adjusting for age and sex and compared to the control group, thickness was lower in CAA (mean difference [MD] –0.047 mm, 95% confidence interval [CI] –0.088 to –0.005, p = 0.03) and AD participants (MD –0.143 mm, 95% CI –0.195 to –0.091, p < 0.0001). Results were unchanged when we excluded the 12 CAA participants with ICH (MD –0.048 mm, 95% CI –0.094 to –0.002, p = 0.04). The addition of scanner type as an additional variable did not have an effect on the results (MD from controls: CAA –0.051 mm, 95% CI –0.092 to –0.010, p = 0.02; AD –0.162 mm, 95% CI –0.215 to –0.108, p < 0.0001). In a multivariable model comparing only AD and CAA participants, AD participants had thinner cortex (MD –0.104 mm, 95% CI –0.165 to –0.043, p = 0.001). In the AD signature region, after adjusting for age and sex, thickness was lower in AD versus controls (MD –0.28 mm, 95% CI –0.35 to –0.21, p < 0.0001) and in CAA versus controls (MD –0.07 mm, 95% CI –0.13 to –0.01, p = 0.02). A separate multivariable analysis showed thinner cortex in the AD signature region in the AD group compared to the CAA group (MD –0.22mm, 95% CI –0.315 to –0.133, p < 0.0001). No difference was found in occipital lobe thickness between the three groups (p = 0.29, Table 1).
Table 3
Univariable analyses for global thickness
| Categorical Variable | N | Thickness | p |
| Sex | |||
| Male | 61 | 2.34±0.11 | |
| Female | 83 | 2.39±0.13 | 0.02 |
| Hypertension* | |||
| No | 83 | 2.36±0.14 | |
| Yes | 60 | 2.37±0.10 | 0.81 |
| Hypercholesterolemia* | |||
| No | 90 | 2.35±0.14 | |
| Yes | 53 | 2.39±0.10 | 0.10 |
| Diabetes* | |||
| No | 123 | 2.37±0.13 | |
| Yes | 20 | 2.34±0.11 | 0.35 |
| Smoker | |||
| No | 139 | 2.37±0.12 | |
| Yes | 5 | 2.28±0.12 | 0.13 |
| Scanner | |||
| GE Signa | 27 | 2.38±0.11 | |
| Discovery 750 | 117 | 2.36±0.13 | 0.63 |
| Scanning protocol | |||
| FAVR iteration 1 | 113 | 2.37±0.13 | |
| FAVR iteration 2 | 31 | 2.34±0.12 | 0.15 |
| Continuous Variable | N | r | p |
| Age | 144 | –0.23 | 0.006 |
| Education | 144 | –0.06 | 0.44 |
| eTIV | 144 | –0.009 | 0.92 |
GE, gradient echo; FAVR, functional assessment of vascular reactivity; eTIV, estimated total intracranial volume. Values presented as mean±standard deviation. *Information missing for one patient that withdrew from clinical visit.
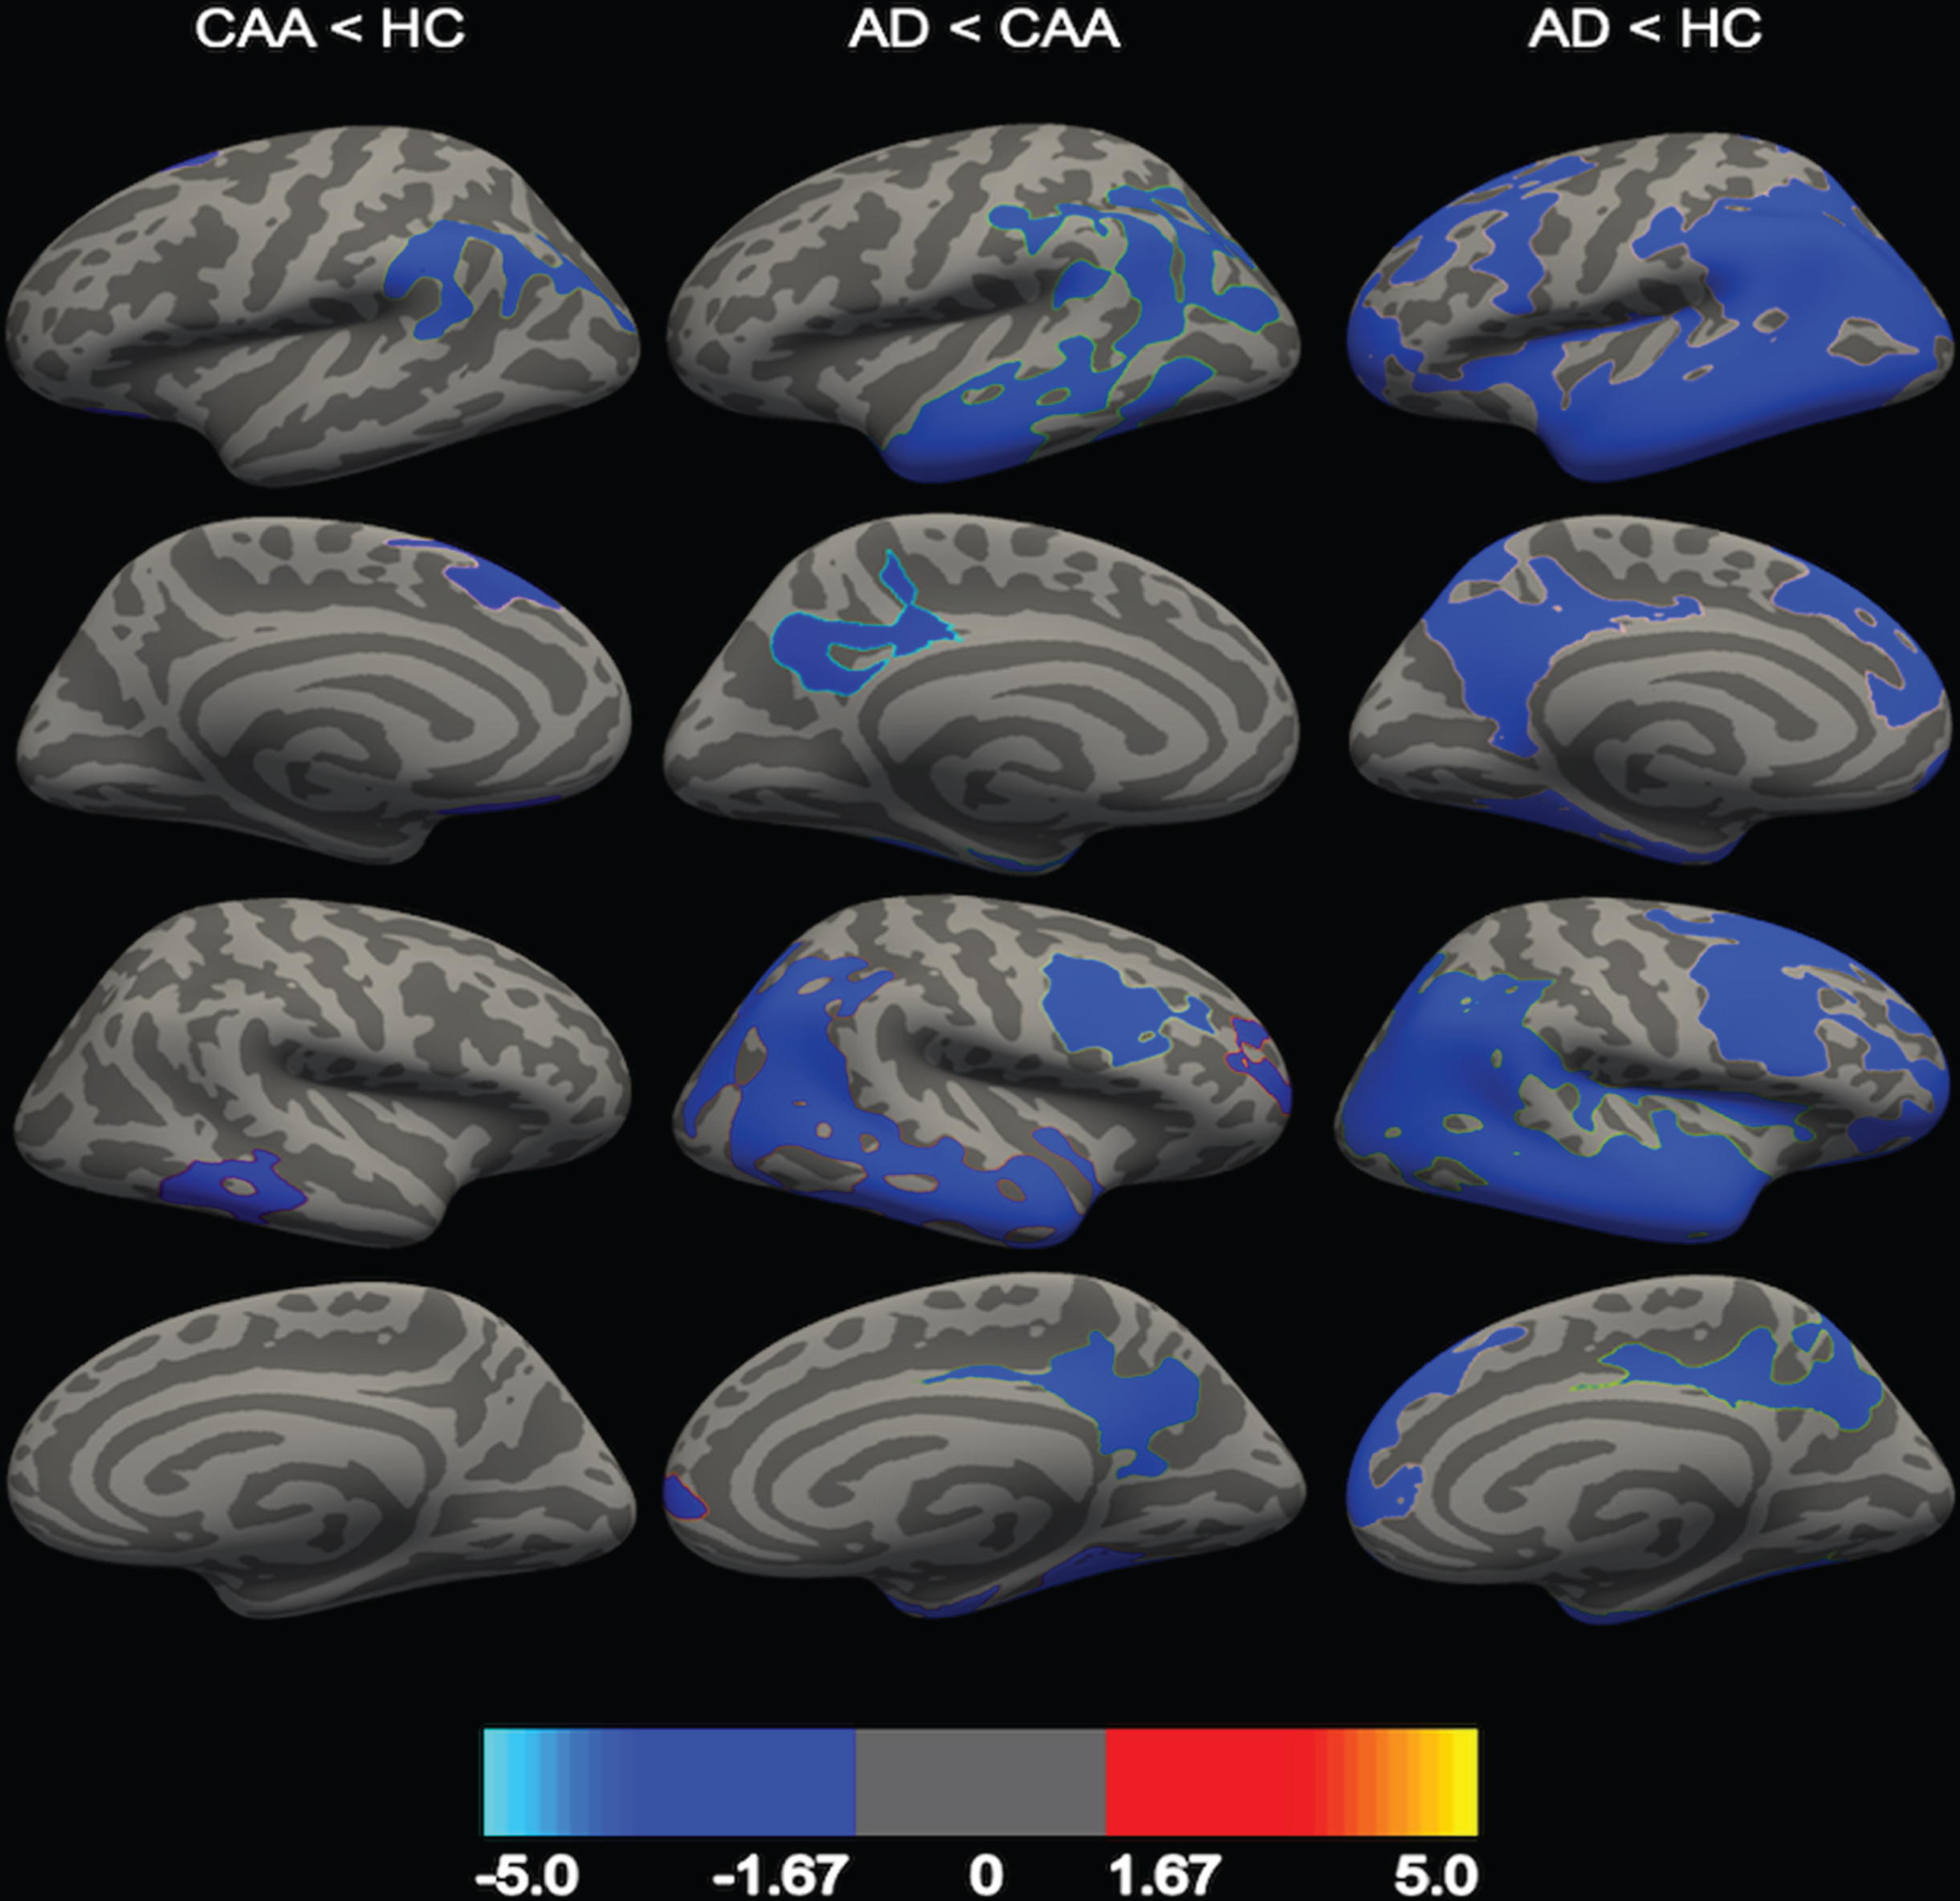
Regional comparisons are shown in Fig. 1. Compared to controls, CAA participants exhibited thinner cortex in the parietal (supramarginal), frontal (superior frontal and medial orbitofrontal), and temporal (inferior temporal) lobes. No regions were identified in which there was greater thickness in the CAA group compared to controls. Compared to CAA, AD participants had thinner cortex in frontal (caudal middle frontal and rostral middle frontal), occipital, parietal (inferior parietal and precuneus), and temporal lobes. No regions were identified in which AD participants had greater cortical thickness compared to the CAA group. Widespread clusters of thinner cortex were found in the AD group compared to healthy controls.
Fig. 1
Comparison in regional cortical thickness between AD, CAA, and healthy controls (HC). CAA participants had thinner cortex compared to HC (first column), and AD participants had thinner cortex compared to CAA (second column) and HC (third column). First row = left lateral view, second row = left medial view, third row = right lateral view, fourth row = right medial view. Clusters are represented at a corrected value of p < 0.05, with the color bar showing the logarithmic scale of p-values (-log10).
Associations of cortical thickness with cognition
Within the CAA group, thinner cortex was associated with lower z-scores in the memory domain (r = 0.35, p = 0.02), but not executive function (r = 0.12, p = 0.43) or processing speed (r = 0.02, p = 0.88). The association between thickness and memory remained significant after adjusting for sex and education (R2 = 0.10, p = 0.05). Thinner cortex in the AD signature region in the CAA group was even more closely associated with lower z-scores (r = 0.40, p = 0.006), an association that remained significant after additionally adjusting for sex and education (R2 = 0.26, p = 0.002). A similar association between thickness in the AD signature region and memory was also found in the AD group (R2 = 0.28, p = 0.01), but not the healthy control group (R2 = 0.10, p = 0.16), after adjusting for sex and education. As a sensitivity analysis, we tested whether the association of global thickness with memory in CAA differed between the old neuropsychological battery (37/48) and the new battery (11/48) but failed to find evidence of a difference (interaction p-value 0.51).
Associations of cortical thickness with CAA biomarkers
Higher WMH volume was associated with thinner cortex in univariable analysis (r = –0.33, p = 0.02) within CAA. This association remained after adjustment for age and sex (R2 = 0.09, p = 0.04). No associations were found between thickness and other CAA imaging biomarkers and characteristics (Table 2). No associations were found between BOLD visual response and occipital lobe thickness (r = 0.13, p = 0.44) or global thickness (r = 0.23, p = 0.17) within CAA.
DISCUSSION
In this study we found that cortical thickness in CAA was intermediate between healthy controls and AD participants and that thinner cortex was associated with higher WMH volume and lower memory scores in CAA participants. In an AD signature region (comprising entorhinal, fusiform, inferior parietal, inferior temporal, mid-temporal, and precuneus), CAA as well as AD participants had thinner cortex compared to controls.
Areas of thinner cortex in CAA compared to controls were found in the frontal, left parietal, and right temporal lobes. We also found thinner cerebral cortex in CAA patients in an AD signature region derived and validated in a previous study, based on the regions that are affected early on in AD-related cognitive disorders. This pattern of cortical thinness is consistent with the predilection for vascular amyloid deposition in more posterior brain regions. However, not all posterior regions were affected. We failed to find significantly thinner cortex in a pre-specified region of interest in the primary visual cortex, even though vascular amyloid is deposited there and we have previously found reduced BOLD activation in this region. Thus, there is an imperfect correlation between regions of amyloid deposition and regions of thinner cortex. The reasons for this are not entirely clear. The finding that cortex was thinner in the AD signature region suggests the possibility that co-morbid AD pathology [39], which is common in CAA even in persons without dementia, may be contributing in a synergistic manner to thinning of the cerebral cortex in persons with CAA.
We found that thinner cortex was associated with the memory cognitive domain but not with executive function or processing speed. This association with memory was even stronger when considering only the AD signature region. In our prior work [40], we showed that all three cognitive domains were affected in CAA, although compared to AD there was relatively greater impairment in executive function and processing speed in CAA. Therefore, the lack of association between cerebral cortex thinness and lower executive function and processing speed was somewhat unexpected. It is possible that the dysfunction in executive function and processing speed may be more related to subcortical white matter disconnection, microinfarction, the effects of prior ICH, and altered reactivity rather than cortical neurodegeneration.
Of the other CAA markers, we found that thinner cortex was associated with higher WMH volume. However, we failed to find associations with cerebral microbleed (CMB) count, CAA SVD score, or occipital BOLD activation. In another recently published study [12], we failed to find an association between cortical thinness and mean white matter diffusivity in a skeletonized white matter region of interest. The association with WMH is plausible because WMH has been associated with cerebral atrophy in general population studies. Mechanisms by which WMH could cause cerebral atrophy include axonal loss with secondary apoptosis of cerebral neurons [41], or it may be a surrogate for more widespread ischemic changes or low cerebral perfusion. Because WMH are much more widespread in CAA than AD, it also suggests that there are CAA-specific pathways of neurodegeneration and that not all neurodegeneration in persons with CAA is due to accompanying AD pathology.
Previous studies have found that thinning of the cerebral cortex is seen in most neurodegenerative diseases as well as in cerebral small disease in the general population [42]. Histopathologically, cortical thinning associated with advancing age corresponds to neuronal and dendritic shrinkage, as well as neuronal loss [43]. Alterations in genes expressed by pyramidal cells, astrocytes, and microglia underlie these changes, and also account for some of the cortical thinning seen in AD [44]. However, only a few studies have previously looked at cerebral cortical thickness or brain volumes in persons with CAA. A study of sporadic and hereditary Dutch-type CAA also found intermediate global cortical thinness in CAA between AD and controls, along with regional overlaps, similar to this study [7]. These findings, along with our own, are in contrast to a prior study with a higher number of patients with CAA with dementia, which found no average difference in thickness between CAA and AD [8]. These findings suggest that cortical thickness in CAA could be related to the stage of cognitive dysfunction. It is also possible that patients with CAA and dementia have a higher burden of co-morbid AD pathology, such that their cortical thickness is similar to patients with pure AD [7]. Additional factors that could contribute to cortical thinning and associated cognitive impairment in CAA, warranting additional future study, include the effects of cerebral microinfarcts [5], hemorrhagic lesions including cSS [45], impaired vascular reactivity [7], and neuronal apoptosis as a consequence of axonal damage from white matter lesions [41].
Strengths and limitations
A strength of our study is that we included a diverse and clinically representative cohort of people with CAA and AD, along with using a neuroimaging processing pipeline that is reliable across different scanner manufacturers [46]. Limitations included the use of different cognitive tests for CAA participants enrolled in the two different study iterations of FAVR, although we did not find an interaction effect or difference between the two different cognitive batteries. We also did not include measurements of Aβ distribution by positron emission tomography, which could have been used to determine whether amyloid deposits co-localized with thinner cortex. However, a limitation of using amyloid PET is that it does not discriminate well between vascular and parenchymal Aβ. In the CAA group, thinning was found in regions such as the medial frontal and temporal lobes, areas that have been found in amyloid imaging studies to contain high loads of vascular Aβ [47, 48]. Because a validated highly specific in vivo molecular biomarker of CAA does not exist, it is difficult to rule out the role of parenchymal AD pathology in the cortical thinness observed in CAA. The sample size was relatively small; however, the sample size was sufficient to reproduce known differences between AD and controls and the association of AD-associated atrophy with memory impairment.
CONCLUSIONS
This study suggests that CAA contributes to neurodegeneration in the form of thinner cerebral cortex, causing some of the memory impairment seen in CAA. This provides a potential mechanism by which CAA may cause cognitive decline in the absence of hemorrhagic stroke, as has been observed in community-based autopsy studies [49]. Some of the thinning may be attributable to WMH, but substantial overlap with regions affected by AD suggests that concomitant AD pathology may also be playing a role. Further research should further examine mechanisms of thinning of the cerebral cortex, and the prognostic significance of thinner cortex including whether it marks patients with a higher risk of future cognitive decline.
ACKNOWLEDGMENTS
The authors would like to thank Dr. Richard Frayne from the Department of Radiology, University of Calgary for graciously contributing data from the CNS. This study was supported by the Canadian Institutes of Health Research, Brain Canada, the Heart and Stroke Foundation of Canada, and the Alzheimer Society of Canada.
Authors’ disclosures available online (https://www.j-alz.com/manuscript-disclosures/21-0138r1).
SUPPLEMENTARY MATERIAL
[1] The supplementary material is available in the electronic version of this article: https://dx.doi.org/10.3233/JAD-210138.
REFERENCES
[1] | Vinters HV ((1987) ) Cerebral amyloid angiopathy a critical review. Stroke 18: , 311–324. |
[2] | Banerjee G , Carare R , Cordonnier C , Greenberg SM , Schneider JA , Smith EE , Van Buchem M , Van Der Grond J , Verbeek MM , Werring DJ ((2017) ) The increasing impact of cerebral amyloid angiopathy: Essential new insights for clinical practice. J Neurol Neurosurg Psychiatry 88: , 982–994. |
[3] | Smith EE , Greenberg SM ((2003) ) Clinical diagnosis of cerebral amyloid angiopathy: Validation of the boston criteria. Curr Atheroscler Rep 5: , 260–266. |
[4] | Biffi A , Greenberg SM ((2011) ) Cerebral amyloid angiopathy: A systematic review. J Clin Neurol 7: , 1–9. |
[5] | Xiong L , Van Veluw SJ , Bounemia N , Charidimou A , Pasi M , Boulouis G , Reijmer YD , Giese AK , Davidsdottir S , Fotiadis P , Valenti R , Riley G , Schwab K , Gurol EM , Biffi A , Greenberg SM , Viswanathan A ((2018) ) Cerebral cortical microinfarcts on magnetic resonance imaging and their association with cognition in cerebral amyloid angiopathy. Stroke 49: , 2330–2336. |
[6] | Xiong L , Boulouis G , Charidimou A , Roongpiboonsopit D , Jessel MJ , Pasi M , Reijmer YD , Fotiadis P , Ayres A , Merrill E , Schwab K , Blacker D , Gurol ME , Greenberg SM , Viswanathan A ((2018) ) Dementia incidence and predictors in cerebral amyloid angiopathy patients without intracerebral hemorrhage. J Cereb Blood Flow Metab 38: , 241–249. |
[7] | Fotiadis P , van Rooden S , van der Grond J , Schultz A , Martinez-Ramirez S , Auriel E , Reijmer Y , van Opstal AM , Ayres A , Schwab KM , Hedden T , Rosand J , Viswanathan A , Wermer M , Terwindt GM , Sperling RA , Polimeni JR , Johnson KA , van Buchem MA , Greenberg SM , Gurol ME ((2016) ) Cortical atrophy in patients with cerebral amyloid angiopathy: A case-control study.. Lancet Neurol 15: , 811–819. |
[8] | Kim J , Na HK , Shin J-H , Kim HJ , Seo SW , Seong J-K , Na DL ((2018) ) Atrophy patterns in cerebral amyloid angiopathy with and without cortical superficial siderosis. Neurology 90: , 1751–1758. |
[9] | Mak E , Su L , Williams GB , Watson R , Firbank MJ , Blamire AM , O’Brien JT ((2015) ) Progressive cortical thinning and subcortical atrophy in dementia with Lewy bodies and Alzheimer’s disease. Neurobiol Aging 36: , 1743–1750. |
[10] | Singh V , Chertkow H , Lerch JP , Evans AC , Dorr AE , Kabani NJ ((2006) ) Spatial patterns of cortical thinning in mild cognitive impairment and Alzheimer’s disease. Brain 129: , 2885–2893. |
[11] | Peca S , McCreary CR , Donaldson E , Kumarpillai G , Shobha N , Sanchez K , Charlton A , Steinback CD , Beaudin AE , Flück D , Pillay N , Fick GH , Poulin MJ , Frayne R , Goodyear BG , Smith EE ((2013) ) Neurovascular decoupling is associated with severity of cerebral amyloid angiopathy. Neurology 81: , 1659–1665. |
[12] | McCreary CR , Beaudin AE , Subotic A , Zwiers AM , Alvarez A , Charlton A , Goodyear BG , Frayne R , Smith EE ((2020) ) Cross-sectional and longitudinal differences in peak skeletonized white matter mean diffusivity in cerebral amyloid angiopathy. Neuroimage Clin 27: , 102280. |
[13] | Tsang A , Lebel CA , Bray SL , Goodyear BG , Hafeez M , Sotero RC , McCreary CR , Frayne R ((2017) ) White matter structural connectivity is not correlated to cortical resting-state functional connectivity over the healthy adult lifespan. Front Aging Neurosci 9: , 144. |
[14] | McCreary CR , Salluzzi M , Andersen LB , Gobbi D , Lauzon L , Saad F , Smith EE , Frayne R ((2020) ) Calgary Normative Study: Design of a prospective longitudinal study to characterise potential quantitative MR biomarkers of neurodegeneration over the adult lifespan. BMJ Open 10: , e038120. |
[15] | McKhannGM, KnopmanDS, ChertkowH, HymanBT, JackCR Jr. KawasCH, KlunkWE, KoroshetzWJ, ManlyJJ, MayeuxR, MohsRC, MorrisJC, RossorMN, ScheltensP, CarrilloMC, ThiesB, WeintraubS, PhelpsCH ((2011) ) The diagnosis of dementia due to Alzheimer’s disease: recommendations from the National Institute on Aging-Alzheimer’s Association workgroups on diagnostic guidelines for Alzheimer’s disease. Alzheimers Dement 7: , 263–269. |
[16] | Dale AM , Fischl B , Sereno MI ((1999) ) Cortical surface-based analysis: I. Segmentation and surface reconstruction. Neuroimage 9: , 179–194. |
[17] | Fischl B , Dale AM ((2000) ) Measuring the thickness of the human cerebral cortex from magnetic resonance images. Proc Natl Acad Sci U S A 97: , 11050–11055. |
[18] | Desikan RS , Ségonne F , Fischl B , Quinn BT , Dickerson BC , Blacker D , Buckner RL , Dale AM , Maguire RP , Hyman BT , Albert MS , Killiany RJ ((2006) ) An automated labeling system for subdividing the human cerebral cortex on MRI scans into gyral based regions of interest. Neuroimage 31: , 968–980. |
[19] | Kosior JC , Idris S , Dowlatshahi D , Alzawahmah M , Eesa M , Sharma P , Tymchuk S , Hill MD , Aviv RI , Frayne R , Demchuk AM ((2011) ) Quantomo: Validation of a computer-assisted methodology for the volumetric analysis of intracerebral haemorrhage. Int J Stroke 6: , 302–305. |
[20] | Wardlaw JM , Smith EE , Biessels GJ , Cordonnier C , Fazekas F , Frayne R , Lindley RI , O’Brien JT , Barkhof F , Benavente OR , Black SE , Brayne C , Breteler M , Chabriat H , DeCarli C , de Leeuw FE , Doubal F , Duering M , Fox NC , Greenberg S , Hachinski V , Kilimann I , Mok V , Oostenbrugge R van , Pantoni L , Speck O , Stephan BCM , Teipel S , Viswanathan A , Werring D , Chen C , Smith C , van Buchem M , Norrving B , Gorelick PB , Dichgans M ((2013) ) Neuroimaging standards for research into small vessel disease and its contribution to ageing and neurodegeneration. Lancet Neurol 12: , 822–838. |
[21] | Greenberg SM , Vernooij MW , Cordonnier C , Viswanathan A , Al-Shahi Salman R , Warach S , Launer LJ , Van Buchem MA , Breteler MM ((2009) ) Cerebral microbleeds: A guide to detection and interpretation. Lancet Neurol 8: , 165–174. |
[22] | Sperling RA , Jack CR , Black SE , Frosch MP , Greenberg SM , Hyman BT , Scheltens P , Carrillo MC , Thies W , Bednar MM , Black RS , Brashear HR , Grundman M , Siemers ER , Feldman HH , Schindler RJ ((2011) ) Amyloid-related imaging abnormalities in amyloid-modifying therapeutic trials: Recommendations from the Alzheimer’s Association Research Roundtable Workgroup. Alzheimers Dement 7: , 367–385. |
[23] | Auriel E , Charidimou A , Edip Gurol M , Ni J , Van Etten ES , Martinez-Ramirez S , Boulouis G , Piazza F , Di Francesco JC , Frosch MP , Pontes-Neto OM , Shoamanesh A , Reijmer Y , Vashkevich A , Ayres AM , Schwab KM , Viswanathan A , Greenberg SM ((2016) ) Validation of clinicoradiological criteria for the diagnosis of cerebral amyloid angiopathy-related inflammation. JAMA Neurol 73: , 197–202. |
[24] | Charidimou A , Boulouis G , Pasi M , Auriel E , Van Etten ES , Haley K , Ayres A , Schwab KM , Martinez-Ramirez S , Goldstein JN , Rosand J , Viswanathan A , Greenberg SM , Gurol ME ((2017) ) MRI-visible perivascular spaces in cerebral amyloid angiopathy and hypertensive arteriopathy. Neurology 88: , 1157–1164. |
[25] | Charidimou A , Martinez-Ramirez S , Reijmer YD , Oliveira-Filho J , Lauer A , Roongpiboonsopit D , Frosch M , Vashkevich A , Ayres A , Rosand J , Gurol ME , Greenberg SM , Viswanathan A ((2016) ) Total magnetic resonance imaging burden of small vessel disease in cerebral amyloid angiopathy an imaging-pathologic study of concept validation. JAMA Neurol 73: , 994–1001. |
[26] | Hachinski V , Iadecola C , Petersen RC , Breteler MM , Nyenhuis DL , Black SE , Powers WJ , DeCarli C , Merino JG , Kalaria RN , Vinters H V. , Holtzman DM , Rosenberg GA , Dichgans M , Marler JR , Leblanc GG ((2006) ) National Institute of Neurological Disorders and Stroke-Canadian Stroke Network vascular cognitive impairment harmonization standards. Stroke 37: , 2220–2241. |
[27] | Chertkow H , Borrie M , Whitehead V , Black SE , Feldman HH , Gauthier S , Hogan DB , Masellis M , McGilton K , Rockwood K , Tierney MC , Andrew M , Hsiung G-YR , Camicioli R , Smith EE , Fogarty J , Lindsay J , Best S , Evans A , Das S , Mohaddes Z , Pilon R , Poirier J , Phillips NA , MacNamara E , Dixon RA , Duchesne S , MacKenzie I , Rylett RJ ((2019) ) The comprehensive assessment of neurodegeneration and dementia: Canadian Cohort Study. Can J Neurol Sci 46: , 499–511. |
[28] | Delis DC , Kramer JH , Kaplan E , Ober BA ((2000) ) California Verbal Learning Test - Second Edition (CVLT-II). Psychological Corporation, San Antonio, TX. |
[29] | Shin MS , Park SY , Park SR , Seol SH , Kwon JS ((2006) ) Clinical and empirical applications of the Rey-Osterrieth Complex Figure Test. Nat Protoc 1: , 892–899. |
[30] | Schoenberg MR , Dawson KA , Duff K , Patton D , Scott JG , Adams RL ((2006) ) Test performance and classification statistics for the Rey Auditory Verbal Learning Test in selected clinical samples. Arch Clin Neuropsychol 21: , 693–703. |
[31] | Tam JW , Schmitter-Edgecombe M ((2013) ) The role of processing speed in the brief visuospatial memory test - Revised. Clin Neuropsychol 27: , 962–972. |
[32] | Reitan RM ((1958) ) Validity of the Trail Making Test as an indicator of organic brain damage. Percept Mot Skills 8: , 271–276. |
[33] | Benton A , Hamsher K ((1983) ) Multilingual Aphasia Examinationle, Dept. of Neurology and Psychology, University of Iowa. |
[34] | Homack S , Lee D , Riccio CA ((2005) ) Test review: Delis-Kaplan executive function system. J Clin Exp Neuropsychol 27: , 599–609. |
[35] | Joy S , Kaplan E , Fein D ((2004) ) Speed and memory in the WAIS-III Digit Symbol - Coding subtest across the adult lifespan. Arch Clin Neuropsychol 19: , 759–767. |
[36] | Wechsler D ((2008) ) Wechsler adult intelligence scale-Fourth Edition (WAIS-IV), San Antonio. |
[37] | Schwarz CG , Gunter JL , Wiste HJ , Przybelski SA , Weigand SD , Ward CP , Senjem ML , Vemuri P , Murray ME , Dickson DW , Parisi JE , Kantarci K , Weiner MW , Petersen RC , Jack CR ((2016) ) A large-scale comparison of cortical thickness and volume methods for measuring Alzheimer’s disease severity. Neuroimage Clin 11: , 802–812. |
[38] | Hayasaka S , Nichols TE ((2003) ) Validating cluster size inference: Random field and permutation methods. Neuroimage 20: , 2343–2356. |
[39] | Greenberg SM , Bacskai BJ , Hernandez-Guillamon M , Pruzin J , Sperling R , van Veluw SJ ((2020) ) Cerebral amyloid angiopathy and Alzheimer disease —one peptide, two pathways. Nat Rev Neurol 16: , 30–42. |
[40] | Case NF , Charlton A , Zwiers A , Batool S , McCreary CR , Hogan DB , Ismail Z , Zerna C , Coutts SB , Frayne R , Goodyear B , Haffenden A , Smith EE ((2016) ) Cerebral amyloid angiopathy is associated with executive dysfunction and mild cognitive impairment. Stroke 47: , 2010–2016. |
[41] | Duering M , Righart R , Wollenweber FA , Zietemann V , Gesierich B , Dichgans M ((2015) ) Acute infarcts cause focal thinning in remote cortex via degeneration of connecting fiber tracts. Neurology 84: , 1685–1692. |
[42] | De Guio F , Duering M , Fazekas F , De Leeuw FE , Greenberg SM , Pantoni L , Aghetti A , Smith EE , Wardlaw J , Jouvent E ((2020) ) Brain atrophy in cerebral small vessel diseases: Extent, consequences, technical limitations and perspectives: The HARNESS initiative. J Cereb Blood Flow Metab 40: , 231–245. |
[43] | Peters A , Sethares C ((2002) ) The effects of age on the cells in layer 1 of primate cerebral cortex.. Cereb Cortex 12: , 27–36. |
[44] | Vidal-Pineiro D , Parker N , Shin J , French L , Grydeland H , Jackowski AP , Mowinckel AM , Patel Y , Pausova Z , Salum G , Sørensen Ø , Walhovd KB , Paus T , Fjell AM ((2020) ) Cellular correlates of cortical thinning throughout the lifespan. Sci Rep 10: , 21803. |
[45] | Jang YK , Kim HJ , Lee JS , Kim YJ , Kim KW , Kim Y , Jang H , Lee J , Lee JM , Kim SJ , Yu KH , Charidimou A , Werring DJ , Kim ST , Na DL , Seo SW ((2017) ) Distinctive clinical effects of haemorrhagic markers in cerebral amyloid angiopathy. Sci Rep 7: , 15984. |
[46] | Han X , Jovicich J , Salat D , van der Kouwe A , Quinn B , Czanner S , Busa E , Pacheco J , Albert M , Killiany R , Maguire P , Rosas D , Makris N , Dale A , Dickerson B , Fischl B ((2006) ) Reliability of MRI-derived measurements of human cerebral cortical thickness: The effects of field strength, scanner upgrade and manufacturer. Neuroimage 32: , 180–194. |
[47] | Johnson KA , Gregas M , Becker JA , Kinnecom C , Salat DH , Moran EK , Smith EE , Rosand J , Rentz DM , Klunk WE , Mathis CA , Price JC , DeKosky ST , Fischman AJ , Greenberg SM ((2007) ) Imaging of amyloid burden and distribution in cerebral amyloid angiopathy.. Ann Neurol 62: , 229–234. |
[48] | Greenberg SM , Grabowski T , Gurol ME , Skehan ME , Nandigam RNK , Becker JA , Garcia-Alloza M , Prada C , Frosch MP , Rosand J , Viswanathan A , Smith EE , Johnson KA ((2008) ) Detection of isolated cerebrovascular β-amyloid with Pittsburgh compound B. Ann Neurol 64: , 587–591. |
[49] | Boyle PA , Yu L , Nag S , Leurgans S , Wilson RS , Bennett DA , Schneider JA ((2015) ) Cerebral amyloid angiopathy and cognitive outcomes in community-based older persons. Neurology 85: , 1930–1936. |

