
Development and Validation of a High Sensitivity Assay for Measuring p217 + tau in Cerebrospinal Fluid
Abstract
Background:
Early and accurate detection and staging is critical to managing Alzheimer’s disease (AD) and supporting clinical trials. Cerebrospinal fluid (CSF) biomarkers for amyloid-β peptides, tau species, and various neurodegenerative and inflammatory analytes are leading the way in this regard, yet there is room for improved sensitivity and specificity. In particular tau is known to be present in many different fragments, conformations, and post-translationally modified forms. While the exact tau species that might best reflect AD pathology is unknown, a growing body of evidence suggests that forms with high levels of phosphorylation in the mid-region may be especially enriched in AD.
Objective:
Develop an assay for measuring p217tau in CSF.
Methods:
Here we describe the development and validation of a novel sELISA for measuring CSF tau species containing phosphorylation at threonines 212 & 217, aka p217 + tau, using the PT3 antibody.
Results:
While the analyte is present at extremely low levels the assay is sufficiently sensitive and specific to quantitate p217 + tau with excellent precision, accuracy, and dilution linearity, allowing good differentiation between diagnostic subgroups. The p217 + tau measurements appear to track AD pathology better than the commonly used p181tau epitope, suggesting superior diagnostic and staging performance. Finally, the assay can also be configured to differentiate antibody-bound versus antibody-free tau, and therefore can be used to measure target engagement by p217 + tau-targeting immunotherapeutics.
Conclusion:
The assay for measuring p217 + tau described here is highly sensitive, accurate, precise, dilution linear, and shows good potential for identifying and staging AD.
INTRODUCTION
Over 6 million people in the United States are living with neurodegenerative disorders such as Alzheimer’s disease (AD), and the number is growing with an aging population. In fact, 10% of people over age 65 have AD, and it is the 5th leading cause of death in this population [1, 2]. Early detection and appropriate staging are considered critical to potential treatment, yet identifying pre-symptomatic AD patients for clinical trials is challenging.
Cerebrospinal fluid (CSF) assays can detect amyloid change up to 20 years before symptoms, which has led to the A-T-N research framework for diagnosing and staging AD based on amyloid, tau and neurodegeneration measurements [3]. Tau positron emission tomography (PET) is becoming the gold standard for staging and predicting the rate of cognitive decline [4–6], yet has not been approved by regulatory agencies and global manufacturing of the radiotracers could be challenging. In biofluids, CSF tau, and specifically p-tau, and neurofilament light chain are believed to be the most relevant measurements for staging and may complement tau PET [7, 8].
The main pathological manifestation of tau, neurofibrillary tangles, are aggregates of hyperphosphorylated tau protein, and phosphorylation at different sites may be related to disease staging [9]. Tau has >30 potential phosphorylation sites, and it is not clear which epitope might be the most reflective of disease stage [10]. The traditional site studied is p181tau, yet the current assays show only a modest dynamic range (concentration in healthy controls (HC) to AD dementia are only 3–5× different), weak sensitivity, and do not show p181tau elevation until some years after Amyloid PET levels begin to increase [11–13]. Recent mass spectrometry (MS)-based methods to scan tau phosphorylation intensity across the AD spectrum have suggested other sites (e.g., T217) may be further upregulated in disease [14–17]. These MS methods have proved invaluable for profiling tau modifications however are not easily translated into transferrable and scalable assays that could be used globally, such as ELISA.
Here we describe a novel method for measuring tau phosphorylated at amino acid T212, T217, and surrounding residues (“p217 + tau”), that shows potential as an improved CSF-based p-tau assay, which may be useful for staging. The method relies on the high affinity and specificity of the p217 + tau targeted monoclonal antibody (mAb) PT3, described in Van Kolen et al., 2020 [18], paired with either HT43 (anti-N-terminal tau) or PT82 (anti-mid-region tau) mAbs on the Simoa HD-1 platform. These assays show greater differentiation of HC versus AD than traditional tau assays, modest correlation with cognition, and can be combined with a denaturing technique to use as p217 + tau immunotherapy target engagement biomarkers. The work presented here confirms that p217 is a tau epitope of particular relevance in AD, and offers a transferrable, sensitive, and quantitative method for its measurement in CSF.
MATERIALS AND METHODS
Human biosamples
All CSF samples were collected from Janssen clinical trials with informed consent for use in study and development of biomarker assays for AD. Study 54861911ALZ1005/2002 was used for Fig. 4 data; cohort demographics are shown in Supplementary Table 1. Study ELN115727301/302 was used for Figs. 5, 6F, and 7B–D data; cohort demographics are shown in Supplementary Table 2. Study 54861911ALZ2003 was used for Fig. 6A–E data; cohort demographics are shown in Supplementary Table 3. Study AAB-001-201 was used for Fig. 7A data; cohort demographics are shown in Supplementary Table 4. All CSF samples were from lumbar collections, and stored in 0.5 mL polypropylene tubes at –80°C until use. AD frontal cortex, dissected from whole brain within 48 h of death (stored at 4°C until dissection), was obtained from Anatomy Gifts Registry (Hanover, MD) with informed consent for use in study and development of biomarker assays for AD.
ELISA reagents
PT3 (JRD/PT/3), HT43 (JRD/hTau/43), PT82 (JRD/PT/82), Janssen A, and Janssen B monoclonal antibodies (mAbs) were obtained from Janssen R&D (Springhouse, PA). Calibrant peptides for use in the Janssen p217 + tau and total tau (t-tau) assays were produced by New England Peptides (Gardner, MA) (Fig. 1B). All Simoa homebrew reagents, detection antibody from Quanterix t-tau kit (for comparison in Fig. 1A), and HD-1 instrument were obtained from Quanterix (Billerica, MA). HT7 (cat#MN1000) and BT2 (cat#MN1010) (both directed to tTau mid-region) were obtained from Thermo Fisher. Innotest t-tau (hTauAG), Innotest p181tau, Innotest Aβ42, and Innotest Aβ40 kits were obtained from Fujirebio (Malvern, PA) with measurements performed at Janssen R&D, San Diego with exception of the Innotest Aβ42 and Aβ40 measurements in Figs. 4 and 6A–E performed at University of Sahlgrenska.
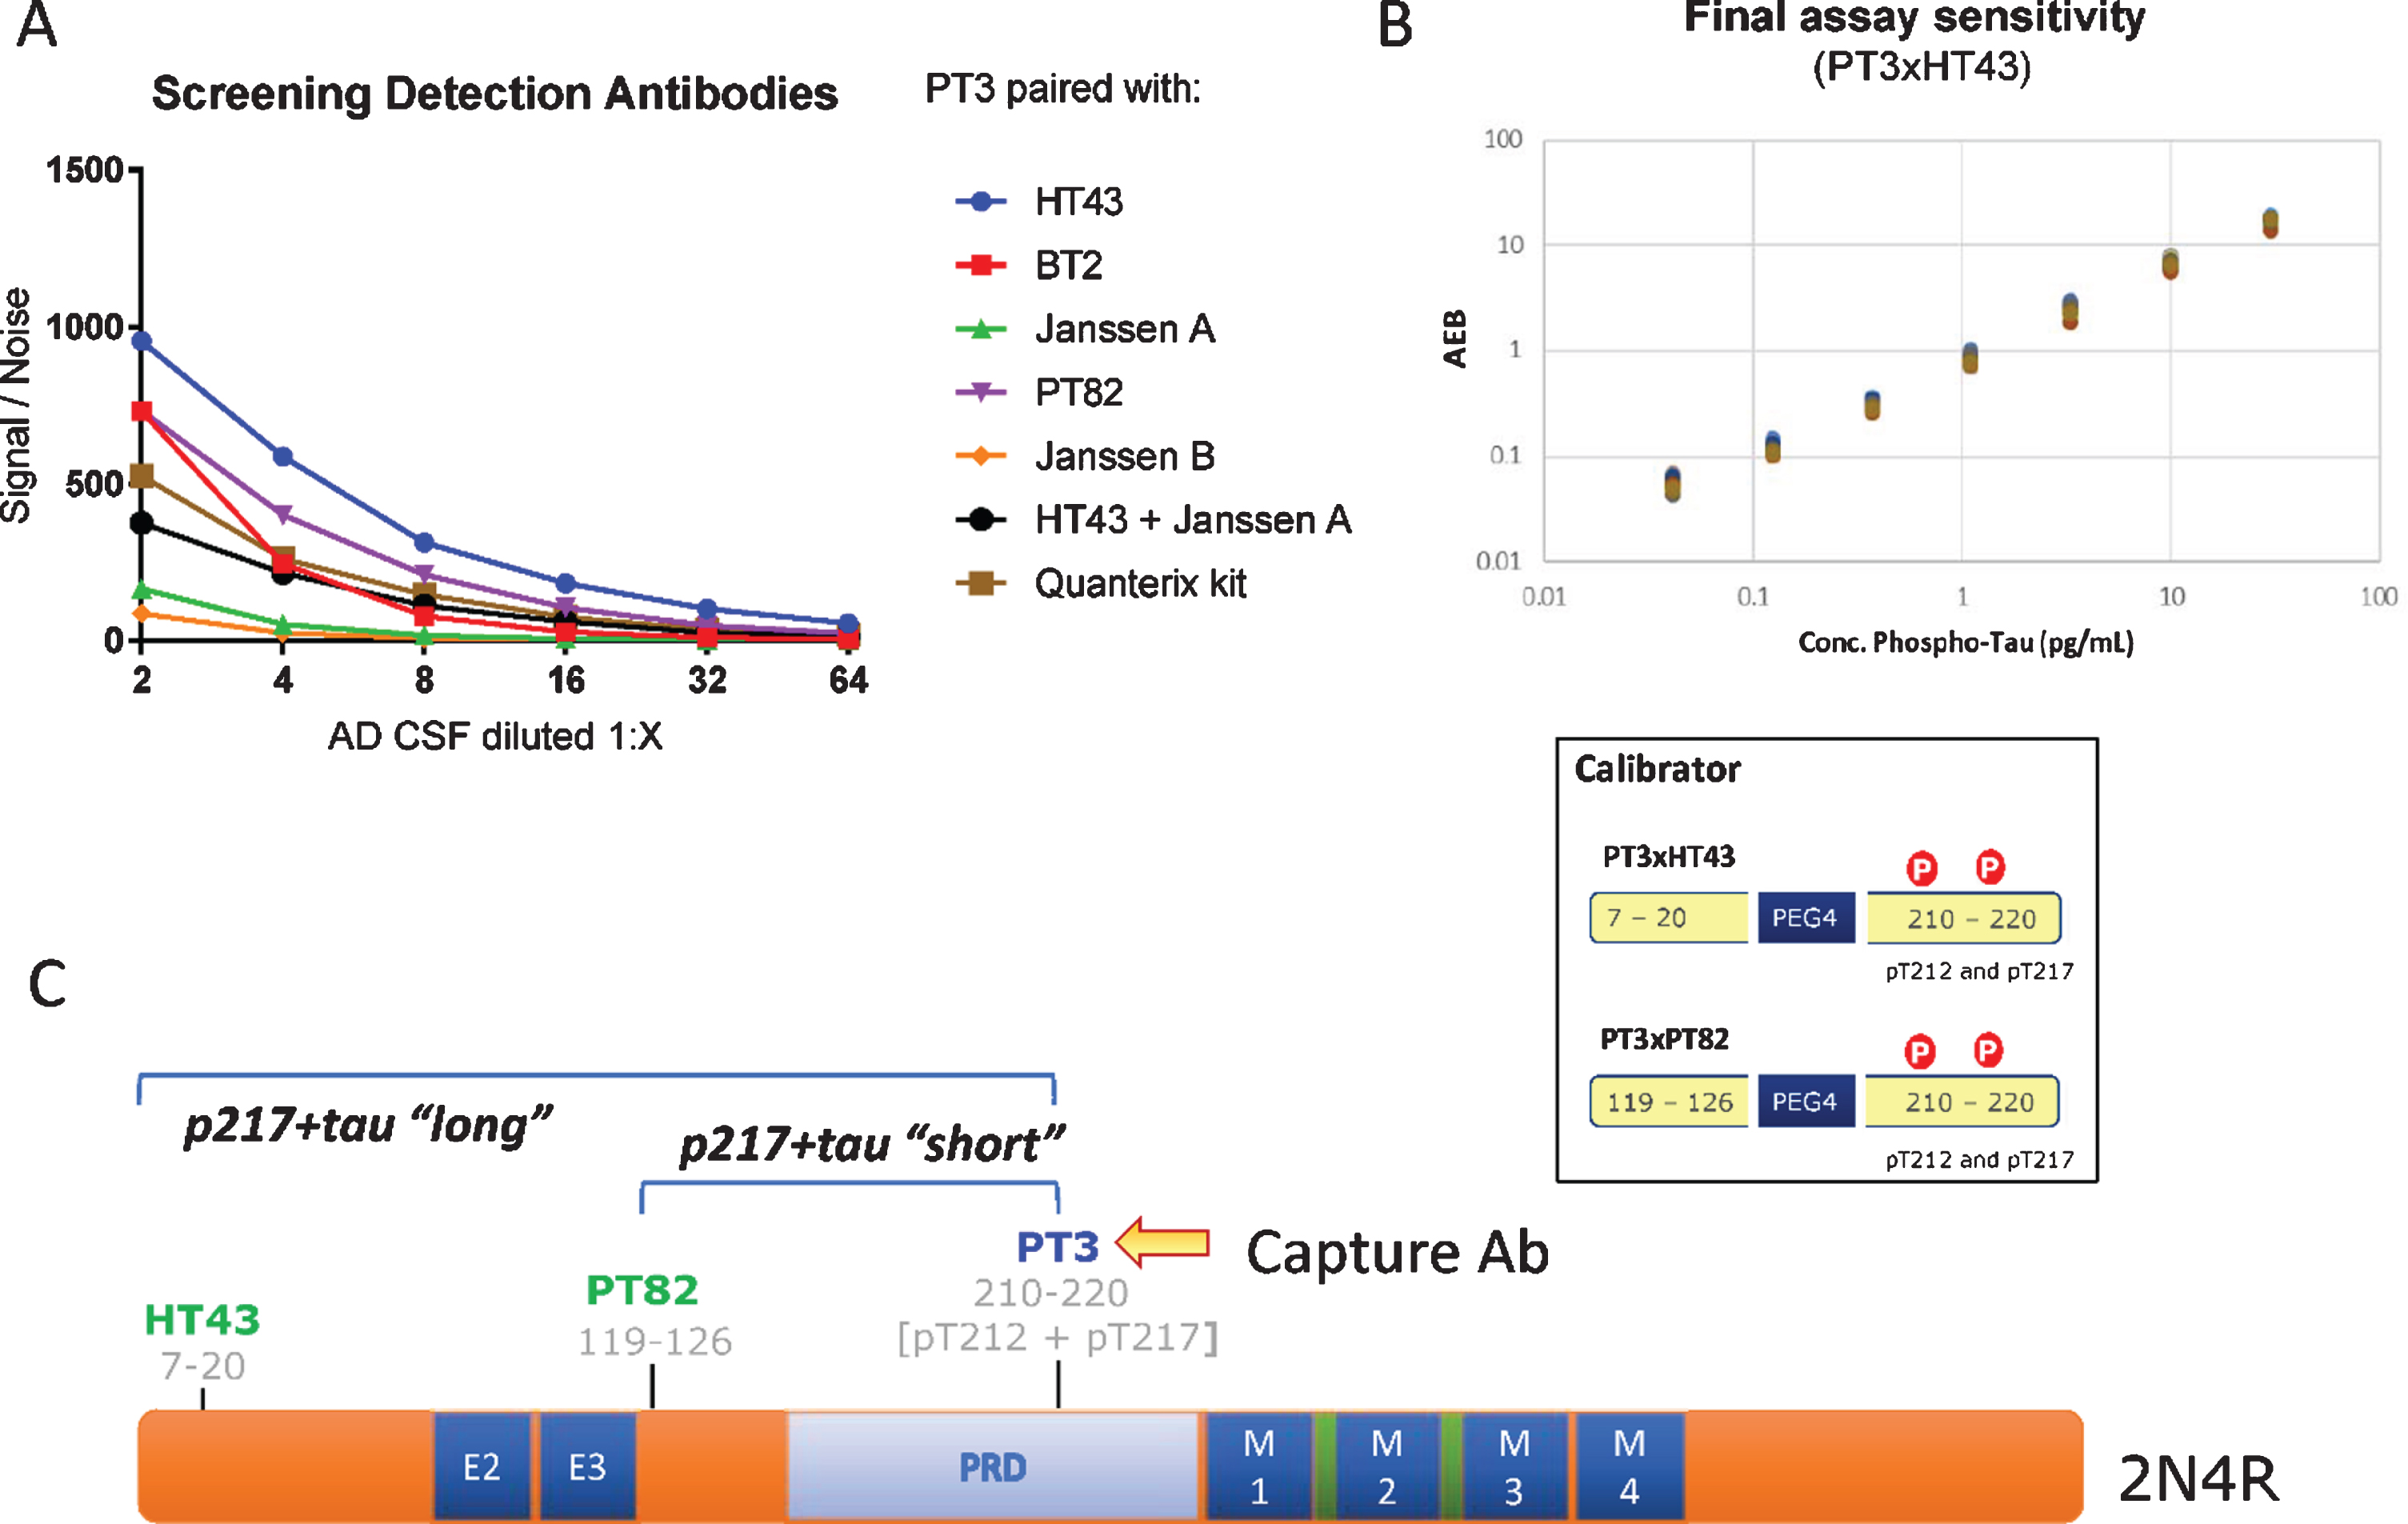
Fig. 1
CSF p217 + tau assay design. A) Various detection antibodies were paired with PT3 (as capture agent) in Simoa HD-1 platform, using AD CSF as analyte. B) PT3 gave the strongest signal/noise when paired with HT43 or PT82. These assays were optimized and specific calibrant peptides were synthesized (bottom). Standard curves for these assays were then run from 30 to 0.04 pg/ml, revealing LLOD of 2 fg/ml and LLOQ of 40 fg/ml in the PT3×HT43 assay. C) Schematic of the epitopes probed in the p217 + tau assays.
Biochemical reagents
The dephosphorylation experiment (Fig. 2F) used alkaline phosphatase obtained from Sigma (cat#524545, St. Louis, MO) and was used with the following 10× buffer (500 mM Tris HCl (pH 7.5), 1 mM EDTA, 50 mM DTT, 0.1% Brig 35, 20 mM MnCl2). Recombinant Tau protein (full length) used in HPLC fractionation experiments (Fig. 3C) was obtained from rPeptide (cat#T-1101-1, Watkinsville, GA).
Fig. 2
Technical Validation of CSF p217 + tau assays. A) Serial dilution of a pool of low tau human CSF was measured with both p217 + tau assays; dilution corrected concentrations are shown. The minimum required dilution was established as 1:8. B) A panel of HC CSF samples (n = 53) were measured with PT3×PT82 assay at 1:8 dilution, revealing all signal in linear range (pink box = CSF signal intensity relative to standard curve range). C) An 8-point calibrant curve was prepared then measured with the PT3×HT43 assay on three separate days, revealing good inter-test precision. D) An AD CSF pool was serially diluted then measured at two sites with the PT3×HT43 assay, revealing good inter-site precision. E) An AD CSF pool was treated with indicated amounts of alkaline phosphatase then measured with both p217 + tau assays and the t-tau assay revealing phosphorylation dependency of the p217 + tau assays. F) An AD CSF pool was stored at 4°C, 22°C, or 37°C for 1, 2, or 4 h then measured with the PT3×HT43 assay. In parallel, samples were freeze thawed 1 or 2 additional times and tested similarly. G) CSF was collected from 4 donors, aliquoted and stored at –70°C and measured every three months. In all stability studies the PT3×PT82 signal was preserved. AEB, raw signal in Simoa assay. S/N, signal/noise.
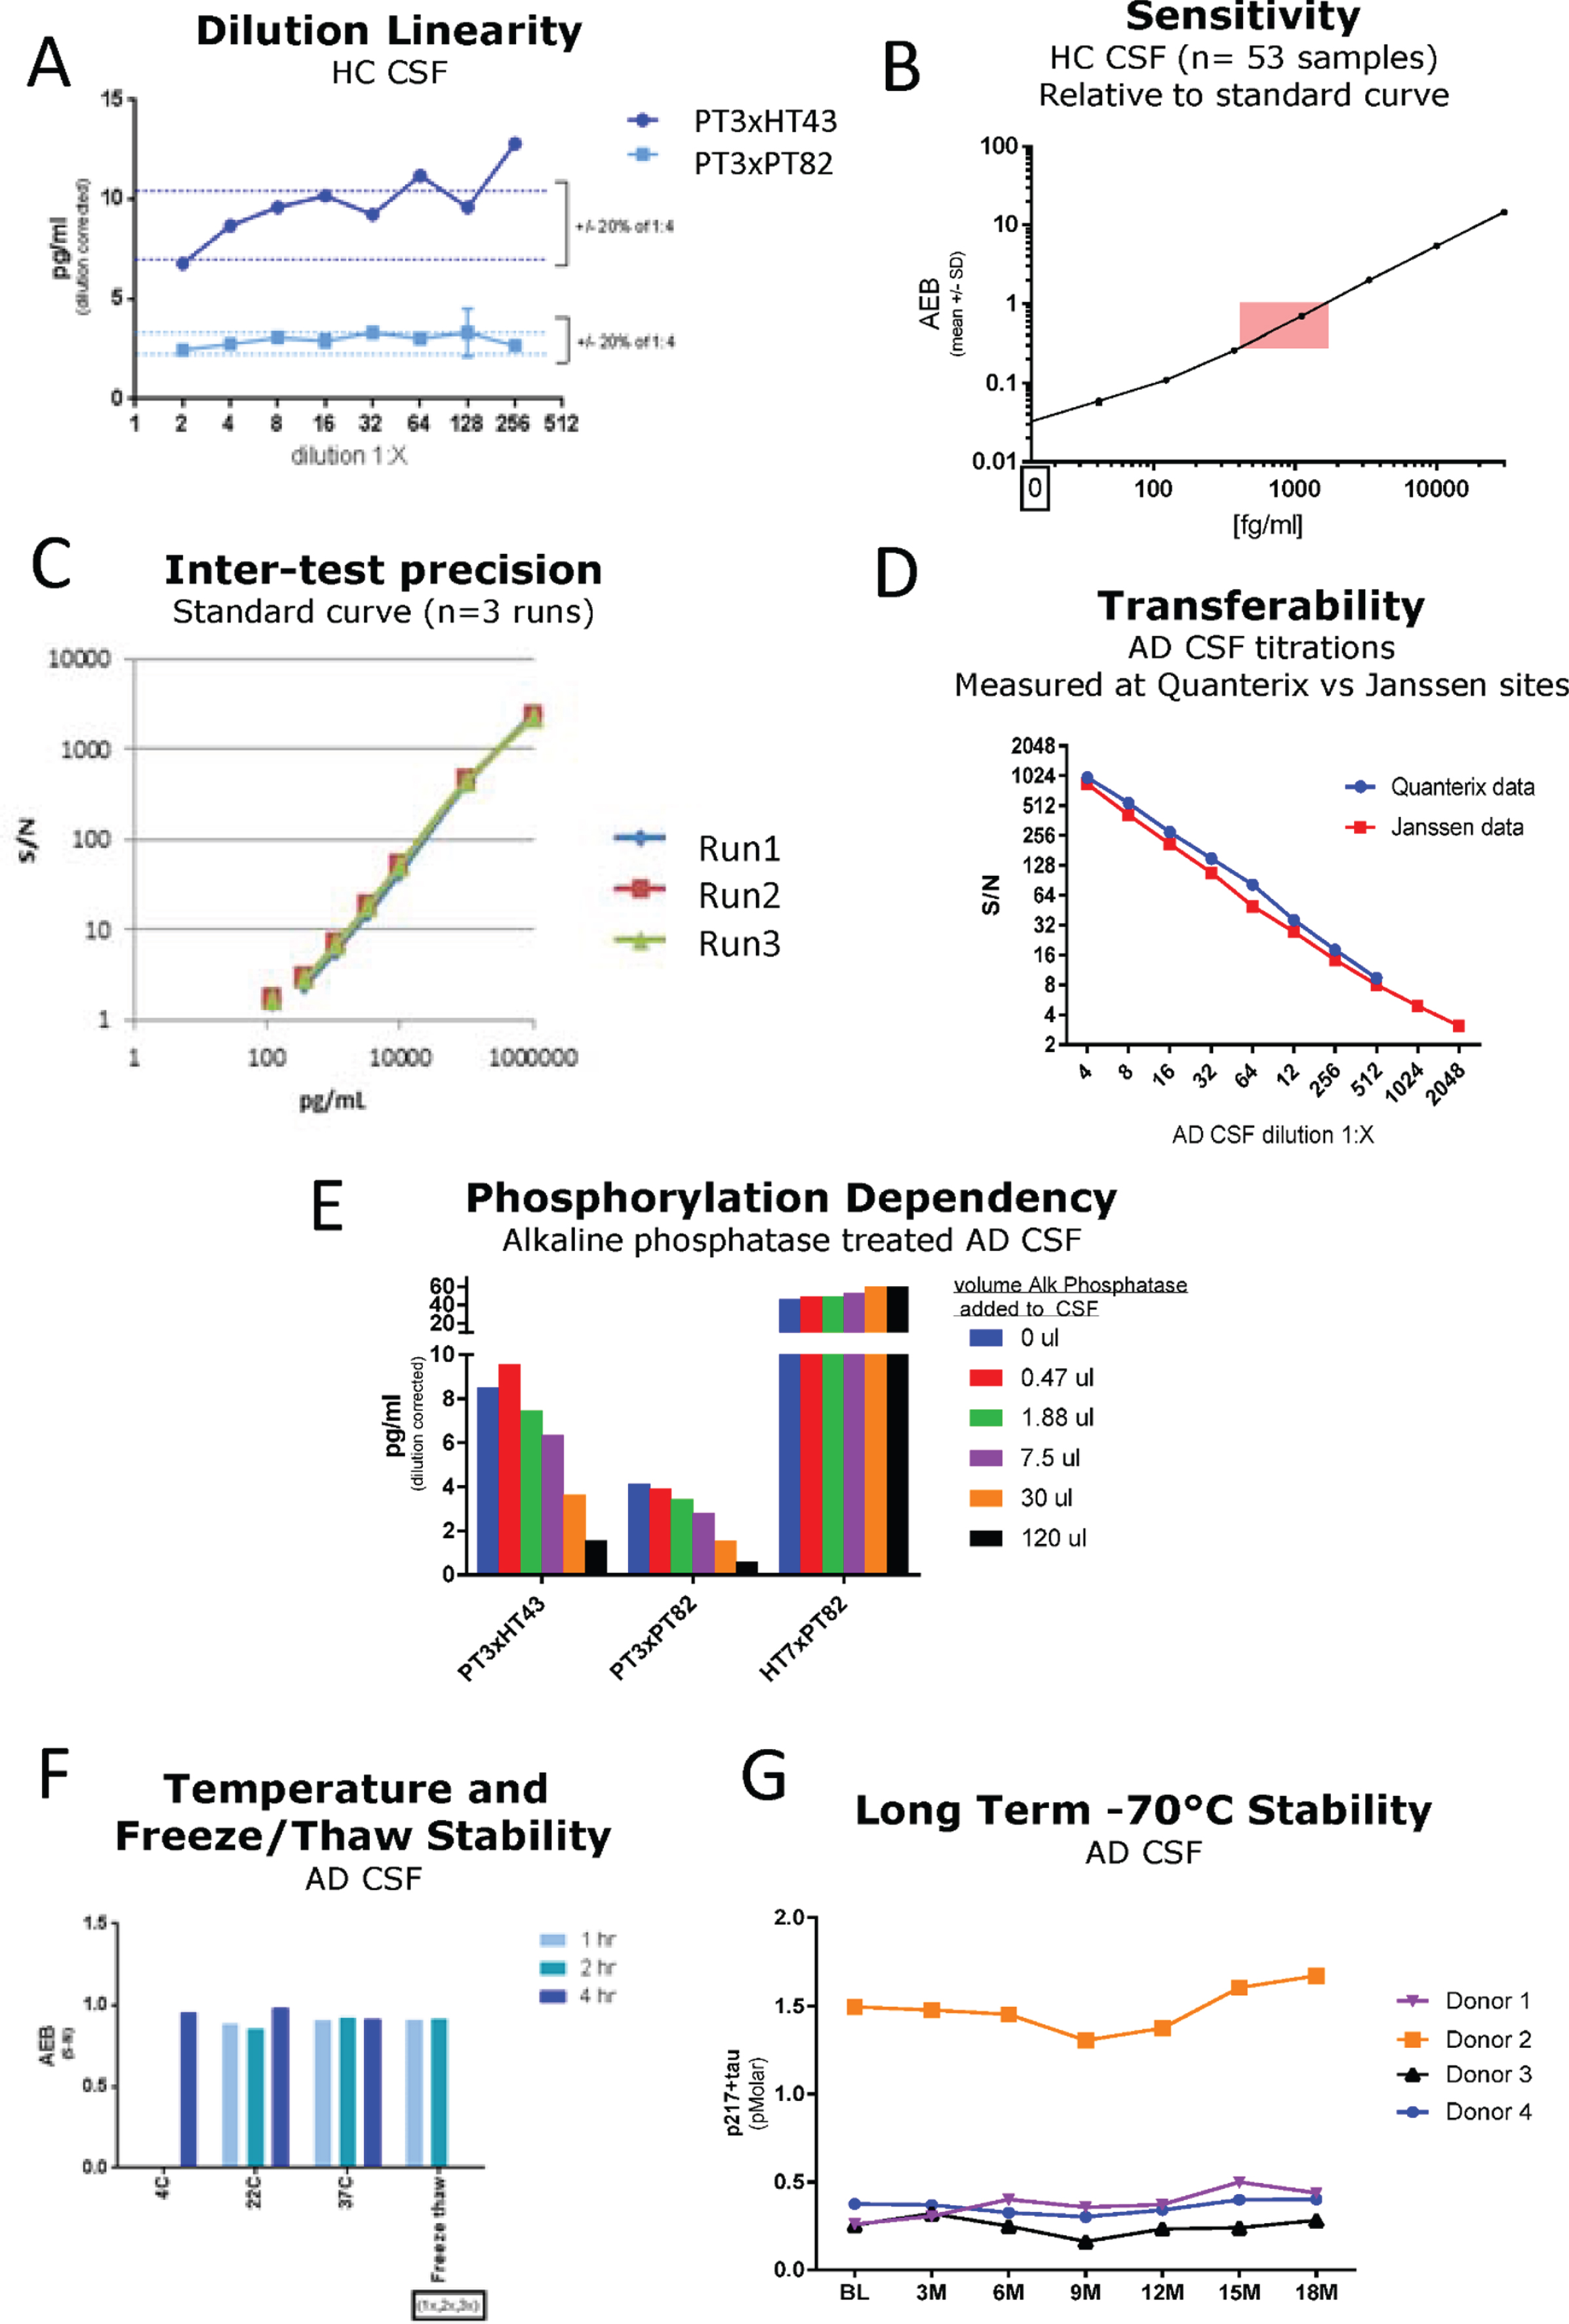
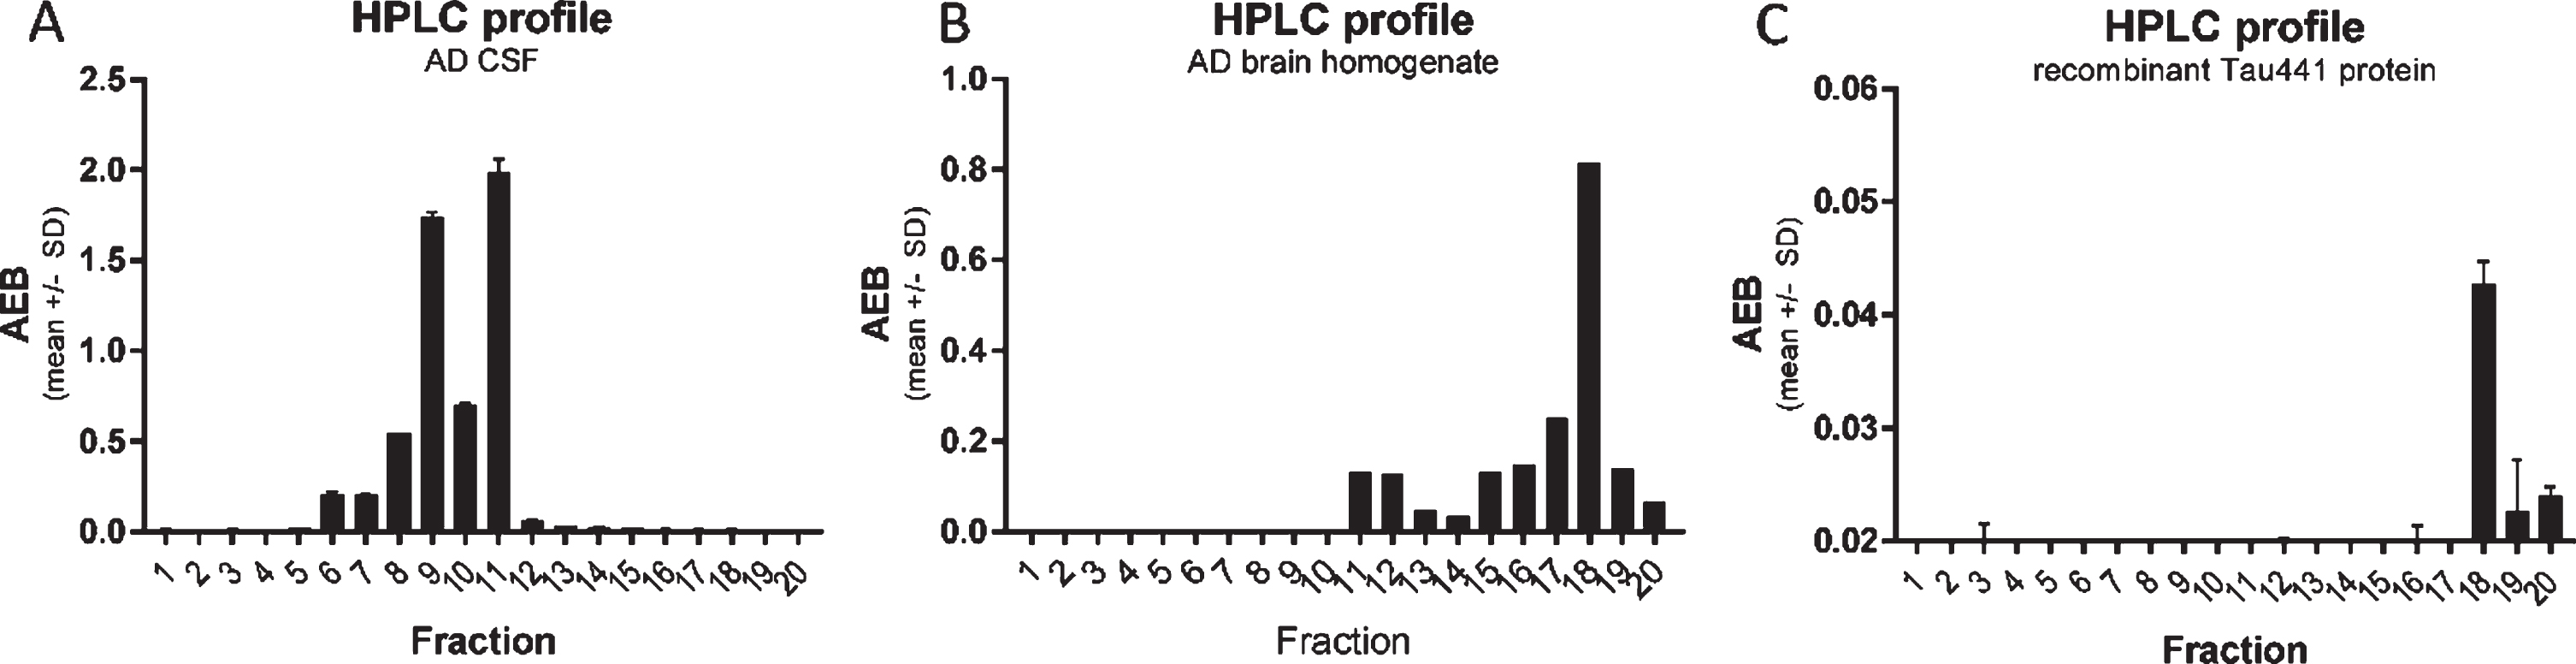
Fig. 3
CSF p217 + tau is present on multiple fragments, but not full-length material. A) A pool of AD CSF was fractionated by rpHPLC and each fraction was then measured with the p217 + tau short assay (PT3×PT82), revealing two major peaks. B) AD brain (frontal cortex) homogenate was fractionated and measured similarly, revealing a major peak eluting later. C) Recombinant full-length tau (amino acids 1–444) was fractionated and measured with HT7×PT82 assay, revealing the same major peak as in brain. AEB, raw signal in Simoa assay.
Fractionation of CSF samples, brain samples, or recombinant tau by reverse phase HPLC
AD CSF (0.5 mL), AD frontal cortex (1 gram) homogenate, or recombinant tau (1 ng) was added to 1.5 ml of 100 mM sodium phosphate pH 2.5 containing 100 mM sodium chloride and mixed. 1.8 ml of this mixture was applied onto a C18 reverse phase chromatography column equilibrated in 0.1% trifluoracetic acid in water. The HPLC column was then developed in an increasing gradient of acetonitrile (15–48% over 35 min). Fractions were collected across the elution. These fractions were made 10 mM in guanidine HCl and then taken to dryness in a vacuum concentrator (Explorer Savant, Thermo Fisher). The dried fractions were re-suspended in immunoassay buffer (TBST + 1% BSA) and subjected to the indicated assays.
Heat denaturing method
In Fig. 8B and D and Supplementary Figs 2A and C, AD CSF in 1.5 mL polypropylene tubes, in some experiments spiked with PT3 at 1μg/ml, was heated at 95°C with 400 rpm mixing for indicated time in a Thermomixer (Eppendorf), followed by chilling on wet ice for 10 min. Samples were then spun down, vortexed, and measured in the p217 + tau assay. In Fig. 8A and Supplementary Figure 1, the same process was used but spiking PT3 at concentrations ranging from 0.16–2500 ng/ml, and heating for 10 min. Following this method, samples are considered semi-denatured and the p217 + tau signal represents total p217 + tau, while non-denatured fluid represents free p217 + tau. Subtracting the latter from the former yields measurement of bound tau.
The precise heating time and temperature impact were evaluated further, revealing that 85°C×7 min was ideal for removing competing antibody effect, but not impacting the p217 + tau signal, and affording a wide time window of stable signal (Supplementary Figure 1). However, due to potential differences in site instrumentation, calibration, and process, this time/temperature window should be established de novo at each testing site.
Immunoprecipitation-HPLC method
As shown in Supplementary Figures 2B and 2D, AD CSF aliquots were spiked with increasing amounts of PT3 and incubated for 2 h to allow complexes to form. These samples were then incubated with protein A/G-coated magnetic beads (15μl bead slurry per 0.5 mL CSF) for 2 h with rocking at room temperature. Beads were precipitated via magnet and supernatant was transferred to a second tube (sample = “IgG depleted supernatant”). The beads were washed 4× with 1 mL cold PBS. 0.5 mL of 6 M GuHCl was then added to the tubes containing a) washed beads and b) IgG depleted supernatant and these were incubated for 20 min with rocking at room temperature. Beads were then precipitated by magnet and resulting supernatant was transferred to a 3rd tube (sample = “IgG concentrated supernatant”). Finally, 0.1 M phosphoric acid (pH2) was added to the two solutions prior to separation via rpHPLC program noted above, 1.0 mL phosphoric acid was added to the denatured IgG depleted supernatant, and 1.5 mL phosphoric acid was added to the IgG concentrated supernatant (to make both with final volume of 2.0 mL). The resulting rpHPLC fractions were dried down and then reconstituted as noted above and measured on the p217 + tau assay. Signal from the IgG depleted supernatant represents IgG-free p217 + tau, while signal from the IgG concentrated supernatant represents IgG-bound p217 + tau. rpHPLC separation and p217 + tau assay measurement of same parental CSF not subjected to the immunocapture/depletion process was analyzed simultaneously for assessment of total p217 + tau signal, as control for the free and bound measurements.
Statistical analyses
All linear correlations were performed with Pearson’s model. All comparisons between groups were determined via unpaired, parametric students t = test (Fig. 6A–C), ANOVA with multiple comparisons (Fig. 4D), or Receiver Operating Characteristic curves (Fig. 6E, F).
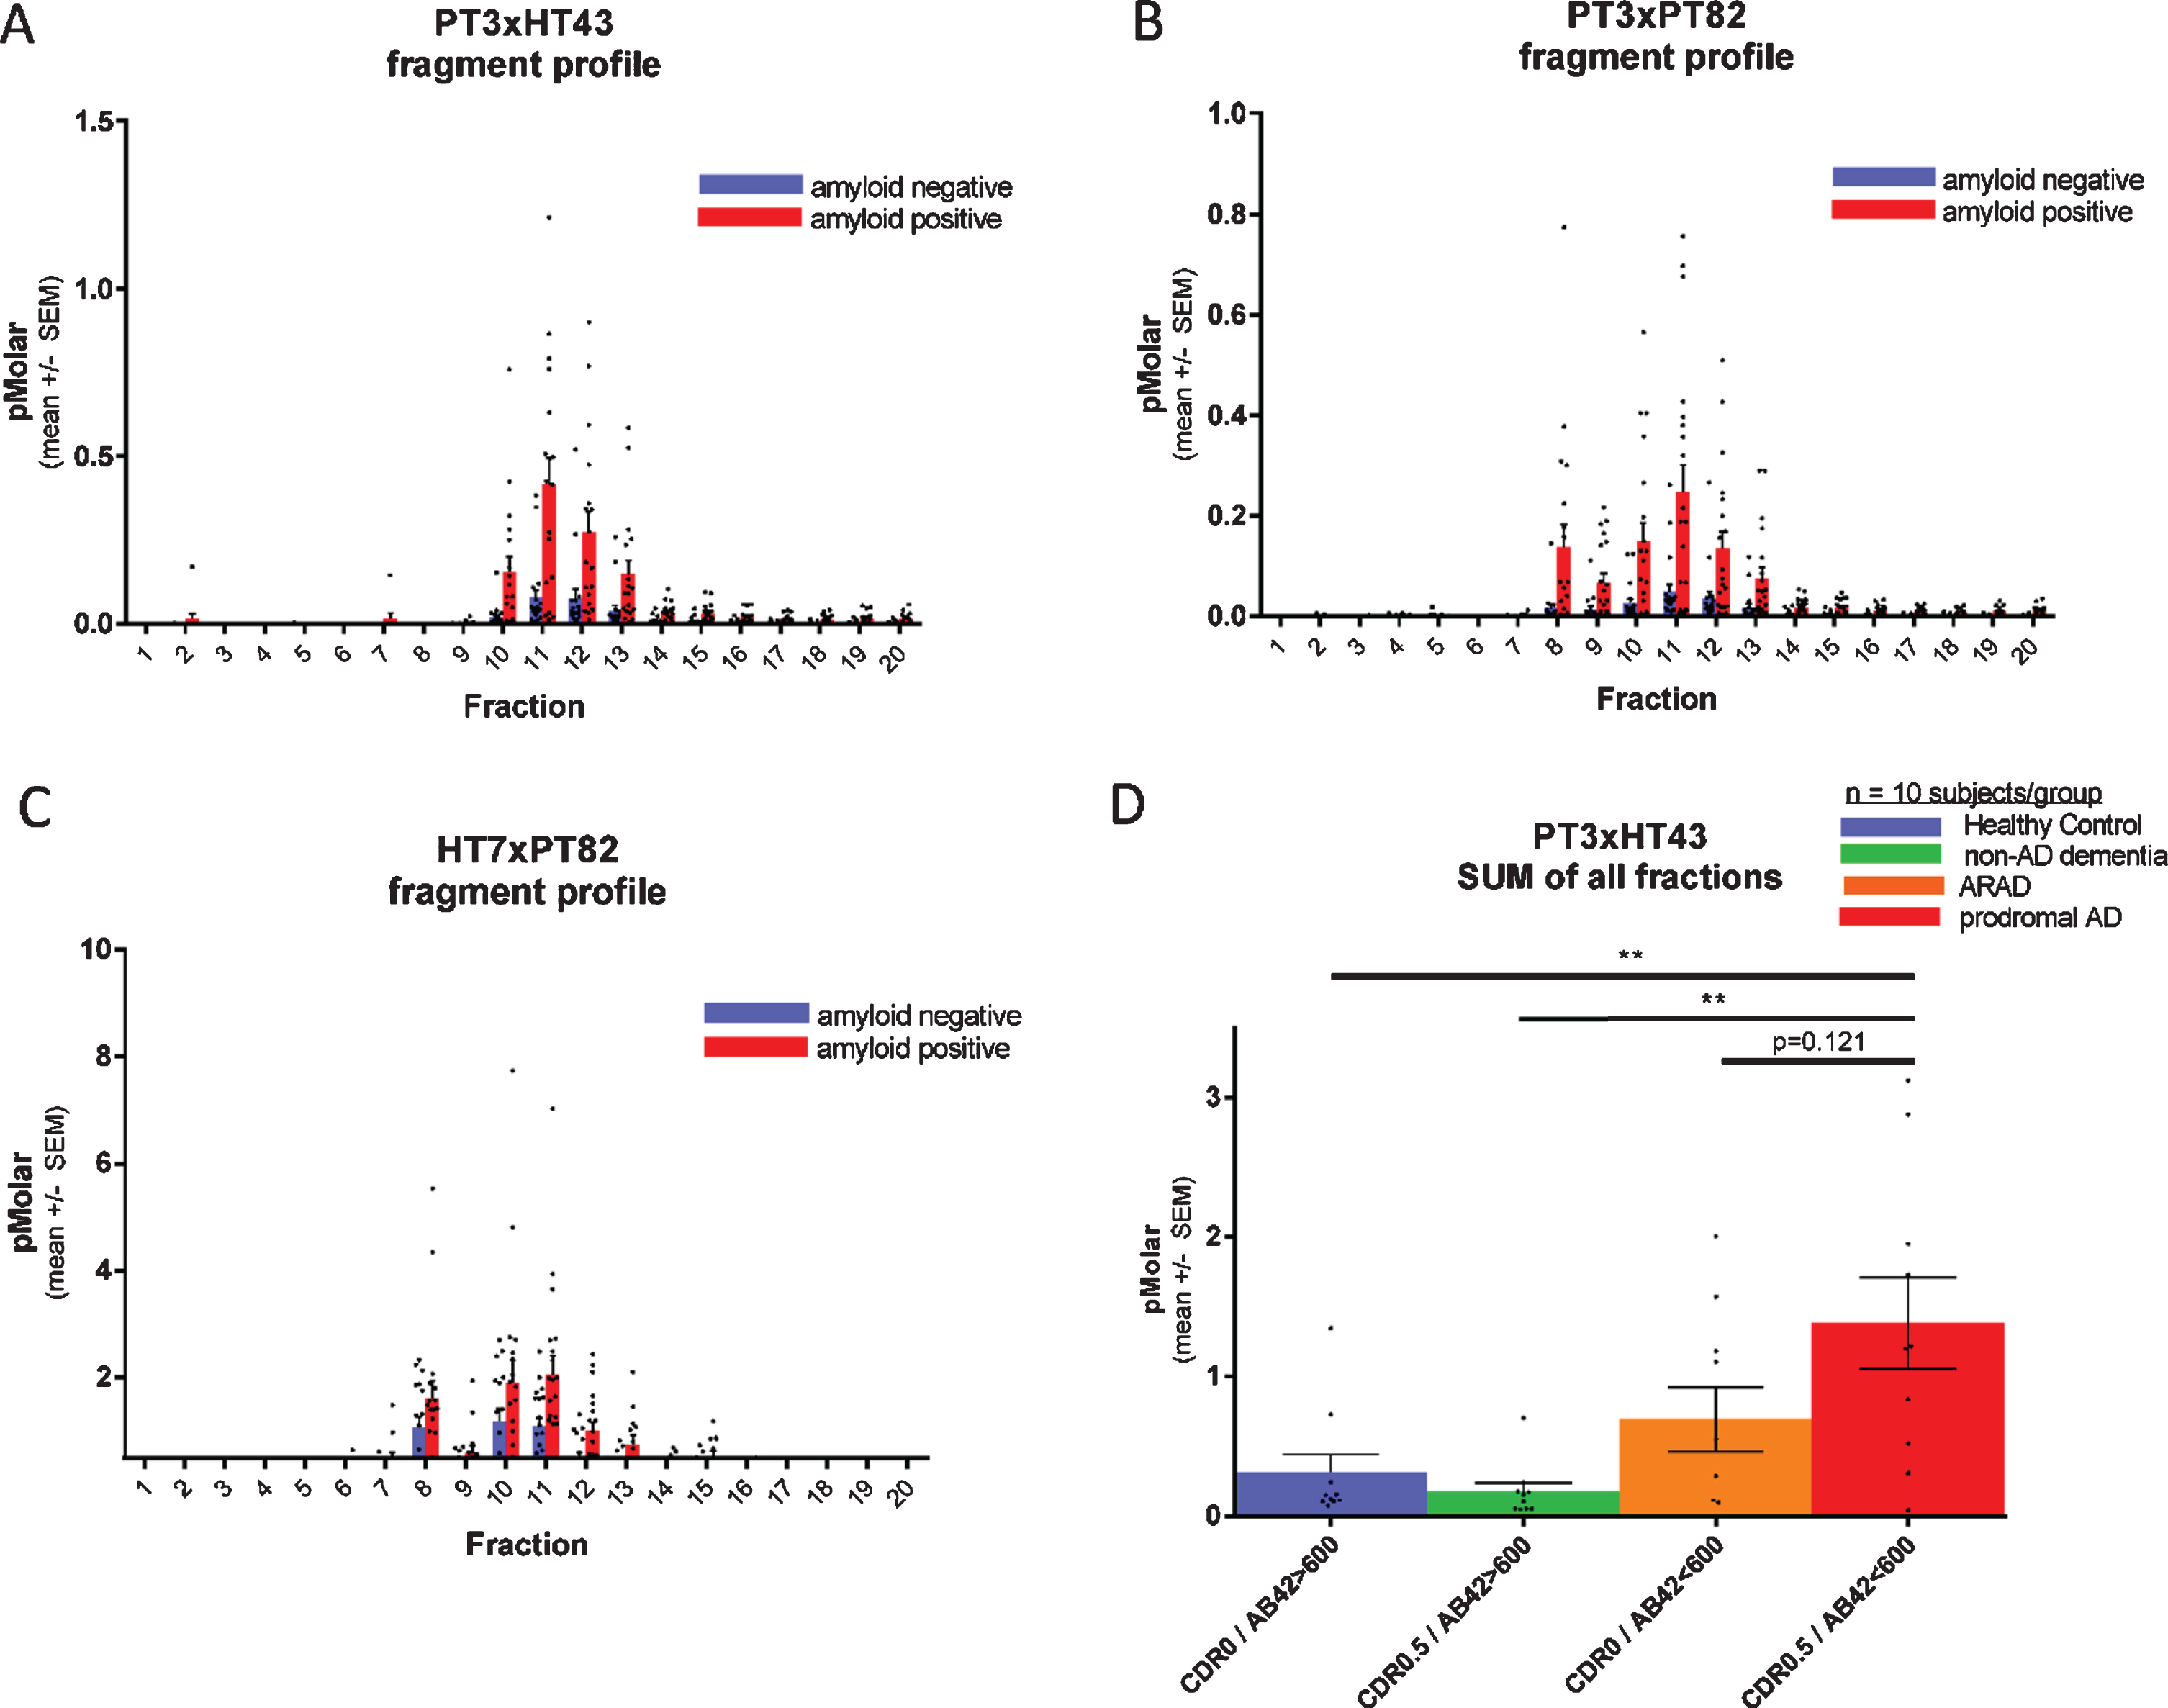
Fig. 4
Each fragment of CSF p217 + tau is elevated in AD. CSF from 20 amyloid positive (CSF Aβ42 < 600 pg/ml; red bars) and 20 amyloid negative (CSF Aβ42 > 600 pg/ml; blue bars) subjects (10 CDR 0 and 10 CDR 0.5 in each group) was fractionated by rpHPLC and measured with (A) p217 + tau long assay (PT3×HT43), (B) p217 + tau short assay (PT3×PT82), and (C) t-tau assay (HT7×PT82). D) The sum of all peaks in the p217 + tau long assay reveals higher signal in AD (red bar) versus amyloid negative subjects (green or blue bars). ARAD, asymptomatic at risk of developing AD.
RESULTS
Screening of antibody pairs on Simoa HD-1 platform
The PT3 mAb (epitope = aa210–220 of human tau, requiring phosphorylation at aa212 & 217, “p217 + tau”) was evaluated as capture reagent on Simoa HD-1 platform, pairing it with either HT43 (epitope = aa7–20 of human tau), PT82 (epitope = aa119–126 of human tau), Janssen A (epitope = aa151–158 of human tau), Janssen B (epitope = aa166–182 of human tau), BT2 (epitope = aa193–198 of human tau), or Quanterix anti-tau kit detection reagent (epitope = aa16–24 of human tau). The focused nature of the screen was based on a) preference to rely on PT3 for p217 + tau specificity [18] and b) pairing with a reagent targeting the N-terminus or mid-region of tau since extracellular tau is C-terminally truncated [15, 17, 19].
Using titrations of pooled AD CSF, several antibody pairs were identified that exhibited Signal/Noise >100 at even 1:16 dilution of sample (Fig. 1A). The most sensitive assays were those that used HT43 or PT82 as detection reagent. PT3 paired with HT43 is termed “PT3×HT43” or “p217 + tau long”, while PT3 paired with PT82 is termed “PT3×PT82” or “p217 + tau short” (Fig. 1C). After assay optimization, calibrant peptides containing the core epitopes of these mAbs were used to define the lower limit of detection (LLOD) and lower limit of quantification (LLOQ) at 2 fg/ml and 40 fg/ml, respectively (Fig. 1B). In parallel, a third assay was developed using the commercial mAb HT7 as capture agent and PT82 as detector (HT7×PT82). As HT7 recognizes a similar region of tau (aa159–163) as PT3, yet does not have requirement for phosphorylation, this assay is termed “t-tau” and is used herein as evaluation of total tau to confirm specificity or relevance of the p212 and p217 phosphorylation events.
Technical qualification of the p217 + tau assays
The two p217 + tau assays were evaluated in standard technical qualification steps. A low tau CSF pool was measured in dilution series, revealing dilution linearity of the back-calculated p217 + tau concentration in the range of 1:4 to at least 1:32 dilution (Fig. 2A). The minimum required dilution (MRD) of CSF samples was thus established as 1:8. At this dilution all CSF samples from healthy controls (n = 53) were measured in the middle of the chosen standard curve (41–30,000 fg/ml) (Fig. 2B). To evaluate accuracy, two unique pools of CSF samples were spiked with calibrant peptide at three concentrations, revealing a spike recovery average of 114% (Table 1) thus indicating no significant matrix interference. To evaluate inter-batch precision of the assay, a standard curve was run on 3 separate days, with similar signal observed at each point (Fig. 2C). To evaluate transferability of the assay (inter-site precision), one CSF sample was diluted in series, frozen, then shipped to two sites for measurement (Janssen, San Diego, CA and Quanterix, Lexington, MA), revealing nearly identical signal/noise between each site (Fig. 2D). Confirmation of phosphorylation dependency of the signal was determined by incubating CSF with increasing amounts of alkaline phosphatase (AP) prior to measurement. Both p217 + tau assays revealed reduction of signal with increasing AP. As expected, the HT7×PT82 assay did not show any reduction in signal, but instead showed elevation of signal as HT7 binding is known to be inhibited by phosphorylation (Fig. 2E). Finally, to evaluate stability of the p217 + tau signal, CSF samples were submitted to multiple freeze thaws, incubation at various temperatures (4°C to 37°C) for up to 4 h, or long-term storage at –70°C (0–18 months). Through all perturbations the p217 + tau signals remained consistent (within 20% CV), indicating the p217 + epitope is stable (Fig. 2F, G).
Table 1
Spike recovery in CSF
| Sample | Calibrant spike concentration (pg/ml) | Measured concentration (pg/ml) | Recovered spike concentration (pg/ml) | Recovery % |
| CSF#1 | 0 | 3.69 | NA | NA |
| 2 | 5.69 | 2.0 | 100 | |
| 20 | 25.6 | 21.91 | 110 | |
| CSF #2 | 0 | 4.91 | NA | NA |
| 2 | 7.39 | 2.48 | 124 | |
| 20 | 29.4 | 24.49 | 122 |
AD CSF from 2 donors were spiked with p217 + tau calibrant at indicated concentrations then measured with PT3×HT43 assay. Recovered spike concentration = concentration after spike –concentration with 0 pg/ml spike. Recovery % = recovered spike concentration/spike concentration×100.
p217 + tau is present on multiple fragments, but not full-length tau, in CSF
To study the nature of the p217 + tau signal, an AD CSF pool was fractionated by reverse phase HPLC and the fractions were analyzed with the PT3×PT82 assay. As tau is amphipathic, it generally fractionates in HPLC by size (smaller fragments are found in the early fractions). When the CSF fractions were probed with the PT3×PT82 assay, two major peaks (fraction 9 and 11) were observed (Fig. 3A). In contrast, when AD brain homogenate was fractionated, the major peak was observed much later (fraction 18), which corresponds with the location of recombinant full-length tau (Fig. 3B, C).
When CSF fractions were analyzed with the PT3×HT43 assay only 1 of the p217 + tau peaks was detected, presumably the longer one (fraction 11), indicative of a cleavage event between the PT82 and HT43 epitopes on some p217 + tau species (Fig. 4A versus 4B).
Each fragment of CSF p217 + tau is elevated in AD
To evaluate if CSF p217 + tau concentrations are regulated in AD, and which fragments might be most impacted, a cohort of 40 CSF samples (n = 20 CDR 0, n = 20 CDR 0.5; each group containing 10 CSF amyloid positive subjects and 10 negative subjects) was fractionated by rpHPLC and probed with both p217 + tau assays as well the t-tau assay. All three assays showed elevated mean signal in each fraction in the amyloid positive cohort versus amyloid negative cohort, indicating that all p217 + species are elevated relatively equivalently in AD. While the absolute concentration reported by the p217 + tau assays (peak = 0.25 or 0.5 pM) was much lower than that reported by the t-tau assay (peak = 2.2 pM), the relative increase in the amyloid positive group was much more pronounced with the p217 + tau assays (Fig. 4A–C).
Integrating signals of all fractions in the p217 + tau assay indicates progressively higher signal from amyloid negative to amyloid positive CDR 0 to amyloid positive CDR 0.5 subjects (Fig. 4D).
CSF p217 + tau overlaps partially, but is distinct from, traditional t-tau and p181tau measurements
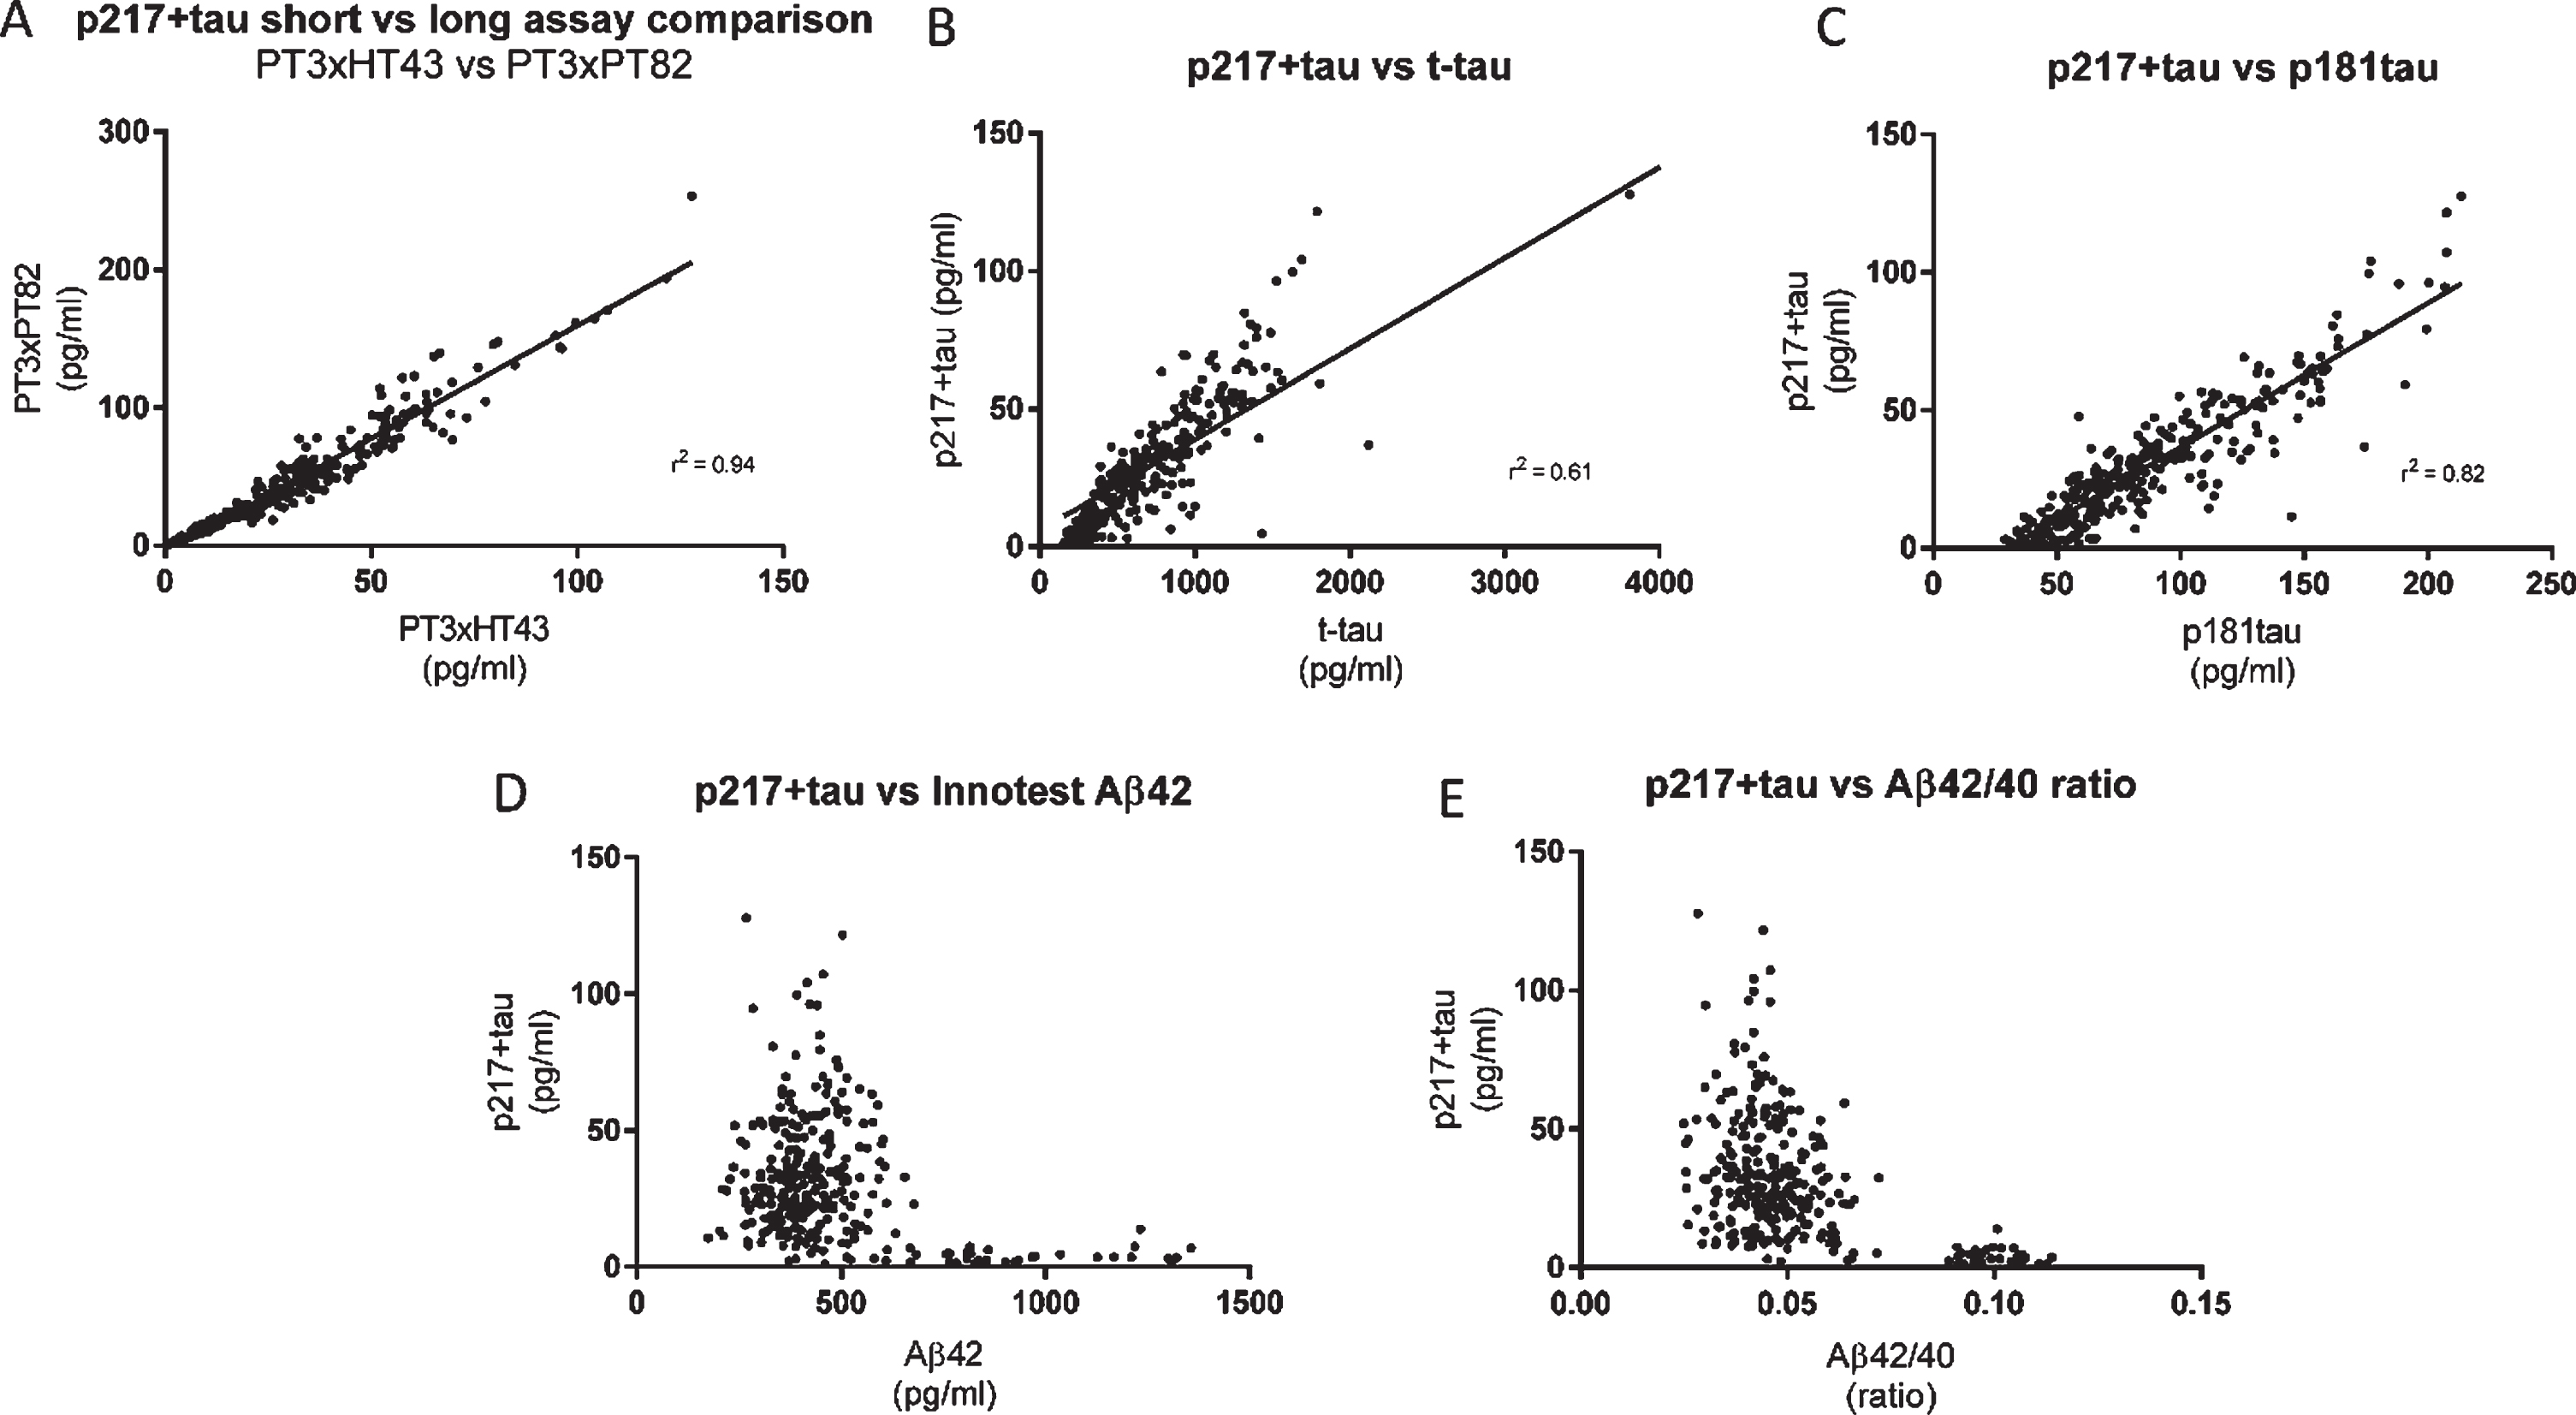
To evaluate concordance of the CSF p217 + tau measurement with traditional CSF tau measurements, a cohort of 323 samples from subjects with mild-moderate dementia (87% amyloid positive) was probed with both p217 + tau assays as well as Innotest Aβ40, Aβ42, t-tau, and p181tau assays. While the two p217 + tau assays correlated very well (r2 = 0.94), the correlation between either assay and the Innotest t-tau or p181tau assays was weaker (r2 = 0.61 and 0.82, respectively) indicating that not all tau species contain p217 + tau (Fig. 5A–C). While p217 + tau was substantially higher in amyloid positive subjects versus negative subjects, as seen in the Fig. 4 cohort, there was no correlation with absolute Aβ42 levels or Aβ42/40 ratio in either amyloid group (Fig. 5D, E).
Fig. 5
CSF p217 + tau overlaps partially, but is distinct from, Innotest t-tau and p181tau. CSF from subjects with mild-moderate dementia (n = 323 samples) were measured with the indicated assays and evaluated for inter-assay correlation. A) The two p217 + tau assays (PT3×HT43 and PT3×PT82) correlated well. B, C) However the correlation of either assay (data shown here is with PT3×HT43) with classical tau assays Innotest hTauAG or Innotest p181tau was less pronounced. D, E) While p217 + tau (here shown with PT3HT43 assay) is higher in amyloid positive subjects (Aβ42 < 600 pg/ml, or Aβ42/40 ratio < 0.09) versus negative subjects, there is no correlation with absolute Aβ42 levels or ratio when looking within amyloid positive or negative groups.
CSF p217 + tau is superior to traditional tau assays in differentiating amyloid status
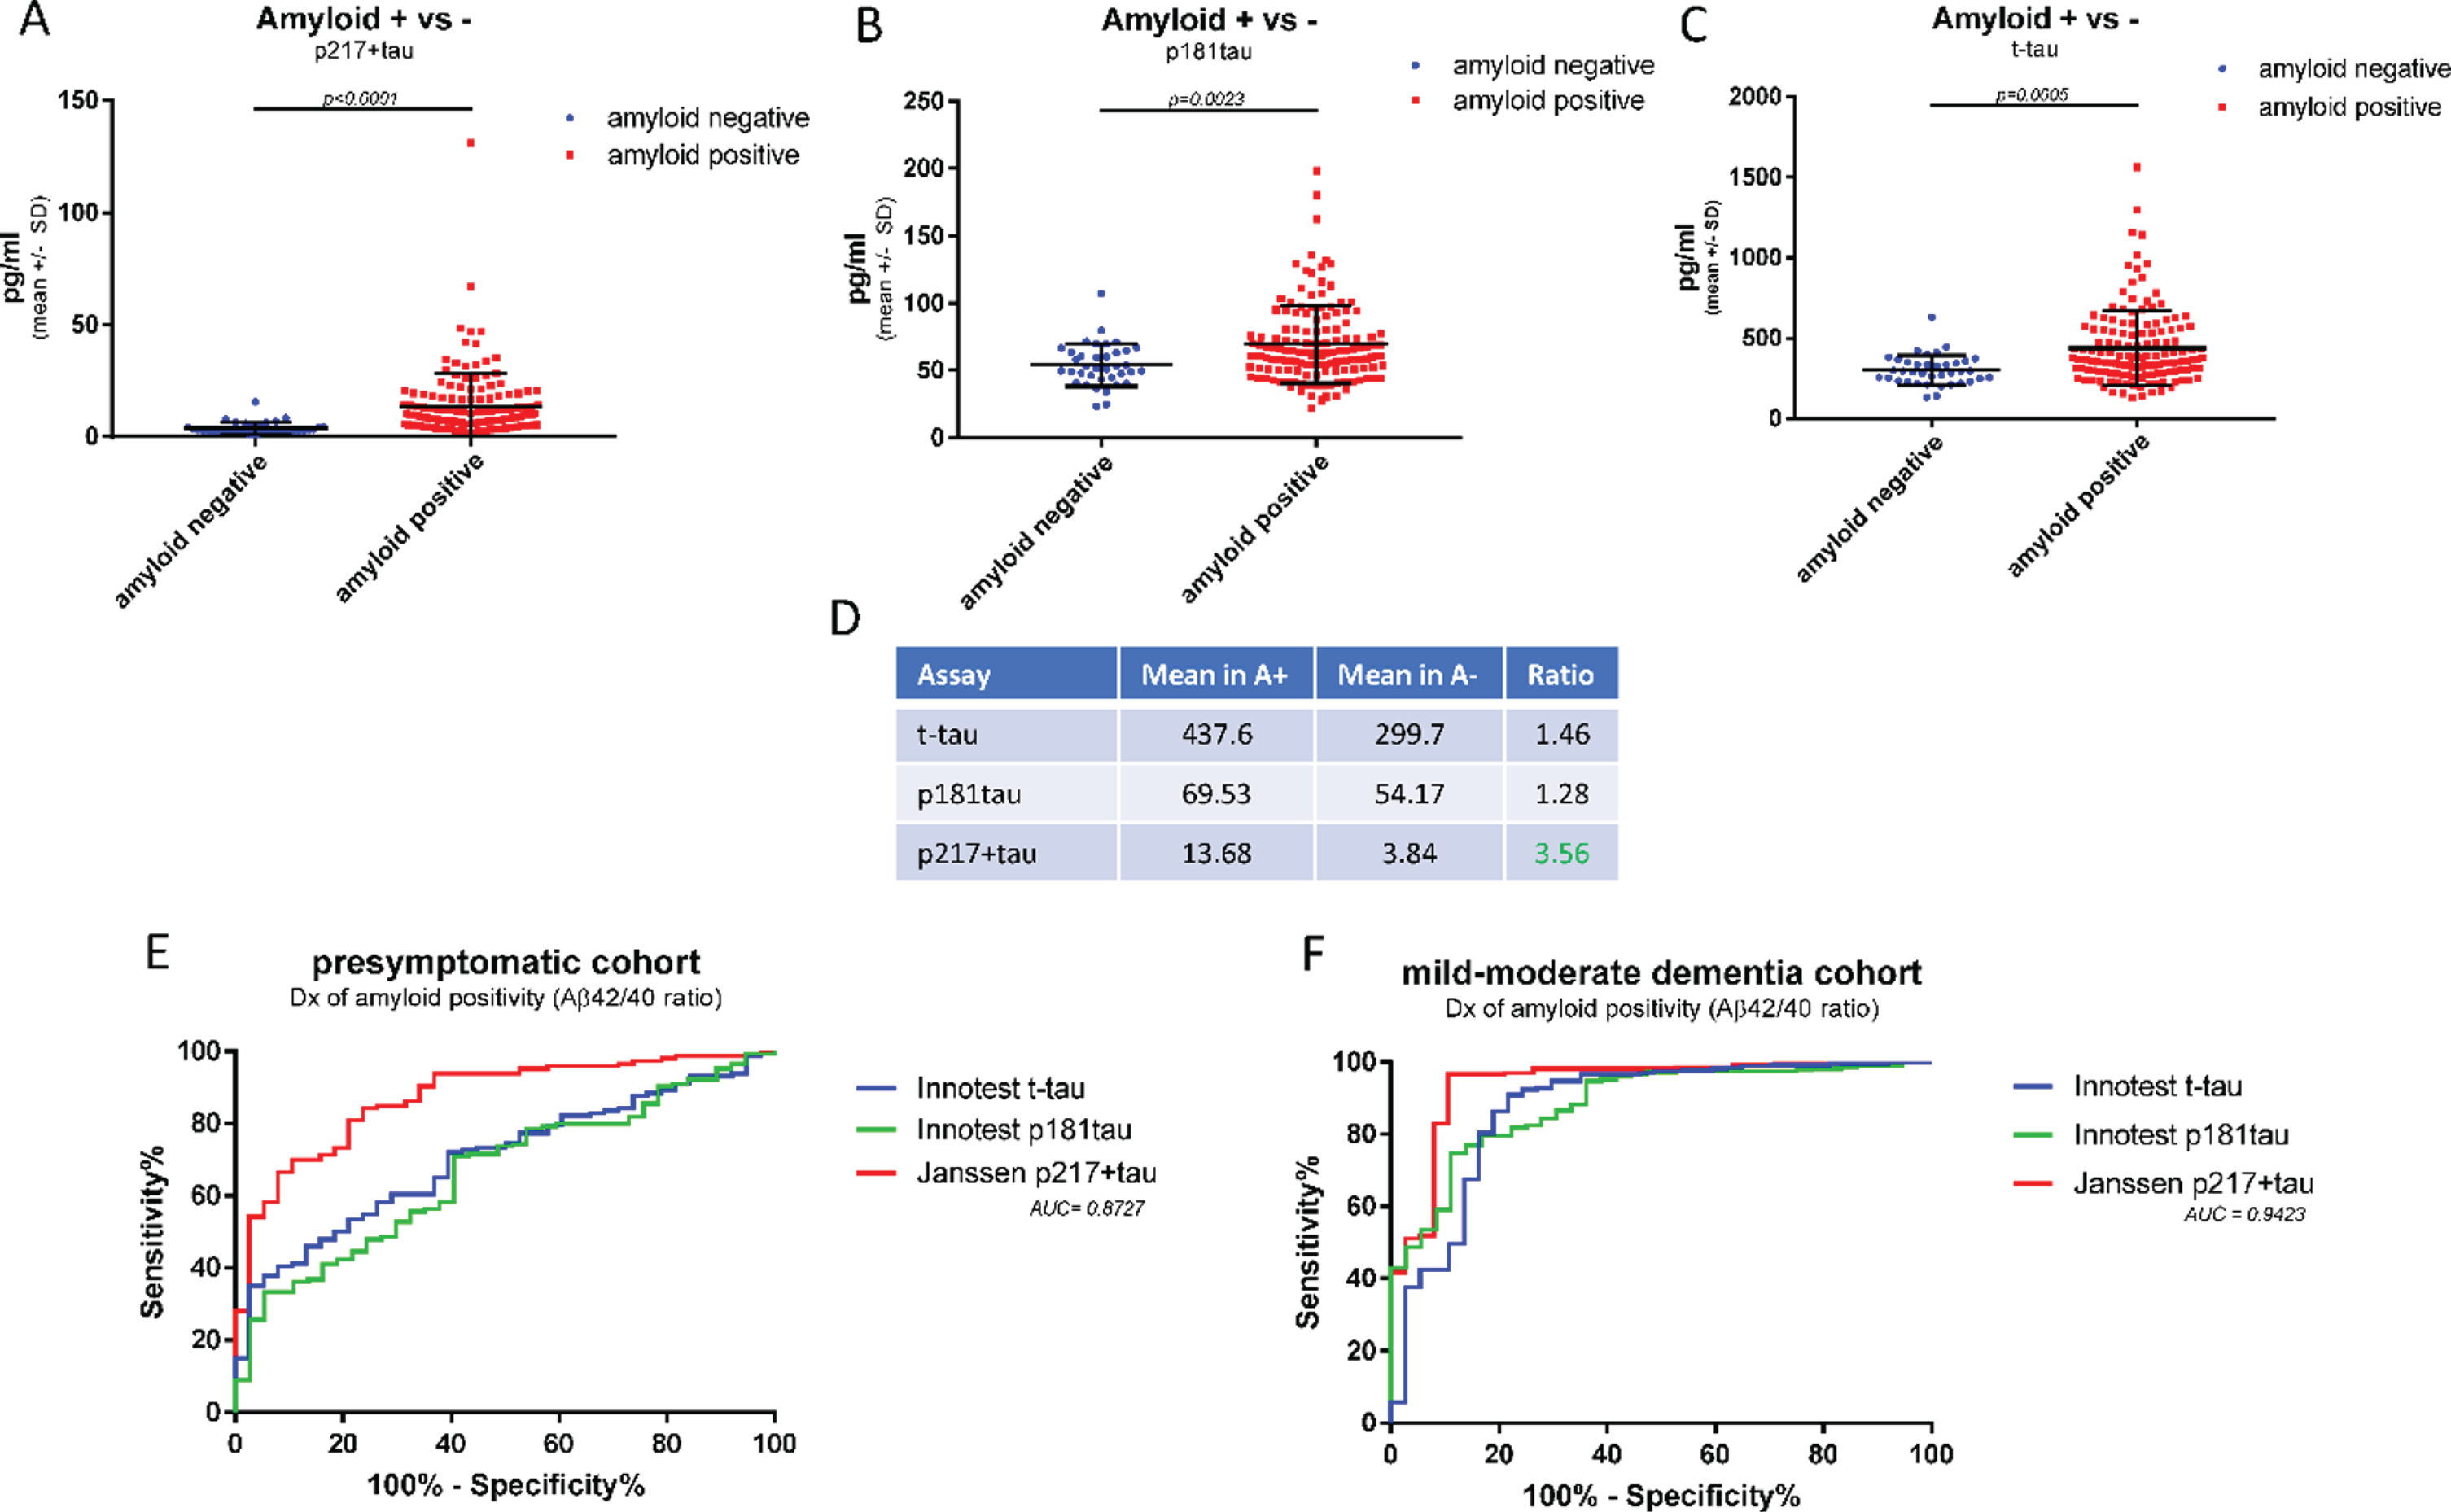
The higher levels of p217 + tau seen in amyloid positive dementia subjects versus amyloid negative dementia subjects suggests the p217 + tau assays may be selective for AD, in contrast to total tau assays that detect high signal in many neurodegenerative conditions (e.g., after acute brain injury [20, 21]). To further evaluate the potential of the p217 + tau assays to identify amyloid positive subjects, a second clinical cohort was examined, this time of presymptomatic subjects in order to observe a different range of Aβ42 and Aβ40 levels (n = 184 subjects, 79% amyloid positive). CSF samples were measured with p217 + tau, Innotest t-tau, and Innotest p181tau. While all three assays showed greater mean concentrations in the amyloid positive versus amyloid negative groups the differential was higher in the p217 + tau data (A+/–ratio = 1.46 (t-tau), 1.28 (p181tau), and 3.56 (p217 + tau) (Fig. 6A–D). ROC curve analysis confirmed the p217 + tau data were superior to the traditional tau assay in differentiating amyloid status in both the presymptomatic cohort (AUC = 0.87) and mild-moderate dementia cohort (AUC = 0.94) (Fig. 6E, F).
Fig. 6
CSF p217 + tau is superior to traditional tau assays in differentiating amyloid status. CSF from cognitively normal subjects (n = 194 samples) were measured with p217 + tau (PT3×HT43), Innotest t-tau, Innotest p181tau, Innotest Aβ42, and Innotest Aβ40 assays. A–D) Mean tau levels in amyloid positive versus negative subjects (Aβ42/40 ratio < 0.09 = amyloid positive) were evaluated. E) The ability of each tau assay to predict amyloid status in this presymptomatic cohort was evaluated. F) The ability of each tau assay to predict amyloid status in the mild-moderate dementia cohort (Fig. 5) was evaluated. Compared to traditional tau assays, the p217 + tau assay revealed larger differential between amyloid positive and negative subjects and was more accurate in predicting amyloid status.
CSF p217 + tau correlates modestly with cognition
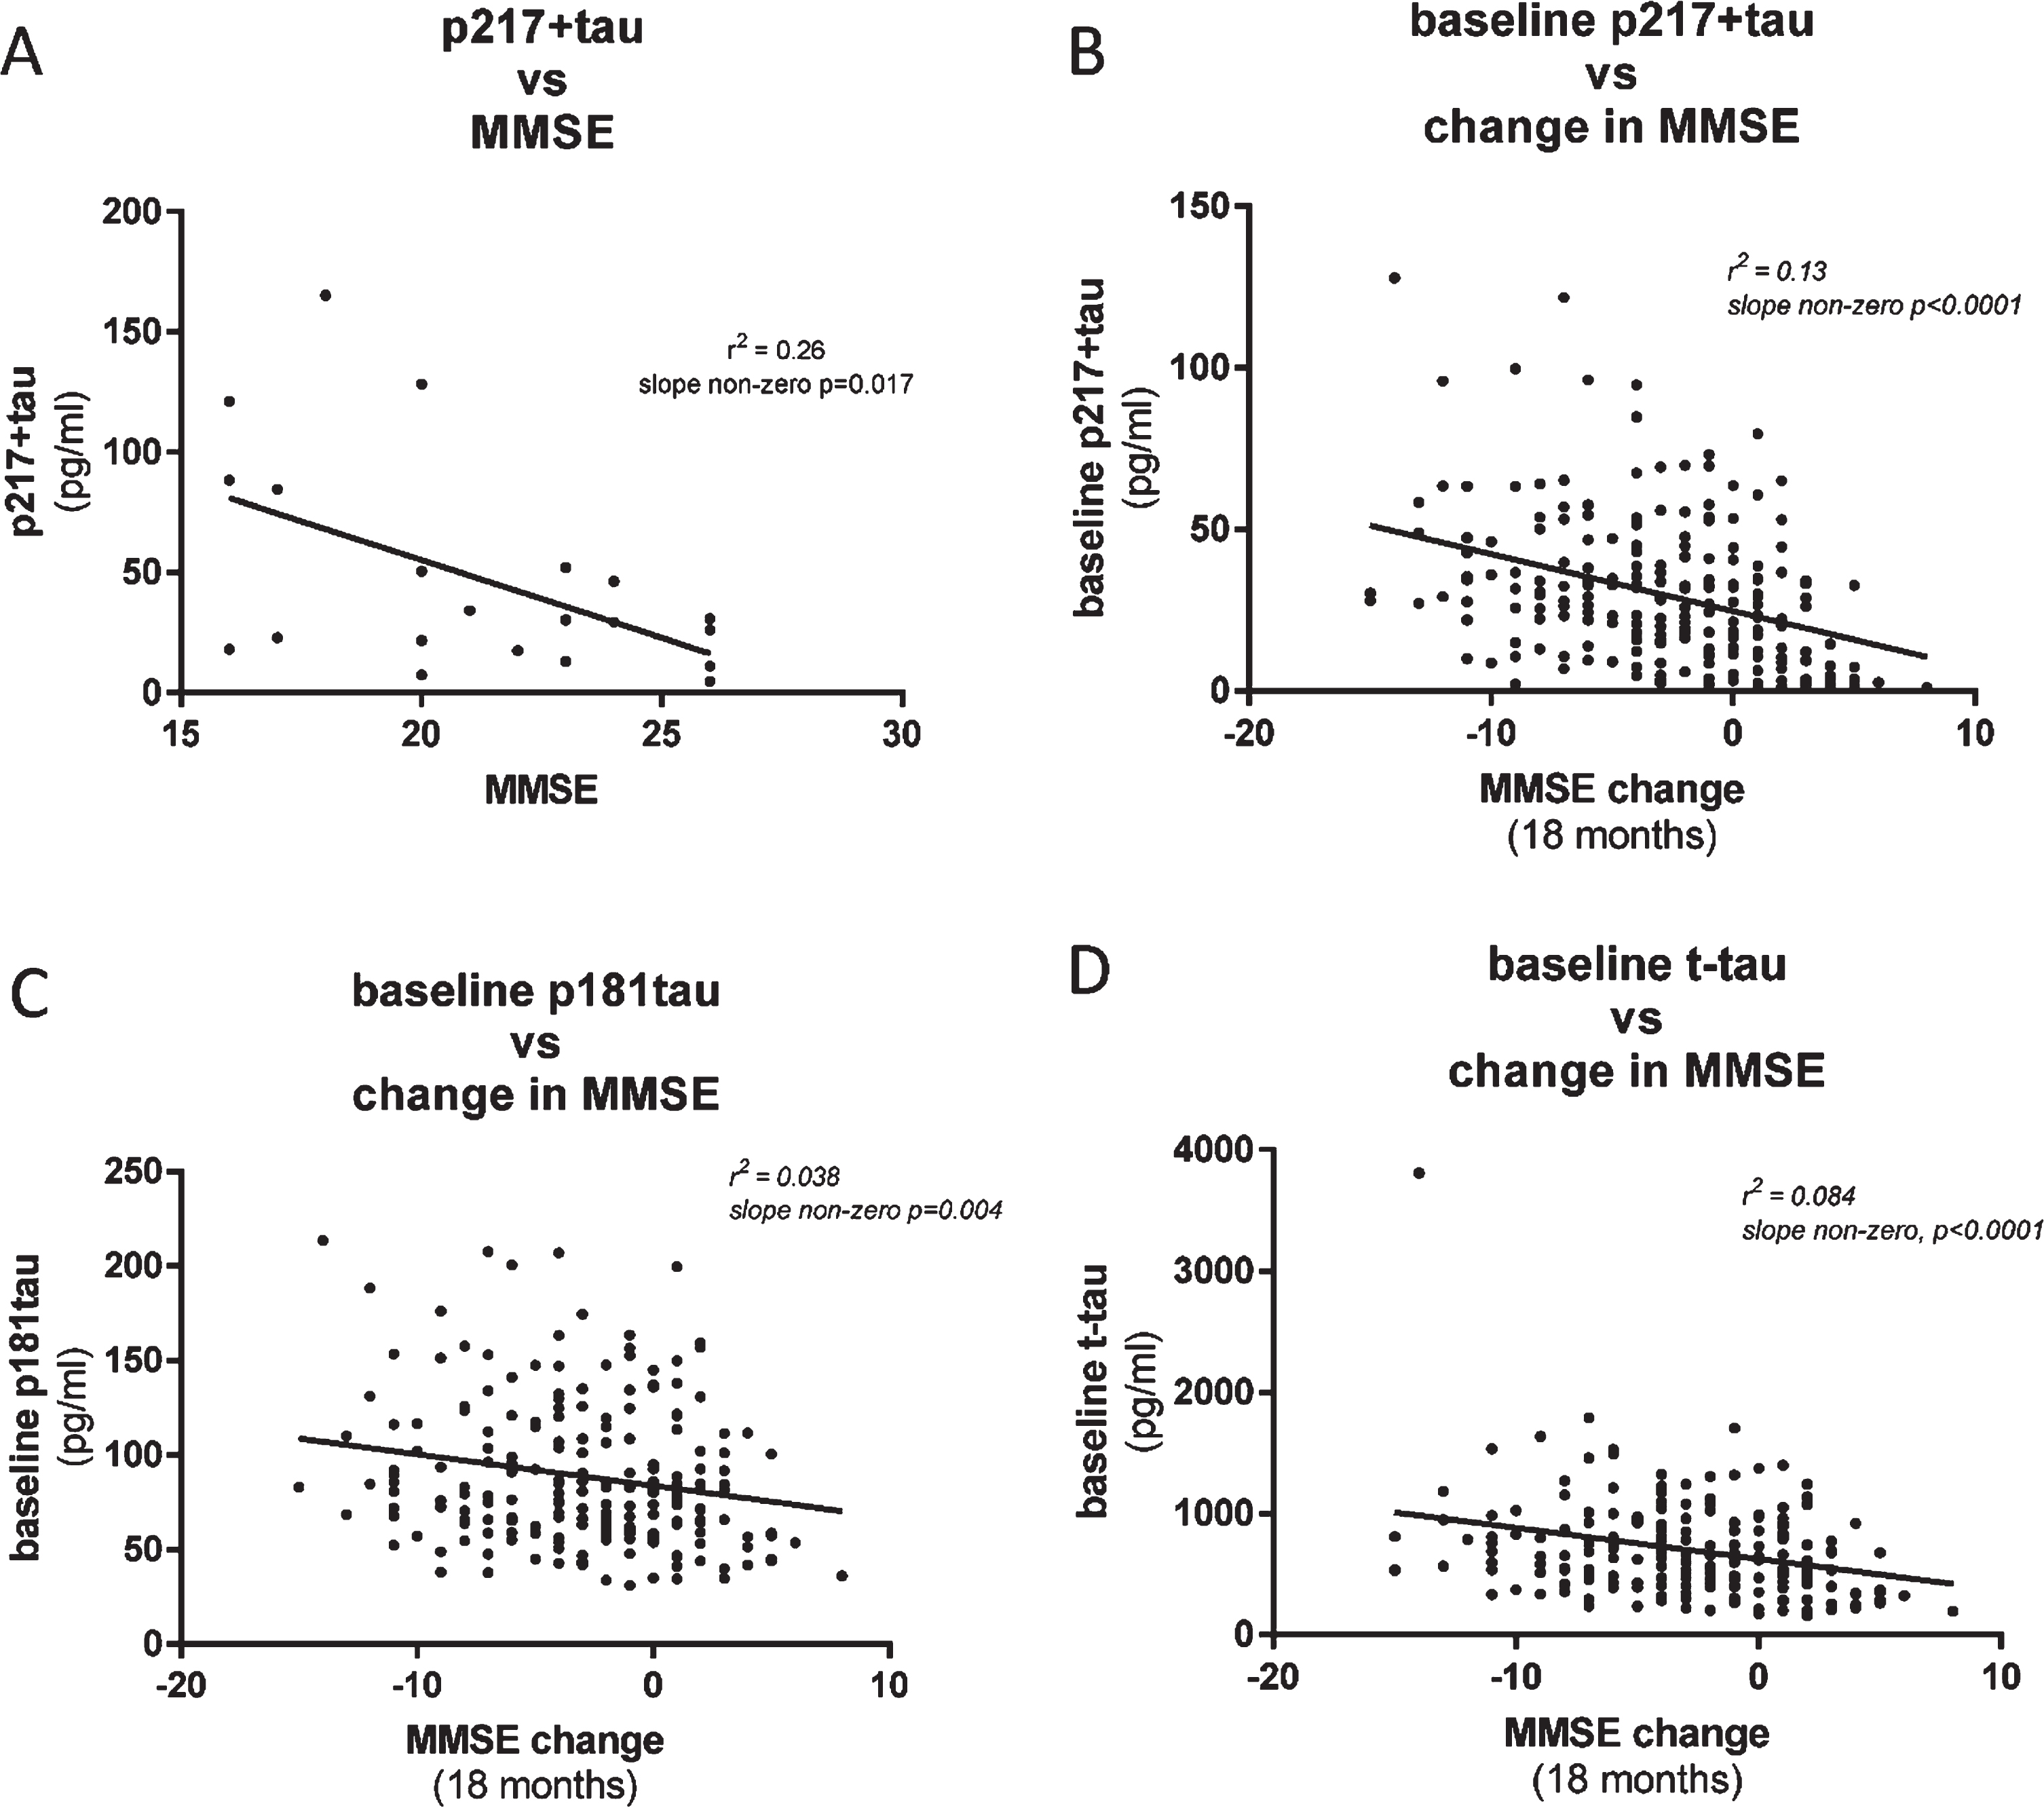
To evaluate the utility of the CSF p217 + tau assays to complement, or predict change in, cognitive scores, we compared p217 + tau concentrations with Mini-Mental State Examination (MMSE) measures in two cohorts of mild-moderate dementia subjects. In the first cohort (n = 21 subjects) CSF p217 + tau levels were found to moderately correlate with MMSE score collected at same time, with higher p217 + tau concentrations associating with worse cognition (r2 = 0.26, slope non-zero p = 0.017) (Fig. 7A). In the second cohort (n = 235 subjects) baseline CSF p217 + levels correlated with change in cognitive state (0 versus 18 months later) (r2 = 0.13, slope non-zero p < 0.0001), with higher p217 + tau levels associating with worse prognosis (Fig. 7B). Innotest p181tau and t-tau measures did not correlate as tightly with change in MMSE (Fig. 7C, D).
Fig. 7
CSF p217 + tau correlates modestly with cognition. A) CSF p217 + tau (PT3×HT43) was measured in a small cohort of mild-moderate dementia subjects (n = 21, 90% amyloid positive) and compared with the MMSE scores from the same timepoint. B) CSF p217 + tau (PT3×HT43) was measured in a larger cohort of mild-moderate dementia subjects (n = 235, 87% amyloid positive) and compared with change in MMSE score from time of sample collection to 18 months later. Higher p217 + tau levels were seen in subjects with worse baseline cognition and greater worsening in cognition. C, D) CSF p181tau and t-tau concentrations revealed inferior correlations with change in MMSE.
CSF p217 + tau assay +/–heat denaturing can discriminate antibody-free versus antibody-bound p217 + tau
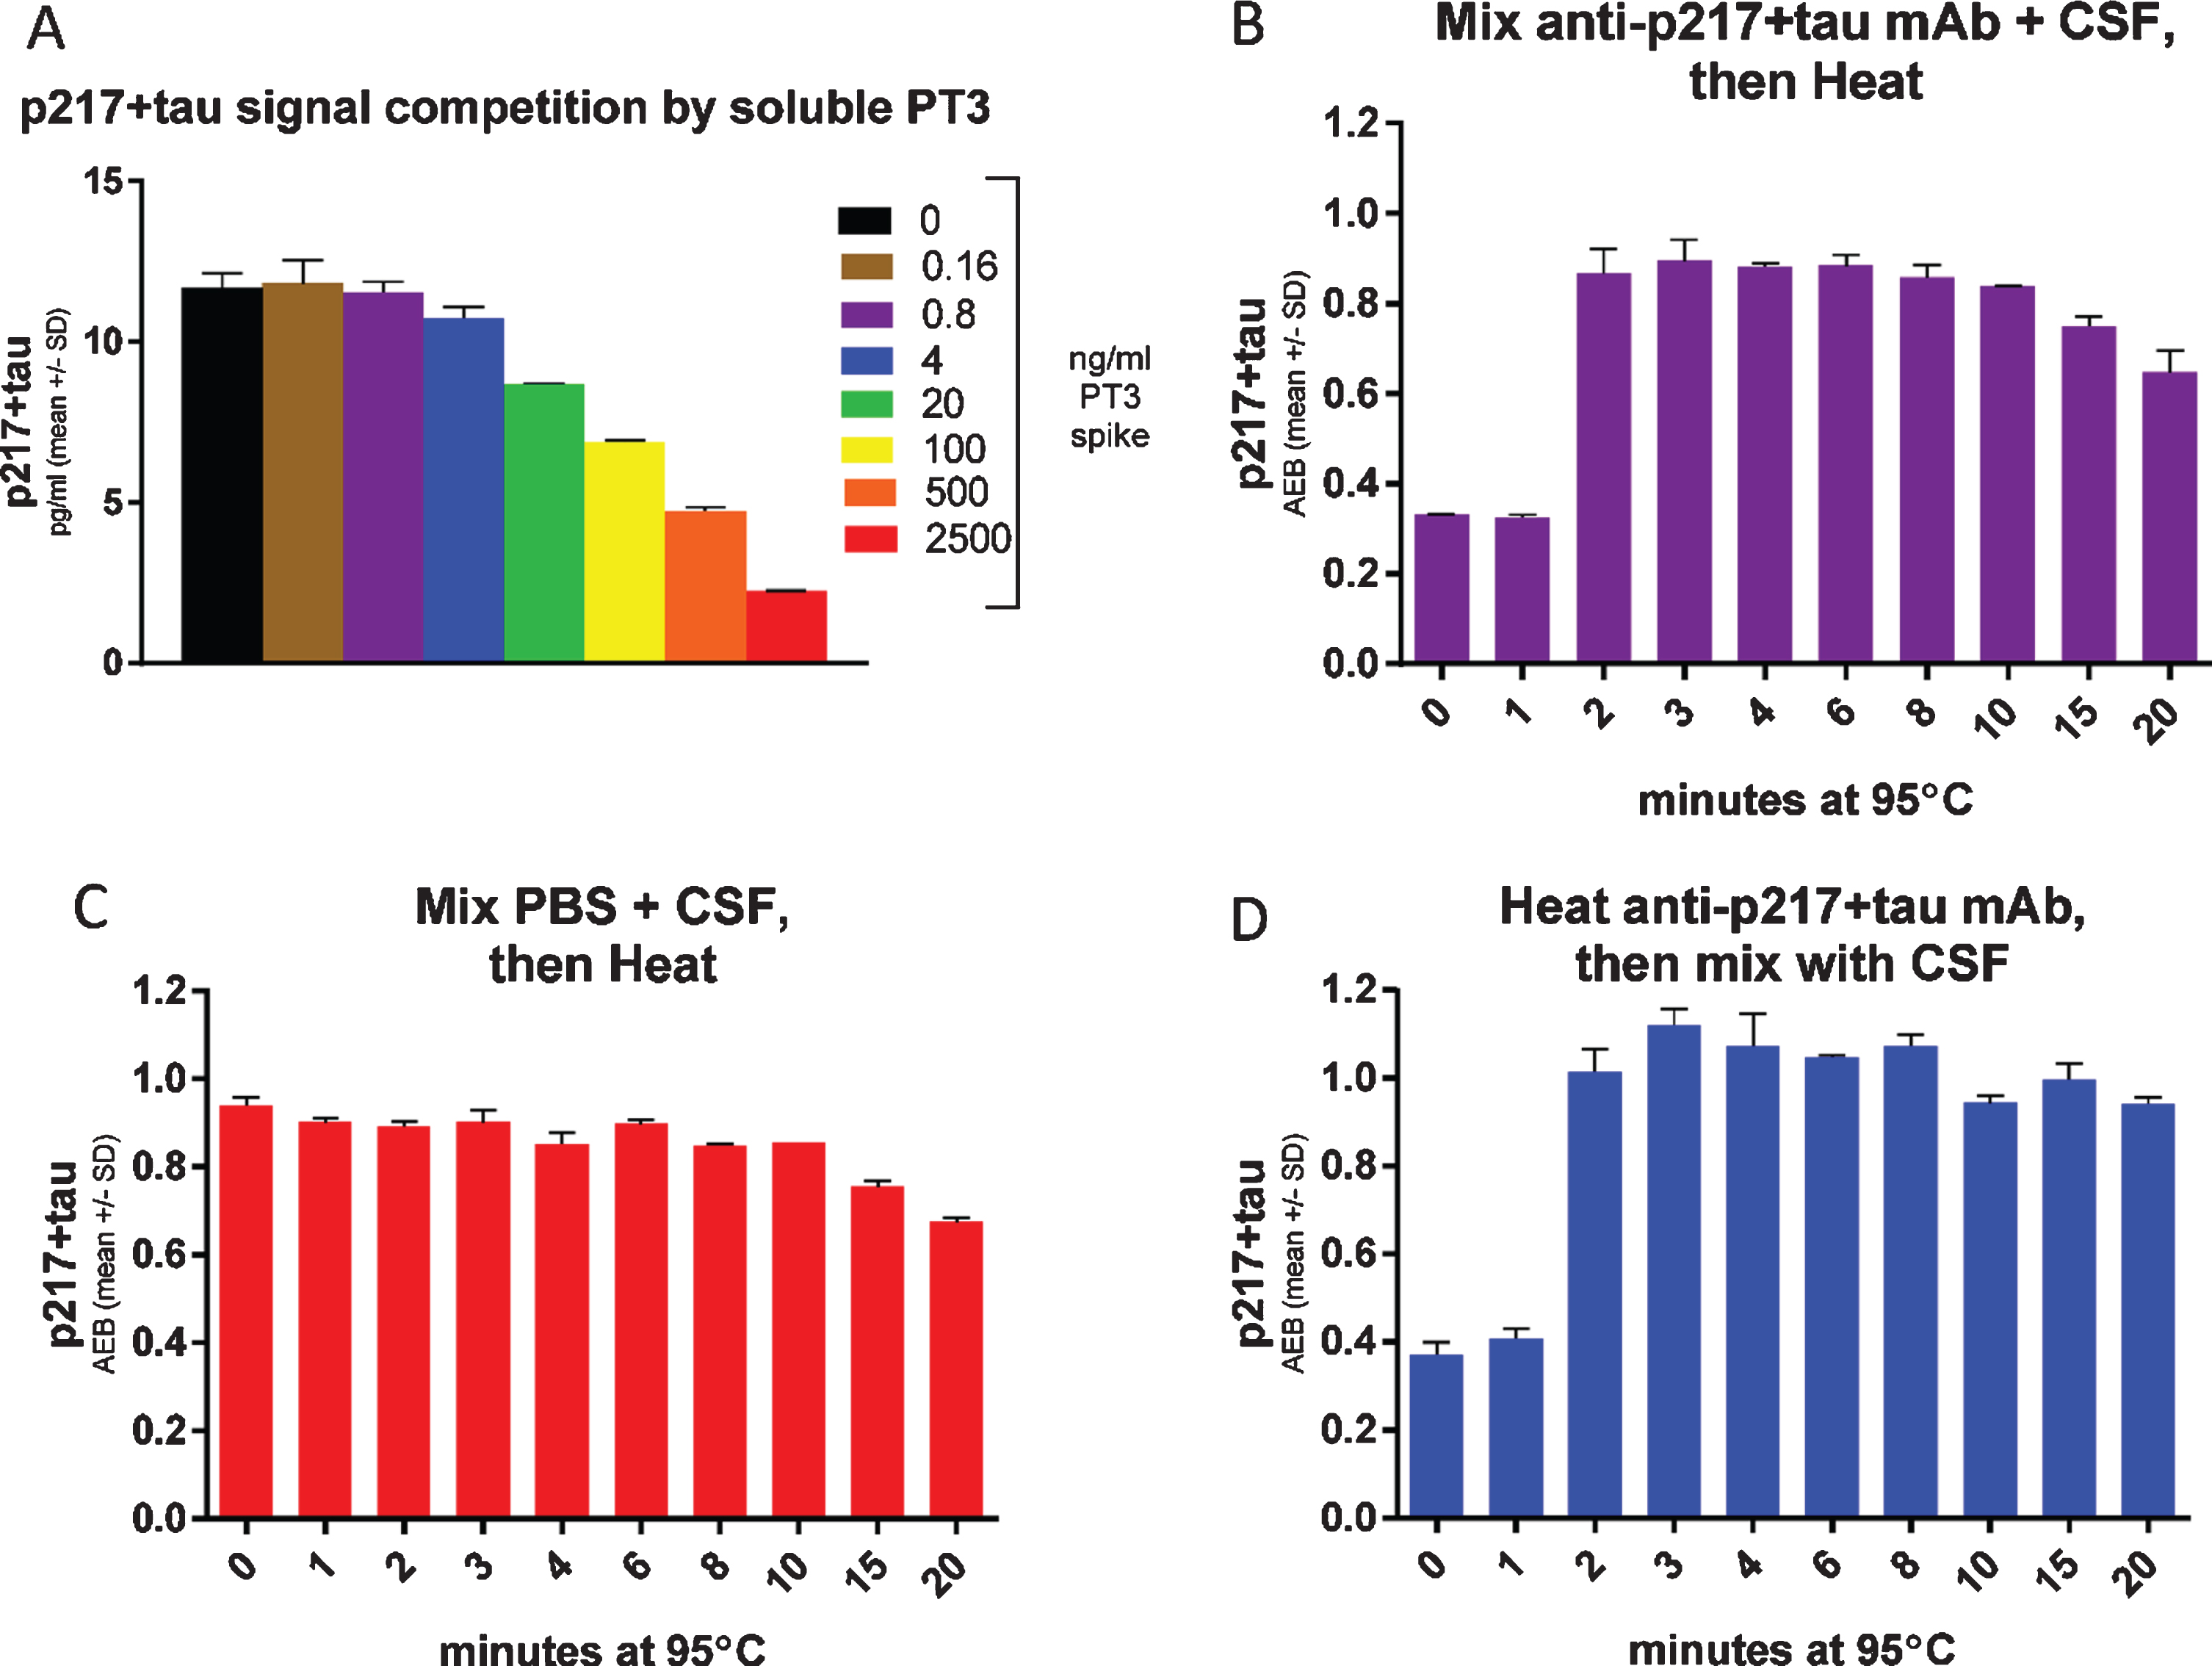
To support use of the CSF p217 + tau assay as a target engagement readout of binding to the epitope after anti-tau immunotherapy, we evaluated the impact on CSF p217 + tau measurements after spiking CSF with increasing concentrations of soluble PT3. The soluble PT3 reduced the CSF p217 + tau signal (Fig. 8A), due to competition of the soluble antibody and assay capture reagent for binding to p217 + tau. As such, the method can be viewed as a measure of free p217 + tau. In order to develop a method for measuring total p217 + tau, the impact of heat was explored, as tau is known to be uniquely heat stable [19]. CSF premixed with PT3 showed the expected reduction in signal, which was rescued after only 2 min of 95°C heat (Fig. 8B). Heating CSF in the absence of PT3 revealed that the p217 + tau signal is stable for at least 10 min at this temperature (Fig. 8C). To confirm that the heat impact was only on the antibody, it was heated similarly, then mixed with the CSF before measurement, which revealed nearly identical results to the premixing protocol (Fig. 8D). Subtraction of free p217 + tau from total p217 + tau allows one to calculate the amount of p217 + tau bound to targeting antibodies. Indeed, this estimate aligned well with the more laborious but direct method of measuring bound p217 + tau by immunoprecipitation of all antibody complex followed by denaturing and measuring p217 + tau (Supplementary Figure 2). Therefore, the heat denaturing method can be used upstream of the CSF p217 + tau measurement as a pharmacodynamic measurement in anti-p217 + tau immunotherapy trials.
Fig. 8
Heat denaturing CSF prior to assay removes potential interference, yielding free versus total p217 + tau measurement. A) CSF was spiked with indicated concentrations of PT3, then measured with the p217 + tau assay (PT3×HT43) revealing competition of signal. B) CSF was spiked with 1μg/ml PT3 then heated for the indicated times at 95°C, then measured with p217 + tau assay, revealing that heat rescues the PT3-competed signal. C) CSF was spiked with similar volume of PBS then heated for the indicated times at 95°C, then measured with p217 + tau assay, revealing stability of the signal for at least 10 min. D) The PT3 antibody was heated for indicated times at 95°C, then mixed with CSF at 1μg/ml and measured with p217 + tau assay, revealing the effect seen in panel B is due to impact on the spiked PT3 antibody itself.
DISCUSSION
CSF phosphorylated tau (p-tau) is believed to be one of the best fluid-based staging markers of AD [7], yet existing p-tau assays have limitations (e.g., sensitivity, dynamic range in samples, detectable epitopes are only a fraction of the natural biological variability). Several recent mass spectrometry reports suggest p217tau species may be particularly enriched in AD [11, 12, 16, 23]. These reports are biologically illuminating but the measurement methods are not widely available, potentially onerous and may have scaling issues.
Here we describe a highly sensitive, quantitative, robust, and scalable method for measuring p217 + tau in human CSF. These assays utilize the Simoa HD-1 platform, which is widely available and thus easily transferred to other sites, and fully automated thereby minimizing labor and imprecision.
Two assays for measuring p217 + tau were developed, differing only in their detection antibody, in order to study potential differences in the diagnostic potential of p217 + tau fragments of varying lengths. Since both assays (p217 + tau short and p217 + tau long) reveal nearly identical performance and diagnostic potential, the core reagent PT3 appears to be the key element to the assay power. The PT3 mAb actually probes an epitope that contains not just pT212 and pT217 but additional nearby phospho-residues [18]. Hence the assays are described as recognizing tau with p217 “plus” (epitope containing at least p212 and p217). Lacking immunoreagents that recognize only pT217 or pT212, one can only speculate on their relative contributions in the assays described here. LC/MS reports from other groups have suggested that pT212 and PT217 each are not present in control brain, but are found in paired helical filament prep from AD brain. Interestingly, while monophosphorylated peptides containing pT217 alone were detected, pT212 was only found in peptides that also contained phosphorylation of S214 or T217 [14]. Multiphosphorylated tau has been hypothesized to be more pathological, and indeed pT212/pS214 dual phosphorylated tau is the epitope of the “AD specific” AT100 mAb [24]. As such it is possible that recognition of the dual epitope pT212/pT217 may afford even greater AD-specificity than pT217 alone.
Using HPLC to fractionate CSF prior to p217 + tau short assay measurement revealed at least two sizes of tau, one that reaches from at least aa7–217 (aka long species) and from at least aa119–217, but not reaching to aa7 (aka short species). Neither of these was as large as full length tau. This suggests that the tau recognized with these assays are entirely of fragmented nature, likely all lacking the C-terminus and occasionally also cleaved in the region of aa7–119. This finding is in line with prior reports that CSF tau is predominantly comprised of mid-region and N-terminal-containing fragments, indeed major cleavage sites are likely in the region from aa 70–120 and at ∼aa 224 [15, 25–27]. The CSF p217 + tau assays appear to have superior AD diagnostic and staging potential to the traditional t-tau and p-tau ELISAs (e.g., Innotest hTauAG and p181tau), confirming recent reports with other measurement methods of p217tau [12, 28]. Indeed, the magnitude of the phosphorylation signal in amyloid positive subjects, relative to amyloid negative subjects, was more pronounced in p217 + tau assays than in t-tau or p181tau assays. This increased pathologic relevance of p217 event may be due to earlier and more substantial phosphorylation of this site relative to p181. Mass spectrometry has indicated that while phosphorylation of amino acid 181 is one of the most prevalent tau phosphorylation events (perhaps indicative of why it was the original p-tau form adopted for ELISA), it is only marginally more phosphorylated in AD CSF versus non-AD CSF (10.1 versus 13.3% = 1.3× elevation in AD versus HC), while amino acid 217 is one of the most upregulated tau phosphorylation events in AD (1.9 versus 8.5% = 3.5× elevation in AD versus HC) [23]. Further, p217 is one of the most upregulated tau phosphorylation sites in CSF versus brain homogenate [23] suggesting this event coincides with release of tau from neurons, an event suspected to be pathologically controlled [17]. In sum, tau containing p217 appears to be one of the most AD-specific forms of tau known; however the concentrations are so low that quantitative measurement of this epitope has been extremely difficult until now.
The full diagnostic and staging potential of the p217 + tau assays described here is still unknown. Whether p217 + tau is AD-specific or found in other tauopathies should be evaluated further, however preliminary data suggests the p217 + tau signal is especially enriched in amyloid positive subjects, even when looking in subjects with dementia (Fig. 4D, green versus red bar). Other tau assays (e.g., t-tau, p181tau) do not show elevated signal in several non-AD tauopathies [29].
We show here that p217 + tau is substantially higher in AD versus HC, and appears to be steadily elevated with increasing AD stage, yet these are small and cross sectional cohorts. Evaluation of p217 + tau concentration dynamics across the full spectrum of healthy controls to demented AD subjects (or with long term longitudinal sampling) is needed, and such results should be compared to established t-tau and p181tau assays to establish p217 + tau cutoffs. Comparison of CSF p217 + tau concentrations to brain tau burden as measured by PET and cognitive scores would allow correlation of this peripheral measurement to central tau levels and cognitive function. Indeed, CSFp217tau, as measured by LC/MS, MSD with p217tau-specific mAb, and the Simoa p217 + tau assay described herein has been shown recently to correlate well with tau PET and amyloid PET [12, 28, 30].
The p217 + tau assay reported here has shown similar performance to the LC/MS p217 assays and the MSD p217tau assay, suggesting p217 is the most critical aspect of the p217 + tau assay. Indeed, Janelidze et al., 2020 [28] reported very similar performance for predicting TauPET status via the MSD p217-specific assay and the Simoa p217 + tau assay described here. However, the strategy used in developing the p217 + tau assay differs from the LC/MS and other immunoassays in that the core reagent (PT3) was raised against pathological tau (PHF), which circumvents depending on an a priori hypothesis of which tau modifications are most relevant.
If p217 + tau is indeed a particularly pathologically relevant epitope, it could be that auto-antibodies might develop to this region as a protective mechanism. Further, it could be beneficial to target this region therapeutically. In the former case, such auto-antibodies would confound the diagnostic potential of the assays. In the latter case, measuring perturbations of the target epitope by therapeutic biologics would be impeded by the biologics themselves. To address both concerns, we evaluated the use of heat denaturing to remove the impact of the antibody/biologic without impacting p217 + tau levels. Pretreating CSF with controlled temperature and time can accomplish such measurements; a narrow operational window is defined that allows for measuring total p217 + tau even in the presence of competing antibodies. Measuring CSF without this denaturing step therefore allows for measuring free p217 + tau, and subtraction from total yields quantification of antibody-bound p217 + tau. Indeed, a concentration dependent decrease in free p217 + tau was seen here in the presence of increasing amounts of PT3. These assays can therefore be used as target engagement assays in anti-p217 + tau experiments.
Finally, the exquisite sensitivity of the assays, combined with additional biochemical upstream steps, could allow for measurement in blood products (plasma, serum). The relatively rare abundance of the p217 + tau analyte could prove rate limiting to assay development, since it is expected that tau levels in blood would be significantly lower than in CSF, but could also be of benefit in terms of specificity for pathology versus simple neuronal damage (e.g., traumatic brain injury or peripheral nerve damage). Given the diagnostic performance of the CSF p217 + tau species shown here, a blood p217 + tau method could have broad and immediate utility as a screening tool for AD clinical trials and early detection of neurodegeneration prior to symptoms.
DISCLOSURE STATEMENT
Authors’ disclosures available online (https://www.j-alz.com/manuscript-disclosures/20-0463r1).
SUPPLEMENTARY MATERIAL
[1] The supplementary material is available in the electronic version of this article: https://dx.doi.org/10.3233/JAD-200463.
REFERENCES
[1] | Hebert LE , Weuve J , Scherr PA , Evans DA ((2013) ) Alzheimer’s disease in the United States (2010-2050) estimated using the 2010 Census. Neurology 80: , 1778–1783. |
[2] | Heron M ((2018) ) Deaths: Leading causes for 2016. Natl Vital Stat Rep 67: , 1–77. |
[3] | Burnham SC , Coloma PM , Li QX , Collins S , Savage G , Laws S , Doecke J , Maruff RN , Martins RN , Ames D , Rowe CC , Masters CL , Villemagne VL ((2019) ) Application of the NIA-AA research framework: Towards a biological definition of Alzheimer’s disease using cerebrospinal fluid biomarkers in the AIBL study. J Prev Alzheimers Dis 6: , 248–255. |
[4] | Brier MR , Gordon B , Friedrichsen K , McCarthy J , Stern A , Christensen J , Owen C , Aldea P , Su Y , Hassenstab J , Cairns NJ , Holtzman DM , Fagan AM , Morris JC , Benzinger TLS , Ances BM ((2016) ) Tau and Aβ imaging, CSF measures, and cognition in Alzheimer’s disease. Sci Transl Med 8: , 338ra66. |
[5] | Jack CR Jr , Wiste HJ , Schwarz CG , Lowe VJ , Senjem ML , Vemuri P , Weigand SD , Therneau TM , Knopman DS , Gunter JL , Jones DT , Graff-Radford J , Kantarci K , Roberts RO , Mielke MM , Machulda MM , Petersen RC ((2018) ) Longitudinal tau PET in ageing and Alzheimer’s disease. Brain 141: , 1517–1528. |
[6] | Hanseeuw BJ , Betensky RA , Jacobs HIL , Schultz AP , Sepulcre J , Becker JA , Cosio DMO , Farrell M , Quiroz YT , Mormino EC , Buckley RF , Papp KV , Amariglio RA , Dewachter I , Ivanoiu A , Huijbers W , Hedden T , Marshall GA , Chhatwal JP , Rentz DM , Sperling RA , Johnson K ((2019) ) Association of amyloid and tau with cognition in preclinical Alzheimer’s disease; A longitudinal study. JAMA 76: , 915–924. |
[7] | Olsson B , Lautner R , Andreasson U , Öhrfelt A , Portelius E , Bjerke M , Hölttä M , Rosén C , Olsson C , Strobel G , Wu E , Dakin K , Petzold M , Blennow K , Zetterberg H ((2016) ) CSF and blood biomarkers for the diagnosis of Alzheimer’s disease: A systematic review and meta-analysis. Lancet Neurol 15: , 673–684. |
[8] | Gordon BA , Friedrichsen K , Brier M , Blazey T , Su Y , Christensen J , Aldea P , McConathy J , Holtzman DM , Cairns NJ , Morris JC , Fagan AM , Ances BM , Benzinger TL ((2016) ) The relationship between cerebrospinal fluid biomarkers of Alzheimer pathology and positron emission tomography tau imaging. Brain 139(Pt 8): , 2249–2260. |
[9] | Bancher C , Brunner C , Lassmann H , Budka H , Jellinger K , Wiche G , Seitelberger F , Grundke-Iqbal I , Iqbal K , Wisniewski HM ((1989) ) Accumulation of abnormally phosphorylated tau precedes the formation of neurofibrillary tangles in Alzheimer’s disease. Brain Res 477: , 90–99. |
[10] | Wang JZ , Liu F ((2008) ) Microtubule-associated protein tau in development, degeneration and protection of neurons. Prog Neurobiol 85: , 148–175. |
[11] | De Riva V , Galloni E , Marcon M , Di Dionisio L , Deluca C , Meligrana L , Bolner A , Perini F ((2014) ) Analysis of combined CSF biomarkers in AD diagnosis. Clin Lab 60: , 629–634. |
[12] | Barthelemy NR , Bateman RJ , Hirtz C , Marin P , Becher F , Sato C , Gabelle A , Lehman S ((2020) ) Cerebrospinal fluid phospho-tau T217 outperforms T181 as a biomarker for the differential diagnosis of Alzheimer’s disease and PET amyloid-positive patient identification. Alzheimers Res Ther 12: , 26. |
[13] | Barthelemy NR , Li Y , Joseph-Mathurin N , Gordon BA , Hassenstab J , Benzinger TLS , Buckles V , Fagan AM , Perrin RJ , Goate AM , Morris JC , Karch CM , Xiong C , Allegri R , Mendez PC , Berman SB , Ikeuchi T , Mori H , Shimada H , Shoji M , Suzuki K , Noble J , Farlow M , Chhatwal J , Graff-Radford NR , Salloway S , Schofield PR , Masters CL , Martins RN , O’Connor A , Fox NC , Levin J , Jucker M , Gabelle A , Lehmann S , Sato C , Bateman RJ , McDade E , Dominantly Inherited Alzheimer Network ((2020) ) A soluble phosphorylated tau signature links tau, amyloid and the evolution of stages of dominantly inherited Alzheimer’s disease. Nat Med 26: , 398–407. |
[14] | Hanger DP , Byers HL , Wray S , Leung K-Y , Saxton MJ , Seereeram A , Reynolds CH , Ward MA , Anderton BH ((2007) ) Novel phosphorylation sites in tau from Alzheimer brain support a role for casein kinase 1 in disease pathogenesis. J Biol Chem 282: , 23645–23654. |
[15] | Barthélemy NR , Gabelle A , Hirtz C , Fenaille F , Sergeant N , Schraen-Maschke S , Vialaret J , Buee L , Junot C , Becher F , Lehmann S ((2016) ) Differential mass spectrometry profiles of tau protein in the cerebrospinal fluid of patients with Alzheimer’s disease, progressive supranuclear palsy, and dementia with Lewy bodies. J Alzheimers Dis 51: , 1033–1043. |
[16] | Barthélemy NR , Bateman RJ , Marin P , Becher F , Sato C , Lehman S , Gabelle A ((2017) ) Tau hyperphosphorylation on T217 in cerebrospinal fluid is specifically associated to amyloid β-pathology. bioRxiv; https://doi.org/10.1101/226977 |
[17] | Sato C , Barthélemy NR , Mawuenyega KG , Patterson BW , Gordon BA , Jockel-Balsarotti J , Sullivan M , Crisp MJ , Kasten T , Kirmess KM , Kanaan NM , Yarasheski KE , Baker-Nigh A , Benzinger TLS , Miller TM , Karch CM , Bateman RJ ((2018) ) Tau kinetics in neurons and the human central nervous system. Neuron 97: , 1284–1298.e7. |
[18] | Van Kolen K , Malia TJ , Theunis C , Nanjunda R , Teplyakov A , Ernst R , Wu SJ , Luo J , Borgers M , Vandermeeren M , Bottelbergs A , Wintmolders C , Lacy E , Maurin H , Larsen P , Willems R , Van De Casteele T , Triana-Baltzer G , Slemmon R , Galpern W , Trojanowski JQ , Sun H , Mercken MH ((2020) ) Discovery and functional characterization of hPT3, a humanized anti-phospho tau selectivemonoclonal antibody. J Alzheimers Dis 77: , 1397–1416. |
[19] | Kanmert D , Cantlon A , Muratore CR , Jin M , O’Malley TT , Lee G , Young-Pearse TL , Selkoe DJ , Walsh DM ((2015) ) C-terminally truncated forms of tau, but not full-length tau or it’s C-terminal fragments, are released from neurons independently of cell death. J Neurosci 35: , 10851–10865. |
[20] | Neselius S , Brisby H , Theodorsson A , Blennow K , Zetterberg H , Marcusson J ((2012) ) CSF-biomarkers in Olympic boxing: Diagnosis and effects of repetitive head trauma. PLoS One 7: , e33606. |
[21] | Zetterberg H , Winblad B , Bernick C , Yaffe K , Majdan M , Johansson G , Newcomb V , Nyberg L , Sharp D , Tenovui O , Blennow K ((2019) ) Head trauma in sports - clinical characteristics, epidemiology and biomarkers. J Intern Med 285: , 624–634. |
[22] | Hernandez MA , Avila J , Andreu JM ((1986) ) Physicochemical characterization of the heat-stable microtubule-associated protein MAP2. Eur J Biochem 154: , 41–48. |
[23] | Barthélemy NR , Mallipeddi N , Moiseyev P , Sato C , Bateman RJ ((2019) ) Tau phosphorylation rates measured by mass spectrometry differ in the intracellular brain vs. extracellular cerebrospinal fluid compartments and are differentially affected by Alzheimer’s disease. Front Aging Neurosci 11: , 121. |
[24] | Zheng-Fischhofer QY , Biernat J , Mandelkow EM , Illenberger S , Godemann R , Mandelkow E ((1998) ) Sequential phosphorylation of tau by glycogen synthase kinase-3beta and protein kinase A at Thr212 and Ser214 generates the Alzheimer-specific epitope of antibody AT100 and requires a paired-helical-filament-like conformation. Eur J Biochem 252: , 542–52. |
[25] | Meredith JE , Sankaranarayanan S , Guss V , Lanzetti AJ , Berisha F , Neely RJ , Slemmon JR , Portelius E , Zetterberg H , Blennow K , Soares H , Ahlijanian M , Albright CF ((2013) ) Characterization of novel CSF Tau and pTau biomarkers for Alzheimer’s disease. PLoS One 8: , e76523. |
[26] | Barthelemy NR , Fenaille F , Hirtz C , Sergeant N , Schraen-Maschke S , Vialaret J , Buee L , Gabelle A , Junot C , Lehmann S , Becher F ((2016) ) Tau protein quantification in human cerebrospinal fluid by targeted mass spectrometry at high sequence coverage provides insights into its primary structure heterogeneity. J Proteome Res 15: , 667–676. |
[27] | Cicognola C , Brinkmalm G , Wahlgren J , Portelius E , Gobom J , Cullen NC , Hansson O , Parnetti L , Constantinescu R , Wildsmith K , Chen H , Beach TG , Lashley T , Zetterberg H , Blennow K , Hoglund K ((2019) ) Novel tau fragments in cerebrospinal fluid: Relation to tangle pathology and cognitive decline in Alzheimer’s Disease. Acta Neuropathol 137: , 279–296. |
[28] | Janelidze S , Stomrud E , Smith R , Palmqvist S , Mattsson N , Airey DC , Proctor NK , Chai X , Shcherbinin S , Sims JR , Triana-Baltzer G , Theunis C , Slemmon R , Mercken M , Kolb H , Dage JL , Hansson O ((2020) ) Cerebrospinal fluid p-tau217 performs better than p-tau181 as a biomarker of Alzheimer’s disease. Nat Commun 11: , 1683. |
[29] | Wagshal D , Sankaranarayanan S , Guss V , Hall T , Berisha F , Lobach I , Karydas A , Voltarelli L , Scherling C , Heuer H , Tartaglia MC , Miller Z , Coppola G , Ahlijanian M , Soares H , Kramer JH , Rabinovici GD , Rosen HJ , Miller BL , Meredith J , Boxer AL ((2015) ) Divergent CSF tau alterations in two common tauopathies: Alzheimer’s disease and progressive supranuclear palsy. J Neurol Neurosurg Psychiatry 86: , 244–250. |
[30] | Palmqvist S , Insel PS , Stomrud E , Janelidze S , Zetterberg H , Brix B , Eichenlaub U , Dage JL , Chai X , Blennow K , Mattsson N , Hansson O ((2019) ) Cerebrospinal fluid and plasma biomarker trajectories with increasing amyloid deposition in Alzheimer’s Disease. EMBO Mol Med 11: , e11170. |

