
Abnormalities of DYRK1A-Cytoskeleton Complexes in the Blood Cells as Potential Biomarkers of Alzheimer’s Disease
Abstract
Background:
DYRK1A is implicated in mental retardation and Alzheimer’s disease (AD) dementia of Down syndrome (DS) individuals. The protein is associated with cytoskeleton and altered expression has been shown to impair the cytoskeletal network via dosage effect.
Objective:
Our original observations of marked reduction of cytoskeletal proteins associated with DYRK1A in brains and lymphoblastoid cell lines from DS and AD prompted an investigation whether cytoskeleton abnormalities could potentially be used as biomarkers of AD.
Methods:
Our assay relied on quantification of co-immunoprecipitated cytoskeletal proteins with DYRK1A (co-IP assay) and analysis of the profile of G- and F-actin fractions obtained by high-speed centrifugations (spin-down assay).
Results:
In co-IP assay, both DS and AD samples displayed reduced abundance of associated cytoskeletal proteins. In spin-down assay, G-actin fractions of controls displayed two closely spaced bands of actin in SDS-PAGE; while in AD and DS, only the upper band of the doublet was present. In both assays, alterations of actin cytoskeleton were present in DS, sporadic and familial AD cases, and in asymptomatic persons who later progressed to confirmed AD, but not in non-AD donors. In blind testing involving six AD and six controls, the above tests positively identified ten cases. Analysis of blood samples revealed the diversity of mild cognitive impairment (MCI) cases regarding the presence of the AD biomarker allowing distinction between likely prodromal AD and non-AD MCI cases.
Conclusions:
Both brain tissue and lymphocytes from DS and AD displayed similar semi-quantitative and qualitative alterations of actin cytoskeleton. Their specificity for AD-type dementia and the presence before clinical onset of the disease make them suitable biomarker candidates for early and definite diagnosis of AD. The presence of alterations in peripheral tissue points to systemic underlying mechanisms and suggests that early dysfunction of cytoskeleton may be a predisposing factor in the development of AD.
INTRODUCTION
DYRK1A (Dual specificity Tyrosine (Y) phosphorylation-Regulated Kinase 1A), the mammalian ortholog of Drosophila minibrain gene (Mnb), encodes a proline-directed serine/threonine kinase. The gene is located on chromosome 21 in the Down syndrome (DS) critical region and has been identified as an important factor contributing to intellectual disability, microcephaly, and Alzheimer’s disease (AD)-type dementia, the main features of the DS phenotype [1, 2]. The key functions of DYRK1A such as control of neuroplasticity, neurite formation, dendritogenesis, and synaptogenesis are all affected by trisomic levels of this kinase resulting in neuronal defects observed in patients with DS [3, 4]. The downregulation of DYRK1A due to truncating mutations, intragenic deletions of DYRK1A gene [5–10], or partial monosomy of chromosome 21 containing the DYRK1A locus [11–14], also produce disease phenotypes very similar to those of DS patients. To date, 52 patients carrying different genetic defects in DYRK1A gene have been identified [15], and they all shared primary or acquired microcephaly, intellectual disability, developmental delay, speech impairment, and distinct facial features, hallmarks of the developmental syndrome termed mental retardation autosomal dominant 7 (MRD7). In all reported MRD7 cases, DYRK1A haploinsuffiency was the sole cause of those clinical features, pointing to the crucial role of maintaining dosage balance of this gene for normal development and function of the central nervous system (CNS).
DYRK1A binds or phosphorylates numerous proteins [16] and it participates in multiple biological pathways, but the molecular mechanism underlying those different functions is largely unknown. Accumulating evidence links some of its biological activity to regulation of the cytoskeleton [17–20]. Overexpression of DYRK1A in trisomic TgDYRK1A mice was shown to cause alterations in actin dynamic through increased stability of actin filaments [17]. Various DYRK family members in primary neurons can profoundly influence neuronal morphology implicating DYRKs in the regulation of cytoskeletal organization and neuronal process outgrowth [18]. Specifically, DYRK1A was demonstrated to negatively regulate actin cytoskeleton through phosphorylation of Neural-Wiskott-Aldrich syndrome protein (N-WASP), a regulator of actin polymerization and dynamics [19]. Furthermore, the function of DYRK1A appears to be conserved in evolution; parallel RNAi screens in Drosophila cell lines identified Mnb as a regulator of the actin-based protrusions specifically in CNS-derived cell lines [20]. We have previously shown that DYRK1A is associated with cytoskeleton in a gene dosage-sensitive manner [21]. Both the brain tissue and immortalized lymphocytes of DS patients displayed a significant reduction in the yield of all major cytoskeletal proteins co-immunoprecipitated with DYRK1A antibodies. This reduction consistently distinguished healthy from DS donors and seems to be specific for DS since it was not present in lymphoblastoid culture samples of Fragile X and unclassified mental retardation cases. Of special interest are our findings in DS lymphocytes attesting to systemic features of DS phenotype. One of those features could be AD-type dementia, a highly prevailing condition in aging DS patients. Lymphoblastoid cell lines (LCLs) derived from blood collected from patients are often employed in the search of novel biomarkers of AD [22]. This prompted us to investigate whether our findings in DS lymphocytes can be reproduced in LCLs established from AD donors. If this is the case, then lymphocytes from DS and AD patients may serve as a unique cellular model of the disease and, possibly, as a diagnostic tool for identifying or confirming AD. In this study, we report the results of semi-quantitative (co-immunoprecipitation) and qualitative (Globular and Filamentous-actin fractionation) analyses of cytoskeletal changes in LCLs from familial (FAD) and sporadic (SAD) AD cases. Cellular actin exists in two forms: globular monomer (G-actin) and filamentous polymers (F-actin). The ratio of G- to F-actin is dynamically regulated. The changes are the same in DS and AD, specific for AD-type dementia as compared with Lewy body disease (LBD) and frontotemporal lobe dementia (FTLD) subjects, making them suitable candidates for biomarkers of AD. We then show in a small blind experiment that the cytoskeletal changes in LCLs can be used to differentiate AD from normal controls with reasonable success. We also demonstrate that our assay can also be used to further stratify clinically diagnosed mild cognitive impairment (MCI) based on the presence of cytoskeletal changes in peripheral mononuclear blood cells (PMBC).
MATERIALS AND METHODS
Brain tissue
Frozen brain tissue was obtained from the Brain and Tissue Bank for Developmental Disabilities and Aging of the Institute for Basic Research (IBR Brain Bank). Each group (Control, DS, and AD) consisted of six subjects representing both sexes and multiple ethnicities. Diagnosis of DS cases was genetically confirmed. All AD patients were clinically classified as severely demented and postmortem diagnosed as AD. Procedures involving human brain tissue were performed in accordance with the Declaration of Helsinki. Experimental protocols were approved by the Institutional Review Board of the NYS Institute for Basic Research in Developmental Disabilities.
Lymphoblastoid cell lines
EBV-immortalized LCLs of control, AD, LBD, and FTLD were obtained from the Coriell Cell Depositories (Camden, NJ). One control, all six DS, and four Fragile X cell lines were established in the Department of Human Genetics of our Institute. The full list of LCLs used in the study is given in Table 1.
Table 1
Lymphoblastoid cell lines used in the study
| Controls | Donor’s Age | AD | Donor’s Age | DS | Donor’s Age | Fragile X | Donor’s Age | FTLD | Donor’s Age | LBD | Donor’s Age |
| GM06981 | 13 | SAD | DS405 | 48 | FraX3966 | 19 | ND02380 | 42 | ND05070 | 73 | |
| GM07041 | 31 | AG21159 | 69 | DS68 | 55 | FraX3537 | 18 | ND08074 | 61 | ||
| GM07045 | 39 | AG08242 | 72 | DS206 | 57 | FraX3538 | 14 | ||||
| GM07048 | 43 | AG08244 | 75 | DS971 | 59 | FraX3908 | unknown | ||||
| AG09387 | 43 | AG06868 | 60 | DS211 | 60 | ||||||
| AG08378 | 60 | AG06204 | 67 | DS433 | 60 | ||||||
| GM03657 | 68 | AG08258 | 90 | ||||||||
| IBR3678 | 14 | FAD | |||||||||
| ND05071 | 56 | AG11755 | 85 | ||||||||
| ND08075 | 61 | AG08744 | 35 | ||||||||
| AG08702* | 30 | AG08710* | 34 | ||||||||
| AG11009** | 91 | AG10987** | 74 |
All control, except IBR3678, AD, LBD, and FTLD cell lines were from Coriell Cell Repositories (Camden, NJ). All DS and Fragile X cell lines were established at the NYS Institute for Basic Research in Developmental Disabilities (Staten Island, NY). *Denotes a pair of an asymptomatic PS1 mutation carrier (AG08710) and his apparently healthy cousin (AG08702). **Denotes a pair of siblings from AD family one of whom is affected (AG10987) and the other (AG11009) is a probable escapee from AD.
In addition, frozen cell pellets of three FAD and three SAD LCLs, each with age-matched control, were prepared at the Laboratory of Preclinical Testing of Higher Standard of the Nencki Institute from individuals enrolled at the Alzheimer’s Disease Division, Neurology Clinic of the Central Clinical Hospital of the Ministry of Interior (MSWiA) in Warsaw, Poland. Diagnostics, blood collection, EBV-immortalization of lymphocytes and their culture were performed as described earlier [23]. AD diagnosis was based on the NIA-AA criteria [24]. Three subjects were diagnosed as FAD based on the presence of mutation in PS1 gene as demonstrated either by RT-PCR or genomic DNA analysis. All control subjects were non-demented with no clinical signs of neurological and/or psychiatric diseases, and with normal cognitive and neuropsychological test results. Characteristics of the donors of those cell lines are given in Table 2.
Table 2
LCLs from Nencki Institute, Poland, Used in the Blind Experiments
| Code | Cell line | Donor’s Age | Age of AD Onset | Known Mutation | Correctly Diagnosed |
| 1 | 129S (SAD) | - | 48 | - | No |
| 2 | 309F (FAD) | 48 | 43 | PS1E318G | Yes |
| 3 | 149K (F-CTR) | 35 | - | - | Yes |
| 4 | 408K (S-CTR) | 66 | - | - | Yes |
| 5 | 412K (S-CTR) | 66 | - | - | Yes |
| 6 | 475K (S-CTR) | 66 | - | - | Yes |
| 7 | 145K (F-CTR) | 38 | - | - | No |
| 8 | 337S (SAD) | 63 | 63 | - | Yes |
| 9 | 110S (SAD) | 64 | 57 | - | Yes |
| 10 | 355F (FAD) | 38 | 33 | PS1I213F | Yes |
| 11 | 660K (F-CTR) | 42 | - | - | Yes |
| 12 | 646F (FAD) | 40 | 40 | PS1L153V | Yes |
Cell lines from three FAD and three SAD cases, each with age-matched control (F-CTR and S-CTR represent controls for FAD and SAD, respectively), were analyzed. Fifteen up to twenty millions of cells were harvested from suspension cultures and stored as pellets at –20°C until shipment. Cells were shipped on ice in the encoded tubes and upon arrival, frozen and stored at –20°C until use. Samples were analyzed by immunoprecipitation and G-/F-actin fractionation assays.
Lymphocyte cultures were maintained in RPMI 1640 medium supplemented with 10% fetal bovine serum and a mixture of penicillin and streptomycin. All culture media and supplements were purchased from Mediatech, Inc. (Manassas, VA). Cells after harvest were washed three times in cold PBS and stored as dry pellet at –20°C until use.
Peripheral blood mononuclear cells
PBMC were isolated using a standard Ficoll-Paque protocol from blood collected from patients with SAD or with MCI due to AD at prodromal AD phase who were enrolled at the Alzheimer’s Disease Clinic at MSWiA in Warsaw, Poland. The diagnosis was performed according to NIA-AA criteria [24, 25] and involved detailed medical, neuropsychological, neurological, and psychiatric examinations. The AD diagnosis was supported by cerebrospinal fluid (CSF) ELISA assays (Innogenetics, Gent, Belgium) of standard markers: Aβ42, total tau protein (t-tau), and phosphorylated form of tau (p-tau, INNOTEST®PHOSPHO-TAU 181p). Cut-off values for CSF markers were as described previously [26]. Age- and sex-matched control individuals for the study were recruited from non-demented individuals presented at the Alzheimer’s Disease Clinic at MSWiA. The exclusion criteria for the control group included family history of AD, the potential AD risk factor, and other serious medical conditions that might influence cognition, such as depressive symptoms, previous diagnosed psychiatric disorders, and alcohol or drug abuse [26]. Postmortem blood sample of a 65-year-old DS patient was also included. White blood cells from this sample were isolated by first lysis of red blood cells in ACK lysis buffer (0.15 M NH4Cl, 10 mM KHCO3, and 0.1 mM EDTA) according to the protocol described by the manufacturer (ThermoFisher Scientific).
Ethic statement
All study protocols were approved by the Ethics Committee for studies on Human Subjects at the MSWiA Hospital in Warsaw (Agreement no. 89/2014) according to the National and European Union legislation, and the Code of Ethical Principles for Medical Research Involving Human Subjects of the World Medical Association. Peripheral blood and CSF samples were collected from all subjects after obtaining written informed consent for participation in the study.
Antibodies
Rabbit polyclonal anti-DYRK1A (H143, C-terminus) and goat polyclonal anti-HSP90 antibodies were obtained from Santa Cruz Biotechnology (Dallas, TX). The R420 rabbit polyclonal antibody targeting isoform 2 of DYRK1A was developed and produced at IBR [27]. For detection of DYRK1A on immunoblots, mouse monoclonal antibody 8D9 (Millipore-Sigma, Burlington, MA) was used [28, 29]. Mouse monoclonal antibodies (anti-β-actin clone AC-15, anti-α-tubulin clone B-5-1-2, and anti-neurofilament 200 clone N52) were from Sigma-Aldrich (St. Louis, MO). Anti-β-actin rabbit polyclonal antibody was purchased from Cytoskeleton, Inc (Denver, CO). Rabbit polyclonal anti-α-tubulin antibody was obtained from ThermoFisher Scientific.
Preparation of brain and lymphocyte lysates
Frozen dissected frontal cortex tissue was mortar ground in liquid nitrogen. Pools were made by mixing 0.1 g of powdered tissue from each subject. 100 mg of pooled tissue was lysed in 1 ml of ice-cold RIPA buffer (1×PBS, pH 7.4, 1% of NP-40, 0.1% of SDS, and 0.5% sodium deoxycholate) containing Complete protease inhibitors (Roche, Indianapolis, IN) and 200 nM of okadaic acid. After short-pulse sonication, lysates were clarified by microfuge centrifugation at 14,000 rpm for 10 min and protein concentrations were determined by bicinchoninic acid assay (BCA) (ThermoFisher Scientific). Preparation of lymphocytes lysates was essentially the same as brain lysates: 2×10⁷ frozen cells were thawed on ice and lysed in 1 ml of RIPA buffer supplemented with OA and Complete protease inhibitors, followed by short-pulse sonication. Lysates were clarified by centrifugation and protein concentration determined by BCA assay.
Immunoprecipitation (IP) and immunoblotting
To reduce the non-specific binding, lysates were pre-cleared by incubation with Invitrogen DYNAL Dynabeads Protein G (ThermoFisher Scientific). For IP of brain tissue and lymphocytes, total proteins of 1 mg and 500μg, respectively, were mixed with Dynabeads primary antibody conjugates, which were prepared by binding 2–4μg of the antibody to 50μl of beads suspension. Antibodies used for IP were either H-143 or R420 for DYRK1A, AC-15 for β-actin, and B-5-1-2 for α-tubulin. Samples were incubated at 4°C with rotation overnight. Using the magnet, the complexes were washed three times with 0.5 ml of RIPA buffer. After the final wash, samples were eluted by boiling for 5 min in 50μl of 1×tricine sample buffer (Bio-Rad, Hercules, CA). Samples were electrophoresed in 8% tricine SDS-polyacrylamide gels and semi-dry transferred onto PVDF membranes (Bio-Rad). The membranes were blocked with 5% nonfat milk or Pierce protein-free blocking buffer (ThermoFisher Scientific) and incubated overnight at 4°C with appropriate dilution of primary antibody. The immunoreactive bands were visualized using anti-IgG alkaline phosphatase-conjugated secondary antibody (Sigma-Aldrich) and CDP-Star chemiluminescence reagent (New England Biolabs, Ipswitch, MA). After chemiluminescence detection, blots were further developed by color reaction using BCIP/NBT (5-bromo-4-chloro-3-indolyl-phosphate/nitro blue tetrazolium) substrate (Sigma-Aldrich).
Fractionation of lymphocytes: G-/F-actin spin-down assay
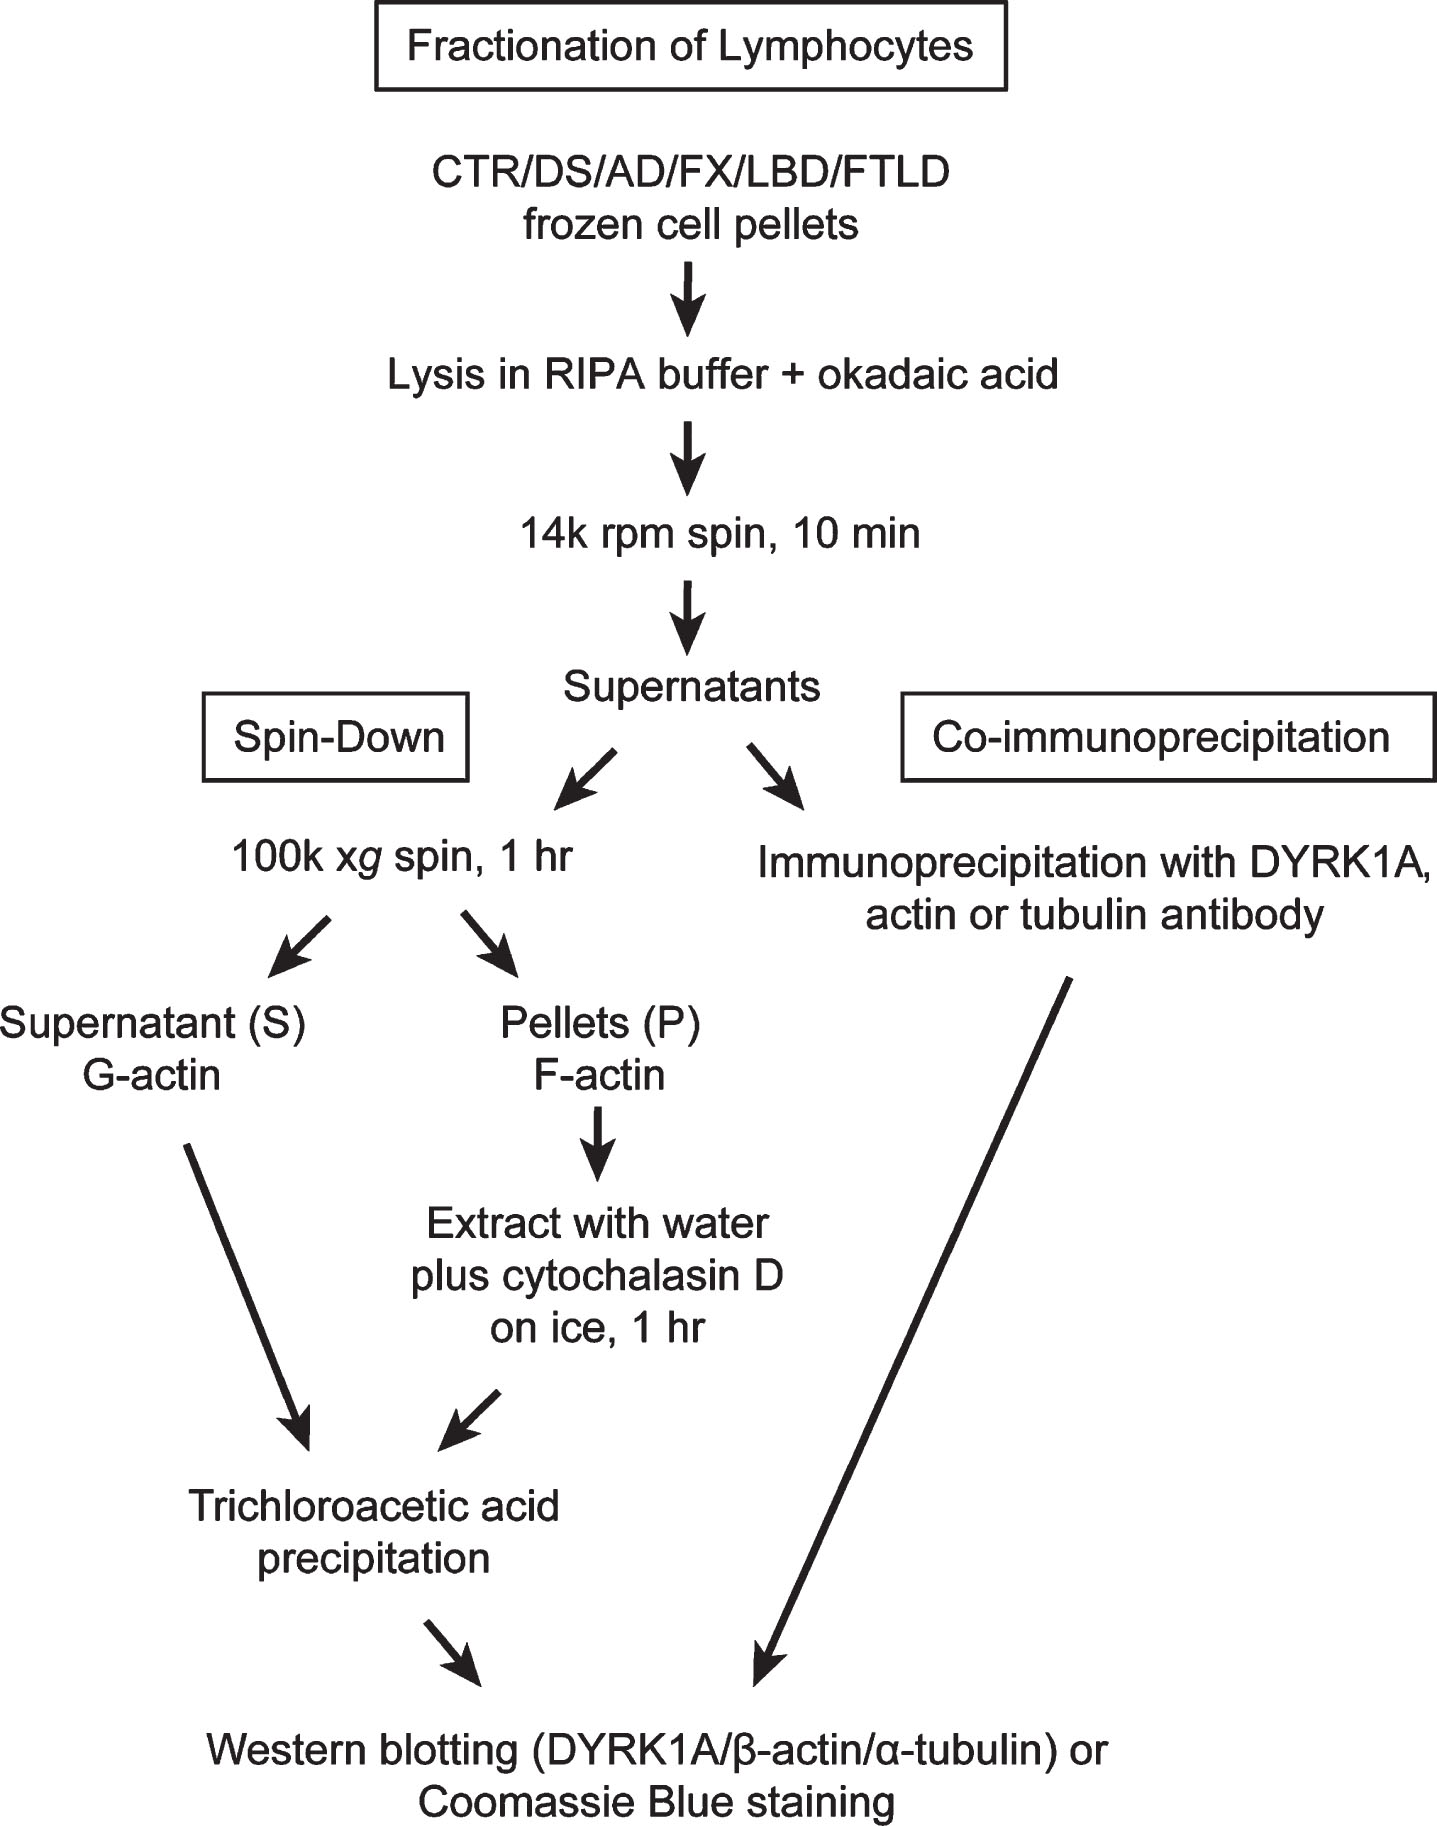
Lysates prepared as described above were subjected to high-speed centrifugation: 150μg of total protein, usually between 100–150μl of the lysate, were spun at 100,000×g (50,000×rpm, TLC 100 rotor) for 1 h at 4°C in a Beckman Tabletop Ultra centrifuge. Supernatants (G-actin) and pellets (F-actin) were collected separately and placed on ice. Pellets were re-suspended in 100μl of ice-cold water with 10μM cytochalasin D, and incubated on ice for 1 h with occasional stirring by pipetting. Supernatants and pellet extracts were subsequently precipitated with 10% trichloroacetic acid (TCA) as follows: 10 min on ice, followed by centrifugation on a benchtop centrifuge for 5 min (14000 rpm), then by washing in cold acetone. Samples were left to dry overnight at 4°C. Precipitates of supernatants (S) and pellets (P) were re-suspended in 120μl and 100μl of 1×tricine sample buffer, respectively. To improve solubility of S samples short pulse sonication was applied. All samples were boiled for 10 min before loading on to 8% tricine SDS-polyacrylamide gel or NuPAGE™ 4-12% Bis-Tris gel (ThermoFisher Scientific). For better detection of differences in electrophoretic mobility of actin bands in PBMC samples (Fig. 6), samples were run on longer 8% tricine gels with extended duration (10×10 cm, 105 V, 150 min). Western blot analysis of DYRK1A, α-tubulin, and β-actin was carried out as described above. To visualize all protein bands, gels were stained with Coomassie blue. Flow chart in Fig. 1 summarizes all steps leading to obtaining G- and F-actin enriched fractions and samples for IP. Actin patterning conversion was performed by incubating RIPA lysate prepared from control subjects in the presence of 1 mM ATP and 2 mM MgCl2 at 37°C for 15 min. Untreated mock lysate was similarly prepared except without the addition of ATP and MgCl2. Incubated lysates were then subjected to the spin-down assay exactly as described above.
Fig.1
Fractionation of lymphocytes: Flow chart depicting steps leading to obtaining G- and F-actin enriched fractions and samples for immunoprecipitation.
Data analysis
The densitometric quantification of immunoreactive bands was carried out with 1D Scan EX 3.1 software program (Scanalytic Corp., Rockville, MD). The results were evaluated for statistical significance with the 2-tailed Student t-test for independent samples using GraphPad Prism version 4 software program (GraphPad Software, Inc., San Diego, CA). Difference with p < 0.05 was considered significant and marked.
RESULTS
DS and AD subjects display reduced abundance of cytoskeletal proteins co-immunoprecipitated (co-IP) with DYRK1A antibody
Brain tissue
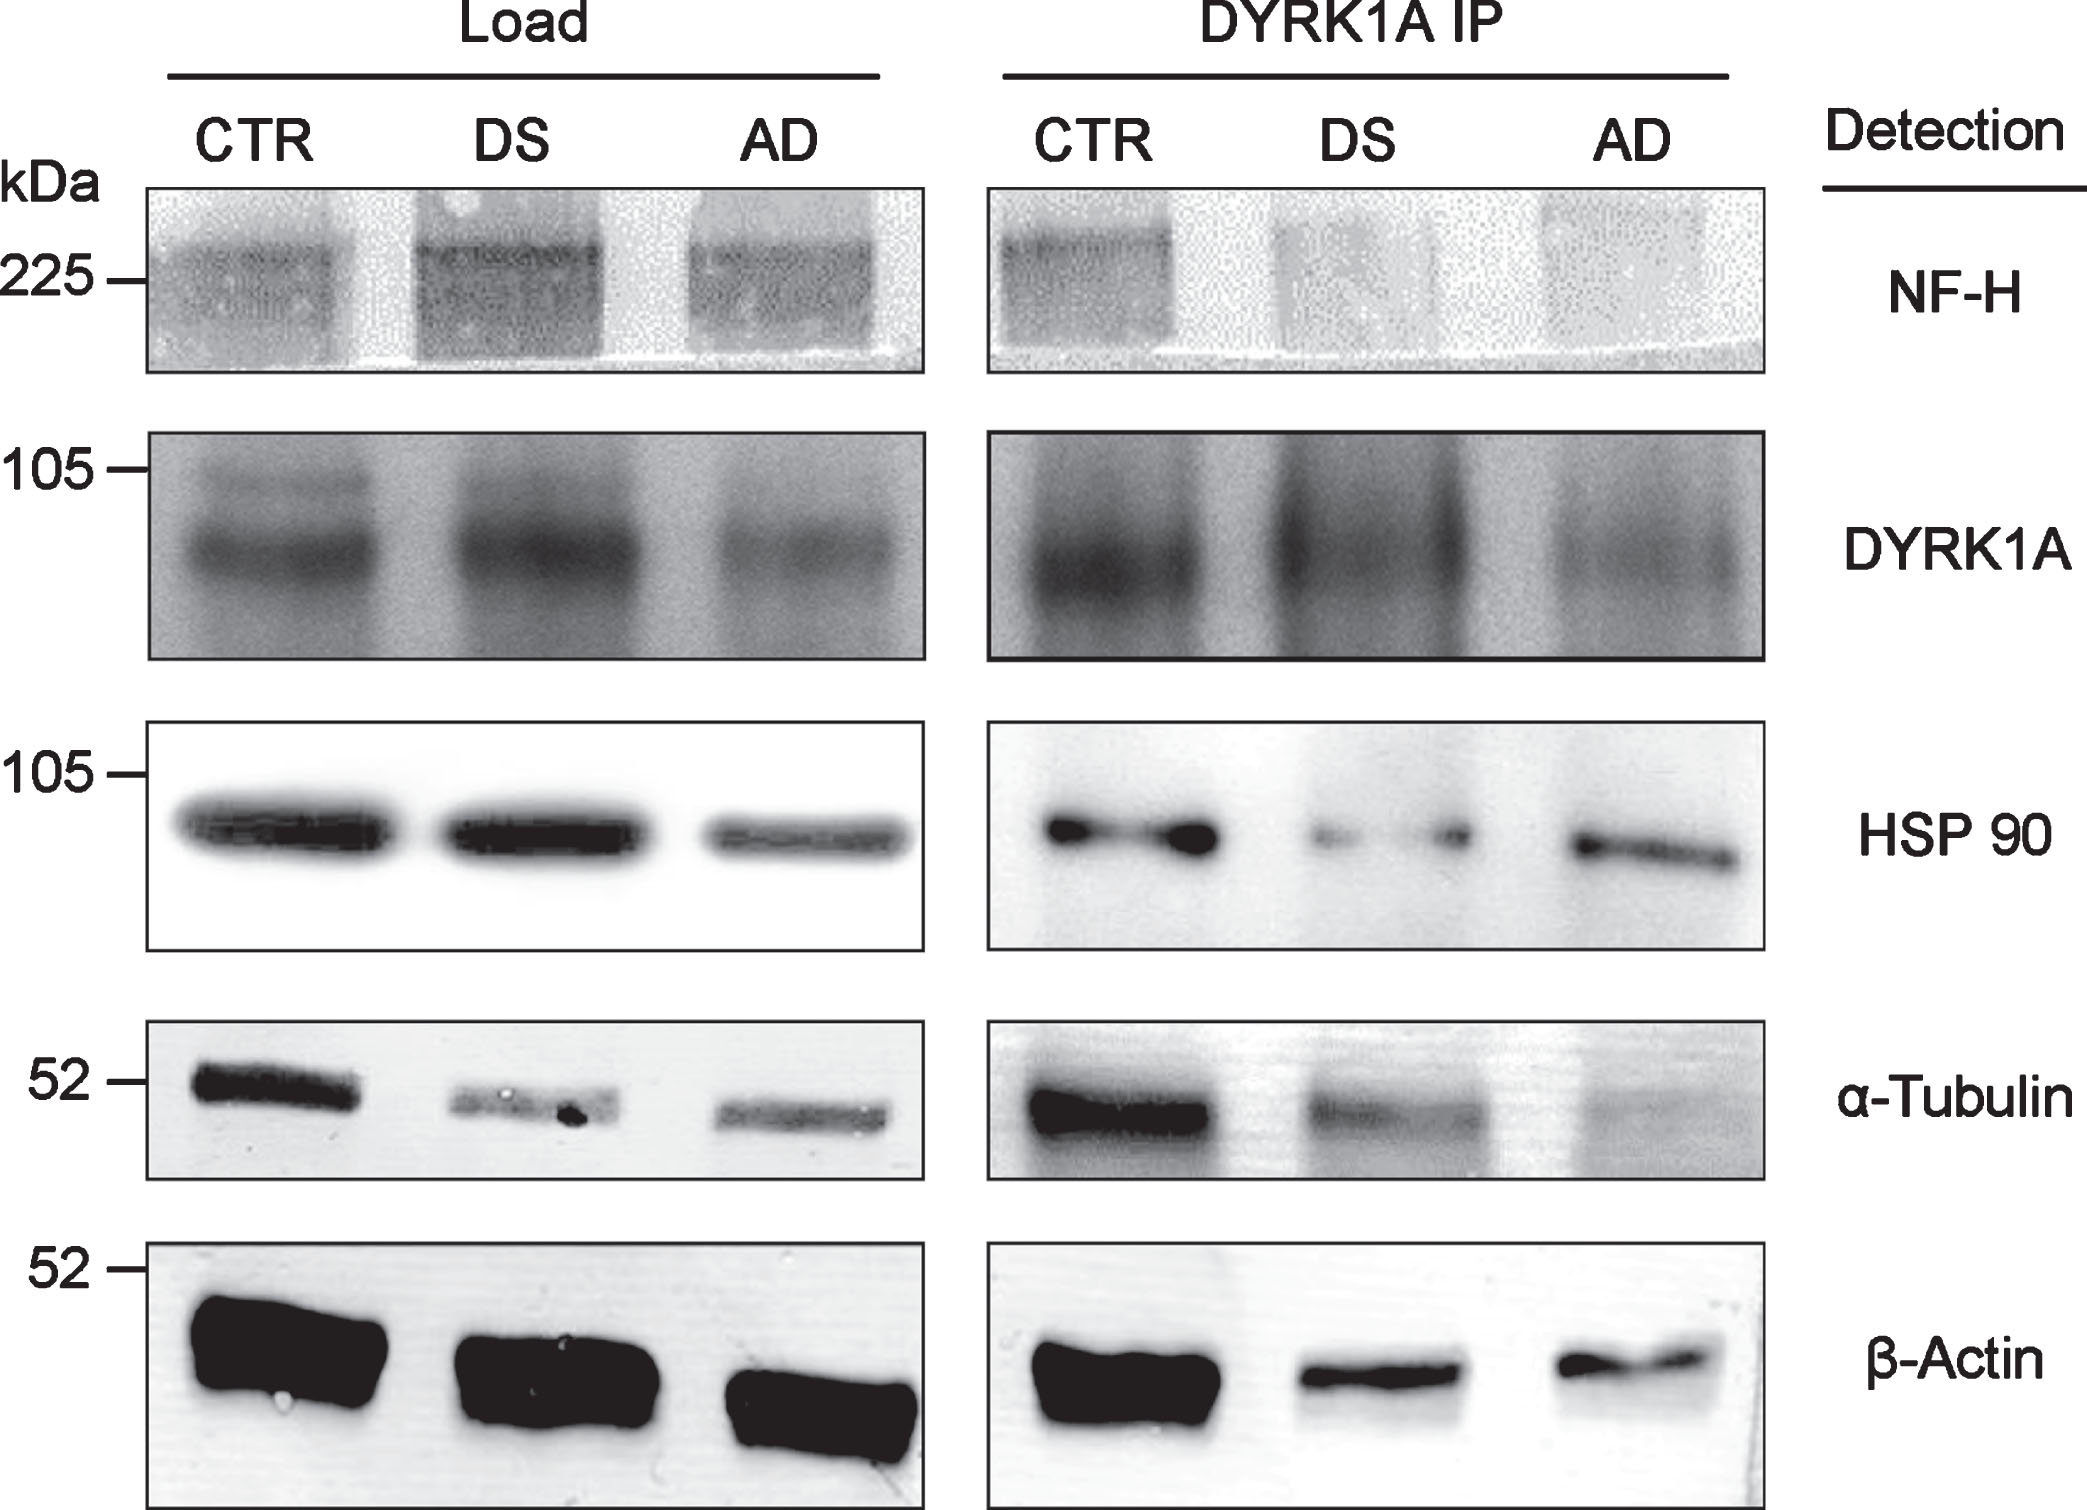
DYRK1A is associated with cytoskeleton, as shown by co-IP of all major cytoskeletal proteins with anti-DYRK1A antibodies in the brain tissue (Fig. 2). Apparently, DYRK1A is a part of the large complex involving all major structural cytoskeletal components and other auxiliary proteins, like HSP90. DYRK1A co-IP assay of pooled frontal cortex tissue of control, DS, and AD subjects, revealed a marked reduction in the yield of this complex in pathological brains. Both DS and AD brains displayed similar patterns of reduction, which seems to be specific for DS/AD since they were not present in three unrelated mental retardation cases (data not shown). Among DS, AD, and controls, the levels of DYRK1A were highest in DS and lowest in AD, suggesting that the reduced formation of DYRK1A-cytoskeleton complexes may be linked to abnormal levels of this kinase. As demonstrated by our studies in DS [21], DYRK1A action on cytoskeleton is regulated by an enzyme-dosage sensitive mechanism. Of special attention is the electrophoretic patterning of actin bands in immunoprecipitates. In control, actin appears as a doublet of closely spaced bands while in DS/AD, only the upper band of the doublet is present. This actin patterning was another distinctive feature of DS/AD pathological brains, which emerged as a potential diagnostic marker of AD.
Fig.2
Co-IP of cytoskeletal proteins with DYRK1A. RIPA lysate, prepared from the pooled samples of frontal cortex of six individuals, was IP with anti-DYRK1A antibody (H143) and the immunoprecipitates were subsequently analyzed by immunoblotting for the cytoskeletal proteins indicated as described in the Materials and Methods.
Lymphoblastoid cell lines
Availability of LCLs established from DS and AD donors allowed us to investigate whether the diseased status confers similar cytoskeleton alterations in peripheral cell lines. All cases were carefully selected to have well-stratified representation of sporadic and familial AD and other neurodegenerative disorders. Accordingly, twelve controls and ten AD cases, of different age and gender, including SAD and FAD, were chosen. These included a pair containing an asymptomatic PS1 mutation carrier and her healthy cousin, and a pair of siblings from AD family, one of whom is affected, but at the time of sampling had no symptoms, and the second one probably an escapee from AD. LCLs from DS donors were represented by six cases. Three cases of non-AD neurodegenerative dementia: two LBD and one FTLD were also included. Neurological disorders other than neurodegenerative dementia were represented by four Fragile X cases. The full list of cases is presented in Table 1.
Analysis of LCLs started with measuring the levels of DYRK1A protein in crude lysates. As shown in Fig. 3A, which depicts results for three controls, one DS, and four AD cases, the levels of DYRK1A in all AD lysates were considerably lower compared to controls. SAD, FAD, and asymptomatic PS1 mutation carrier (PS1as), all displayed similar reduction. In DS lysate, as expected from triplication of the gene, the levels of DYRK1A were accordingly higher. We subsequently analyzed the changes of DYRK1A and cytoskeletal proteins in pooled samples of control, DS, and AD donors to eliminate an effect of single case outliers (Fig. 3E–H). The differences were also reproduced in lysates of pooled controls, DS, and AD, as shown in Fig. 3E, where DYRK1A levels compared to controls were enhanced by 39% in DS, while those in AD were reduced by 42%. Those results closely reproduce findings from the brain tissues demonstrating that abnormal levels of DYRK1A are maintained in peripheral tissue of subjects with AD-type dementia.
Fig.3
Co-IP analysis of DYRK1A-cytoskeleton complexes in lymphoblastoid cell lines (LCLs). A) The levels of DYRK1A and β-actin in crude lysates. RIPA lysates prepared from each test sample were probed for DYRK1A and β-actin by immunoblotting as described in the Materials and Methods. B) Analysis of β-actin co-IP with DYRK1A. RIPA lysates were IP with anti-DYRK1A antibody (R420) and the precipitates were then probed for DYRK1A and β-actin. Mouse anti-rabbit IgG antibody was included with anti-β-actin antibody in immunoblotting as the internal loading control for quantifying precipitates. IgG marks the band of rabbit IgG from antibody R420. C) Analysis of β-actin co-IP with DYRK1A in an individual with asymptomatic carrier PS1 mutation and her normal cousin. Experiments were performed similarly as described in (B). D) Reciprocal analysis of DYRK1A co-IP with β-actin. IP was conducted with anti-β actin antibody with lysates prepared from test samples and then analyzed for DYRK1A similarly as described above in (B). E) The levels of DYRK1A and β-actin in pooled lysates. Each pool was prepared from four distinct cases and analyzed as described in (A). The relative ratio of DYRK1A and β-actin in DS and AD to that of the control was plotted. Control (100%) was indicated by a dotted line. Difference to the control with statistical significance at the level of p < 0.05 was marked with asterisk. F) Quantification of β-actin co-IP with DYRK1A in pooled lysates. Co-IP experiments were conducted with pooled samples similarly as described in (B). The relative ratio of DYRK1A and β-actin in DS and AD was quantified similarly as described in (E). G) Quantification of β-actin and α-tubulin IP and co-IP in pooled samples. Pooled samples were first IP using either anti-β actin or anti-α-tubulin antibody and the precipitates were then analyzed for IP and co-IP with the congruent and the counter rabbit polyclonal antibody, respectively. The plots shown are the ratio of actin and tubulin IP and co-IP in AD relative to that of the control. H) Quantification of β-actin co-IP with α-tubulin in pooled lysates. Pooled samples were first IP using anti-α-tubulin and then analyzed for α-tubulin and β-actin as described in (F). The relative ratio of β-actin and α-tubulin in DS and AD was presented.
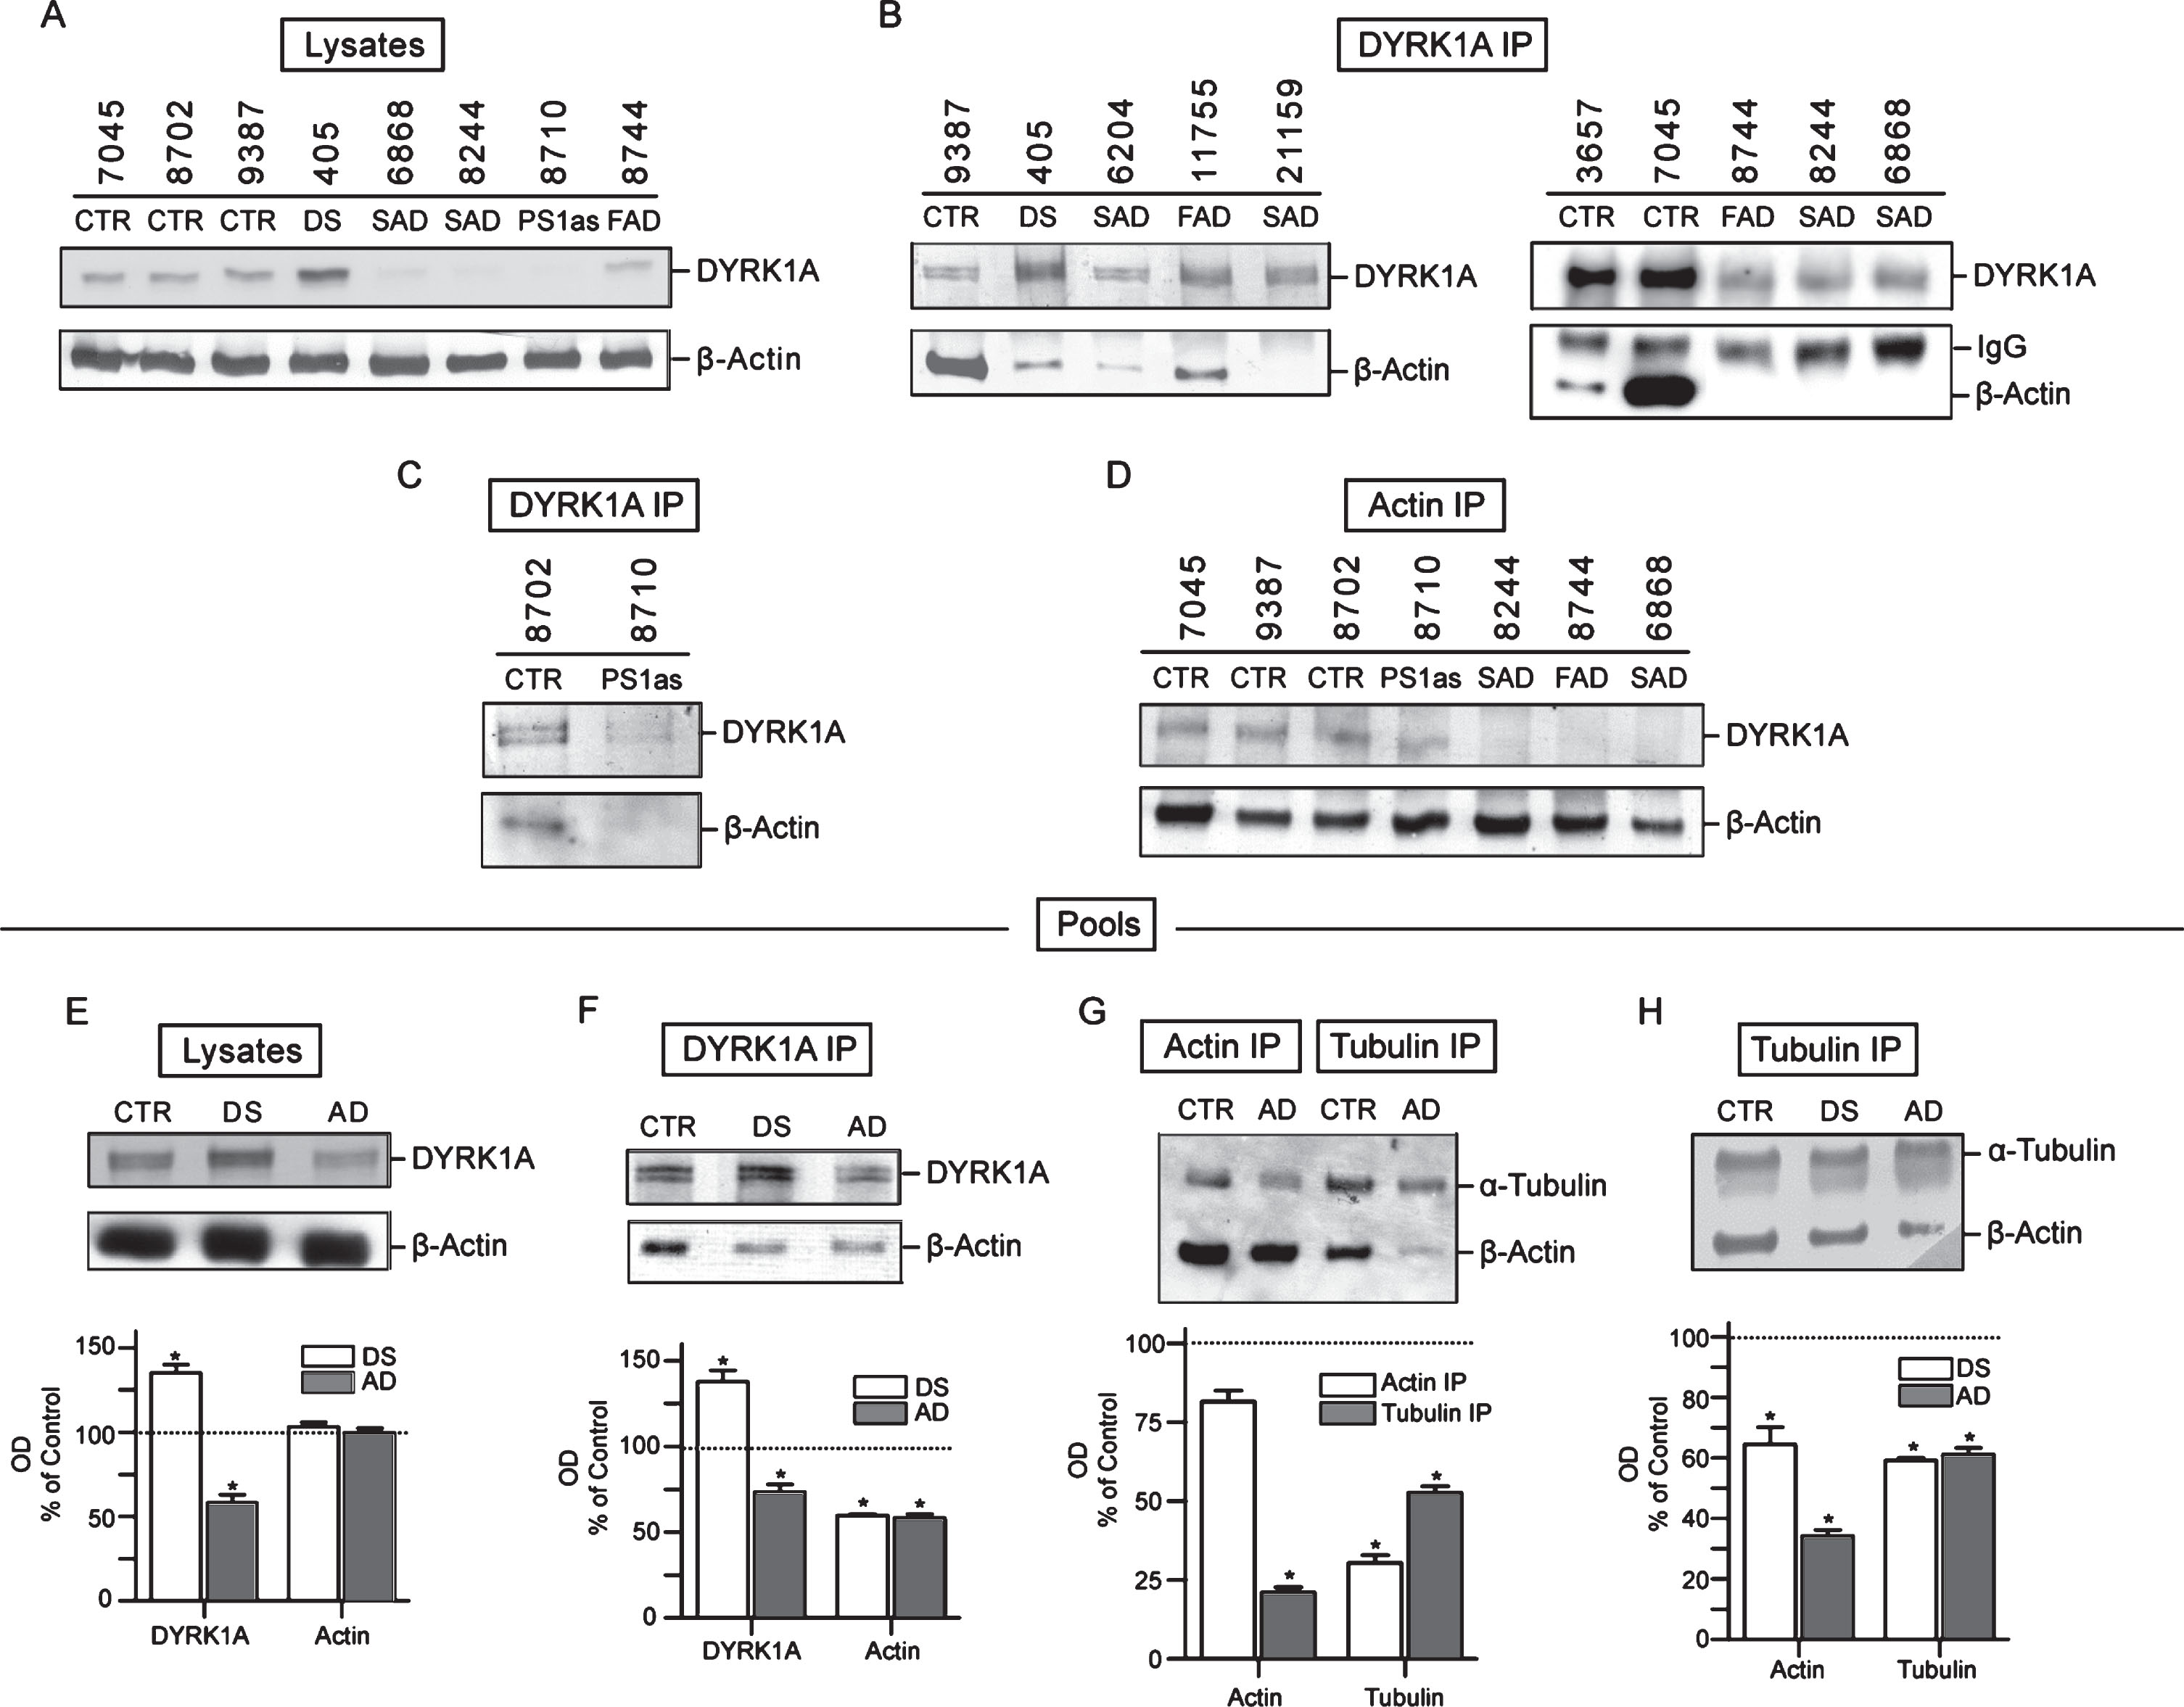
IP experiments were carried out on each cell lines individually and on the pools prepared from several controls, DS, and AD. Although DYRK1A was found to be part of a large complex containing three main cytoskeleton networks with preserved proportionality of all components (see Fig. 2), we focused on the yield and electrophoretic patterning of actin, which displayed easily detectable and consistent changes. Immunoblotting profiles of DYRK1A IP of seven AD, including five SAD, one FAD, one asymptomatic case (at the time of sampling), together with controls, are shown in Fig. 3B and 3C. In all AD samples, actin co-IP yield was significantly reduced. In some samples, there was no apparent actin at all. To rule out the possibility that the observed reduction of actin was caused by loading error, those samples were also probed with anti-rabbit IgG antibody to detect the rabbit anti-DYRK1A IgG (R420) used for IP. The resulting consistent signal of the IgG bands indicates that the loading of the IP complexes was quite even and thus the failure to detect actin cannot be attributed to this technical error. The marked reduction of actin in DYRK1A IP complexes was also seen in an asymptomatic PS1 mutation carrier indicating that AD-associated cytoskeleton abnormalities are present before clinical onset of the disease (Fig. 3C). Actin levels in controls were highly variable with subject 7045 having massively more actin than others. This variability does not seem to correlate with the amount of DYRK1A in those samples. Again, the levels of DYRK1A in AD samples, with some exceptions, were lower than that in controls. In this approach, both cytoskeleton-bound and unbound DYRK1A are detected, and therefore the amount of DYRK1A associated with cytoskeleton cannot be evaluated.
To assess the level of actin-associated DYRK1A, a reciprocal IP experiment with actin antibody was performed. As shown in Fig. 3D, there was indeed less DYRK1A associated with actin cytoskeleton in all AD samples, including the asymptomatic PS1 mutation carrier. This was in agreement with data obtained for crude lysates (Fig. 3A, DYRK1A panel). However, the most consistent finding distinguishing AD from healthy donors was the characteristic reduction in the yield of actin co-IP in AD. The changes were quantified in the pools of controls, DS, and AD donors (Fig. 3F). DYRK1A in DS was enhanced by up to 48% over control and that in AD was reduced by 22% versus control, while co-IP actin in both DS and AD was reduced by about 40% (Fig. 3F). Notably, both DS and AD displayed similar actin patterning, e.g., one band of actin as opposed to two bands in controls, which confirms the finding in the brain tissues (Fig. 2). The reduced abundance of other major cytoskeletal proteins could also be detected by targeting either actin or tubulin in co-IP experiments. This was revealed in actin and tubulin IPs of pools of controls and AD where the yield of actin and tubulin in immunoprecipitates was the measure of the abundance of associated cytoskeletons. As shown in Fig. 3G, both actin and tubulin in cross co-IP were markedly reduced in AD: actin by 80% in tubulin IP, and tubulin by 70% in actin IP. Tubulin was also reduced in tubulin IP by around 50% (including free tubulin). We repeated tubulin IP on pools of controls, DS, and another set of AD samples (Fig. 3H). Again, both DS and AD samples showed significantly lower yield of actin and tubulin. In DS, actin was decreased by 35% and in AD, by 68%. Reduction of tubulin in tubulin IP complexes was by 40% in both DS and AD. In summary, all immunoprecipitation data points to cytoskeletal impairments in DS and AD resulting in reduced interactions of different cytoskeletal networks. Importantly, the same reduction is observed in both DS and AD pathological brains, as well as in cultured lymphocytes from DS and AD donors.
G-/F-actin spin-down assay: Disease-specific electrophoretic profiles of actin bands in G-actin enriched fractions
Another feature that emerged from the co-IP experiments was electrophoretic patterning of actin. Co-IP actin in DS and AD samples was not only less abundant, but its electrophoretic mobility was slower. Upon closer inspection of the immunoblots, it appears that in controls actin is present as two closely spaced bands, but in DS/AD, only the upper band of the actin doublet is present. This was visible in the brain IP experiment (Fig. 2) and also in LCLs IP with DYRK1A and α-tubulin antibodies (Fig. 3). This distinctive feature of DS/AD led us to explore the possibility of using it for qualitative differentiation between healthy and diseased donors. Qualitative assay can be used to avoid the challenging task of achieving the accuracy required for quantitative co-IP assay. Accordingly, after testing many experimental conditions, we developed a protocol allowing unambiguous detection of this actin cytoskeleton abnormality. Our standard protocol is based on separation of G- and F-actin (spin-down assay) by high-speed centrifugation of RIPA lysates and analysis of G-actin (Supernatant) and F-actin (Pellet) enriched fractions by western blotting as depicted in Fig. 1 and in the Materials and Methods. Figure 4A presents results of analysis of G- (S) and F- (P)-actin enriched fractions of control, AD, and Fragile X LCLs. Both control and Fragile X supernatant (S) samples displayed a doublet of actin bands while in AD, there was a single band corresponding to the upper band of the doublet. All pellet samples (P), irrespective of the donor, produced only the upper band; therefore, these are not of diagnostic value. This electrophoretic patterning of actin can also be seen in Coomassie Blue (CB) stained gels (Fig. 4A). Besides visualization of actin band patterning, CB stained gels allow assessment of samples preservation and the quality of electrophoresis. As shown in Fig. 4A, bands in all samples were distinctly resolved with minimal smearing, ruling out the possibility that actin patterning was artefactually created by electrophoretic conditions.
Fig.4
G-/F-actin spin-down assay. A) Analysis of G- and F-actin enriched fractions from LCLs. RIPA lysates were subjected to spin-down fractionation as described in Fig. 1 and in the Materials and Methods. The resulting G-actin enriched supernatant (S) and F-actin enriched pellet (P) fractions were analyzed by immunoblotting for α-tubulin and β-actin. To visualize protein bands, a parallel gel was prepared and stained with Coomassie Blue (CB below). β-actin bands are marked. B) Effect of incubating with ATP and MgCl2 on electrophoretic patterning of actin. Actin pattering conversion was performed as described in the Materials and Methods. +ATP: incubated ATP and MgCl2; – ATP: untreated mock sample. Human platelets G-actin standard (AcSt) (Cytoskeleton Inc.) was included for comparison. C) Spin down assay of Lewy body disease (LBD) and frontotemporal lobe dementia (FTLD) LCLs. Details were as described in (A). D) Spin-down assay of pools LCLs lysates. Each pool was prepared by combining three distinct LCLs lysates and subjected to spin-down assay probing for DYRK1A, α-tubulin, and β-actin as described in (A).
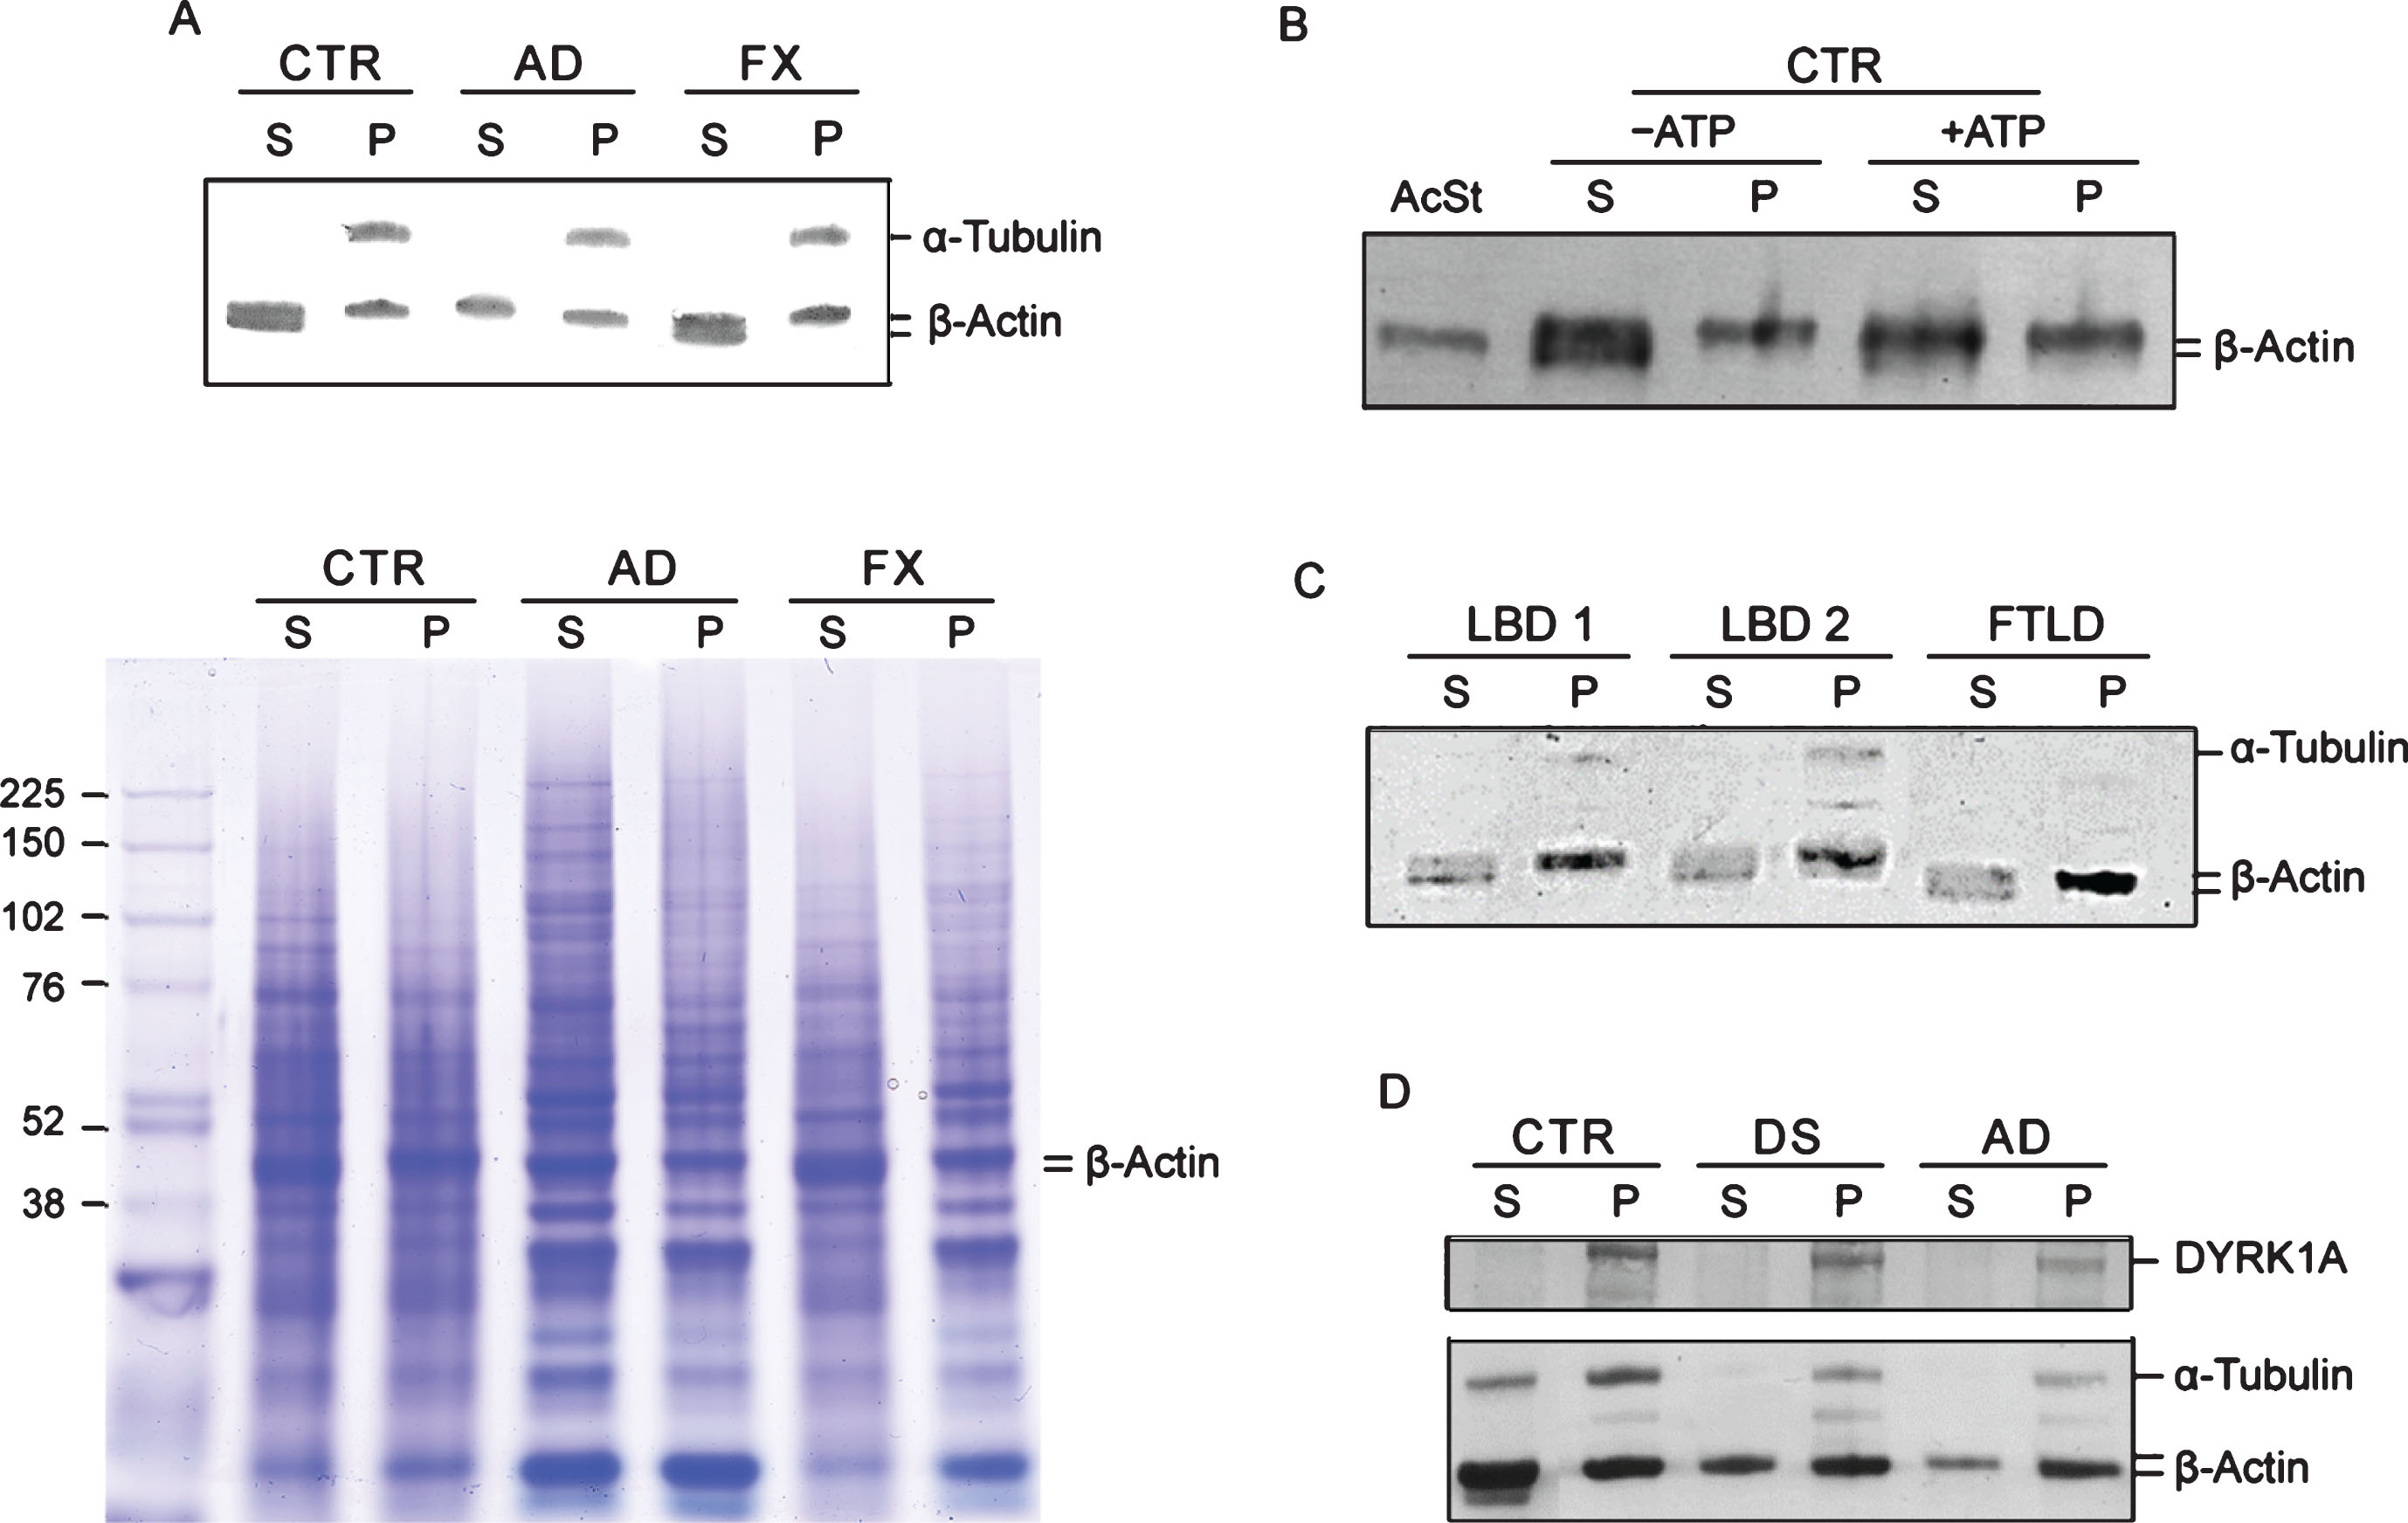
The molecular identity of these two actin species is not known. Some hints regarding the nature of these two species may be gained from experiment where G- and F-actin enriched fractions of control LCL were analyzed before and after incubation with ATP and Mg2 +. As shown in Fig. 4B, under those conditions, the actin doublet normally seen in G-actin fraction is converted into a single slower running actin band with electrophoretic mobility similar to that of G-actin seen in AD. Electrophoretic mobility of globular G-actin standard from human platelets considered to be G-actin monomer, was served as the reference. The lower band of the doublet in the untreated S sample appears to be lined-up with the actin standard; therefore, it likely represents G-actin monomer.
Next we examined whether those cytoskeleton changes are specific for AD-type dementia or shared by other age-associated neurodegenerative diseases. The changes were not present in four LCLs from Fragile X donors. Like controls, they all have a doublet of actin bands in G-actin fractions (Fig. 4A). We further examined two LCLs from patients diagnosed with LBD and one from FTLD by the G-/F-actin spin-down assay. As shown in Fig. 4C, all three displayed characteristic features of the controls, specifically, a doublet in the G-actin fractions. Taken together our findings support the view of cytoskeleton abnormalities in AD appears to be specifically associated with the disease process. Importantly, despite a significant overlap in clinical symptoms and pathology between AD and those two types of dementia [30, 31], they apparently are driven by different pathologic mechanisms. The changes are not only present in AD but also in DS subjects, as was seen earlier in the brain and in the following LCLs IP experiments. As shown in Fig. 4D, which presents results of spin-down analysis of pooled controls, DS, and AD LCLs, both DS and AD pools showed typical AD patterning, i.e., single band of actin in S fractions as opposed to a doublet as in the controls. Not surprisingly, DYRK1A has been found in F-actin enriched fractions indicating that it is an integral part of cytoskeleton assemblies. Therefore, single-banding pattern of β-actin is an apparent AD (and DS)-specific signature, which as a qualitative change, does not require calibration and statistical validation, as do measurements of actin levels for assessing AD/DS.
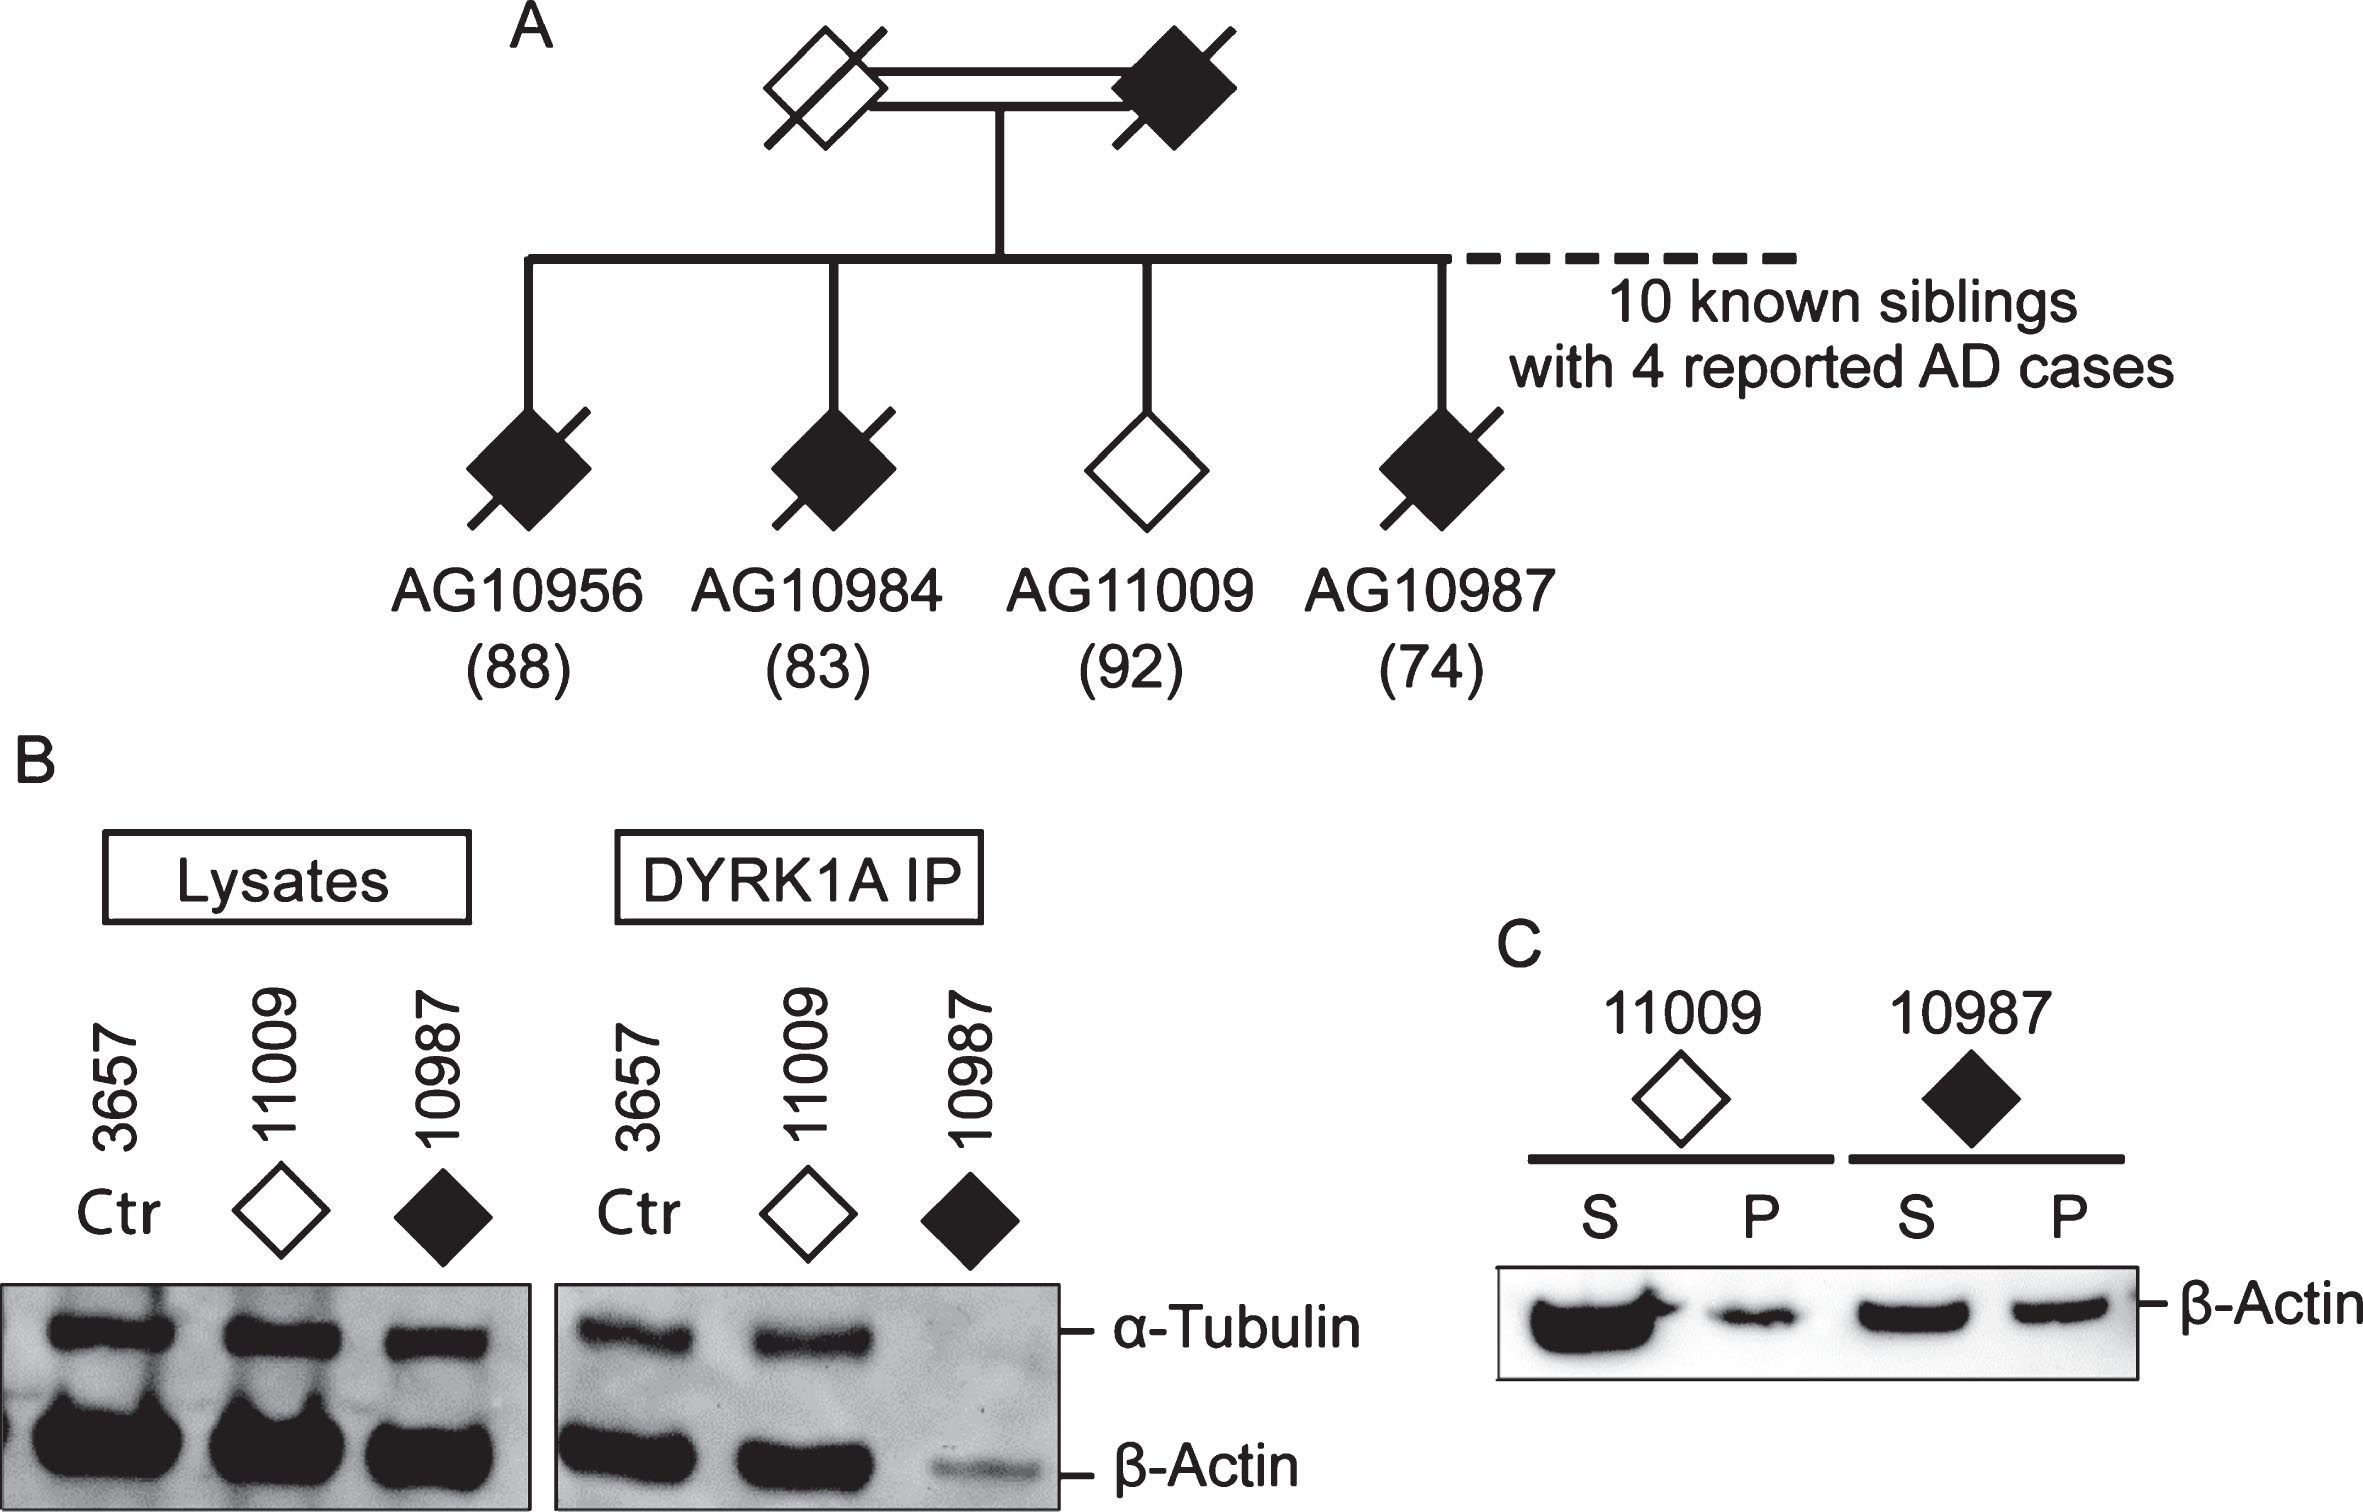
Among AD cases analyzed, six are SAD and four are from AD families (FAD) (Table 1). Irrespective of their origins, they all presented with cytoskeleton changes specific for AD suggesting a common mechanism of AD pathology. Of special interest is a pair of siblings from consanguineous marriage, one who is affected (AG10987) and the other (AG11009) is a probable AD escapee. Out of ten siblings, four were known to have AD (Fig. 5A) [32]. The affected subject AG10987 was diagnosed with AD by age 78 but, at the time of blood sampling for establishing LCL at age 74, was asymptomatic. The escapee AG11009 showed no symptoms at age 92. Having similar genetic make-up, these two cases offer an opportunity to investigate the effect of a still unidentified genetic change on conferring susceptibility to AD in this family. Accordingly, they were tested by DYRK1A co-IP (Fig. 5B) and the spin-down assays (Fig. 5C), which revealed the presence of the putative AD markers in the affected sibling only. This finding suggests that genetic susceptibility to AD may be driven by a mechanism involving impairment of the cytoskeleton.
Fig.5
Comparison of DYRK1A co-IP and G-/F-actin profiles of two siblings from AD family. A) Partial family tree showing parents and four out of ten siblings, of whom four (three are shown) were known to be affected by AD. Solid diamonds denote affected members while the open diamond represents the normal member of the family. Age of sampling is in parentheses. Donors AG11009 and AG10987, together with control 3657, were analyzed by (B) DYRK1A co-IP assay and by (C) G-/F-actin spin-down assay according to protocols described above.
Blind test of AD cytoskeleton biomarkers in LCLs
The accuracy of the assays was subsequently tested in blinded experiments involving three SAD, three FAD cases, and their age-matched controls. The details of the diagnostic procedures leading to selection of the donors and samples acquisition are given in Materials and Methods. To ensure unbiased reading, cells pellets were shipped from a collaborating laboratory in Poland (see affiliation) in encoded tubes. The list of cases, age of AD onset and PS1 mutations identified in FAD donors is presented in Table 2. Cells were processed for IP and spin-down assays as depicted in Fig. 1. The assays correctly identified 10 out of 12 cases, including all three FAD cases (Table 2). However, the clinical diagnosis of one of the misidentified cases, the donor of 129S LCL (SAD), may have been inaccurate due to overlap of clinical symptoms between AD and other types of dementia. Also, the unusually early onset of the disease at age of 48 years does not fit the standard picture of sporadic AD. Another misidentified sample, 145K(F-CTR), contained not enough cells preventing repeated testing. Irrespective of these two mismatches, the results of blind tests further validate cytoskeletal abnormalities in cultured lymphocytes as potential biomarkers of AD.
Blind test of AD cytoskeleton biomarkers in PBMC
The study conducted so far clearly establishes the usefulness of cultured LCLs in identifying AD but ideally if blood samples from patients can be examined directly. Therefore, we extended the analysis to ten blinded PBMC samples, received from the collaborative laboratory in Poland, of patients diagnosed with AD or MCI due to AD at prodromal AD phase (PDAD) and age-matched control individuals. Samples were processed for G-/F-actin spin-down assay according to the standard protocol used in this study. Characteristics of blood donors together with clinical diagnosis and their corresponding identification by G-/F-actin spin-down assay are presented in Table 3.
Table 3
Characteristics of blood donors: clinical and G-/F-actin diagnosis
| Case # | Age/Gender | MMSE | CDR | CSF Markers1 | Clinical diagnosis | G-/F-actin diagnosis | ||
| Aβ42 | T-tau | P-tau | ||||||
| 1 | 58/F | 21 | 1 | 527 | 928 | 130.9 | AD | Non-AD dementia |
| 2 | 66/F | 28 | 0.5 | 1102 | 321 | 62 | MCI | non-AD |
| 3 | 88/F | 28 | 0.5 | 630.2 | 523.9 | 79.4 | MCI | PDAD |
| 4 | 49/F | 29 | 0 | 823 | 88.5 | 18.3 | SCI | PDAD |
| 5 | 51/M | 30 | 0 | 713.7 | 128.6 | 24.6 | SCI | PDAD |
| 6 | 62/M | 26 | 0 | 1171 | 189.1 | 36.3 | SCI | non-AD |
| 7 | 66/M | normal | 0 | – | – | – | normal | At risk |
| 8 | 71/M | normal | 0 | – | – | – | normal | normal |
| 9 | 70/M | normal | 0 | – | – | – | normal | normal |
| 10 | 70/M | normal | 0 | – | – | – | normal | normal |
1CSF markers scoring criteria: Aβ42 positive: <550 ng/ml; T-tau positive: >305 ng/ml; P-tau positive: >61 ng/ml. Case 1: positive for Aβ42, T-tau, and P-tau. Cases 2 and 3: positive for T-tau and P-tau, negative for Aβ42. MMSE, Mini-Mental State Examination; CDR, Clinical Dementia Rating; AD, Alzheimer’s disease; MCI, mild cognitive impairment; SCI, subjective cognitive impairment; PDAD, prodromal Alzheimer’s disease.
Like cultured LCLs, PMBC samples could be distinguished based on the electrophoretic mobility of actin in G-actin enriched fractions. As shown in Figure 6A, actin in some cases runs faster than in the others. However, unlike in LCLs of controls and non-AD dementia, the characteristic doublet of actin bands could not be detected. Upon comparing the actin patterning results obtained above, we reason that the single faster running actin band in the G-actin enriched fraction seen in cases #1, 2, 9, and 10 of Fig. 6A is likely to be the lower band of the doublet and can be used as the proxy for the doublet (Fig. 4A) to represent controls and non-AD dementia. On the other hand, the single slower running actin band seen in case #4, 5, and 7 of Fig. 6A, which has the same mobility as the actin in the F-actin enriched fraction, specifically marks AD. Based on this criteria, in the set of ten samples (Table 3), three (samples # 8, 9, and 10) were identified as normal controls, one (#7) as asymptomatic at risk of developing AD, three (#3, 4, and 5) as prodromal AD (PDAD), two (#2, and 6) as non-AD MCI, and one (#1) as non-AD dementia. Diagnosis based on clinical symptoms only is hampered by pathological overlap with other types of dementia. To improve accuracy of clinical diagnosis CSF biomarkers (a combination of the levels of Aβ42, T-tau, and P-tau) were included [24, 26]. Unfortunately, the diagnostic performance of the CSF biomarker-trios was disappointing. Only two cases classified by MCI symptoms (#2 and 3) and one diagnosed as AD (#1) met some or all CSF AD biomarkers criteria. Since CSF Aβ42/40 ratio was not assessed in this study, it likely became a limiting factor for reaching complete accordance between CSF biomarker-based, traditional diagnosis, and the G-/F-actin markers [33]. However, even CSF biomarker-negative MCI patients can progress to AD, as illustrated by a study population of patients with MCI where half of their participants who later progressed to AD were negative for CSF markers, although their progression was slower than in the biomarker positive group [34]. By clinical symptoms all cases in the present study met MCI criteria, the G-/F-actin marker diagnosis could further differentiate them allowing distinction between PDAD and non-AD MCI cases. This was evident in the identification of cases #2 and #6 as non-AD MCI, while case #1, deemed to represent AD in the set, was identified as non-AD dementia. Case #7, a normal control patient, displayed AD-specific patterning of actin marking this patient as being at risk of developing AD dementia. The effectiveness of classification of MCI cases by G/F actin markers awaits verification by studies conducted on larger groups of patients. The actin patterning displayed by PBMCs and the similarity to what has been observed in LCLs, speaks in favor of the diagnostic validity of G-/F-actin markers.
Fig.6
A) G-/F-actin spin-down assay of peripheral blood mononuclear cell (PBMC) from MCI donors. Spin-down assay was performed on PBMC obtained from donors listed in Table 3 as described in the Materials and Methods. B) Analysis of white blood cells (WBC) from postmortem blood sample of a 65-year-old DS donor. WBCs were isolated and processed for G-/F-actin spin-down assay similarly as described above. Samples of S fraction from Fragile X (FX) and control (CTR) are included for comparison.
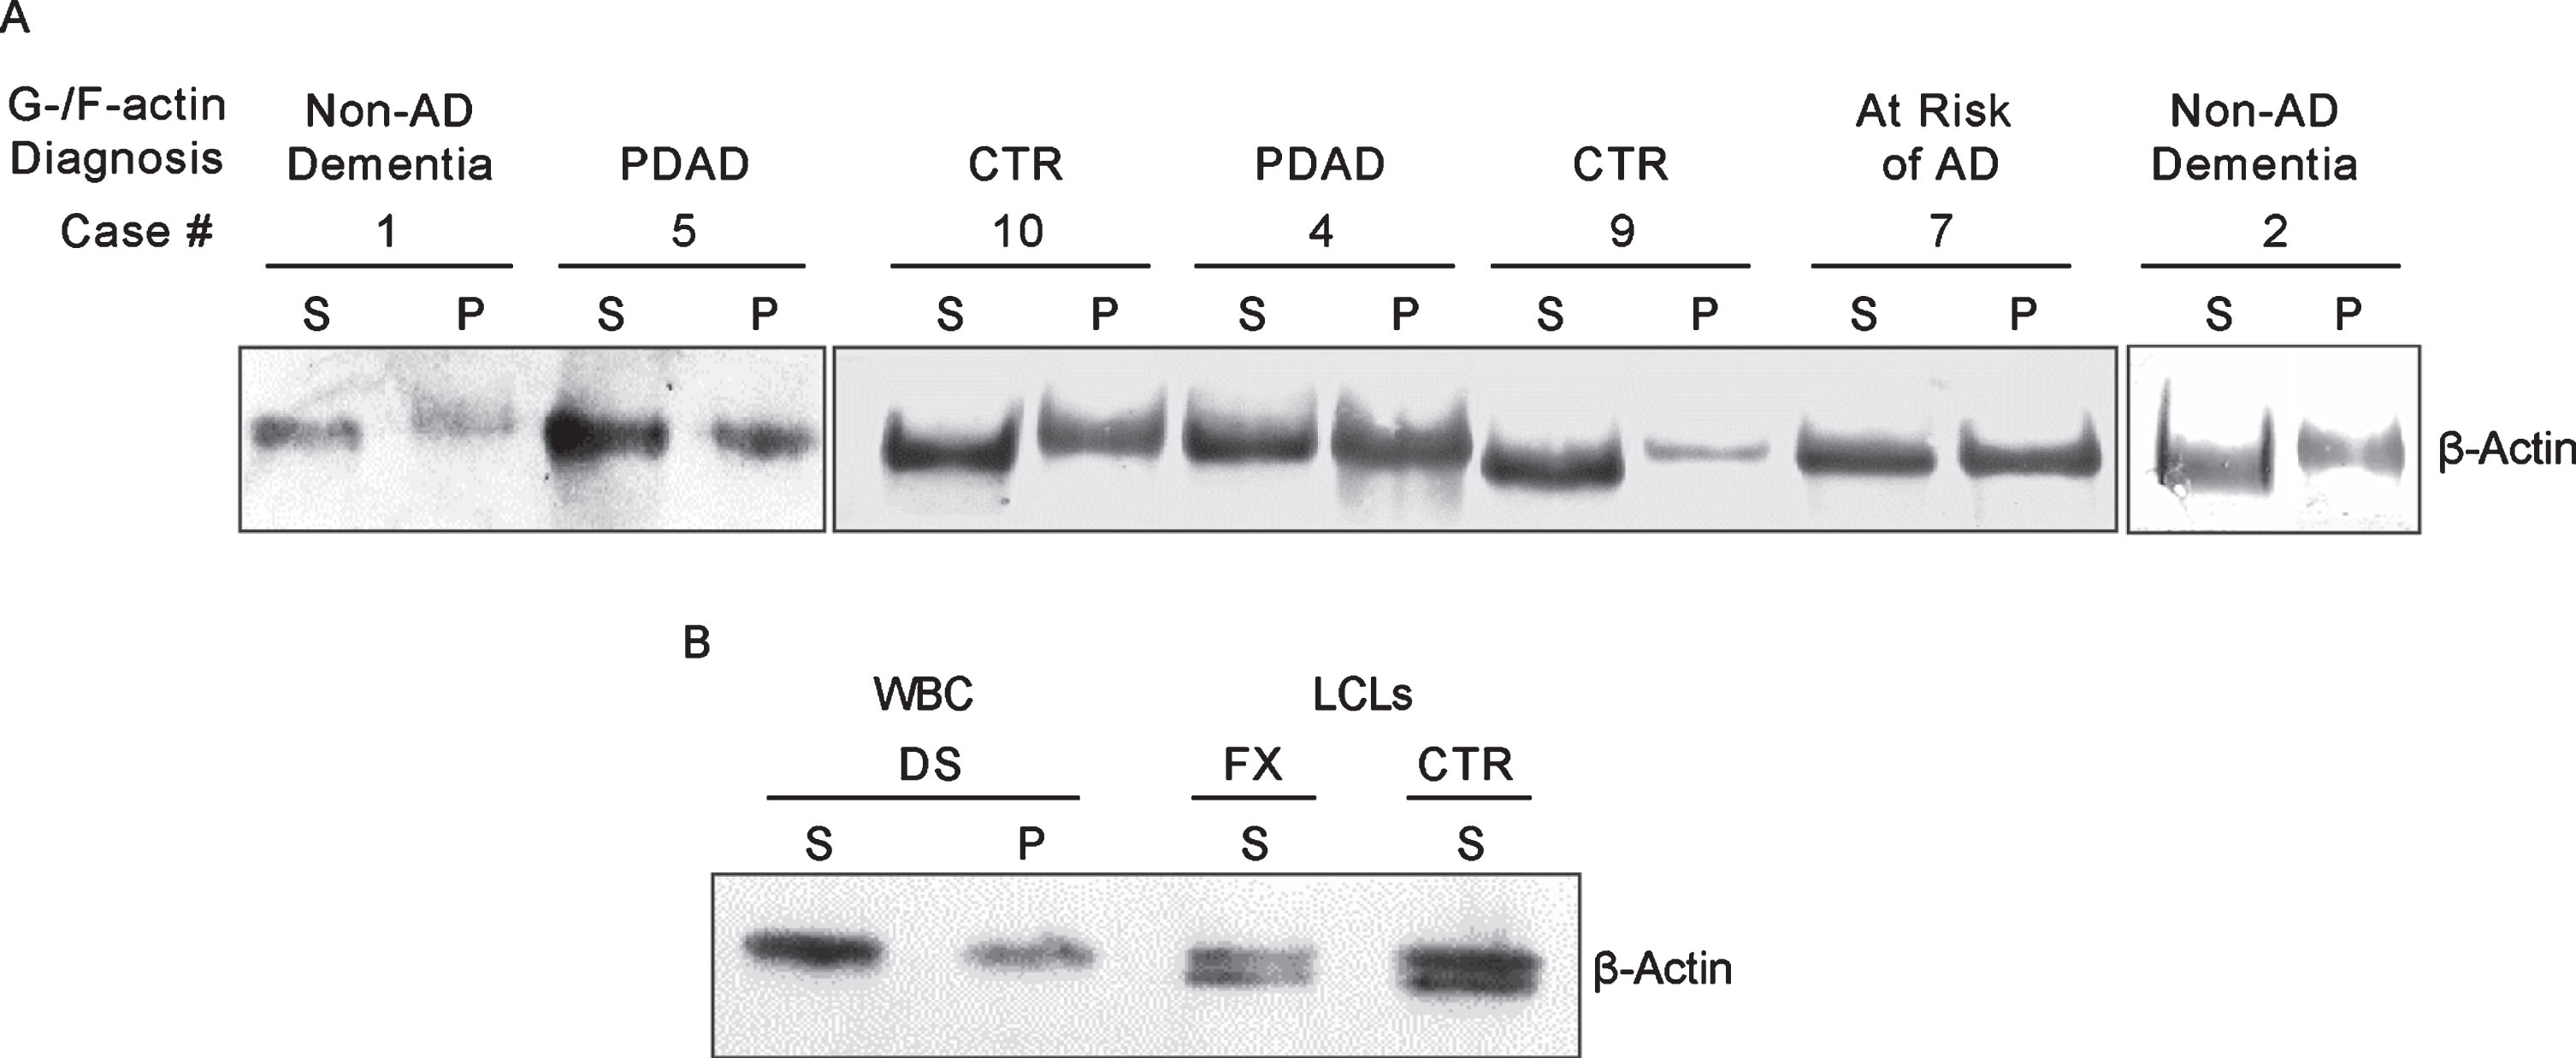
Case #1, which by clinical criteria and CSF biomarkers, was diagnosed as AD dementia, tested negative in the G-/F-actin spin-down assay. Because of this uncertainty, our PBMC set of samples lacked an unambiguously identified case of AD required for validating the test results of MCI cases. Therefore, we reached out for a blood sample of a DS patient who would have clearly defined disease background in order to serve as the reference for identifying AD. Accordingly, white blood cells isolated from postmortem blood sample from a 65-year-old DS patient was processed for the spin-down assay (Materials and Methods). The results of G-/F-actin markers analysis of this blood sample together with S fraction samples of control and Fragile X of LCLs are presented in Fig. 6B. As with the LCLs (Fig. 4) and in prodromal AD MCI PMBC cases (Fig. 6A), S and P fractions from the blood of the DS patient displayed only the equivalent of the slower running band of the actin doublet with the patterning that specifically marks AD/DS.
DISCUSSION
The current study was initiated based on our published observations of DYRK1A association with the cytoskeleton and abnormalities of this association in the brain tissues and LCLs from DS patients [21]. Applying similar approaches to the brain, LCL, and blood-derived cells of AD patients led us to discover a candidate biomarker for early and near-definite diagnosis of AD. In co-IP experiments, first with anti-DYRK1A and later with anti-actin and anti-tubulin antibodies, both brains and LCLs of AD patients displayed marked reduction in the abundance of all major cytoskeletal proteins co-IP with DYRK1A and each other (Figs. 2 and 3) indicating that the assembly of the cytoskeleton network in AD is compromised. In the spin-down assay, which separates G- and F-actin enriched fractions, G-actin fractions of AD lymphocytes displayed a characteristic shift in electrophoretic mobility of the actin band (Fig. 4). The cytoskeleton abnormalities described in this study were not present in samples prepared from Fragile X and two non-AD dementias represented by LBD and FTLD (Fig. 4), findings that establish their specificity for AD. The same changes were observed in DS subjects, which in light of the high vulnerability of aging DS individuals in developing AD dementia, further link those changes to the AD disease process. Cytoskeleton alterations were detected before clinical onset of the disease and were the same in familial and sporadic AD cases, suggesting a common mechanism of pathology. The similar cytoskeletal abnormalities displayed by DS/AD brains and peripheral tissues points to the systemic nature of the underlying mechanism, implying that early dysfunction of cytoskeleton may be a predisposing factor in the development of AD.
There is an increasing evidence of DYRK1A’s involvement in the regulation of cytoskeletal proteins. We and others [2, 17, 20, 21, 27, 35, 36] have shown aberrant regulation of cytoskeletal components by abnormal levels of DYRK1A. DYRK1A is a model example of a dosage-sensitive gene, which is synthesized as a constitutively active kinase and with triplicate levels contributing to mental retardation and memory deficits in DS patients [3, 37]. Its decreased expression due to haploinsufficiency leads to MRD7 syndrome with phenotypes of microcephaly, intellectual disability, epileptic seizures, language delay, and facial dysmorphism [5–10, 15]. In the current study, the levels of DYRK1A were found to be appreciably lower in the brain and LCLs from AD donors than in controls (Figs. 2 and 3). In support of our findings, Janel et al. [38] have also reported significantly lower levels of DYRK1A detected in plasma and LCLs from AD patients. It is tempting to speculate that DYRK1A dosage imbalance may underlie the aberrant cytoskeletal networking described in our study. Too little or too much of it may both give rise to cytoskeleton disruption and eventually lead to neurodegeneration.
Our search for biomarkers has been guided by the finding of similar cytoskeleton abnormalities in both the brain and cultured LCLs of DS/AD patients. This finding was not surprising since it is well documented that AD is, in fact, a systemic disorder involving various molecular alterations that can be reflected in peripheral tissues [39]. For example, AD lymphocytes can be differentiated from healthy controls by the changes in APP isoform levels, increased mitochondrial and oxidative stress, changes in cell cycle regulation, and in molecular alterations related to immune functions [22, 40]. The present study adds to this list of changes the aberrant organization of cytoskeleton reflected by reduced interactions of cytoskeleton network and abnormality of actin filaments, which in SDS-PAGE produces slower migrating G-actin subunit—a signature of AD. In the earlier work, Duijdam Van Der Berg and Goekoop [41] described significant reduction of capping with concanavalin A, the process involving cytoskeleton disturbances, of lymphocytes from DS and AD donors, but not from age-matched and clinically relevant control subjects. In another study, a double actin spot was detected by high-resolution two-dimensional electrophoresis in lymphocytes from DS and AD patients, but not in controls [42]. Importantly, cytoskeleton abnormalities reported in both papers, like in our study, were specific for AD and DS subjects. Of particular relevance are the similarities between AD and DS patients. As shown by postmortem studies, almost 100% of adults with DS have AD neuropathology by age of 40 years [43]. Therefore, it seems to be justified to perceive DS individuals as early diagnosed prospective AD patients validating the use of blood cells from DS donors to study the molecular mechanism of AD pathogenesis and as a source for biomarkers in early AD. In this context, the similarity of cytoskeleton alterations between DS and AD and their apparent specificity for these two dementias, ultimately link them to the disease process and assert their utility as diagnostic biomarkers for identifying AD.
The mechanism for the formation of actin doublet cannot be proposed without knowing their molecular identities. In our preliminary data presented in Fig. 4B, the lower band of having the similar electrophoretic mobility as G-actin monomer standard, seems to represent G-actin in its monomeric form. This form, in the presence of ATP and Mg2 + is converted into slower running band characteristic for G-actin enriched fractions of AD and DS. The mechanism of this conversion is not clear. Incubation with ATP/Mg+2 can promote actin polymerization, stabilization of F-actin, phosphorylation, and others. It seems like the disturbances in the reversal of the above processes contribute to AD-specific patterning of actin that mimics AD diseased conditions. The observation also suggests that such disturbances may underlie the true etiology of AD.
In the set of LCLs from Coriell’s collection, actin cytoskeleton biomarkers correctly identified AD patients from the control group. High accuracy of our tests was further confirmed in the blind experiments involving AD and control LCLs from Poland, where in the set of twelve samples, only one AD and one control sample were misidentified (Table 2) with one of the misidentified cases possibly due to uncertainty of the clinical diagnosis. LCLs from non-AD dementia represented by LBD and FTLD have been shown to be negative for the presence of AD biomarkers (Fig. 4B). This finding points to the specificity of those biomarkers for AD proving their utility in discriminating AD patients from those whose dementia is caused by conditions unrelated to AD pathology. The test not only provides a near-definite diagnosis, but also has a prognostic value as demonstrated by the presence of AD specific signatures in asymptomatic PS1 mutation carrier (Fig. 3C) and a symptom-free member of AD family who later progressed into full-blown disease (Fig. 5). The presence of cytoskeleton AD markers in patients at preclinical stages of the disease offers the prospect of early diagnosis and potentially more effective therapeutic intervention. In the study of six blood samples from patients with MCI and four controls (Table 3 and Fig. 6), AD biomarkers were found in three MCI cases and one control, which likely represents an asymptomatic case at risk of developing AD. Two MCI patients were negative for the actin biomarkers; therefore, they are classified as patients who would not develop AD. Those data show the potential of using the actin biomarkers to not only identify patients with prodromal AD but also allow distinction of patients with other forms of dementia facilitating the recruitment of people for AD clinical trials.
In addition to what can be accomplished by the tests, in terms of early and definite identification of AD, the protocol is straightforward and rapid. Actin biomarkers are easily detectable by routine western blot techniques. As demonstrated by the analysis of PBMCs (Table 3 and Fig. 6), the test can be performed on cells directly isolated from blood, eliminating a cumbersome and time-consuming step of in vitro culture. Blood samples can be easily collected outside a hospital setting and then stored refrigerated before shipping to laboratories, even worldwide, for testing. Processing of blood samples is simple and requires only basic laboratory equipment. The entire procedure is cost effective and can be completed in three days.
Our data, although promising, are still in the discovery phase and need to be verified by independent studies performed on larger and more defined cohorts of subjects. Should this happen, the biomarkers described in this study may prove to be an indispensable tool in the early and near-definite diagnosis of AD. Given its simplicity, non-invasiveness, affordability, and accuracy, it has advantages over currently available approaches utilizing bodily fluids. Besides diagnostic purposes, our data support the rationale of employing blood cells as a model to study the mechanism of AD pathogenesis and as a source for finding novel biomarkers in early stages of the disease. Such cellular models may greatly aid research to uncover primary cause of AD.
ACKNOWLEDGMENTS
This study was supported in part by funds from the New York State Office for People with Developmental Disabilities and grant NIH R01 HD43960 to Dr. Jerzy Wegiel and by the European Union’s Horizon 2020 research and innovation program under the Marie Sklodowska-Curie grant agreement no. 665735 (Bio4Med) and by the funding from Polish Ministry of Science and Higher Education within 2016-2020 funds for the implementation of international projects (agreement no. 3548/H2020/COFUND/2016/2) to UW. The authors thank Dr. Wojciech Kaczmarski for making available anti-DYRK1A R420 antibody and Dr. Carl Dobkin for providing DS and Fragile X lymphoblastoid cell lines.
Authors’ disclosures available online (https://www.j-alz.com/manuscript-disclosures/19-0475r3).
REFERENCES
[1] | Park J , Song WJ , Chung KC ((2009) ) Function and regulation of Dyrk1A: towards understanding Down syndrome. Cell Mol Life Sci 66: , 3235–3240. |
[2] | Park J , Chung KC ((2013) ) New perspectives of Dyrk1A role in neurogenesis and neuropathologic features of Down syndrome. Exp Neurobiol 22: , 244–248. |
[3] | Tejedor FJ , Hammerle B ((2011) ) MNB/DYRK1A as a multiple regulator of neuronal development. FEBS J 278: , 223–235. |
[4] | Hibaoui Y , Grad I , Letourneau A , Sailani MR , Dahoun S , Santoni FA , Gimelli S , Guipponi M , Pelte MF , Bena F , Antonarakis SE , Feki A ((2014) ) Modelling and rescuing neurodevelopmental defect of Down syndrome using induced pluripotent stem cells from monozygotic twins discordant for trisomy 21. EMBO Mol Med 6: , 259–277. |
[5] | van Bon BW , Hoischen A , Hehir-Kwa J , de Brouwer AP , Ruivenkamp C , Gijsbers AC , Marcelis CL , de Leeuw N , Veltman JA , Brunner HG , de Vries BB ((2011) ) Intragenic deletion in DYRK1A leads to mental retardation and primary microcephaly. Clin Genet 79: , 296–299. |
[6] | Moller RS , Kubart S , Hoeltzenbein M , Heye B , Vogel I , Hansen CP , Menzel C , Ullmann R , Tommerup N , Ropers HH , Tumer Z , Kalscheuer VM ((2008) ) Truncation of the Down syndrome candidate gene DYRK1A in two unrelated patients with microcephaly. Am J Hum Genet 82: , 1165–1170. |
[7] | Ruaud L , Mignot C , Guet A , Ohl C , Nava C , Heron D , Keren B , Depienne C , Benoit V , Maystadt I , Lederer D , Amsallem D , Piard J ((2015) ) DYRK1A mutations in two unrelated patients. Eur J Med Genet 58: , 168–174. |
[8] | Courcet JB , Faivre L , Malzac P , Masurel-Paulet A , Lopez E , Callier P , Lambert L , Lemesle M , Thevenon J , Gigot N , Duplomb L , Ragon C , Marle N , Mosca-Boidron AL , Huet F , Philippe C , Moncla A , Thauvin-Robinet C ((2012) ) The DYRK1A gene is a cause of syndromic intellectual disability with severe microcephaly and epilepsy. J Med Genet 49: , 731–736. |
[9] | Ji J , Lee H , Argiropoulos B , Dorrani N , Mann J , Martinez-Agosto JA , Gomez-Ospina N , Gallant N , Bernstein JA , Hudgins L , Slattery L , Isidor B , Le Caignec C , David A , Obersztyn E , Wisniowiecka-Kowalnik B , Fox M , Deignan JL , Vilain E , Hendricks E , Horton Harr M , Noon SE , Jackson JR , Wilkens A , Mirzaa G , Salamon N , Abramson J , Zackai EH , Krantz I , Innes AM , Nelson SF , Grody WW , Quintero-Rivera F ((2015) ) DYRK1A haploinsufficiency causes a new recognizable syndrome with microcephaly, intellectual disability, speech impairment, and distinct facies. Eur J Hum Genet 23: , 1473–1481. |
[10] | Bronicki LM , Redin C , Drunat S , Piton A , Lyons M , Passemard S , Baumann C , Faivre L , Thevenon J , Riviere JB , Isidor B , Gan G , Francannet C , Willems M , Gunel M , Jones JR , Gleeson JG , Mandel JL , Stevenson RE , Friez MJ , Aylsworth AS ((2015) ) Ten new cases further delineate the syndromic intellectual disability phenotype caused by mutations in DYRK1A. Eur J Hum Genet 23: , 1482–1487. |
[11] | Matsumoto N , Ohashi H , Tsukahara M , Kim KC , Soeda E , Niikawa N ((1997) ) Possible narrowed assignment of the loci of monosomy 21-associated microcephaly and intrauterine growth retardation to a 1.2-Mb segment at 21q22.2. Am J Hum Genet 60: , 997–999. |
[12] | Fujita H , Torii C , Kosaki R , Yamaguchi S , Kudoh J , Hayashi K , Takahashi T , Kosaki K ((2010) ) Microdeletion of the Down syndrome critical region at 21q22. Am J Med Genet A 152A: , 950–953. |
[13] | Yamamoto T , Shimojima K , Nishizawa T , Matsuo M , Ito M , Imai K ((2011) ) Clinical manifestations of the deletion of Down syndrome critical region including DYRK1A and KCNJ6. Am J Med Genet Part A 155: , 113–119. |
[14] | Oegema R , de Klein A , Verkerk AJ , Schot R , Dumee B , Douben H , Eussen B , Dubbel L , Poddighe PJ , van der Laar I , Dobyns WB , van der Spek PJ , Lequin MH , de Coo IF , de Wit MC , Wessels MW , Mancini GM ((2010) ) Distinctive phenotypic abnormalities associated with submicroscopic 21q22 deletion including DYRK1A. Mol Syndromol 1: , 113–120. |
[15] | Luco SM , Pohl D , Sell E , Wagner JD , Dyment DA , Daoud H ((2016) ) Case report of novel DYRK1A mutations in 2 individuals with syndromic intellectual disability and a review of the literature. BMC Med Genet 17: , 15. |
[16] | Aranda S , Laguna A , de la Luna S ((2011) ) DYRK family of protein kinases: evolutionary relationships, biochemical properties, and functional roles. FASEB J 25: , 449–462. |
[17] | Martinez de Lagran M , Benavides-Piccione R , Ballesteros-Yanez I , Calvo M , Morales M , Fillat C , Defelipe J , Ramakers GJ , Dierssen M ((2012) ) Dyrk1A influences neuronal morphogenesis through regulation of cytoskeletal dynamics in mammalian cortical neurons. Cereb Cortex 22: , 2867–2877. |
[18] | Slepak TI , Salay LD , Lemmon VP , Bixby JL ((2012) ) Dyrk kinases regulate phosphorylation of doublecortin, cytoskeletal organization, and neuronal morphology. Cytoskeleton (Hoboken) 69: , 514–527. |
[19] | Park J , Sung JY , Song WJ , Chang S , Chung KC ((2012) ) Dyrk1A negatively regulates the actin cytoskeleton through threonine phosphorylation of N-WASP. J Cell Sci 125: , 67–80. |
[20] | Liu T , Sims D , Baum B ((2009) ) Parallel RNAi screens across different cell lines identify generic and cell type-specific regulators of actin organization and cell morphology. Genome Biol 10: , R26. |
[21] | Dowjat K , Adayev T , Kaczmarski W , Wegiel J , Hwang YW ((2012) ) Gene dosage-dependent association of DYRK1A with the cytoskeleton in the brain and lymphocytes of down syndrome patients. J Neuropathol Exp Neurol 71: , 1100–1112. |
[22] | Wojsiat J , Laskowska-Kaszub K , Mietelska-Porowska A , Wojda U ((2017) ) Search for Alzheimer’s disease biomarkers in blood cells: hypotheses-driven approach. Biomark Med 11: , 917–931. |
[23] | Wojsiat J , Laskowska-Kaszub K , Alquezar C , Bialopiotrowicz E , Esteras N , Zdioruk M , Martin-Requero A , Wojda U ((2017) ) Familial Alzheimer’s disease lymphocytes respond differently than sporadic cells to oxidative stress: upregulated p53-p21 signaling linked with presenilin 1 mutants. Mol Neurobiol 54: , 5683–5698. |
[24] | McKhann GM , Knopman DS , Chertkow H , Hyman BT , Jack CR Jr. , Kawas CH , Klunk WE , Koroshetz WJ , Manly JJ , Mayeux R , Mohs RC , Morris JC , Rossor MN , Scheltens P , Carrillo MC , Thies B , Weintraub S , Phelps CH ((2011) ) The diagnosis of dementia due to Alzheimer’s disease: recommendations from the National Institute on Aging-Alzheimer’s Association workgroups on diagnostic guidelines for Alzheimer’s disease. Alzheimers Dement 7: , 263–269. |
[25] | Albert MS , DeKosky ST , Dickson D , Dubois B , Feldman HH , Fox NC , Gamst A , Holtzman DM , Jagust WJ , Petersen RC , Snyder PJ , Carrillo MC , Thies B , Phelps CH ((2011) ) The diagnosis of mild cognitive impairment due to Alzheimer’s disease: recommendations from the National Institute on Aging-Alzheimer’s Association workgroups on diagnostic guidelines for Alzheimer’s disease. Alzheimers Dement 7: , 270–279. |
[26] | Mandecka M , Budziszewska M , Barczak A , Peplonska B , Chodakowska-Zebrowska M , Filipek-Gliszczynska A , Nesteruk M , Styczynska M , Barcikowska M , Gabryelewicz T ((2016) ) Association between cerebrospinal fluid biomarkers for Alzheimer’s disease, APOE genotypes and auditory verbal learning task in subjective cognitive decline, mild cognitive impairment, and Alzheimer’s disease. J Alzheimers Dis 54: , 157–168. |
[27] | Kaczmarski W , Barua M , Mazur-Kolecka B , Frackowiak J , Dowjat W , Mehta P , Bolton D , Hwang YW , Rabe A , Albertini G , Wegiel J ((2014) ) Intracellular distribution of differentially phosphorylated dual-specificity tyrosine phosphorylation-regulated kinase 1A (DYRK1A). J Neurosci Res 92: , 162–173. |
[28] | Murakami N , Bolton D , Hwang YW ((2009) ) Dyrk1A binds to multiple endocytic proteins required for formation of clathrin-coated vesicles. Biochemistry 48: , 9297–9305. |
[29] | Kida E , Walus M , Jarzabek K , Palminiello S , Albertini G , Rabe A , Hwang YW , Golabek AA ((2011) ) Form of dual-specificity tyrosine-(Y)-phosphorylation-regulated kinase 1A nonphosphorylated at tyrosine 145 and 147 is enriched in the nuclei of astroglial cells, adult hippocampal progenitors, and some cholinergic axon terminals. Neuroscience 195: , 112–127. |
[30] | Kotzbauer PT , Trojanowsk JQ , Lee VM ((2001) ) Lewy body pathology in Alzheimer’s disease. J Mol Neurosci 17: , 225–232. |
[31] | Schneider JA , Arvanitakis Z , Leurgans SE , Bennett DA ((2009) ) The neuropathology of probable Alzheimer disease and mild cognitive impairment. Ann Neurol 66: , 200–208. |
[32] | Martin ES , Martin SE , Edelsohn L , Borgaonkar DS ((1997) ) Studies in a large family with late-onset Alzheimer disease (LOAD). Alzheimer Dis Assoc Disord 11: , 163–170. |
[33] | Hansson O , Lehmann S , Otto M , Zetterberg H , Lewczuk P ((2019) ) Advantages and disadvantages of the use of the CSF Amyloid beta (Abeta) 42/40 ratio in the diagnosis of Alzheimer’s Disease. Alzheimers Res Ther 11: , 34–48. |
[34] | Coric V , Salloway S , van Dyck CH , Dubois B , Andreasen N , Brody M , Curtis C , Soininen H , Thein S , Shiovitz T , Pilcher G , Ferris S , Colby S , Kerselaers W , Dockens R , Soares H , Kaplita S , Luo F , Pachai C , Bracoud L , Mintun M , Grill JD , Marek K , Seibyl J , Cedarbaum JM , Albright C , Feldman HH , Berman RM ((2015) ) Targeting prodromal Alzheimer disease with avagacestat: a randomized clinical trial. JAMA Neurol 72: , 1324–1333. |
[35] | Scales TM , Lin S , Kraus M , Goold RG , Gordon-Weeks PR ((2009) ) Nonprimed and DYRK1A-primed GSK3 beta-phosphorylation sites on MAP1B regulate microtubule dynamics in growing axons. J Cell Sci 122: , 2424–2435. |
[36] | Ori-McKenney KM , McKenney RJ , Huang HH , Li T , Meltzer S , Jan LY , Vale RD , Wiita AP , Jan YN ((2016) ) Phosphorylation of beta-tubulin by the Down syndrome kinase, minibrain/DYRK1a, regulates microtubule dynamics and dendrite morphogenesis. Neuron 90: , 551–563. |
[37] | Duchon A , Herault Y ((2016) ) DYRK1A, a dosage-sensitive gene involved in neurodevelopmental disorders, is a target for drug development in Down syndrome. Front Behav Neurosci 10: , 104. |
[38] | Janel N , Sarazin M , Corlier F , Corne H , de Souza LC , Hamelin L , Aka A , Lagarde J , Blehaut H , Hindie V , Rain JC , Arbones ML , Dubois B , Potier MC , Bottlaender M , Delabar JM ((2014) ) Plasma DYRK1A as a novel risk factor for Alzheimer’s disease. Transl Psychiatry 4: , e425. |
[39] | Francois M , Leifert W , Martins R , Thomas P , Fenech M ((2014) ) Biomarkers of Alzheimer’s disease risk in peripheral tissues; focus on buccal cells. Curr Alzheimer Res 11: , 519–531. |
[40] | Esteras N , Alquezar C , de la Encarnacion A , Martin-Requero A ((2016) ) Lymphocytes in Alzheimer’s disease pathology: Altered signaling pathways. Curr Alzheimer Res 13: , 439–449. |
[41] | Duijndam-van den Berge M , Goekoop JG ((1986) ) Lymphocyte concanavalin A capping: a similarity between Down’s syndrome and early onset primary degenerative dementia. J Neurol Neurosurg Psychiatry 49: , 595–598. |
[42] | Jabbour W , Pouplard-Barthelaix A , Houlgatte R , Emile J ((1992) ) Abnormal expression of actin in lymphocytes of Alzheimer’s disease and Down’s syndrome patients. J Neuroimmunol 38: , 199–208. |
[43] | Ballard C , Mobley W , Hardy J , Williams G , Corbett A ((2016) ) Dementia in Down’s syndrome. Lancet Neurol 15: , 622–636. |

