


Symbols
I. Introduction
Gases are in general much more soluble in water than in ice, the solubility in water increasing with increase of gas pressure and decrease of temperature. As water freezes to ice, gas molecules are rejected at the advancing interface, giving a saturation ratio in the liquid which increases with time and is a maximum at the interface. This increasing saturation ratio eventually leads to the nucleation and growth of air bubbles which may occupy several per cent by volume. Lake ice and hailstones contain air bubbles mostly formed in this way, in contrast to graupel and glacier ice which contain many air inclusions trapped during consolidation of individual cloud drops or snow crystals. The purpose of this study is to investigate the physical conditions leading to air-bubble nucleation and growth from solution to different size, shape and concentration with a view to application to ice growing under natural conditions. Bubbles in hydrometeors may influence charge separation processes either during melting or by splash of accreting drops during wet growth; bubble characteristics uniquely related to growth conditions may be used as a diagnostic tool in determining the freezing history of an ice sample, whether from atmosphere, lake or glacier.
II. The Physical Problem
The partition coefficient of air between water and ice was estimated by Scholander and others (1953, p. 40), who found that any air contained in clear ice was beyond the limit of detection of their equipment and gave a partition coefficient of less than 0.001 at the melting point. The solubility of small atoms in ice was measured by Kahane and others (1969), who found that helium and neon dissolved (2 cm3 per cm3 of ice at 125 atmospheres, equivalent to a molecular solubility of one atom in 8 × 10⁴ at one atmosphere of He) whereas larger atoms such as argon showed a much lower solubility. The distinction lay in the ability of smaller atoms (helium, diameter 1.86 Å, neon 2.4 Å) to negotiate the hexagonal channels of the ice lattice, diameter 2.4 Å, compared with the larger argon atom (diameter 3.1 Å). Similarly, according to this model, it would not be expected that either oxygen or nitrogen molecules, with narrow dimension 2.8 Å and 3.0 Å, would dissolve.
As ice grows into supercooled water, air molecules too large to fit into the lattice are rejected and become concentrated in the liquid near the interface to diffuse away towards regions of lower concentration. As freezing progresses, the water at the interface becomes supersaturated, eventually leading to the nucleation of bubbles. Carle (Reference Carte1961) applied the solution of the non-steady-state, one-dimensional diffusion equation derived by Tiller and others (1953), and modified by Pohl (1954) to the growth of ice in water, assuming a constant growth rate R and a partition coefficient K independent of growth rate. From a reference frame attached to the moving interface, the local air concentration C changes by diffusion and advection:

Subject to the boundary conditions that initially t = 0 and C = C 0 everywhere, the solution is

where C/C 0 is the saturation ratio in the liquid at a distance x from the interface after a time t in water initially saturated at a concentration C 0.
At the advancing interface (x = 0), the saturation ratio is given by:

and after a time long compared with D/K(1−K)R 2 ≃ D/KR 2 when K ≪ 1, is approximated by:

The saturation ratio finally achieved is therefore independent of R and D, depending only on K. Carte showed that bubble growth-rate measurements were consistent with a value of K of 0.01, giving an ultimate saturation ratio, should bubbles not nucleate, of 100. The variation away from the interface after a long time is given by

showing an exponential fall, with a distance constant λ = D/R. As this steady state is approached, the concentration rises in the solid because of the high saturation ratio at the interface until it equals the initial concentration in the liquid. In practice, we shall see that nucleation of air bubbles usually occurs prior to the attainment of this steady state; Carte found a critical saturation ratio of 30. The steady state is reached only in the case of a long specimen; as a surface is approached, a second transient appears. Two other points should be mentioned with respect to the use of these equations. The ratio of nitrogen to oxygen is less in solution than in air, 1.5 compared with 4, giving rejected “air” a different composition; also the diffusion coefficient of oxygen in water is 20% greater than nitrogen (at 20° C) so that bubbles would have an enhanced oxygen content. Gas composition will not be considered further in this study.
For purposes of experimental design, it is important to examine the role of the transient in Equation (2). Taking K = 0.01 and D ≈ 10−9 m2 s−1, the values of λ, the equilibrium distance constant for the diffusion field in the liquid, τ, the time constant for steady state, and λ′, the distance constant for growth until steady state, are shown in Table I for a wide range of growth rates encountered under natural and experimental conditions. Initial freezing of a quiescent lake surface may be of order 10 μ m s−1, falling to less than 10−1μ m s−1 as the ice thickens. Hailstones growing in the “wet” regime may grow to 100 mm in 103 s, to give a linear outward freezing rate of 102μm s−1. A liquid drop freezes from the outside inward at a rate approximately inversely proportional to the unfrozen radius; for a 100 μ m drop, the initial freezing rate is 10 μ m s−1 and with a 10 μ m core, the instantaneous freezing rate is 103μ m s−1. A supercooled drop impacting on a surface of similar temperature, as occurs during the riming process, and losing heat primarily by conduction to the ice, will freeze more quickly. Interpretation of experimental results will therefore depend critically on the relationship in each experiment of the times and distances to those shown in Table I.
Table I. Distance and Time Constants for Change of Air Concentration Ahead of an Ice Intfrface Growing Into Supercooled Water.

III. Experimental Studies
Carte (1961) observed the freezing of a 0.5 mm layer of water between horizontal glass slides. Cooling was achieved by solid CO2, the freezing rate controlled between 5 and 120 μ m s−1 by an electrical heater on the opposite side. Bubbles nucleated at the ice–water interface and were trapped as the interface advanced. The concentration of air bubbles increased with growth rate R and was proportional to R 1.7.On the other hand, the size of the bubbles decreased with growth rate, being approximately proportional to  .At rates less than 17 μ m s−1, bubbles were in the form of threads parallel to the direction of growth of the ice. At higher growth rates, bubbles were egg shaped, the pointed end towards the growing interface. Estimates of the volume of air contained in the bubbles showed that between
  and
and  of the air in solution was present, assuming that bubbles were not under pressure. Water was saturated with air at various teperatures; the volume of air coming out of solution was consistent with the initial concentration. Maeno (Reference Maeno1967) investigated upward freezing of 32 ml of water. An 8 cm deep chamber with a brass base was placed in a cold room and the freezing controlled by a heater above the water surface to give freezing rates between 0.4 and 15 μ m s−1. He introduced insoluble particles and found that these formed sites for bubble nucleation, but could be de-activated by extended soaking or boiling. Bubbles which nucleated in association with a large particle often formed in lines. The particle was carried along with the interface and nucleated successive bubbles as the interface advanced. Some bubbles rose from the surface under buoyancy, whereas others were retained and eventually were completely embedded in ice. He suggested that all bubbles leaving the surface were separated from that surface by a thin liquid layer which reduced the force required for detachment. Bubbles were egg shaped, the narrow end, as in Carte’s studies, pointing towards the freezing interface. Cylindrical bubbles were also formed when a continuous supply of air was available, maintained by lack of competition with neighbouring bubbles. Significant metamorphosis of bubbles occurred after 10 h at −10°C, cylindrical bubbles becoming unstable and forming a line of individual bubbles after 120 h. Maeno and Kuroiwa (Reference Maeno and Kuroiwa1967) observed air bubbles in snow crystals and found that bubbles decreased in size over the period of a few days and small bubbles, a few micrometers in diameter, disappeared completely. They attributed this to dissolution into defects in the ice lattice, on the basis of the similarity of the observed activation energies and those observed for other diffusion processes.
The present experiments were undertaken in order to clarify the effect of initial conditions on the subsequent bubble formation, to extend the range of ice growth velocities, and to map the regime of different bubble forms in relation to the freezing process. The following criteria were applied in experimental design:
a. To obtain as flat an interface as possible and to examine it at a significant distance from walls to enable one-dimensional theory to be applied directly.
b. To provide a growth rate R which changes in a predetermined way, or is constant.
c. To examine bubble formation as it occurs, and to reduce any metamorphosis of bubbles examined at a subsequent stage to a minimum.
d. To prevent any change in the pressure during the expansion associated with the freezing.
The most straight-forward freezing technique is unidirectional freezing, by placing the liquid in contact with a cold reservoir. From elementary considerations, this gives a freezing rate which is hyperbolic. If we assume that the latent heat released at the interface conducts entirely through the solid, with the liquid isothermal at its equilibrium melting point, then

or with x in micrometers,

The equilibrium melting point can be taken as 0° C with sufficient accuracy; equilibrium air concentration in water gives a depression of 0.0025° C, rising to 0.25° C in 100-fold super-saturation.
With T 0 –T 1 = 20° C, this gives a growth rate of 26.4 μ m s−1 at 5 mm; with T 0– T 1 = 200° C, we have 264 μ m s−1. Smaller growth rates will follow as the ice thickens. Higher growth rates occur near the cold reservoir, but measurements much closer than 5 mm are inconvenient. Very large freezing rates may be achieved by an impaction technique. A 2 mm liquid drop impacting on a cold surface at near terminal velocity, 6.5 m s−1. spreads to a diameter ≈ 10 mm, to attain a thickness ≈ 50 μ m in a time 30 μ s. The freezing rate after 10 μ m has frozen is about 120 mm s−1, after a time of 50 μ s. The physical processes here are quite complex as the freezing process is taking place in a time comparable with the time taken for the drop to spread out into a thin disc.
Interface growth rates may be held constant only in a steady-state experiment. A zone-melting technique achieves this end but does not easily enable the initial concentration of gas in the liquid to be specified. Alternatively, ice crystals may be grown by lowering the melt through a sharp temperature gradient as in the Bridgman technique. The limitation on growth rate is then set by the heat transfer process in the cooling bath and the dimensions of the growth cell, A further advantage of this technique is that the cell is open so that no change of pressure occurs on solidification. Dimensions of the freezing chamber must be large enough that nucleation and growth of bubbles at the walls do not significantly influence those at the interface center. Maximum spatial separation of bubbles of interest is about 10 mm to give a convenient cell dimension of 40 mm.
One further consideration in experimental design is the effect of liquid convection. Equation (1) assumes transport solely by molecular diffusion. Mass motion will enhance the transfer process and give lower saturation ratios than that predicted. Since water has a maximum density at +4° C, water at the interface temperature, close to 0° C, will be lighter and will rise should the overlying water be warmer. Downward freezing will therefore be stable; upward freezing will tend to be unstable, as far as the +4° C isotherm.
Several types of experiment were carried out. Each will be described and assessed in terms of the experimental and theoretical criteria established above. Distilled water, passed through an ion exchange column, was used for all studies. The water was bubbled with filtered air and a measure of its air content obtained by direct measurement of the dissolved oxygen. Equilibrium was reached after several hours; the water was thermostated for several days prior to use. The water contained some particulates in suspension, which could be qualitatively monitored by scattering from a 1 mW laser. It was impossible to eliminate these particles during the present experiments.
a. Nucleation and growth of air bubbles, changing freezing rate
The growth cell consisted of a “plexiglass” (polymethylmethacrylate) hollow cylinder 40 mm diameter, 300 mm length, fitted via an “O” ring over a solid cylinder of aluminum (Fig. 1). The cell was insulated by a 5 cm layer of expanded polystyrene. The temperature of the upper surface of the metal was monitored by a thermocouple. To begin an experiment, the aluminum base was immersed in a large vacuum jacket containing liquid air and allowed to come to thermal equilibrium. Air-saturated distilled water was smoothly run into the chamber to a depth of about 250 mm, and froze upwards. The position of the interface was monitored at intervals by smoothly inserting a wire probe at the edge of the cylinder. The shape of the interface, determined from a series of subsidiary experiments by pouring off the water at suitable intervals, was flat to within 0.05 mm, but became slightly bowed upward towards the end of the freezing by about 1 mm. Following freezing, the aluminum base was removed by warming in water for several minutes; this lost about 1 mm of ice at the lower end. The ice was removed from the tube by thawing at the periphery with warm air and stored at −20° C. 2 mm vertical sections of ice were cut cold by a band saw, the surface being lightly polished to improve visibility. Figure 2a shows sections cut along the length of the cylinder revealing the effect of different growth velocities on bubble shape and size. Maximum growth rate occurs at the beginning of freezing and is about 80 μm s−1 at about 10 mm ice thickness after 1 min. Large numbers of small egg-shaped bubbles form with the narrow end pointing in the freezing direction. As the growth rate falls, bubble size increases and the concentration decreases. At a growth rate of about 25± 1 μ m s−1, some cylindrical bubbles form with their axis along the direction of freezing, gradually replacing egg-shaped bubbles, which cease at 5±1 μ m s−1. Figure 2b shows details of egg-shaped bubbles where the freezing velocity is 6 μ m s−1. Figure 2c shows simultaneous occurrence of cylindrical and egg-shaped bubbles at 18 μ m s−1. Cylinders cease entirely at a growth rate of 3± 1 μ m s−1, to give completely clear ice. Figure 3 shows how bubble dimensions change with position and freezing rate. Cylinder diameters are about half of bubble diameters at the same position.

Fig. 1. Growth apparatus for upward freezing, varying growth rate. Water is poured into the cylinder after equilibrium has been reached.

Fig. 2. (a) Section cut along the length of a cylinder showing bubble size increasing with decrease of growth rate and cylindrical bubbles beginning at growth rates less than 25 μm s−1. Water saturated with air at 850 mbar, 20° C. (b) Detail of egg-shaped bubbles formed at 6 μm s−1. (c) Detail of simultaneous occurrence of egg-shaped bubbles and cylindrical bubbles. Freezing velocity 18 μm s−1.

Fig. 3. Major and minor axes of air bubbles. The aspect ratio increases with size. Also shown is the diameter of cylindrical bubbles.

Fig. 4. Length of cylindrical air bubbles.
Cylinder lengths are variable between different runs. Figure 4 shows cylinder lengths as a function of position for two runs which were identical as far as freezing technique was concerned. Error bars indicate one standard deviation in each dimension. It will be shown later that these differences may be linked with the particulate content of the water. Bubble concentration is shown in Figure 5 and total volume concentration in Figure 6. These data are obtained by measurement of individual bubbles, under the assumption that each bubble is a figure of revolution about its long axis. Bubbles are not arranged randomly in space. A cursory inspection of Figure 2b shows some periodicity, bubbles tending to occur in layers perpendicular to the growth direction. The separation of these layers increases almost linearly with distance towards low velocity (Fig. 7). Some periodicity also occurs in cylinder growth and can be seen in Figure 2a. Great care has to be exercised to avoid shaking the cell during growth, particularly during the later stages at low freezing velocity. Deliberate agitation causes bubble growth to cease. Even without agitation some bubbles are released during freezing and rise to the surface of the water. This occurs only with freezing rates less than about 20 μ m s−1 and an estimate of the total volume of the bubbles from their number and rise velocity shows that a maximum of 3% of the volume of bubbles in the ice (Fig. 6) is lost. As discussed earlier, convective motions do occur in the water caused by vertical temperature gradients; the region from 0° C to 4° C will be convectively unstable because of the upward increase of density of the water. In order to investigate this effect, the freezing is studied vertically downward by the apparatus shown in Figure 8. In order to avoid pressure build-up, the lower end is open. The system is filled with water by complete immersion, then lifted into position, so that a slight negative pressure exists at the freezing interface. Freezing begins as the hollow cylinder is filled with liquid air. The results show essentially the same structure as that obtained with upward freezing. Initial conditions are not the same so that a direct comparison of the first few millimeters is not attempted. All air bubbles are trapped in the ice but since the bubble volume lost by buoyancy in the upward growing case is only 3%, this could not be detected in bubble volume measurements. Bubble layers are flatter and somewhat more distinct than in downward freezing.

Fig. 5. Total number concentration of bubbles of air and helium.
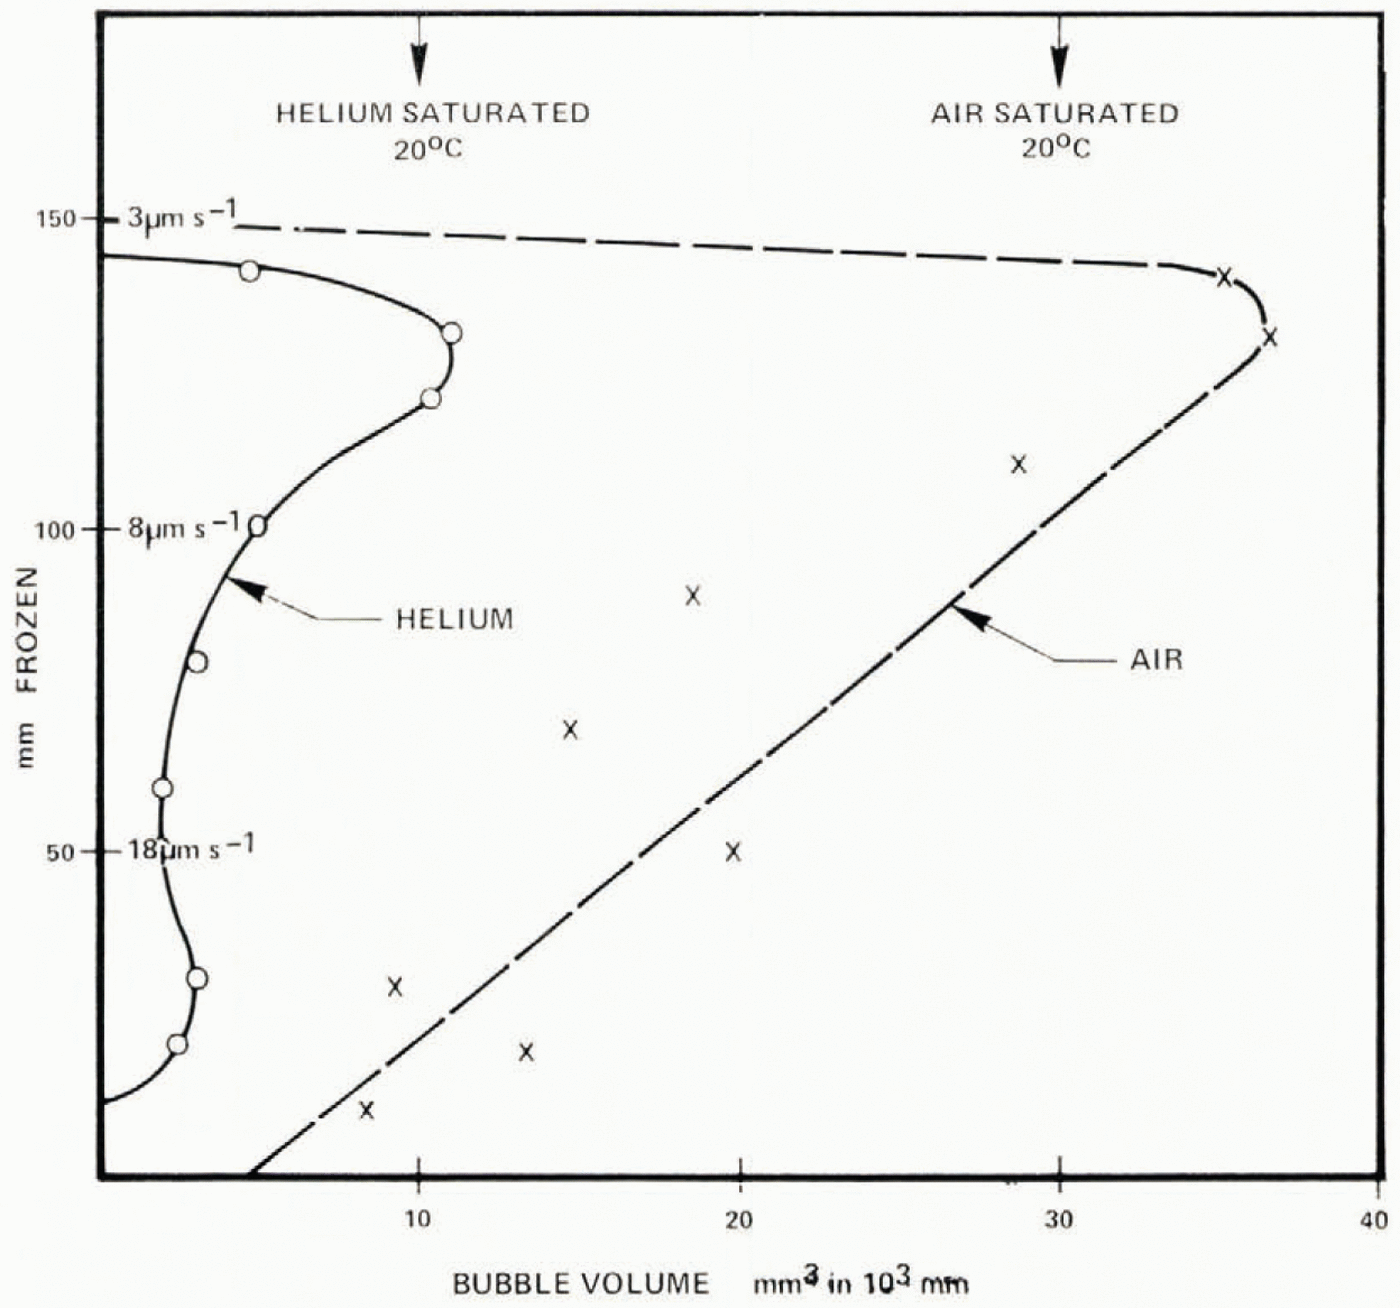
Fig. 6. Total volume concentrations of bubbles of air and helium. Volumes are indicated for the amount of gas in solution prior to freezing.
b. Nucleation and growth of helium bubbles, changing freezing rate
In view of the lower solubility of helium in water compared with air (about  ) and the possibility of the smaller atom being incorporated interstitially in the ice lattice, similar experiments on growth rate were carried out with water saturated with helium. Helium was slowly bubbled through 5 l of fresh distilled water for 12 h and the water was then allowed to equilibrate with helium for two days. The water was then forced under slight pressure into the freezing cell, the environment being flooded with helium during the transfer, which takes about min. A slow flow of helium was maintained over the top of the liquid during the subsequent freezing.
The bubble structure is quite different from the earlier runs with air. Cylindrical bubbles occur within 10 mm of the start of freezing and account for most of the bubble volume beyond about 50 mm. Bubbles cease at 160 mm, the volume being a maximum of about 1% at 130 mm. A section is shown in Figure 9a. Bubble discontinuities occur (arrowed) after shaking. Figure 5 shows the mean bubble concentration and Figure 6 shows bubble volume; both are less than the equivalent case with air, as would be expected with the lower solubility of helium. A further distinction from air is that many bubble cylinders end with a bubble which widens to about twice the cylinder diameter (Figure 9b). Most air cylinders terminate without enlargement.
Fig. 7. (a) Distance between bubble layers, (b) Bubble layers, separations ≈ 1–2 mm, growth rate 35–40 μm s−1.

Fig. 8. Growth apparatus for downward freezing, varying growth rate. The tube is filled with water and lifted so that excess pressure does not build up as the water freezes. Cooling is achieved by liquid air in the hollow cylinder.
c. Drop impaction studies; high freezing rates
The freezing rate in the experiments just described is of order 100 μ m s−1 at about 9 mm from the metal interface. Higher freezing rates occur nearer the interface, but problems arise in adequately specifying the initial conditions and monitoring the sample. Equation (5) gives a freezing rate at 1 mm of about 1 mm s−1 with a 180 deg temperature difference across the ice after about one second, which does not give time for any degree of equilibrium to be established either in upward freezing—water motion is still present—or downward freezing; the metal will still be cooling as the air boils off. An approach to much higher freezing rates may be made by allowing a drop to impact on a pre-cooled metal surface. A machine-finished copper cylinder, 30 mm diameter, 100 mm long, is cooled to liquid-air temperature. A drop of diameter 3 mm is formed by a syringe pump at the tip of a hypodermic needle. and allowed to fall freely until it impacts on the copper surface, where it spreads out into a thin circular disc and freezes. Variation of impact velocity is achieved by variation of the height of free fall. A 3 mm diameter drop has a terminal velocity in air of about 7 m s−1 and 6 m s−1can be reached with a fall distance of 5 m. The detailed mechanism of drop impaction deformation, and freezing was examined by using a high-speed camera operated at frame rates up to 6 000 per second. The splash mechanism is sensitive to the roughness and wettability of the surface and to the presence of any liquid prior to impact. The surface must therefore be cleaned carefully prior to impact. With an impact velocity of 3 m s−1, the initial splash process is similar to that described by Levin and Hobbs (1971). A thin sheet of liquid is ejected almost horizontally, with velocity approximately the same as the fall velocity, to form a disc with a diameter between 1.2 and 1.5 mm after 5 ms. At this diameter, the disc edge becomes unstable, taking a wave-like shape. A drop of diameter about 200 μ m is ejected from each crest with a velocity of about 10 m s−1 to a distance of 20 to 30 mm. The residues of this edge then contract towards the drop center, forming an upper edge which travels with a velocity about one tenth of the impact velocity. At positive temperatures, the liquid returns across the underlying liquid after 15 ms, and the lower liquid disc contracts to an approximate hemispherical shape after about 100 ms. At surface temperatures below-freezing, the initial deformation process is essentially unchanged, but one interesting difference is the apparent lack of formation of satellite drops at temperatures between o and −50° C, whereas at temperatures below −50° C, the number is comparable with that formed at positive temperatures. Depending on the temperature, the returning liquid may freeze prior to reaching the drop center to leave an annulus some 20–30 μ m thick, compared with a center thickness of 60–80 μ m. With impact velocity near terminal, ≈ 6 m s−1, the initial jet of liquid is angled upward, subsequently spreading outward as a film wall some 3 mm high at the crown. This wall then collapses and returns towards the center. The relative energies are of interest and are shown in Table II for a drop diameter of 3 mm, and an impact velocity of 6 m s−1. Some additional energy is required to provide the surface energy of the filaments attached to ejected drops. These figures imply a significant loss of energy, which presumably goes to heat via viscous dissipation in the large shears near the solid surface (Brownscombe and Hallett, Reference Brownscombe and Hallelt1967).

Fig. 9. (a) Section of ice grown from water saturated with helium at 20° C, 850 mbar. Interruption of bubble growth at 9 cm and 11 cm was caused by accidental shaking during addition of liquid air (arrowed). (b) Cylinder bubbles increasing in diameter at termination; enlargement of top part of (a).
Table II. Energies Associated with a 3 mm Diameter Drop Splashing on a Copper Surface At 6 m s−1.
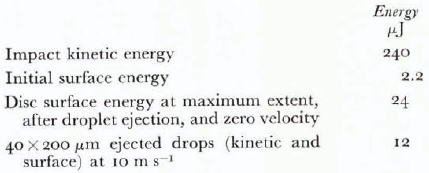
Figure 10 illustrates these events in a sequence (printed negative) from a high-speed movie. Figure 11 shows the effect of fall distance and impact velocity on drop deformation. The filaments which follow ejected drops can be clearly seen at the higher velocity of impact.

Fig. 10. Sequence showing deformation of a 3 mm diameter drop on impact on a copper surface at −180° C at 3.69 m s−1, times in milliseconds.

Fig. 11. (a)Effect of fall velocity on frozen drop dimension. The smallest is approximately hemispherical; the largest has a thickness 100 μm. Frozen filaments leading to ejected drops can be seen for the highest impact velocity. The inner crater is visible top-right. (b) Cracks which appeared after 50 ms.
Figure 12 shows the effect of impact velocity and temperature (−16° C and −160° C) on the disc and crater dimensions. The crater diameter was dependent primarily on impact velocity and not temperature below 0° C. Cracks sometimes begin to appear in the disc 40 to 50 ms after impact (Fig. 11) and continue for a further 20 ms. From the viewpoint of the present study, the most important feature of the mechanical behavior of the disc is its detachment from the metal surface. For copper temperatures above −40° C, the disc adheres firmly to the surface. It can be scraped away with difficulty, shattering in the process. At temperatures between −40 and −60° C, the disc can, with care, be prised off with a razor blade. At temperatures below −60° C, however, the disc completely separates from the copper after freezing and can be readily transferred to the microscope stage. When this occurs, the disc becomes saucer shaped, about 1 mm deep; dishing takes about 300 ms to complete, The curvature probably results from the contraction at a later stage of the layer of ice formed from the liquid returning from the collapsed crown. With the initial layer already frozen and cooled, the stress differential between the cooling and contracting upper layer and the already cooled lower layer leads to bending and detachment from the surface. For the purpose of study of bubble nucleation, the center part of the crater was examined. This avoids confusion between the two layers of ice formed at different cooling rates. The ice disc was transferred to a sealed, thermostatically controlled (±0.5° C) cold stage immediately after formation. The copper block for the fall experiments and the microscope were both contained in a chest freezer at −20° C so that there was no chance of melting or recrystallization during the transfer, about one minute elapsing after freezing the drop before its examination in the cold stage. Bubble structure and metamorphosis was examined by 16 mm time-lapse photography in transmitted light. Surface crystal structure becomes evident by slight etching of grain boundaries and crystal structure at depth in polarized light. Examination one minute after freezing shows grain boundaries and mean crystal diameter of about 20 μ m. Crystals are of irregular shape but occasionally lake a radial pattern, analgous to spherulite structure (Figure 13a, b). With ice held thermostatically at −9° C, air bubbles of diameter 2–3 μ m appear within cracks after only one minute from ice formation. These can be seen in Figure 14. The lines of bubbles are continuous and unrelated to grain boundaries, having the appearance of a brittle fracture. In addition smaller bubbles are just beginning to appear inside the ice in Figure 14b of size about 1 μ m. Photographs were taken, focused at the top, midway and base of the ice. Invariably, bubbles appear just inside the ice, 10 μ m from the free surfaces, and grow to about 5 μ m diameter after about 100 min to become of size comparable with those in the cracks. Bubbles also appear and grow in the surface after about 50 min, but here they are associated with grain boundaries. The spatial arrangement of the internal bubbles is also indicative that nucleation and growth is occurring at internal grain surfaces. This sequence of events is shown in Figure 14. During this period, significant recrystallization of ice takes place, the mean diameter increasing from 20 to 45 μ m in 100 min. Time-lapse studies revealed that the visible grain boundaries in the surface moved quite irregularly, regions of recrystallization giving surface linear velocities as large as 0.003 μ m s−1. One interesting aspect of recrystallization is that bubbles which form on a grain boundary which subsequently moves are left behind as evidence of the original position—a fossilized grain boundary.

Fig. 12. Effect of impact velocity and temperature on disc and crater diameter. Initial drop diameter 2.6 mm.

Fig. 13. Crystals in frozen splashed drop revealed by slight evaporation at the upper surface. The shape shows where drops were ejected. Impact velocity ≈ 6 m s−1, copper temperature −100° C. (a) Crystal boundaries revealed by evaporation etching. Bubbles nucleated at stress cracks in ice 9 min after freezing at −10° C. (b) Radial crystals revealed in polarized light.
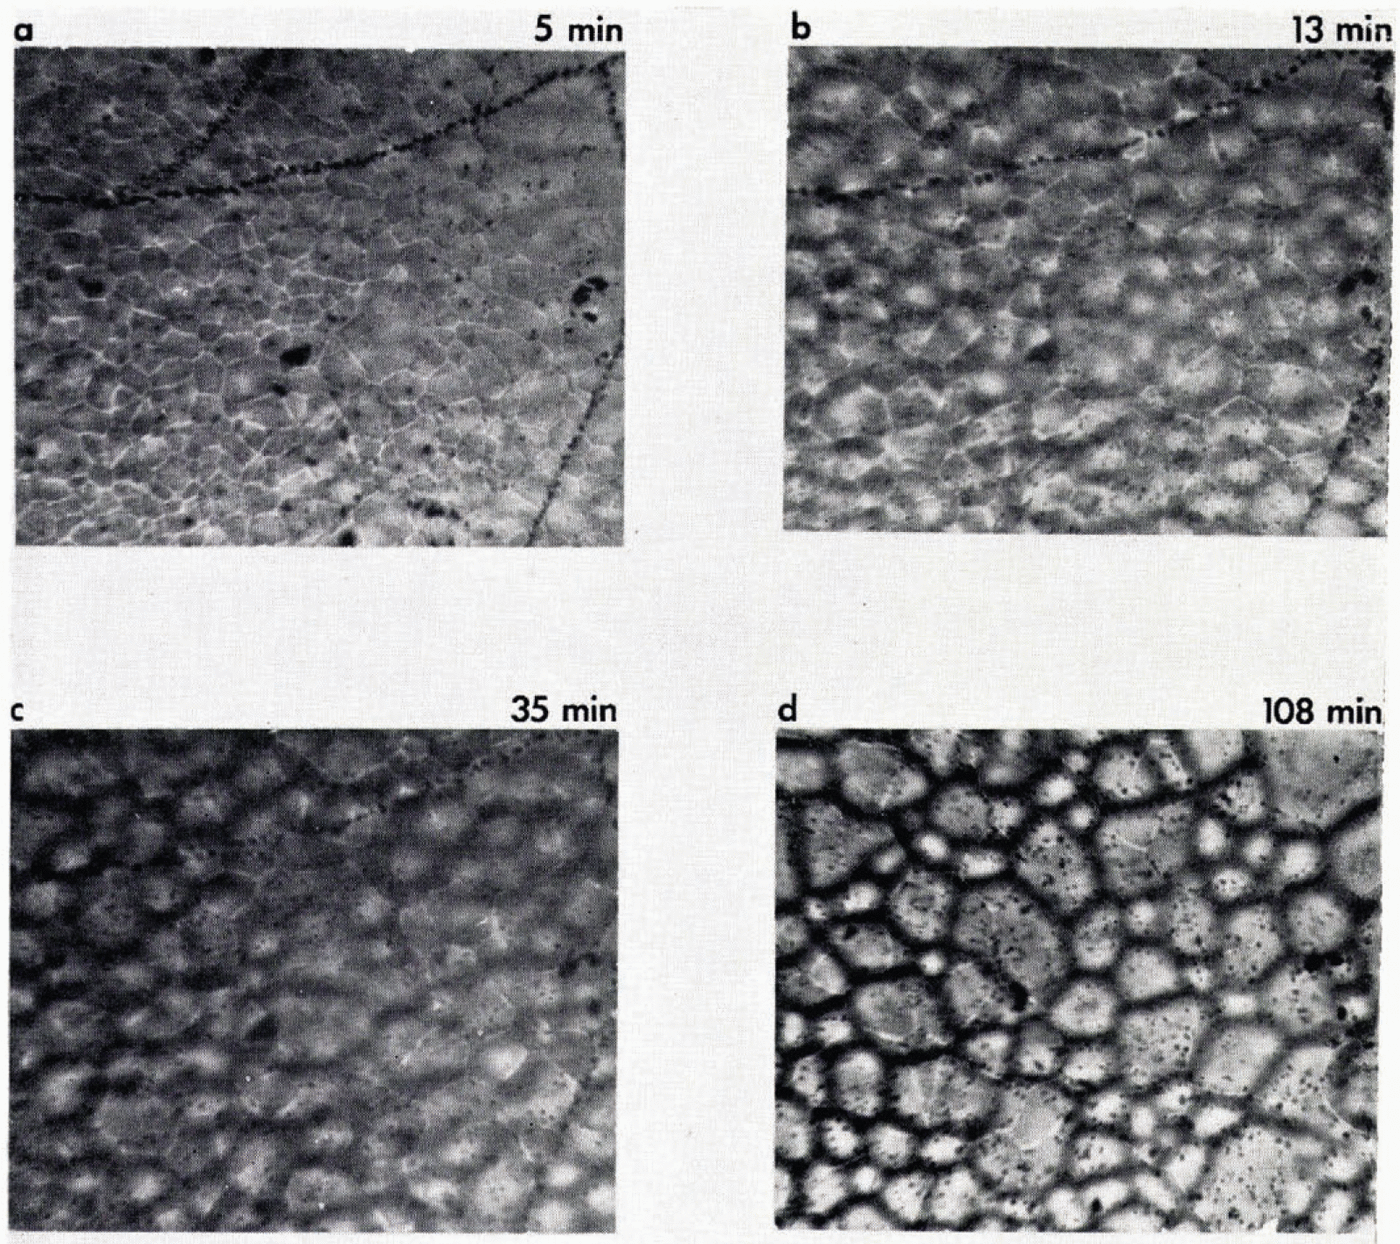
Fig. 14. Sequence showing nucleation and growth 0f air bubbles inside ice; times after freezing are marked. Specimen thickness: 90 μm. The ice is formed by impaction of a 3 mm diameter drop at 6 m s−1 on a copper block cooled to – 150° C. The microscope is focused at approximately the mid thickness of the ice. Air bubbles nucleate first at internal fractures formed during freezing and appear as lines of larger bubbles in a, b and c. Bubbles subsequently nucleate at internal grain boundaries, to leave “fossil” grain boundaries after recrystallization has occurred (compare crystal size in a and d).
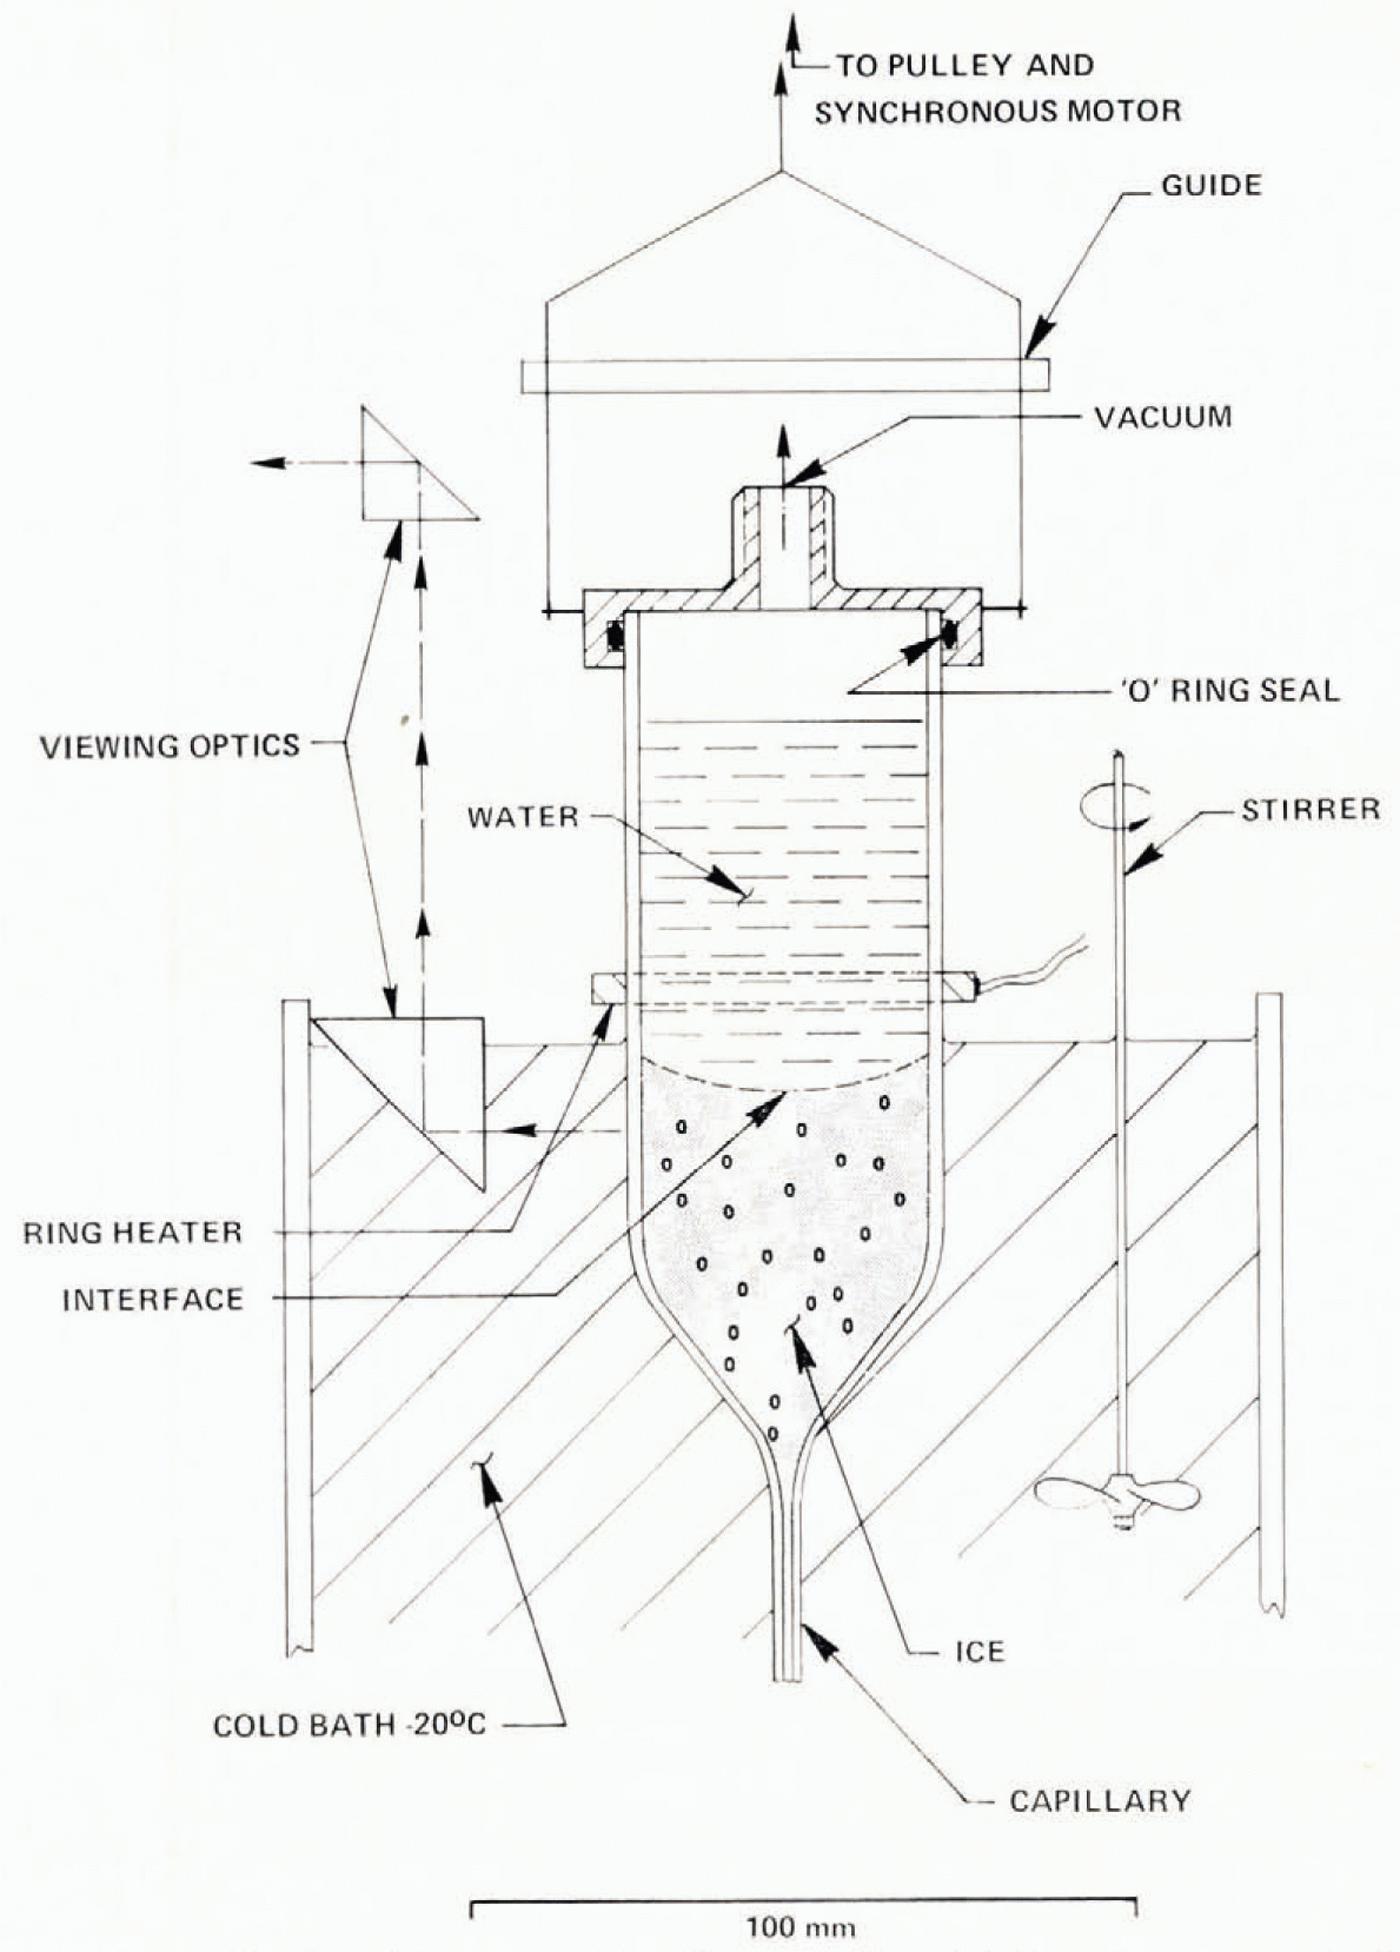
Fig. 15. Constant growth-rate (Bridgman) apparatus. Growth rate can be varied from 1 to 15 μm s−1 A strong temperature gradient exists just below the ring heater.
d. Constant growth-rate experiment
Experiments described previously have been characterized by a changing growth rate. Constant growth rate may be achieved by growing ice by the Bridgman method (Fig. 15), where a tube is lowered at a constant rate into a cold bath. This technique was used to investigate the effect of insoluble suspended particulates on bubble nucleation. At low growth rates, bubbles are typically of millimeter dimensions. An ice cylinder 40 mm in diameter is therefore sufficiently large for study. A “Pyrex” cylinder was drawn to a fine capillary at one end. It was filled with water and scaled in a flame while water slowly dripped from the tip. The tube was lowered by a geared synchronous motor into a well-stirred cold bath at −20° C, through a steep temperature gradient, maintained by an electrically heated ring at 40° C, held about 5 mm above the circulating fluid. Since water has a maximum density at 4° C, this arrangement heats water above the ring by convection to well above 4°C. Between the ring and the ice interface at 0° C a second unstable region exists with a maximum temperature of +4° C with very slow convection. The motion of a dye inserted at the ice–water interface during growth shows velocities less than 10 μ m s−1. At descent rates less than 5 μ m s−1, the ice interface is flat and maintains a fixed position as the growth cell descends. For larger growth rates, the interface becomes curved, having a center depression of about 10 mm at 6 μ m s−1 and 40 mm at 15 μ m s−1 (Fig. 16). Air bubble concentrations depend critically on growth rate, initial air concentration, and the particulate content of the water.

Fig. 16. Ice–water interface shape is flat for growth rates less than 4 μm s−1 but becomes increasingly curved as the growth rate increases.
First studies used distilled water from an ion exchange column, saturated with air at +20° C, as used in the earlier experiments. For growth velocities of 1.5 μ m s−1 or less, the ice was visually clear. Bubbles nucleated at greater growth velocities, with concentration increasing with initial air concentration and particulate content of the water. Results are shown in Figure 17. Curve b is for distilled water as used in earlier studies saturated with air at +20° C. This is to be compared with curve a from non-aerated distilled water with an air concentration of about 0.2 saturation at 20° C; e and d are the same water samples as b and a, containing 0.37 μ m latex spheres; they show a hundred-fold increase in bubble concentration. A similar effect is produced by cavitating the water with a 40 kHz ultrasonic transducer prior to freezing (c); this effect disappears if the water is frozen several days after cavitation. Glass beads caused increased nucleation of bubbles; the effect disappeared if the beads had been soaked in water for several days. If the water above the ice is stirred sufficiently, the air with large supersaturation is removed from the interface and no bubbles nucleate.

Fig. 17. Influence of ice growth rate on air bubble concentrations for water having different air concentration (a, b) and different particulate content (compare a, d and b, e). No bubbles nucleate below a growth velocity of 1.5 μm s−1. c shows the effect of inducing cavitation prior to freezing.
The ice is usually a single crystal for growth rates less than 6 μ ms −1, with c -axis direction (conveniently revealed by Tyndall flowers formed under a heat lamp) at 90° to the cylinder axis and ice growth direction. Increasing growth velocity gives a specimen composed of two or three crystals. There is no systematic relation between bubble positions and crystal boundaries.
As in the variable freezing-rate study, air bubbles are either cylindrical or egg-shaped. Occasionally cylinders or lines of cylinders occur over the whole range of growth rates studied, lengths being longer, up to 2 cm, at growth rates between 2 and 3 μ m s−1. A few egg-shaped bubbles occur mostly at slower growth rates. As before, the long axes of the bubbles are normal to the freezing interface, the narrow end of egg-shaped bubbles pointing in the direction of interface motion. Egg-shaped bubbles invariably grow as individuals. Small 100 μ m wax particles deposited at the growing interface give rise to lines of bubbles, either spherical or in the form of short cylinders. Air bubbles form between the ice and the wax and help its upward migration as it leaves 200 μ m bubbles at separations of 1 to 2 mm. The lines of bubbles (spherical or cylindrical) are therefore to be interpreted as caused by the migration of a nucleating particle along with the ice–water interface: egg-shaped bubbles occur on particles which are overtaken by the interface. This latter is observed for particles which are easily wetted, such as carburundum. A few bubbles would detach from the surface and rise through the liquid; according to the estimate of Maeno (1967), the surface tensions should prevent this occurring. We must therefore conclude that in these cases the nucleating particles themselves are detaching from the interface (presumably having lower surface tension) and rising along with the bubble.
A few experiments were conducted in air at reduced pressure. Water was saturated with air at 850 mbar and 20° C as described earlier, and the air pressure over the water was reduced to as low as 0.25 atmosphere by a backing pump. The form of the bubbles is quite different; their diameter increases by a factor of ten to about 2–3 mm, while the concentration is essentially unchanged (Fig. 18). Sudden changes of freezing rate also change the bubble regime; Figure 19 shows a sudden change from 1.5 μ ms−1 with clear ice, to 4 μ ms−1 with cylindrical and egg-shaped bubbles, the change taking place over about 5 mm and a time of 103 s. The effect of the initial transient was investigated by the variation of the position of the first bubble with growth rate. Figure 20 shows that at a growth rate of 15 μ m s−1, the bubbles appeared 100 mm from the end, and at lower growth rates failed to appear at all. This position depends on the nature of the nuclei present; curve b shows bubbles occurring at an earlier stage when nuclei are introduced by cavitation, presumably requiring a lower saturation ratio for activation.

Fig. 18. Large air bubbles formed from water saturated at 850 mbar, frozen at 500 mbar, Crowth rate: 6 μm s−1.

Fig. 19. Change from clear ice to ice with cylindrical and egg–shaped bubbles as growth velocity is changed from 1.5 to 4 μm s−1.

Fig. 20. Position of the first air bubble nucleated in ice grown from various samples of distilled water before and after cavitation.
IV. Discussion
It is first necessary to examine each experiment from the viewpoint of the criteria established in Section II, First, the boundary-layer thickness λ = D/R should be much less than the dimension of the freezing liquid. It is evident from Table III, rows 1 and 3, that this is the case for every situation examined. It follows that, in the absence of bubble nucleation and liquid motion, λ will always give a measure of the thickness of the diffusion layer and results will be uninfluenced by the specimen length. Secondly, the approach to steady-state saturation ratio in the liquid (and a concentration in the solid equal to that initially in the liquid) takes place after a time τ = D /KR 2 or after a distance λ′ = D/KR has been frozen. These values are subject to uncertainty of the value of K. A comparison of rows 2 and 3, and times in rows 4 and 5, shows that for the lower freezing rates a constant saturation ratio was not achieved in these experiments. Hence, the absence of bubble nucleation for low freezing rate (1 μ m s−1) in both constant and variable freezing rate experiments is to be explained as a lack of approach to equilibrium; air was diffusing into a boundary layer of increasing thickness. Conversely, at higher freezing rates—in particular,105μ m s−1 —in the splash experiment, equilibrium saturation should be achieved as a distance of 100 λ′ is available. Nucleation occurs progressively nearer the beginning of freezing (Fig. 20) as the growth rate increases and the distance constant λ′ decreases.
The occurrence of two distinct bubble forms—egg shaped and cylinders— can be seen as a competitive process. Initial nucleation takes place on the most effective nuclei present.
Table III A Comparison of Critical Distances and Times of Theory and Experiments
In all cases, the diffusion boundary layer (1) is much less than the dimensions of the liquid to be frozen (3). The distance for equilibrium (2) is comparable with the apparatus dimension for lower freezing rates, showing that the theoretical upper limit of saturation ratio is not attained. Time comparisons (4, 5) lead to the same conclusions. In these situations, bubbles fail to nucleate.

That nuclei are important, at least at lower growth rates, is demonstrated by the increased bubble concentration when more nuclei are added. Some nuclei move with the interface and give lines of spherical bubbles and periodic cylinders. In the case of particles which become embedded, continued growth of a cylinder depends on the supply of air. This can be cut off only by competition, another nucleus being activated nearby; otherwise a single bubble will adjust its growth rate to the air made available as the water freezes to ice. At higher growth rates, interfacial saturation ratios are higher (Equation (4)) and more nuclei become activated, so that the probability of the competitive process robbing a growing cylinder of its supply increases. The increase of bubble concentration (Fig. 5) is therefore a result of this process. Calculation of the growth rate of bubbles in typical saturation ratios shows that spherical bubbles grow with dr /dt ∞ 1/r once the effects of surface tension can be neglected. This critical size depends on both saturation ratio and radius as shown in the Appendix and Figure 25. For saturation ratios of 11 and 101, bubble diameter must be greater than 5 μ m and 1 μ m, respectively, for this approximation. Very small bubbles will always dissolve, there is a maximum value of growth rate at which the effect of surface tension and ambient saturation ratio balance. Figure 25 further shows that for growth, bubbles must be greater than r = 10−1μ m and 10−2μ m for saturation ratios of 11 and 101; these dimensions are consistent with qualitative estimates of the size of solid particulates in suspension in the water.

Fig. 21. Cylinder diameter and maximum diameter of egg-shaped bubbles related to growth rate. Curve is the diffusion boundary layer thickness for D = 10−9 m2 s−1.
Once a bubble has nucleated, it grows rapidly as a sphere, then more slowly as it approaches the limits of the diffusion boundary layer. This interaction is evident from the increase of bubble and cylinder diameter with decrease of growth rate. Results from a variable growth experiment are replotted in Figure 21, together with the thickness of the equilibrium diffusion boundary layer λ = D/R. In practice, the boundary layer thickness will be somewhat less than this value when equilibrium has not been attained. The bubble subsequently grows laterally in two dimensions, a process limited by the advancing ice interface. The sudden “pinching off” of the egg shaped bubbles is explicable in terms of mutual competition between three-dimensional growth with dependence of 1/r on the diffusion field compared with a lesser dependence in the case of the two-dimensional regime of a cylinder. Cylinders will be more likely to persist to low growth velocities in water which contains fewer particles. As a bubble cap becomes of smaller radius, so the internal pressure increases, as 2σ/r (where σ is the surface tension of the air–water interface) so that growth rapidly stops for two reasons: the approach to low saturation ratio at the diffusion boundary layer edge and the increased saturation ratio required to make a smaller bubble grow. The air pressure in a bubble will therefore be that equivalent to the radius at the place where it was finally completely frozen in; that is, the narrow end of an egg-shaped bubble, which points toward the direction of growth of the ice–water interface.
A related phenomenon is the nucleation of bubbles in layers—comparable to Liesegang ring phenomenon of solid precipitates. Nucleation of bubbles causes the saturation ratio to fall as growth takes place, preventing other nuclei ahead of the bubble layer being activated as growth proceeds. With a large number of bubbles nucleated, mutual competition reduces growth so that bubbles become completely frozen in. This enables the saturation ratio to build afresh and activate a second layer of nuclei, so the process repeats.

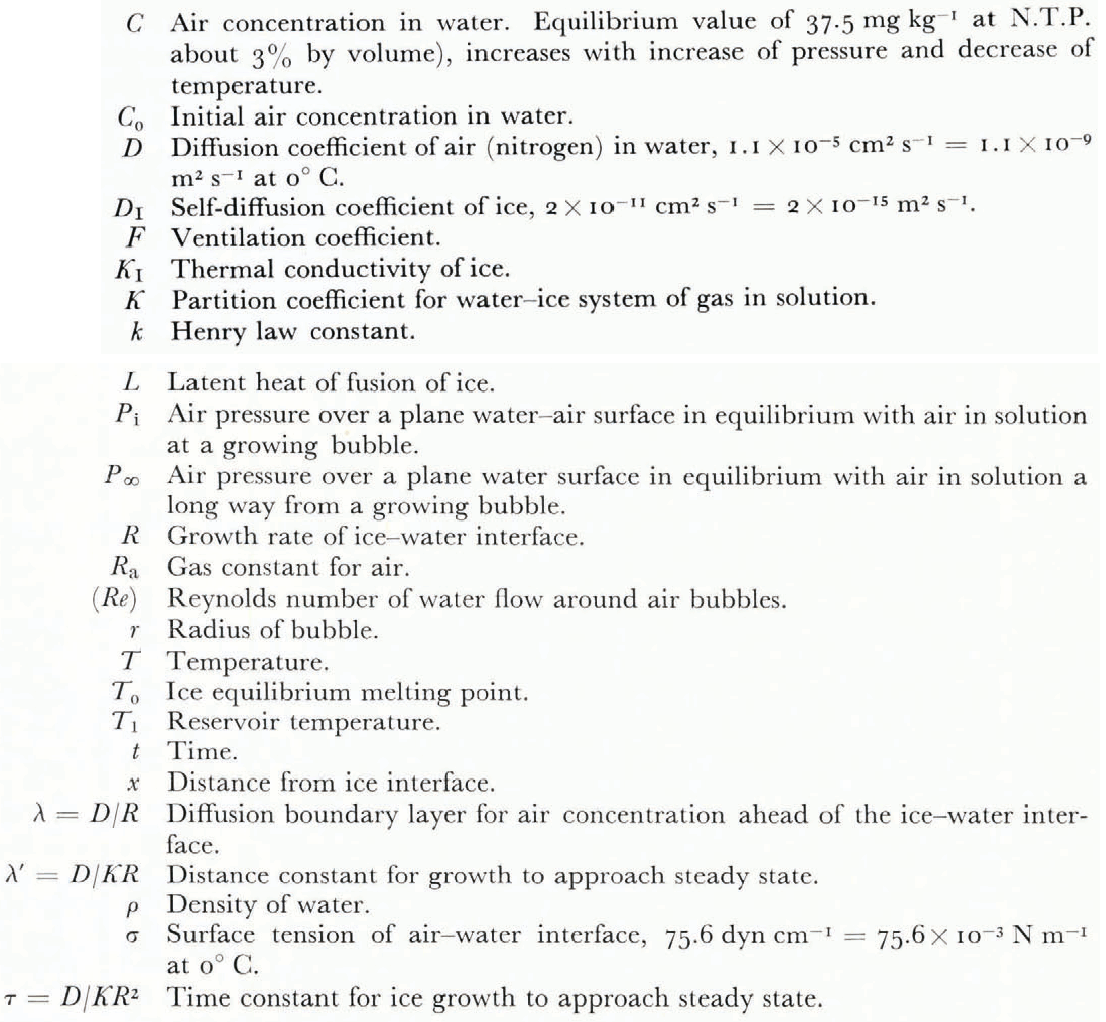
Fig. 22. Comparison of present results for air and helium with those of Carte (1961), Concentrations may be increased by 100 by addition of spheres 0.37 μm in diameter. The rapid increase of concentration beyond 18± 2 μm (He) and 12±2 μm (air) is associated with cessation of cylindrical bubbles and growth entirely of egg-shaped bubbles.
These observations give strong support for the existence of a hierarchy of bubble nuclei, with the number activated increasing with saturation ratio. The present results have a concentration of bubbles lower than that reported by Carte (1961) by about a factor of 10. Deliberate inclusion of nuclei could raise the concentration above that in the present results by a factor of 100, so the particles present and their history have a dominating effect on the bubble concentration and size for a specific growth rate. Comparison of present results for helium and air with those of Carte are shown in Figure 22. The rapid increase of bubble concentration beyond 18±2 μ m s−1 (air) is associated with the falling probability of cylinder survival; bubbles nucleate sufficiently frequently to give entirely egg-shaped forms.
V. Conclusion
Bubbles nucleated by the growth of an ice–water interface may be characterized by concentration, shape, and size. Evidence has been presented showing that the amount of gas in solution determined by the gas pressure and water temperature, and the particulate content, influence bubble nucleation and subsequent growth. Once a specific sample of water has been selected, the bubble characteristics are prescribed by the growth rate, subject to the transient change of interface supersaturation, which is related to the distance from the beginning of the ice specimen. The growth rate determines the thickness of a diffusion boundary layer which, in the absence of stirring or natural convection, leads to the nucleation and growth of bubbles in the form of cylinders or eggs, with long axis perpendicular to the interface and the narrow end of the egg towards the interface. The diameter of the bubble is approximately equal to the boundary-layer thickness. These findings suggest that it should be possible to characterize various natural sources of water by their spectrum of bubble nuclei and subsequently, for conditions specified, to deduce the conditions under which growth took place from an analysis of the bubble structure. The analysis will be subject to a metamorphosis of bubbles prior to analysis; Stehle (1967) and Kheysin and Cherepanov (1969) have shown that extensive change may take place over periods of days when the temperature is at −10° C and shorter times at higher temperatures. In particular, cylindrical bubbles break up into individual elements, an effect which could lead to considerable uncertainty. Temperatures below at least −20° C must therefore be used for storage.
It appears unlikely that bubble nucleation from the liquid occurs by homogeneous nucleation during the freezing of water. Swanger and Rhines (1972) estimate (extrapolated to 0° C) a saturation ratio of 3 500 to achieve homogeneous nucleation. Saturation ratios of this order appear unlikely from the considerations of the previous section. The concentration of insoluble particulates in water can be inferred from the degree of dispersion necessary for freezing to occur primarily by homogeneous nucleation (Mason, 1957, p. 132). Water which is not specially prepared must be dispersed to drops diameter ≈ 1 μ m, triple distilled water to drops ≈ 10 μ m diameter. This implies a concentration between 109 and 106 mm−3 which is well in excess of the highest concentration measured in this study, ≈ 102 mm−3.
As the growth rate increases toward 10 mm s−1, it appears that the air is incorporated into the ice at a molecular level and then subsequently nucleates to form bubbles inside the ice at grain boundaries which subsequently move as recrystallization occurs. Maeno and Kuroiwa (1967) have observed the dissolution of air bubbles in ice over a period of 600 h and suggest a molecular diffusion mechanism. If we assume this, with a diffusion constant approximately equal to the self-diffusion constant for water molecules in ice (Fletcher, Reference Fletcher1970, p. 160) D1 = 2 × 10⁻¹⁵ m2 s−1, the diffusion field will spread from a growing bubble to a distance, r 2 ≈ π2D1t giving r ≈ 10 μ m after one hour. Ice bubbles described in Section IIIe grow to 2 μ m radius after this period. This implies that the molecules were originally spread over a volume approximately 100 times greater, giving a minimum solubility of 1% by volume. In water at 0° C, the molecular solubility is 2 air molecules in 105 water molecules (3% by volume); in supersaturated ice, it is ≈ 0.6 molecule to 105 water molecules. The bubble internal pressure, while initially high enough to cause deformation of the ice, would probably still have a large value even after one hour. Equilibrium vacancy concentration is ≈ 2 × 109mm−3, a molecular ratio of 1 in 1010, considerably less than the number of air molecules. It is of interest that Davy and Miller (Reference Davy and Miller1970) found that the diffusion coefficient for helium in ice is ≈ 10−10 m2 s−1, implying migration along channels parallel to the c -axis, a situation which, as noted earlier, appears unlikely in the case of nitrogen or oxygen molecules.
The concentration of air in ice frozen under different conditions can be inferred from the volume of air bubbles appearing at different growth rates; Figure 23 shows the bubble volumes of Figure 6 as a function of growth rate; at growth rates larger than 10–20 μ m s−1, the bubble volume is less (by about a factor of 4) than the equilibrium air volume concentration. This is hardly to be explained in terms of higher bubble pressure; the tip of an egg bubble is ≈ 10 μ m radius, giving an excess pressure of only ≈ 0.15 atmosphere.
In ice formed by rapid freezing, air bubbles appear from ice which was previously clear. While the observations do not preclude the dispersal of air in bubbles too small to be seen by ordinary microscopical techniques, the observation that bubbles grow within the ice does suggest that air is incorporated into the ice lattice in significant amounts. The observations are to be compared with the complete lack of bubbles in ice taken from bore holes deeper than 1 000 m (90 atmospheres) in Antarctica (Gow, Reference Gow1970). This ice gives bubbles on melting, implying that air is present, possibly on a molecular level.
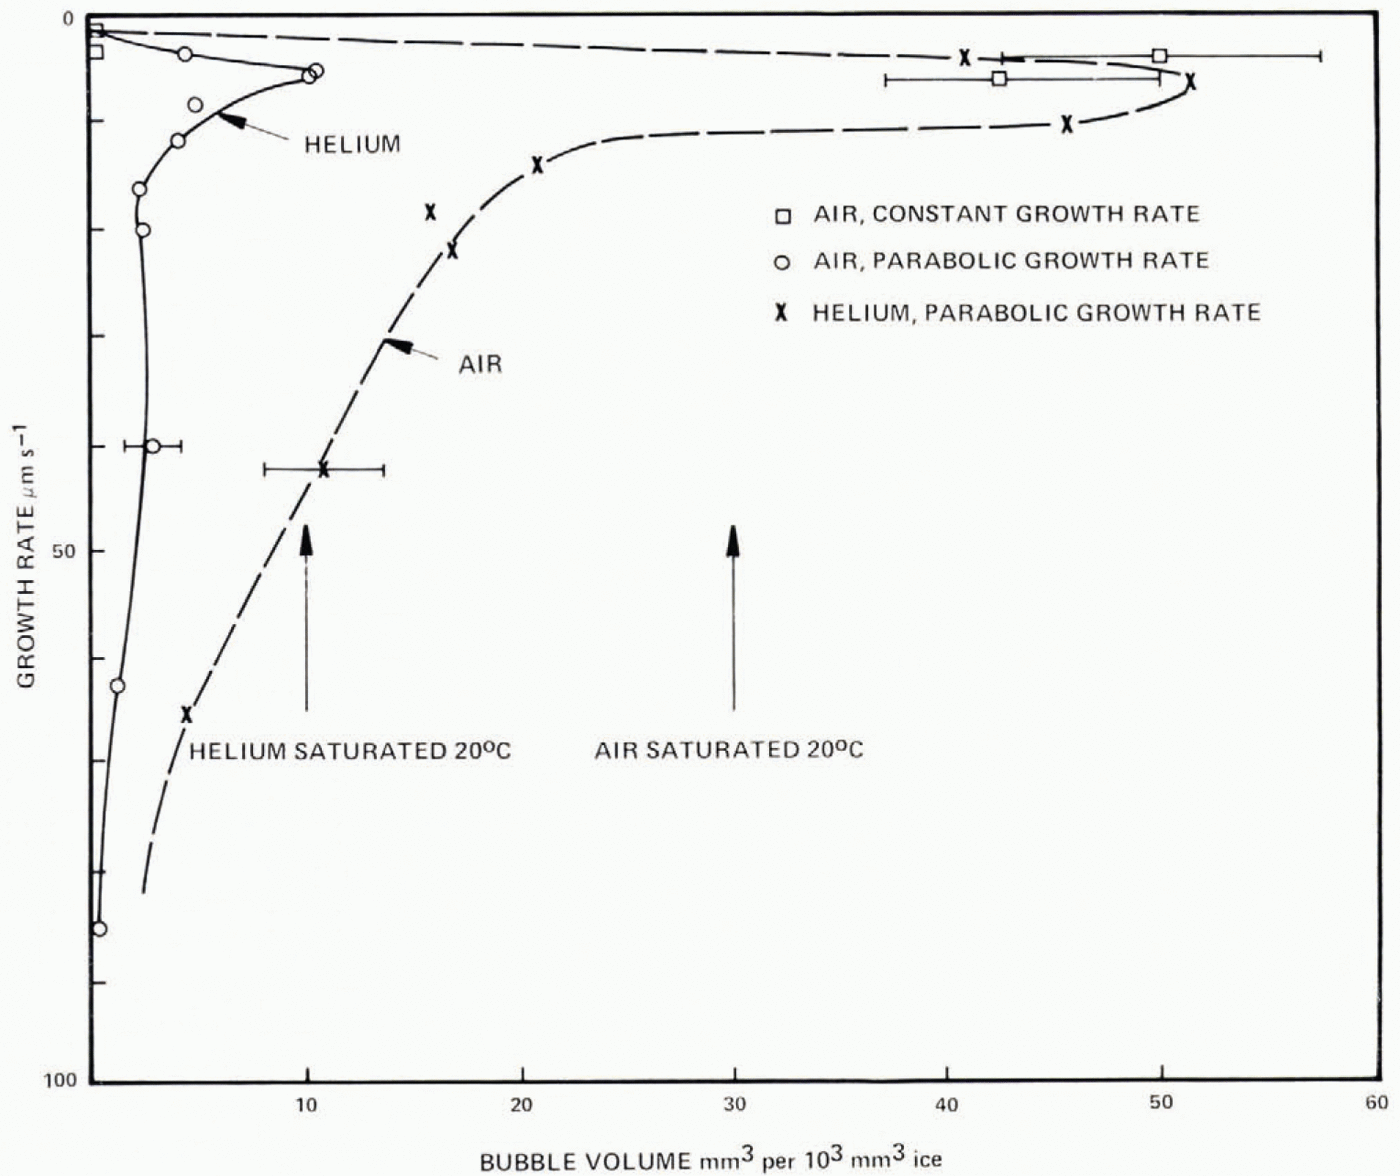
Fig. 23. Relation of bubble volume to growth rate for water saturated with air and helium 20° C, 850 mbar pressure. Errors arise mainly from statistics of bubble concentration.
Air incorporation in ice can be formally examined from the equations of Section II with constant partition coefficient. Once steady-state growth has been reached, which does occur in the splash freezing, the concentration in the solid should be identical with that in the liquid distant from the interface. From a different viewpoint, evidence has been accumulating that the partition coefficient shows a significant dependence on growth rate. Seidensticker (1972) showed for the HCl–ice system K varied from 0.08 to 0.000 2 over the experimental range of growth velocities, with experiments carried out in the transient growth regime. In either case, question arises concerning the mechanism of incorporation of air molecules at a molecular level. Vacancy concentrations are far too low and leave the possibility of the formation of a clathrate compound.
VI. Application
Exclusion of air during freezing is a process which occurs during freeze–thaw cycles in a glacier, in the formation of lake ice, and in hydrometeors formed by freezing of supercooled water drops. Studies reported here are most applicable to quiescent freezing of lake water. It should be possible to deduce freezing rate from the bubble shape in Figure 2, although there will always be some uncertainty because of unknown particulate content. Application in other situations is limited by unknown pressure changes which may occur during freezing. A symmetrically freezing drop may achieve pressures of up to 70 atmospheres (Visagie, 1969), so that pressure relief by cracking leads to instantaneous bubble nucleation, primarily in a concentric shell in the highly supersaturated water near the growing interface. This can be seen in the sections made by Knight and Knight (1968) of ice spheres nucleated at 5 deg of supercooling and frozen in alcohol at −78° C. Inward freezing rates are estimated ≈ 50 μ m s−1, which could be approached by spongy hailstones freezing while falling in a cloud-free atmosphere at −20° C. Small bubbles ≈ 100 μ m in diameter separate clear ice dendrites grown after initial nucleation from the ice which forms at a later stage. This enables the rapid freezing technique to operate as a powerful tool for investigation of spongy ice in hailstones. The interface velocity of a symetrically freezing drop increases rapidly as the unfrozen radius shrinks; Figure 24 shows the growth rate computed after Johnson and Hallett (Reference Johnson and Hallett1968) for drops of initial radius 10 μ m and 100 μ m freezing during free fall in an environment at −10° C; freezing rates cover the entire range discussed in this investigation.
The converse problem is one of a hailstone which is growing near the wet limit by accretion of drops, and nucleating air bubbles as ice grows outward into a surface liquid layer ≈ 50 μ m deep formed as supercooled drops accrete. Growth velocities are here ≈ 50 μ m s−1; the pressure is ambient. The significant difference is that the diffusion boundary layer is of thickness comparable with the liquid and gives a lower supersaturation than in a deep liquid as air escapes from the surface. An additional complication is the presence of a high concentration of insoluble particles in the water. Rosinski and Kerrigan (Reference Kahane, Kahane, Klinger and Phillipe1969) have found concentrations of μ m size particles ≈ 106 g−1 in hailstones which could have a significant effect on bubble size and size distribution. Further studies are evidently required to verify whether the optimism shown by List and others (Reference List, List, Murray and Dyck1972) concerning characterization of hailstone growth by the log-normal plot of the size distribution of hailstone bubbles is justifiable.
In summary, we conclude that bubble nucleation and growth at a growing ice–water interface is characterized by the initial air concentration, by the water particulate content, and by the growth rate. Deduction of growth conditions from air bubble characteristics may be achieved subject to the uncertainty caused by the variable particulate content.

Fig. 24. Freezing rate of ice spheres ventilated at terminal velocities, with initial radius 100 μm and 1000 μm: temperature −10° C.
Acknowledgements
This work was supported by Grant No. GA 27943 from the National Science Foundation, Atmospheric Sciences Section, Washington, D.C., U.S.A. Part of this work was submitted by S. A. Bari as a thesis for a higher degree in the Physics Department, University of Nevada, Reno.
Appendix Growth and Dissolution of Air Bubbles in Water
The rate at which air bubbles grow and dissolve in an air–water solution is influenced by:
a. Saturation ratio of the air–water solution, which changes with temperature and overlying air pressure,
b. Molecular diffusion towards the bubble,
c. Enhancement of molecular diffusion by motion of the liquid relative to the bubble,
d. Internal pressure of the bubble, depending on the depth below the surface and the surface tension. Following Epstein and Plesset (1950)Footnote * for diffusion growth of a spherical bubble,

where σ is the surface tension and (P i−P ∞) is the difference between the equilibrium air pressure over a plane surface at the site of the bubble and the actual (non-equilibrium) pressure al a long distance from the bubble.
The surface tension increases both the equilibrium internal bubble pressure and also bubble mass, and, therefore, enters twice in this relation. Where P i− P∞ = 0, that is just at saturation with respect to a plane surface, the bubble will always dissolve because of the excess pressure caused by surface tension. A bubble can only be in equilibrium with a closed system, where the air going into the solution is prevented from diffusion away by a solid boundary and a steady-state supersaturation eventually occurs. For a given bubble size, there is always a critical supersaturation below which dissolution will occur. For example, with an excess saturation of air of 10 atmospheres, bubbles less than 0.15 μ m in radius will dissolve (Table I). Various approximations to Equation (6) are of interest. The transient may be neglected when

The ventilation coefficient may be taken equal to unity for low flow velocity, (Re) ≪ 1. For a typical case, air bubble diameter = 100 μ m, liquid velocity ≈ 1 mm s −1, (Re) ≈ 0.05. Further, neglect of surface tension 2σ/r ≪ P i−P ∞ gives

with growth or dissolution depending on P∞  ,P i. The converse case, 2σ/r ≫ P i − P∞ gives

that is, the bubble always dissolves. Both of these equations may be integrated to give a parabolic relationship between size and time. The linear growth rate given by Equation (6) has a maximum where the effects of surface tension and of a spherical diffusion field are competing; this is given by differentiation of Equation (6) and taking the positive root. Typical curves are shown in Figure 25 and values of the maximum in Table IV. For P i− P ∞ = 10 atmospheres, the maximum growth rate occurs at r = 0.56 μ m, and decreases with larger supersaturation. Hence, bubble radius increases or decreases as  in either case.
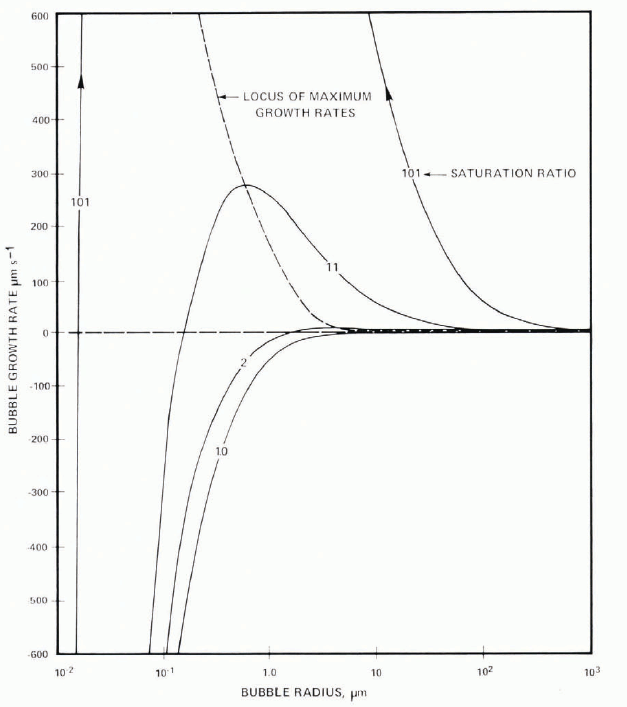
Fig. 25. Steady-state variation of growth rate of air bubbles as function of size and of air saturation ratio with respect to a plane surface.
Table IV. Equilibrium Radii and Radii for Maximum Growth Velocity of Air Bubbles Growing in a Supersaturated Solution of Air in Water.


