


Introduction
Barnes Ice Cap occupies an area of 5900 km2 on the central plateau of Baffin Island between 69.5 ° and 70.5 ° N. latitude (Fig. 1). Its base is at about 500 m a.s.l. and it rises to almost 1100 m in the north-central part. The thickness of the ice cap at the centre is 600 – 700 m (Reference Andrews, and BarnettAndrews and Barnett, 1979). Regional studies of late Wisconsinan (locally Foxe) glacial events by Reference Ives, and Andrews.Ives and Andrews (1963), compiled in maps by Reference Dyke, and PrestDyke and Prest (1987), concluded that Barnes Ice Cap attained its approximate present configuration less than 5000 years ago. The inferred progression of deglaciation to the present Barnes Ice Cap, coupled with the discovery by Reference Hooke,Hooke (1976) of Pleistocene ice at its base, identifies Barnes Ice Cap as a last remnant of the continental Laurentide ice sheet. There is evidence for Neoglacial and Little Ice Age re-advances in the form of a conspicuous suite of moraines on the west side of the ice cap. The innermost of these has been dated by lichenometry at less than 100 Bp (Reference Andrews, and Webber.Andrews and Webber, 1964; Reference Andrews, and BarnettAndrews and Barnett, 1979).
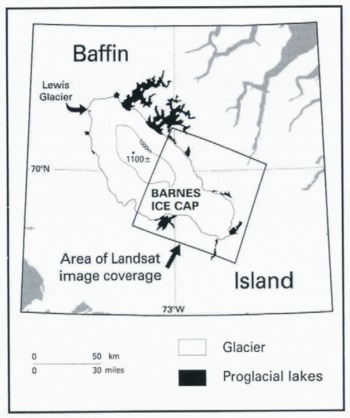
Fig. 1. Barnes Ice Cap, showing the area considered in this study.
Early glaciological studies (Reference Baird,Baird and others, 1952; Reference Ward, and OrvigWard and Orvig, 1953) suggested that Barnes Ice Cap is maintained near equilibrium with the present climate, largely by formation of superimposed ice in the accumulation zone. The superimposed ice forms when meltwater from the winter snow-pack percolates and refreezes. Such melting occurs even at the summit in most years. From studies in the early 1960s, Reference Løken, and Andrews.Løken and Andrews (1966) concluded that, while the ice cap may be self-maintaining, present climatic conditions would not support formation ab initio of an ice cap at this plateau location. Investigations of the ablation-season climate of Barnes Ice Cap by Reference Sagar,Sagar (1966) tended to support the idea of an inter-annually varying mass-balance regime that on average appeared to be maintaining the ice cap through the formation of superimposed ice. From asymmetries in its mass balance and profile, Reference Løken, and Andrews.Løken and Andrews (1966) inferred that the ice cap was retreating on its southwest margin and was static or possibly advancing to the northeast. From his analysis of ice flow and moraine character along the southeast margin, Reference Hooke,Hooke (1973) presented a model of ice-cored moraine formation which was consistent with a Little Ice Age advance in that sector. Further studies in that area included temperature profiles taken to or near the base of the ice along a 10 km stake line running northeast from the south dome of the ice cap to the margin (Reference Hooke,, Alexander and GustafsonHooke and others, 1980). Initial interpretation of the horizontal gradients of englacial temperatures suggested a post-Little Ice Age warming as early as 250 BP (Reference Hooke,, Alexander and GustafsonHooke and others, 1980), which is somewhat earlier than the c. 100 BP date indicated by the lichenometric evidence (Reference Andrews, and BarnettAndrews and Barnett, 1979). Hooke (personal communication, 1996) has subsequently suggested that the down-glacier increase in basal temperature gradient may be a consequence of increased thinning of the ice near the margin, which would be consistent with a later date for the onset of warming. Reference Hooke,, Johnson, Brugger, Hanson and Holds-worthHooke and others (1987) reported on surveys taken along this same stake line between 1970 and 1984. Large inter-annual differences in mass balance were observed but the net balance averaged over the transect was negative for the 14 years and it was estimated that the ice cap in this sector had thinned by about 2 m over that period (Reference Hooke,, Johnson, Brugger, Hanson and Holds-worthHooke and others, 1987).
The general conclusion to be drawn from these studies is that Barnes Ice Cap was downwasting in its northwestern and southern parts but there was no evidence for any retreat on the northeast side. The actual flow regime was more complex than the relatively simple geometry that the ice cap suggested, and the position of the divide was being displaced northeastward. These conditions were represented reasonably well in a numerical model for Barnes Ice Cap developed by Mahaffey (1976). She attributed discrepancies in the model to non-uniform basal sliding, a conclusion supported by the evidence presented by Reference Holdsworth,Holdsworth (1973) for episodes of surging on part of the south dome of the ice Cap.
Further observations of Barnes Ice Cap were undertaken by Reference Jacobs,, Heron and Luther.Jacobs and others (1993), with the objective of producing a more accurate climatology while monitoring changes occurring along the ice-cap margin. From July 1989 to July 1995, an automated climate station was operated at the northwest margin of the ice cap, and from July 1991 to May 1992 and from May 1993 to May 1995 a station was operated on the ice-cap summit. In 1989 and 1991, surveys were conducted at the front of Lewis Glacier (Fig. 1) and the field data were used in conjunction with Landsat imagery to map changes in that sector. The analysis showed that Lewis Glacier had been receding from its 1961 position at an average rate of 25 m a−1, and that there had been general retreat along this 40 km northwest perimeter of about 10 m a−1 (Reference Jacobs,, Heron and Luther.Jacobs and others, 1993). It was concluded that recession was continuing along the northwest margin at a rate equal to or greater than had been reported some 30 years previously (Reference Andrews, and Webber.Andrews and Webber, 1964; Reference Andrews, and BarnettAndrews and Barnett, 1979).
A strong correlation has been found between annual net balance on Barnes Ice Cap and summer temperatures recorded at permanent meteorological stations in the region (Reference Sagar,Sagar, 1966; Reference Hooke,, Johnson, Brugger, Hanson and Holds-worthHooke and others, 1987). However, there is no correlation between mass balance on the ice cap and winter precipitation at the nearest station, Dewar Lakes, which is 120 km to the south (Reference Hooke,, Johnson, Brugger, Hanson and Holds-worthHooke and others, 1987). The long-term record of regional temperatures should therefore be a guide to mass-balance trends on the ice cap. According to Reference Kelly,, Jones, Sear, Cherry and TavakolKelly and others (1982), mean annual temperatures in northeastern Canada and western Greenland increased by about 2 – C between 1890 and 1930, and began to decline slowly thereafter. Ice-core evidence from the Canadian High Arctic indicates that ablation-season temperatures during the 100 a period ending around 1951 were the highest in at least 800 a (Reference Koerner, and LundgaardKoerner and Lundgaard, 1995). Dating by Reference Andrews, and BarnettAndrews and Barnett (1979) of the retreat of the western margin of Barnes Ice Cap from Little Ice Age moraines within the last 100 a is consistent with that climatic history.
The recent regional record of temperature for the eastern Canadian Arctic (Reference Chapman, and WalshChapman and Walsh, 1993), as well as the shorter record of observations on and adjacent to Barnes Ice Cap (Reference Sagar,Sagar, 1966; Reference Jacobs,, Heron and Luther.Jacobs and others, 1993), indicates that the ablation-season climate of the ice cap has not changed significantly during the past three decades. High spatial variability in the regional precipitation records precludes extrapolation of winter snowfall data from surrounding stations (Reference Jacobs,Jacobs, 1989). However, there has been a trend toward lower winter and spring temperatures of about −0.02 ° Ca−1 (Reference Chapman, and WalshChapman and Walsh, 1993) and it is therefore unlikely that any increase in winter precipitation has occurred.
In his presentation of evidence for extensive Little Ice Age ice cover north of Barnes Ice Cap, Reference Ives,Ives (1962) raised the question of whether glacier recession of the past 200 – 400 years in that area represented a response to a recent climate change or a continuation of a process that had been ongoing for several thousand years. The answer depends upon the response time of the ice cap; that is, the time required for the glacier to reach a new equilibrium thickness and length after a step change in mass balance. Reference Nye,Nye’s (1960) model, based on kinematic wave theory, predicts a response time for a glacier the size of Barnes Ice Cap on the order of 102 – 103 a. A similar result was obtained by Reference Paterson,Paterson (1994, p.320) using a steady-state profile model. Reference Jóhannesson,, Raymond and WaddingtonJóhannesson and others (1989) have developed a more general approach to what they define as the glacier “memory”, that is, the time constant for a mass-balance adjustment towards a new steady state after a climate change, which gives values that are roughly an order of magnitude less than those predicted by Nye’s theory. This would imply that the current state of Barnes Ice Cap is largely a response to climatic conditions occurring in the early 20th century; therefore, in the absence of any significant recent trend in ablation-season temperatures, no dramatic change in the rate of recession should be expected in the near future. As a test of these ideas, further monitoring of changes at the margin of Barnes Ice Cap has been undertaken using Landsat coverage, with the application of geographical information systems (GIS) techniques. In this paper, we describe these methods and report on the analysis of the part of the ice cap south of 70 °N.
Method and Results
The topographic basis for the analysis was a set of 1:50 000 National Topographic System (Canada) map sheets of the ice-cap area compiled from 1961 aerial photography by the Surveys and Mapping Branch, Department of Natural Resources. These paper maps were manually digitized and joined into a single digital map file. The horizontal positional accuracy of the 1 : 50 000 map is a nominal 25 m, with a further estimated probable error of 15 m in the manual digitizing. The r.m.s. horizontal positional error of the digital map is therefore 29 m. The final digital map consists of the 1961 ice-cap margin with vector layers corresponding to the 1961 contours and drainage patterns.
A Landsat-5 Thematic Mapper (TM) image was acquired in order to update the position of the ice-cap boundary. The image, registered on 3 August 1993, covers approximately the southern half of the ice cap with a spatial resolution of 30 m. Analysis included geometric and atmospheric corrections, radiometric calibration and classification of the image to identify glacier facies, open water and the surrounding bedrock and surficial deposits. A series of oblique (hand-held) colour photographs taken during a low-level flight along the ice-cap perimeter in July 1994 was used to identify the main units classified with the satellite image.
Geometric correction was based on a series of 47 ground-control points distributed over the whole image quadrant. A control point in this context is a set of x,y coordinates corresponding to a feature, such as a small lake or river tributary, that is visually recognizable on both the T M image and the 1: 50 000 map sheet. The image was registered to the Zone 18 UTM grid using a cubic polynomial surface and the nearest-neighbour resampling method. The total r.m.s. error of the registered surface is 0.54 pixels, which corresponds to a ground distance of 16.2 m. Individual ground-control point residuals are below 1 pixel. Therefore, the location error of the pixels included in the computed polynomial surface, with reference to the UTM grid, is kept below the spatial resolution of the image. Atmospheric correction involves the subtraction of the path-radiance digital number (DN) equivalent from each image band. The path radiance corresponds to the signal associated with atmospheric scattering. The DN equivalent was approximated using the method of Reference Chavez,Chavez (1988) for a clear sky, which is mainly affected by Rayleigh scattering. The radiometric calibration computes the surface radiance from the raw DN of the image and approximates the corresponding surface reflectance. The calibration constants were as provided by Reference Markham, and Barker.Markham and Barker (1986) and the Sun position was taken from the image specifications.
The usefulness of Landsat TM4 (0.76 – 0.90 μm) and TM5 1.55 – 1.75μm) spectral bands to map glacier facies has been demonstrated by Reference Williams,, Hall and BensonWilliams and others (1991). Those authors showed from visual-image interpretation that a good correspondence exists between TM4 and TM5 image raw DN values and glacier units such as snow facies, ice facies, slush zone and moraine. The TM4/TM5 image ratio was found by Reference Hall,, Chang,, Foster, Benson and Kovalick.Hall and others (1989) to be useful in separating the ice facies from the fresh-snow facies. In the present study, the classification of the glacier facies is based on the segmentation of the TM4/TM5 image ratio. This ratio is effective at differentiating ice, open water and deglaciated surfaces such as bedrock and unconsolidated material. Glacierized and ice-free areas are distinguished by the variation of their spectral response from the TM4 to the TM5 band. The reflectance of deglaciated bedrock and vegetation increases from the 0.76 – 0.90 μm to the 1.55 – 1.75μm spectral band. The opposite occurs for ice and water, where reflectance decreases dramatically from the TM4 to the TM5 band, with the reflectance of ice estimated to be below 2% in the TM5 spectral band. This threshold was estimated from 50 000 pixel values computed for an area near the middle of the ice cap which showed an average reflectance of 0.3% and a maximum rellectance of 1.3%. Open water is clearly differentiated from ice and all other surfaces with the near-infrared image (TM4). In that spectral band, the image histogram shows a low reflectance distribution function (pixel count) peak corresponding to water and a high reflectance peak corresponding to land features. Figure 2 presents a summary of the criteria used to classify ice, water and deglaciated surfaces on the image.

Fig. 2. Classification criteria for ice, water and rock/vegetation.
Confusion remains in the classification between areas of the glacier margin that are covered by rock debris and adjacent ice-free areas. This is illustrated with a part of the 1993 classified image showing a lobe on the extreme southeast margin of the ice cap Fig. 3). Reference Holdsworth,Holdsworth (1973) attributed this lobe to a surge, probably in the early 1900s. A low-level oblique photograph taken of the same area in July 1994 (Fig. 4) clearly shows the debris-covered fringe and gives some indication of the width of this zone. As Reference Hooke,Hooke (1973) observed, debris layers near the margin may inhibit melting locally, resulting in the formation of an ice-cored moraine some distance within the ice margin. The glacier can be said to have retreated back from such a moraine only if there is ice-free terrain between the moraine and the present ice margin, as is the case with the outer moraine (A) in Figure 3. What is seen to be debris-covered ice in the low-level photograph Fig. 4) is so interpreted in this part of the image (C in Fig. 3); however, the digital analysis was not able to make this distinction. If the area shown in Figure 4 is representative, as earlier maps of the debris-covered ice in this sector by Reference Løken, and Andrews.Løken and Andrews (1966) indicate, locating the present position of the ice-cap margin with reference to the proximal side of the debris zone would overestimate the amount of retreat by 100 m or more.
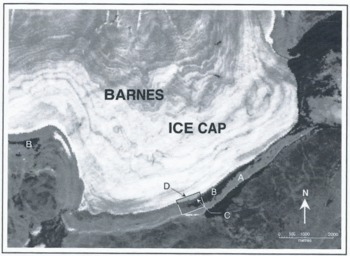
Fig. 3. Part of Landsat TM (TM4) image for 3 August 1993, showing the southeast lobe of Barnes Ice Cap with: A, moraine shown on 1961 map; B, proglacial lakes formed between 1961 and 1993; C, debris-covered ice; D, area shown in Fig. 4.
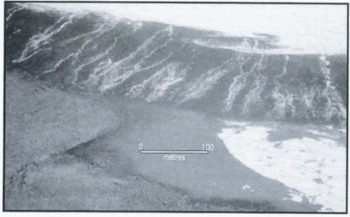
Fig. 4. Low-level (approx. 150 m) oblique aerial photograph taken on 15 July 1994 of the ice-cap margin, showing a clear distinction between ice, debris-covered ice, ice-free terrain and water. The scale bar applies approximately to the mid-field.
The digital base map and the georeferenced, classified image were combined in a GIS framework to produce a map of Spatial – temporal change for the 1961 – 93 interval (Fig. 5). The combined (r.m.s.) error of the digitized base map and georeferenced image is 33 m. This was rounded up to 100 m, resulting in the elimination in the change analysis of polygons with a length of less than 100 m. Four substantive classes resulted: the areas classified as glacier in both periods, those classified as ice-free in both, those that had become ice-free and those that had become ice-covered. The results are shown in Table 1 for the entire area of Figure 5.

Fig. 5. Composite map showing the change between the 1961 and 1993 maps.
Table 1. Changes in area in each of the map classes of Fig. 5 between 1961 and 1993

It is evident that recession has occurred over most of the southern perimeter of the ice cap. A minor area classified as ice-advance was found, upon inspection of the air photographs, to correspond to seasonal ice in a proglacial lake. Based on comparison of the map classes, the total area exposed by retreat could be as much as 43 km2, or an average retreat of 237 m over the 183 km part of the margin that was analysed. This is considered to be an upper limit, owing to the uncertainty in distinguishing between debris-covered ice and proglacial moraine. Allowing for a 100 m wide zone of debris-covered ice along the margin, the total area that became ice-free between 1961 and 1993, as shown in Figure 5, would be only 25 km2, which is equivalent to an average retreat of 137 m, or about 4 ma−1. The actual amount of change probably lies between these two estimates.
Conclusion
Extensive marginal recession is an indication that an ice cap is undergoing attrition. Previous analysis (Reference Jacobs,, Heron and Luther.Jacobs and others, 1993) showed that parts of the northwest and western margins of Barnes Ice Cap were continuing their retreat from 19th century moraines. The task undertaken here was to determine whether the retreat was general over a large part of the southern perimeter of the ice cap. Medium-scale topographic maps, prepared from 1961 photo-grammetry, provide an accurate reference against which subsequent change can be quantitatively assessed using remote sensing. This was done by creating a digital base map and superimposing a digital surface-cover map derived from recent Landsat TM imagery. The combined (r.m.s.) locational errors of the digitized map and the georeferenced image are less than 40 m. Additional uncertainty in the interpretation of features, arising from confusion between debris-covered ice and ice-free areas, is dealt with through buffering, based on existing maps and field observations. Using this conservative approach to positional and classification error, we have shown that there has been significant recession over most of the southern perimeter of the Barnes Ice Cap during the past three decades. Viewed in conjunction with previous studies, this leads to the conclusion that Barnes Ice Cap is in a state of sustained decay under the present climate, which has been characterized by relatively stable ablation-season temperatures. It is interesting to note that Reference Mahaffy,Mahaffy’s (1976) numerical model of Barnes Ice Cap predicted a decrease in area of 14% (2.5% in volume) after 360 years, under constant climate. The present study showed an actual reduction in the area analysed of between 1 and 2% in 32 years, which is roughly in agreement with her prediction.
It remains to be determined whether recession is also occurring along the northeast margin of the ice cap, which is outside the limits of the Landsat image analysed here. Aerial reconnaissance in 1994 revealed some areas of lichen trim but these are for the most part associated with the Little Ice Age extension of Barnes Ice Cap (Reference Ives,Ives, 1962). Given the relatively slow rates of lichen recovery (Reference Andrews, and BarnettAndrews and Barnett, 1979), it is probably not possible to measure more recent changes of the margin with reference to lichen trim from remote visual inspection or photography. However, under the present climate, it is unlikely that any advance of the ice cap to the northeast is occurring. This is expected to be confirmed in the course of ongoing studies using the methods presented here for additional Landsat TM analysis, with the addition of satellite SAR imagery.
Acknowledgements
The Barnes Ice Cap investigations were supported by the Natural Sciences and Engineering Research Council of Canada, the Atmospheric Environment Service and the Polar Continental Shelf Project, with additional logistical support from the Iqaluit Research Centre. Assistance was provided in various aspects of the study by A. Headley, D. McNichol, R. Deblicquy, G. McManus, B. Hogan and L. Baldwin. Critical comments on an early version of this paper by R. LeB. Hooke, R. Braithwaite and J. Johnson are gratefully acknowledged.


