


Introduction and Study Area
Miage glacier (45˚47′ N, 6˚52′ E) drains the southwest slope of Mont Blanc in Valle d’Aosta (Western Alps); 11km2 in area, it is the third largest glacier in Italy. The glacier tongue is debris-covered below ∼2500ma.s.l., initially by medial moraines, then more uniformly across the entire surface; debris thickness exceeds 0.5m near the terminus. Miage lake is dammed between the right-lateral moraine and an ice cliff (Fig. 1). Since the first scientific observation of the glacier, by Reference De SaussureDe Saussure (1779), many studies have been carried out on its morphologic and glaciological characteristics (Reference BarettiBaretti, 1880; Reference SaccoSacco, 1917; Reference LescaLesca, 1956; Reference CapelloCapello, 1959; Reference DelineDeline, 1999; Reference Smiraglia, Diolaiuti, Casati and KirkbrideSmiraglia and others, 2000; Reference Thomson, Kirkbride and BrockThomson and others, 2000). Less attention has been paid to the calving processes acting on its ice cliff and to their relations with lake evolution and glacier debris cover.
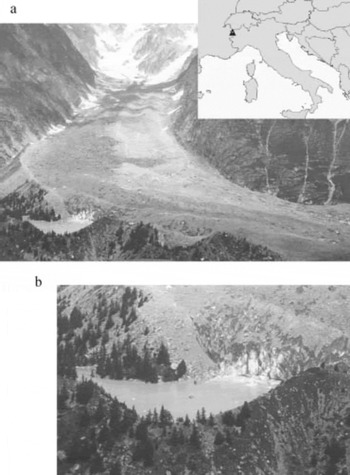
Fig. 1. (a) Miage glacier and Miage lake in 1999. Inset is the study site’s location in Italy. (b) A zoom view of the lake, showing the glacier ice cliff and the lake’s shape. (Photographs by D. Casati.) lake basin (computed by Reference LescaLesca, 1956).
This paper aims to improve understanding of lake-proximal glacier dynamics and calving processes, and it is hoped that it will lead to further studies assessing the implications for lake growth, calving-wave generation and outburst flood hazards. Miage lake is a popular tourist destination where there is concern about visitors’ safety because of calving waves. In the last episode, in summer 1996, 11 tourists on the lake boundary were carried away by a wave following a large iceberg fall.
Recent Evolution of Miage Lake
The record shows a lake history marked by topographic changes and lake-level fluctuations (including several drainage events) over the last 162 years. The earliest record of the ice-contact lake is the 1 : 25 000 topographic map by Reference ForbesForbes (1843) (Fig. 2). The small lake was located on the west side of the present basin, with ice filling the larger eastern sector of the modern lake. Reference BarettiBaretti’s (1880) survey shows three lake basins totalling 22 000 m2 in area (Fig. 3): two divided by a narrow isthmus and a third separated by a moraine ridge in the eastern sector of the modern lake. Baretti assumed that this third basin was floored by ice. The lake surface altitude was close to the present altitude of ∼2020ma.s.l. (IGMI, 1929). The 1 : 4000 Mappa catastale (Catasto di Courmayeur, 1893) shows a lake area of 10 000 m2, reduced by –12 000 m2 due to a glacier advance of 110m into the

Fig. 2. The hand-drawn sketch by J.D. Forbes (Reference ForbesForbes, 1843). The lake is visible on the right side of the glacier.

Fig. 3. A 1 : 10 000 scale map of the tongue of Miage glacier by Baretti in 1879 (from Reference BarettiBaretti, 1880). Note the lake divided into three basins on the right side of the glacier.
Comparison between the 1893 and 1956 maps and our own surveys (2002 and 2003) reveals planimetric retreat and altitudinal decrease of the bounding moraine ridges, probably due to mass movements on the proximal slopes following glacier retreat phases.
An 1890 photograph by Reference SaccoSacco (1917; photograph not available, but described by Reference LescaLesca, 1956) shows differences between the east and west basins; the former was ice-filled, and the latter close to the present configuration. In 1905 there was only one basin, but in 1916 it was again divided into two independent basins, the first extending from the ice cliff to the more recent moraine ridge, the second smaller one located to the west. In 1917 the lake was again a single water body below a 30m high ice cliff, as confirmed by Sacco’s 1918 surveys (Reference SaccoSacco, 1919). In 1929, Capello observed a single water body with the surface close to the present altitude (2020ma.s.l.), but in August 1930 the lake began to slowly empty, leaving a residual lake on the western side and a small pond close to the ice cliff (Reference CapelloCapello, 1940). The former lake floor was mantled by a thick cover of fine till. The lake refilled, after which little change occurred for 20 years (Reference LescaLesca, 1956).
A second drainage event occurred on 10–13 August 1950, leaving a residual lake in the western sector and a small pond on the eastern side, as in 1930 (Reference CeruttiCerutti, 1951). The absence of sediment in the southeastern basin revealed an ice floor extending to the moraine ridge on the northern side (Reference NangeroniNangeroni, 1950–51; Reference SaibeneSaibene, 1951). The ice floor was perforated by debris-filled holes and fractures in debris-rich ice. Refilling occurred in autumn 1950, and both west and east basins were filled by 1951 (Reference LescaLesca, 1956). Lesca’s 1952V 53 surveys showed the three lake outflows and two inflow streams. The August mean midday discharge of the two inflows was 0.02 m3 s–1, about 25% less than that measured for the three outflow rivers over the same period (Reference LescaLesca, 1956). Lesca’s photograph (Fig. 4a) shows more boulders above the lake surface than at present (Fig. 4b) for the same lake surface altitude, implying some lake-floor instability.

Fig. 4. (a) 1953 photograph by C. Lesca of Miage lake (from Reference LescaLesca, 1956) close to the ice cliff. Boulders and debris protrude from the lake surface. (b) 2003 photograph by T. Carnielli reporting the same part of the lake 50 years later; only two small boulders show above the water surface.
Survey Methods
Archive information (historical maps and aerial photographs) was processed by Geographic Information System (GIS) software to calculate lake surface and volume variations during the 20th century, glacier volume changes and surface velocity. Digital aerial photogrammetry allowed surface velocities between 1975 and 1991 to be calculated. Fieldwork in summer and winter 2002–04 determined direct measurement of volumetric changes of the ice cliff, glacier surface velocities, lake bathymetry and temperature.
To calculate change in the position of the calving front, ten separate topographical surveys were made with a laser distance meter (Criterion 400), each from two fixed positions on the lake boundary. For each survey, about 600 points for the whole ice-cliff surface (6000m2) were collected and a digital elevation model (DEM) was calculated. The measurements were found to be accurate to within ±0.1˚, equating to a horizontal accuracy of ∼±0.03 m. Comparison of the DEMs provided the ice-cliff volume variations, once adjustment had been made for glacier velocity in the intervening period.
Glacier surface velocity was measured over two periods, 1975–91 and 2002–03. For the first period, we used aerial photographs to measure the displacement of 24 boulders on the glacier surface. This analysis allowed mean 16 year surface velocities to be determined. Details of the method are given elsewhere (Reference Smiraglia, Diolaiuti, Casati and KirkbrideSmiraglia and others, 2000). For the second period, we undertook a field campaign in which differential global positioning system (GPS) measurements of 12 points were made in 12 surveys during the summers of 2002 and 2003. The base GPS receiver was located on vertices with known coordinates, marked by metal pegs, on the moraine ridge bounding Miage lake, to improve the accuracy of the measurements taken by differential GPS (fast static technique) with short bases. We checked the results against the values calculated from optical topographical measurements by Reference LescaLesca (1974) on a GIS layer (Fig. 5).

Fig. 5. Displacement map of the 24 boulders (black crossed points) used by Reference Smiraglia, Diolaiuti, Casati and KirkbrideSmiraglia and others (2000) of the 12 GPS measurement points (triangles) used by the authors and of the points (black and white points) used by Reference LescaLesca (1974) to evaluate the Miage glacier surface velocity. The velocity rate values were obtained by dividing the total displacement for the time range (1965–71, 1975–91 or 2002–03).
Lake temperature and depth were measured in July 2003 and January 2004 using a Lowrance 200 kHz sonar with a thermistor integrated for surface temperature sampling (at 0.10 m depth on the whole lake surface), and two GPSs for georeferencing the survey. Vertical temperatures were measured at metre intervals to 15 m depth at five different profiles along a cross-section of the lake, both in summer (from an inflatable boat) and in winter (by coring through 1.5 m lake ice cover).
Results
Glacier surface velocity
The results (Fig. 5) show a downstream decrease in mean annual velocity. In the middle–upper sector of the glacier tongue, velocities are ∼70ma–1, compared to the 61 ma–1 calculated by Reference CuniettiCunietti (1961) using terrestrial photogrammetry. At 2100ma.s.l., the velocity is 60 ma–1, decreasing to 30–40ma–1 where the flow deviates eastward (2000ma.s.l.), and to 15 ma–1 near the terminus. Velocity was less (6ma–1) on the outer edge of the south lobe, and there was no movement at the point on the right-lateral moraine, employed as a control point (Reference Smiraglia, Diolaiuti, Casati and KirkbrideSmiraglia and others, 2000).
Recent field surveys (Fig. 5) confirm the spatial patterns identified in earlier work and quantify present ice flow towards the ice cliff at Miage lake.
Lake evolution and features
To evaluate the lake surface variations over the last century, all the available historical maps were analyzed by GIS. Details on data sources, map scales and accuracy are given in Table 1, together with the area values computed. From 1893 to 1956, the lake was enlarged by +24 600 ±4000 m2. Since this surface increase, the lake area has been stable, as shown by map comparisons (all the values are close to the map accuracy, with no significant changes in lake area and volume).
Table 1. Maps used for calculating and comparing lake areas

Bathymetric survey shows that the lake consists of two basins separated by a largely submerged moraine (Fig. 4b). Each basin has distinct limnological characteristics. The ice-proximal basin has a complex thermal structure in summer, influenced by melting icebergs, wind-driven surface currents, dense meltwater underflows and other factors. In January 2004 this basin was isothermal at close to 0˚C. In contrast, the ice-distal basin is dimictic, with warm surface water (7–12˚C) overlying cooler water in summer, and cold water below surface ice and overlying warmer deep water (∼2.5˚C) in winter (Fig. 6). The recent bathymetric surveys (Fig. 7) suggest no change in water depth since 1953, given that the lake surface altitude of 2020ma.s.l. is identical to that in the early surveys. Archive data show that the submerged moraine previously protruded above the lake surface (Fig. 4a and b). Now only two large emerging boulders mark its presence.

Fig. 6. 2003 summer surface temperature map of Miage lake. The data represent water temperature at 10cm depth. A total of 556 points were collected by boat (using GPS to georeference the samples) and processed using Surfer software.

Fig. 7. Bathymetric map of Miage lake based on 556 points collected in the summer 2003 survey. Spot measurements were georeferenced by GPS survey and processed using Surfer software. The two basins, separated by a submerged ridge (Little Ice Age moraine), are evident.
Ice-cliff features, processes and changes
The ice cliff exhibits an annual cycle of summer retreat and winter advance. Calving is a seasonal event occurring only during the summer melt. When considering how calving is influenced by ice flow, opening crevasses and lake water, we observe two contrasting calving processes. In the eastern part of the ice cliff, calving is controlled by the development of deep melt notches at the water-line; these progressively undercut the ice cliff, eventually leading to failure of the notch roof as described by Reference Kirkbride and WarrenKirkbride and Warren (1997) (Fig. 8b and c). In the higher, western part of the ice cliff, many calving events are triggered by the opening of crevasses at the cliff top, which progressively widen and propagate downward until toppling failure occurs (Fig.8a). Spalling of ice flakes and thermal undercutting also occur in this part of the cliff. The contrast appears to reflect higher surface velocities towards the western part of the lake (30–40ma–1; Fig. 5), the distribution of crevasses, and water depth and temperature at the cliff base.

Fig.8. (a–d) Sketches showing the characteristics of the four ice-cliff zones (see text for explanation). Sketches drawn by hand, partially inspired by the Reference Richardson and ReynoldsRichardson and Reynolds (2000) model. (e) Photograph locating zones a–d.
On the ice-cliff top, the supraglacial debris cover (0.10–1m thick) influences both albedo and ablation rate; differential ablation leads to a more irregular ice-cliff geometry. Not only does the ice-cliff top present an irregular boundary, but also the cliff face has a thin, irregular cover of fine debris (<0.02 m) which reduces albedo and increases melt rates. These processes radically influence the geometry of the ice cliff and give rise to different calving processes, allowing the cliff to be divided into four distinct zones (Fig.8) on the basis of long profile and dominant process (Fig. 8a–d). The zones are distributed in the down-ice direction due to oblique ice flow across the ice cliff. They thus represent an evolutionary sequence.
Zone a is characterized by a sub-vertical profile of the ice cliff that reaches 35m above the water surface, with 0.10–1.0m of supraglacial debris on a crevassed ice surface. The crevasses are actively opening, and rotation and calving of ice blocks occurs aided by ice flow and thermal undercutting at the water-line (Fig.8a). Spalling of ice flakes from the cliff face also occurs here. In zone b the profile is less steep, and opening crevasses are associated with projecting ice. Crevasse propagation is aided by glacier flow and ponded water within the crevasses, and by the thermal influence of debris covering crevasse walls, increasing conductive heat flow and melt (Fig. 8b). Zone c probably evolves from zone b, and is marked by slurry flows of meltwater, ice and clasts along old crevasses intersecting the vertical cliff face (Fig. 8c). Slurry flows were noted periodically (every 30–45 min), especially during early afternoon. Some events of this kind lead directly to calving of ice blocks from the main body of the cliff along crevasses acting as meltwater conduits. Zone d represents further evolution from zone c. Here, a lower ice cliff (<20 m) is heavily debris-mantled and the profile is gentle. Above the ice cliff, new crevasses open and fill with meltwater and debris (Fig. 8d).
The calculated change in volume of the glacier ice cliff due to calving phenomena is –92 000 ±180 m3 in 2002–03, equivalent to a mean horizontal loss across the whole cliff of 15 m.
Discussion
Observations of the lake dimensions and ice thickness span both halves of the 20th century. Earlier authors described a smaller lake and a glacier front closer to the Little Ice Age (LIA) moraine; at about the mid-20th century (1953), lake area increased and the ice cliff retreated from the LIA moraine. The lake maintained its larger dimension until the last survey (2003). This lake enlargement can be interpreted as a consequence of the prevailing of the calving rate over the other phenomena.
Glacier surface velocity data cover only the last 50 years, when the ice cliff has been relatively stable. Comparison of 2002–03 velocities with those reported by Reference CuniettiCunietti (1961) and Reference LescaLesca (1974) shows no significant changes. No earlier data exist to allow this parameter’s influence on the calving rate to be investigated.
Historical sources indicate that there were no significant changes in water depth during the 20th century, probably because the main surface outlet is anchored within a coarse boulder bed. This supports the findings of Reference SikoniaSikonia (1982) and Reference Pelto and WarrenPelto and Warren (1991) that water depth may not be the primary control on calving rate. Ice thickness at the lake margin has varied significantly over this period, however. In 1945, the ice thickness close to the ice cliff was 80m (M. Calciati, 1945, cited by Reference LescaLesca 1956), compared to a modern thickness of ≤55–60m based on our own measurements. This means that the ice-cliff height unsupported by buoyancy has reduced by ∼50%, which may have caused slower calving (now close to equilibrium with the glacier surface velocity) and an increasingly stable ice-cliff position.
At diurnal time-scales, the frequency of small calving events appears to peak in the early afternoon during the ablation season. This coincides with the daily melt maximum, discharging large quantities of meltwater into crevasses and into the subglacial hydrological system. The infrequent emptying of the lake basin helps to explain the role of subglacial water; in the literature, we find emptying episodes which are accurately described and well documented from the beginning to the second half of the 20th century as reported above. Since that period, at least ten other such cases have occurred, but only a synthetic report is available, based on a study of aerial photographs of Miage glacier (Reference Giardino, Mortara and BonettoGiardino and others, 2001). The discrepancy between Reference LescaLesca’s (1956) inflow and outflow discharge data demonstrates that subglacial water supply is important for the survival of the lake, and that emptying episodes may be caused by changes in local subglacial drainage, routing water away from the ice cliff instead of towards it, as local changes in glacier surface slope reorientate the equipotential surface near the ice margin. The presence of a subglacial water supply may also be manifest as the cold dense water found close to the ice cliff in the 2003 summer survey.
Miage lake shows complex glacio-limnological interactions due in part to its ice-marginal location. Historical reconstruction of lake evolution shows a period of glacier retreat in the mid-20th century, separating two periods of relative stability; the first half of the century is characterized by less stable lake dimensions than the second half, as indicated by the historical sources. Ice-cliff retreat does not appear to have been caused by water-depth or glacier velocity changes. Subsequent stabilization of the cliff location may be due to glacier thinning causing a reduction in the height of the ice cliff unsupported by buoyancy, and therefore a reduction in calving rate. The lake-floor morphology influences the thermal structure of the lake, where an ice-proximal basin has markedly colder water than a distal basin. Lake-water balance appears to depend on subglacial water input, and infrequent emptying and refilling events suggest sensitivity to reversals in the local ice-marginal equipotential surface and reversal of englacial water flow.
Acknowledgements
This research was supported by the Italian Ministry of Education, University and Research (MIUR) in the frame of the 2003 MIUR project (national co-ordinator P.R. Federici; local co-ordinator C. Smiraglia), ‘The ongoing transformation of Alpine Italian glaciers’. We are grateful for the cooperation of all the authors inside the AIGEO – Debris Covered Glaciers Working Group. We thank T. Hughes and R.R. Johnston for helpful comments on the first version of the manuscript, and D. MacAyeal for his help with revising the paper. We also thank the Regione Valle d’Aosta, the Commune of Courmayeur and the Fondazione Montagna Sicura in Courmayeur for logistical assistance. The authors thank D. Casati and T. Carnielli for their photographs.


