Prostate Cancer-Induced Changes in Urinary Odors at Biomarker Concentrations of PPQ with Validation by Sniffer Mouse Behavioural Assays
A B S T R A C T
Although prostate-specific antigen (PSA) is a significant tumor marker for prostate cancer at present, the low specificity (approximately 33%) and so on likely lead to an overdiagnosis and patient suffering from highly invasive prostate biopsy. Complementary measures with cancer-characteristic biomarkers could improve the specificity and accuracy of diagnosis before the biopsy. Previously, “sniffer mice” were shown to be super-sensitive to differences in odors and to discriminate between odors of urine mixtures from patients with bladder cancer before and after tumor resection as well as urine odors of mice with or without experimental tumors. Here, we showed that the sniffer mice discriminate efficiently urinary odors of patients with prostate cancer using an odor plume-guided Y-maze behavioural assay. Through discrimination training in forced-odor choice, statistically significant increases in correct odor choice rates showed the super-sensitivity of sniffer mice to the olfactory cue of ppq-level urinary biomarkers for prostate cancer in 106-fold diluted urine samples, where donor-unique odors were below the threshold. Moreover, we validated eight volatile urinary biomarkers nearly at their original relative concentrations as the prostate cancer cue even when adding a similar biomarker profile to the post-radical prostatectomy urine samples by the same behavioural score of the sniffer mice. These biomarkers and profiles could be useful for non-invasive tests for prostate and bladder cancers.
Keywords
Cancer biomarker, sniffer mouse, body odor disorder, behaviour assay, odor discrimination, non-invasive test
Introduction
Prostate cancer is the second most common cancer among men [1, 2]. Currently, prostate-specific antigen (PSA) level and digital rectal examination (DRE) constitute the major screening tests and have increased prostate cancer detection but led to a considerable overdiagnosis due to approximately 33% specificity of PSA testing and insensitivity to <0.2-mL tumor at an early stage [1]. Transrectal ultrasound-guided prostate biopsies (PBs) are required for the definitive diagnosis of prostate cancer. This examination, however, is highly invasive and may cause subsequent infections and bleeding, despite a requirement for repeated PBs due to a 30% detection rate at first biopsy [1]. In addition, an estimated percentage of patients with a low risk of progression is between 50% and 60% of newly diagnosed cases [2]. New biomarkers, such as PCA3 score, Prostate Health Index (PHI), microRNAs, PTEN gene, and cancer-specific metabolite profiles, have been proposed and investigated to improve the accuracy of diagnosis of early prostate cancer. These studies are still needed to determine values in cancer detection and prognosis, especially by comparison of prostate and other cancers for common microRNAs [1-4]. Complementary measures could markedly improve the specificity and accuracy of diagnosis before the PBs.
Diseases generally disrupt normal cellular metabolic pathways. When urinary metabolite profiles were analysed using solid-phase microextraction (SPME) and gas chromatography-mass spectroscopy (GC-MS), a significant difference was observed between cancer patients and healthy volunteers [5, 6]. However, urinary SPME-GC-MS profiles demonstrate high inter-individual variability, requiring principal component analysis (PCA) to discriminate among cancer types or supervised partial least square discrimination analysis to discriminate breast or colon cancer from healthy volunteers [5-8]. This requirement indicates an inability to classify individual samples in an overlapping range between positive and negative groups or between many distinct cancer types, especially near the cut-off values. Sarcosine, furan and p-xylene were reported as candidate biomarkers for prostate cancer but remained to determine their consensus specificities and accuracies across various diseases [1, 9].
As an extremely wide-ranging environmental sensor, the olfactory system would evolve to detect biologically important odor cues such as differences between urinary metabolites of disease vs. healthy individuals or those of predators vs. mating partners. Mice are known to express >1,100 olfactory receptors, ca. 3-fold higher than humans, and found to be superior in terms of discriminating closely related odors with higher accuracy over 95% [10]. Previously, “sniffer mice”, which are trained with an olfactory cue in an analogous fashion to sniffer dogs, were shown to discriminate between urine mixtures (Ums) from patients with bladder cancer before and after tumor resection in 106-fold diluted equal-occult blood conditions (below the detection level of dietary variations) as well as occult blood- or antibiotic drug metabolite-modulated samples in equally-diluted conditions [11]. These diluted Um samples simply addressed the effect of odor modifications by diet influences, reported in animal models [11-15]. Notably, sniffer mice discriminate between genetically determined mouse urine odors in a Y-maze, even though the mice had large dietary variation that influenced urine odors as well as urine odors of mice with or without experimental tumors [14-16]. This odor discriminating ability of mice for weaker olfactory cues may add an advantage over the above-mentioned GC-MS, which are influenced by dietary metabolites [15]. Moreover, sniffer mice are >108-fold more sensitive than GC-MS for the detection and discrimination of similar enantiomeric odors [17]. Sniffer dogs have been investigated to detect prostate cancer odors in urine samples [18-21]. Specificities and sensitivities range widely from 36-98% and from < 10-99%, respectively [1]. A long training period of one year would remain problematic in cost-benefit analysis, compared to about three months for training of sniffer mice. Therefore, we used sniffer mice to detect changes in urine odor in prostate cancer patients in a Y-maze.
Materials and Methods
I Experimental Groups and Stimuli
This study using human urine samples was approved in accordance with the relative guidelines and Japanese Laws by the Institutional Committee for the Ethics on the Experiments with Human Derivative Samples of Aino University (including urine sampling in Aino University Hospital and Kyoto-Katsura Hospital) and the National Institute of Advanced Industrial Science and Technology (Y-maze behavioural assays). All subjects signed informed consent.
The subjects included two groups of patients with prostate cancer: pre-radical prostatectomy (pre-RP) (n = 8, 62-78-years-old, eight men, patient IDs: P2, P5, P6, P8–10, P12, and P13) and pre-RP after neoadjuvant endocrine therapy (n = 6, 58–80 years old, six men, patient IDs: Pe1, Pe3, Pe4, Pe7, Pe11, and Pe14; treated with LH-RH (Takeda Pharmaceutical Co., Tokyo, Japan) except for Pe4 treated with Avolve (GlaxoSmithKline plc., Tokyo, Japan). After RP, no prostate cancer was estimated by PSA screening and computed tomography scan at the three-month mark. These examinations confirmed that all post-RP urine samples were collected from patients without prostate cancer.
Urine samples were collected in Aino University Hospital and Kyoto-Katsura Hospital from patients. Immediately after collection, samples were filtered through 0.2 μm filters and frozen at −20°C until needed. In order to maintain the olfactory cue of prostate cancer and to reduce diet-influenced, genetically determined body odors (an origin of inter-patient variability by donor-unique body odors) and occult blood-associated odors between odor pairs, we employed the urine mixtures (Ums) of 25 equal-volume urine samples (5 patients × 5 samples) as in the previous study [11]. Haemoglobin concentrations of urine mixture samples were roughly estimated using test strips (Uri-Ace Kc, Terumo Corp., Tokyo, Japan) and were used to determine extra-dilution rates for equal concentrations of occult blood (defined here as equal-occult blood) (Table 1, Supplementary Table 2).
Table 1: Blood, proteins, glucose testing in P-series
patient urine samples using urine test strips.
|
Pre-RP urine samples |
Post-RP urine samples |
Control Um |
|||||||||||
|
P2:Ui |
P5:Ui |
P6:Ui |
P8:Ui |
P9:Ui |
P:Um |
P2:Ui |
P5:Ui |
P6:Ui |
P8:Ui |
P9:Ui |
P:Um |
pre-TUR: |
|
|
Cancer |
pros. |
pros. |
pros. |
pros. |
pros. |
pros. |
blad. |
||||||
|
Stage |
Ⅱ |
Ⅱ |
Ⅱ |
Ⅱ |
Ⅱ |
5Ⅱ |
5Ⅰ |
||||||
|
Gleason score / Grade |
9 |
7 |
6 |
7 |
7 |
7.2 |
3H+2L |
||||||
|
Age |
77 |
70 |
62 |
63 |
69 |
62–77 |
69–91 |
||||||
|
Gender |
♂ |
♂ |
♂ |
♂ |
♂ |
♂ |
♂ |
||||||
|
Sampling (5
days) |
(-41)– |
(-34)– |
(-30)– |
(-30)– |
(-27)– |
(-41)– |
1–22 |
1–29 |
1–33 |
1–26 |
1–22 |
1–33 |
(-53)– |
|
Haemoglobin (mg/dℓ) |
|||||||||||||
|
stock Ui/Um |
1.00 |
1.40 |
0.00 |
0.00 |
0.00 |
0.50 |
0.02 |
0.15 |
0.00 |
0.00 |
0.01 |
0.02 |
0.13 |
|
10-1-diluted
Ui/Um |
0.10 |
0.15 |
0.00 |
0.00 |
0.00 |
0.10 |
0.00 |
0.02 |
0.00 |
0.00 |
0.00 |
0.00 |
0.00 |
|
10-2-diluted Ui/Um |
0.00 |
0.04 |
0.00 |
0.00 |
0.00 |
0.00 |
0.00 |
0.00 |
0.00 |
0.00 |
0.00 |
0.00 |
0.00 |
|
10-3-diluted
Ui/Um |
0.00 |
0.00 |
0.00 |
0.00 |
0.00 |
0.00 |
0.00 |
0.00 |
0.00 |
0.00 |
0.00 |
0.00 |
0.00 |
|
Dilution for equi-occult blood of 0.01 mg/dℓ or less
Hb |
|||||||||||||
|
Extra-dilution rate |
100 |
140 |
1 |
1 |
1 |
50 |
2 |
15 |
1 |
1 |
1 |
2 |
13 |
|
Protein (mg/dℓ) |
|||||||||||||
|
stock Ui/Um |
15.0 |
50.0 |
50.0 |
15.0 |
0.0 |
30.0 |
0.0 |
15.0 |
50.0 |
0.0 |
15.0 |
15.0 |
7.5 |
|
10-1-diluted
Ui/Um |
0.0 |
0.0 |
0.0 |
0.0 |
0.0 |
0.0 |
0.0 |
0.0 |
0.0 |
0.0 |
0.0 |
0.0 |
0.0 |
|
10-2-diluted Ui/Um |
0.0 |
0.0 |
0.0 |
0.0 |
0.0 |
0.0 |
0.0 |
0.0 |
0.0 |
0.0 |
0.0 |
0.0 |
0.0 |
|
10-3-diluted
Ui/Um |
0.0 |
0.0 |
0.0 |
0.0 |
0.0 |
0.0 |
0.0 |
0.0 |
0.0 |
0.0 |
0.0 |
0.0 |
0.0 |
|
Glucose (mg/dℓ) |
|||||||||||||
|
stock Ui/Um |
0 |
0 |
0 |
0 |
0 |
0 |
0 |
200 |
0 |
0 |
0 |
30 |
50 |
|
10-1-diluted
Ui/Um |
0 |
0 |
0 |
0 |
0 |
0 |
0 |
0 |
0 |
0 |
0 |
0 |
0 |
|
10-2-diluted Ui/Um |
0 |
0 |
0 |
0 |
0 |
0 |
0 |
0 |
0 |
0 |
0 |
0 |
0 |
|
10-3-diluted
Ui/Um |
0 |
0 |
0 |
0 |
0 |
0 |
0 |
0 |
0 |
0 |
0 |
0 |
0 |
Pros.: Prostate; pre-TUR: pre-Transurethral Resection; Blad.:
Bladder; Hb: Haemoglobin.
Individual patient urine mixture (Ui)
of equal volumes of five urine samples from each patient with prostate cancer. P-series
urine mixture (P:Um) of equal volumes of 25 urine samples
from five patient P2, P5, P6, P8, and P9 on five different days
for each pre- and post-radical prostatectomy (post-RP). Ranges of patient 1st–5th
sampling days are shown, when day 0 is the ablative operation day of the
patient. *Previously prepared and reported sample [11].
Table 1: Blood, proteins, glucose testing in P-series patient urine
samples (continued).
|
Parameters and diluted
urine samples |
Pre-RP urine samples |
Post-RP urine samples |
||||||
|
P10:Ui |
P12:Ui |
P13:Ui |
P:Um |
P10:Ui |
P12:Ui |
P13:Ui |
P:Um |
|
|
Cancer |
pros. |
pros. |
pros. |
pros. |
|
|
|
|
|
Stage |
Ⅱ |
Ⅱ |
Ⅱ |
5Ⅱ |
|
|
|
|
|
Gleason score |
8 |
7 |
6 |
7.2 |
|
|
|
|
|
Age |
62 |
78 |
66 |
62–77 |
|
|
|
|
|
Gender |
♂ |
♂ |
♂ |
♂ |
|
|
|
|
|
Sampling (5 days) |
(-34)– |
(-27)– |
(-27)– |
(-41)– |
1–29 |
1–22 |
1–22 |
1–33 |
|
Haemoglobin (Hb, blood)
(mg/dℓ) |
|
|
|
|
|
|
|
|
|
stock Ui/Um
(1st) |
0.06 |
0.00 |
0.00 |
0.50 |
0.00 |
0.30 |
0.00 |
0.02 |
|
10-1-diluted Ui/Um |
0.00 |
0.00 |
0.00 |
0.10 |
0.00 |
0.05 |
0.00 |
0.00 |
|
10-2-diluted
Ui/Um |
0.00 |
0.00 |
0.00 |
0.00 |
0.00 |
0.00 |
0.00 |
0.00 |
|
10-3-diluted Ui/Um |
0.00 |
0.00 |
0.00 |
0.00 |
0.00 |
0.00 |
0.00 |
0.00 |
|
Dilution for equi-occult
blood of 0.01 mg/dℓ or less Hb |
|
|
|
|
|
|
|
|
|
Extra-dilution rate |
6 |
1 |
1 |
50 |
1 |
30 |
1 |
2 |
|
Protein (mg/dℓ) |
|
|
|
|
|
|
|
|
|
stock Ui/Um
(1st) |
0.0 |
0.0 |
0.0 |
30.0 |
15.0 |
0.0 |
0.0 |
15.0 |
|
10-1-diluted Ui/Um |
0.0 |
0.0 |
0.0 |
0.0 |
0.0 |
0.0 |
0.0 |
0.0 |
|
10-2-diluted
Ui/Um |
0.0 |
0.0 |
0.0 |
0.0 |
0.0 |
0.0 |
0.0 |
0.0 |
|
10-3-diluted Ui/Um |
0.0 |
0.0 |
0.0 |
0.0 |
0.0 |
0.0 |
0.0 |
0.0 |
|
Glucose (mg/dℓ) |
|
|
|
|
|
|
|
|
|
stock Ui/Um
(1st) |
0 |
0 |
0 |
0 |
0 |
400 |
0 |
30 |
|
10-1-diluted Ui/Um |
0 |
0 |
0 |
0 |
0 |
80 |
0 |
0 |
|
10-2-diluted
Ui/Um |
0 |
0 |
0 |
0 |
0 |
0 |
0 |
0 |
|
10-3-diluted Ui/Um |
0 |
0 |
0 |
0 |
0 |
0 |
0 |
0 |
Pros.: Prostate; Hb: Haemoglobin.
Individual patient urine mixture (Ui)
of equal volumes of five urine samples from each patient with prostate cancer. P-series
urine mixture (P:Um) of equal volumes of 25 urine samples
from five patient P2, P5, P6, P8, and P9 on five different days
for each pre- and post-radical prostatectomy (post-RP). Abbreviation: pros.,
prostate. Ranges of patient 1st–5th sampling days are
shown, when day 0 is the ablative operation day of the patient.
For an olfactory cue of prostate cancer, equal-occult blood, pre- and post-RP Um pairs were prepared with urine samples from five patients [62–77 years old, five men (P2, P5, P6, P8, and P9), stage = II, Gleason score = 7.2 (mean)] on five different days (Tables 1 & 2). We previously found that the urinary dietary-related and genetically-determined body odors in 106-diluted urine mixture samples of healthy volunteers are below the threshold of odor discrimination for sniffer mice [11]. To be below the threshold for healthy donor-unique body odors, the 106-diluted, equal-occult blood pre- and post-RP Um pair was used as the positive (rewarded) and negative control pair. Individual patient urine mixtures (Uis) of five equal-volume urine samples were used to examine differences in urinary olfactory cues between pre- and post-RP urine samples in individual patients. In this study, these P-series pre-RP Um and Ui samples were described as pre-endocrine therapy samples, although these patients were never treated with neoadjuvant endocrine therapy.
Table 2: Discrimination thresholds of sniffer mice for pairs
of human urine mixtures in a Y-maze.
|
Urine mixture pair |
Dilution types |
Discrimination thresholds (D.T.) of urine mixtures |
Cancer |
Stage |
Gleason |
Age |
Gender |
Sampling period |
|
pre-RP P:Um |
equal-occult blood |
2.0 × 10⁻¹² (9.2 × 10⁻¹⁵) |
prostate |
5 Ⅱ |
7.2 |
62–77 |
♂ |
(−41)–(−1) |
|
post-RP P:Um |
none |
– |
1–33 |
|||||
|
pre-RP Pe:Um |
equal-occult blood |
1.0 × 10-9* (3.6 × 10-12)* |
prostate (ET) |
4Ⅱ+ 1Ⅲ |
6.0 |
58–80 |
♂ |
(−41)–(−1) |
|
post-RP Pe:Um |
none |
– |
1–29 |
|||||
|
pre-TUR N:Um |
equal-occult blood |
7.7 × 10⁻¹⁰** (5.7 × 10⁻¹⁰)** |
bladder |
5 I |
3H + 2L |
69–91 |
♂ |
(−53)–(−1) |
|
post-TUR N:Um |
none |
– |
8–127 |
|||||
|
healthy H1–3 Um |
equally diluted |
1.0 × 10⁻⁵** (2.6 × 10⁻⁶)** |
none |
– |
– |
52–75 |
♂ |
(−17)–(−1)¶ |
|
healthy H4–6 Um |
none |
– |
0–11# |
RP: Radical Prostatectomy;
ET: neoadjuvant Endocrine Therapy; TUR: Transurethral Resection of bladder
tumor. P:Um: P-series Urine mixture.
(Um) is an equal-volume mixture of 25
urine samples from five patients with prostate cancer: P2, P5, P6, P8, and P9 on
five different days. Pe:Um,
Pe-series Um is an
equal-volume mixture of 25 urine samples from five patients: Pe1, Pe3, Pe7, Pe11, and Pe14 on five different days. The
discrimination thresholds of sniffer mice were obtained as the lowest urine
concentrations with the average values of the %Correct for 4-8 mice (18 trials
per mouse) greater than 61.5% or 58.3% that were significantly different from
chance level (P = 0.05 for 72 or 144
trials). Estimated threshold concentration in parenthesis was calculated by the
odds ratio (%Correct to chance) of the logit, with P = 76.65% and linear regression models of %Correct. Urine sample
was diluted in distilled water (v/v). *Preliminary result for four mice (the
lowest concentration with the %Correct greater than 61.55%, P = 0.05 for 72 trials). **Thresholds
for bladder cancer N:Um
and healthy H1–3 vs. H4–6 Ums were previously
reported [11].
For an olfactory cue of post-endocrine therapy-prostate cancer, pre-RP Um after neoadjuvant endocrine therapy was prepared with urine samples from five patients [58-80-years-old, five men (Pe1, Pe3, Pe7, Pe11, and Pe14), stage = II (four patients) or III (one patient), Gleason score = 6.0 (mean)] on five different days (Tables 1 & 2). To examine odor discrimination ability of sniffer mice for prostate cancer vs. bladder cancer, we used the pre-transurethral resection (pre-TUR) Um from five patients with bladder cancer, which was prepared and stored at −20 °C in our previous study [11].
Urine samples of patients with bladder cancer (K- and N-series) were accidentally thawed during troubles in freezer up to one day, likely inducing oxidative degradation of 2,6-di(propan-2-yl)phenol (propofol, peak #165). This accident would reduce the increase in the peak #165 compared to that of the original sample, suggesting that the observed increase in pre-TUR Um sample could be available to determine a cut-off value for bladder cancer as being a less robust one, that is, a potential test to detect more patients non-invasively. The cut-off value for the original sample and the increases in well-prepared individual urine samples would be more robust than that obtained from the accidental sample.
II Sniffer Mice
All experimental procedures were approved by the Institutional Animal Care and Use Committees of the National Institute of Advanced Industrial Science and Technology, and are in accordance with the Japanese Law for the Humane Treatment and Management of Animals (No. 105) and Japanese Fundamental Guidelines for Proper Conduct of Animal Experiment and Related Activities in Academic Research Institutions under the jurisdiction of the Ministry of Education, Culture, Sports, Science and Technology. Due to a requirement for equivalent training and testing progresses in time among six or more sniffer mice by a single trainer, we needed to select actively behaving mice with the trainer. Even in this case, behavioural assays for six sniffer mice took 4-6 hours every day except for occasional and additional training of some mice. In this study, twenty-two male and three female mice (C57BL/6J, CLEA Japan, Inc., Tokyo, Japan) were narrowed to fourteen male sniffer mice that actively behaved with a trainer. Eight mice were used for most of behavioural assays and six mice were used for evaluation of urinary biomarkers for the olfactory cue of prostate cancer.
III Y-Maze Behavioural Assay
We conducted two alternative forced choice behavioural assays in a Y-maze to measure odor discrimination thresholds of sniffer mice in a 10- or 100-fold dilution series of each two sets (total two days for two sets) (Supplementary Figure 1). A negative pressure-guided odor plume-like flow in the Y-maze enabled us to measure discrimination thresholds lower than ppq levels for single compound enantiomers and those lower than ppb levels for the bladder cancer- or occult blood-associated odors [11, 17].
The initial training started with 3-week-old mice in the order of habituation to a trainer and a trunk cap, Y-maze, and drinking from a small glass funnel for water reward in the trainer’s hand or Y-maze (Supplementary Figure 1). The reward was used to maintain the level of mouse behavioural motivation, preventing from more mice and data due to larger trial-by-trial variability. Each mouse was then trained to choose a target odor of 10−3-10−9-w/w (R)-(–)-carvone vs. solvent or (S)-(+)-carvone until the average %Correct for the target odor increased to approximately 80%. Just before the start of the behavioural assays with urine samples from patients with prostate cancer, the sniffer mice were trained to choose the bladder cancer urine sample.
The upper outside of the Y-maze junction was covered with a piece of cellulose sheet (BEMCOT, M-3, Asahi KASEI, Osaka, Japan, 250-mm × 250-mm square) (Supplementary Figure 1). This treatment likely made the mice concentrate on odor choice by preventing them from seeing their trainer’s reactions to their own arm choices. Double-blind procedure with the condition that the trainer does not know the target odor side was not suitable for mouse forced behavioural assays, since trainer’s wrong operation for rewards (occasional reverse rewards) confused sniffer mice, leading to reduction in correct choice rates. The trainer should know the correct odor side to surely allow the sniffer mice to drink the reward water on the target odor side or to prevent them from drinking the water on the non-target odor side. The terminal caps with cotton balls absorbing 0.3-mL odor solution and the small glass funnel were independently and randomly exchanged between the two arms. Each sniffer mouse then explored each urine odor at the same dilution rate with respective extra-dilutions in a set of 18 successive trials each day basically for two days (Supplementary Figure 1). The %Correct on the second day in the two-day assays was analysed for odor discrimination thresholds. The animals were deprived of water for one day prior to the behavioural assays and were then provided 1-3 mL water daily or given free access to water for 30-60 s after the assays. Further details have been described in (Supplementary Figure 1) or previously [11, 17].
The discrimination threshold was defined as the lowest concentration of diluted urine samples at which the average %Correct for the target odor was significantly higher than chance. Basically, all concentrations were decreased in 2-day steps continuously during assays. However, rarely some sniffer mice showed outlier-like decreases in %Correct compared to those of the other sniffer mice. This is the case for getting back to higher concentrations for consolidating the learned olfactory cue as the rule for the target odor choice. To identify such an outlier-like behaviours, a randomized concentration order was not available for a reliable determination of the discrimination thresholds in this study. To confirm the consistency of the odor choice, sniffer mice were tested after completing the assays at the lowest concentration to determine if they were able to: i) select the target odor (pre-RP Um/Ui or an odorant) vs. non-target odor (post-RP Um/Ui or the solvent), at one of the discriminative concentrations and ii) select one of two identical odors (Id.) by chance.
IV SPME-GC-MS Measurement and Analysis
The measurement parameters were determined based on those of the previous reports [5, 8, 16]. In addition, we avoided biased manipulations in urinary pH and absorbent specificity for headspace volatile concentrations. In other words, we preferred only a thermally-accelerated evaporation of volatiles from a simply-mixed urine sample and unbiased concentration likely in the olfactory mucus. To concentrate urinary volatiles, a divinylbenzene/carboxen/polydimethylsiloxane (DVB/CAR/PDMS)-coated fiber assembly (Supelco, #57348-U, purchased from Sigma-Aldrich, Japan) was used, because DVB and carboxen/PDMS were a combination of two different types of absorbents, which were suitable for amines or polar compounds and non-polar volatile or semi-volatile compounds, respectively. Volatile compounds in 250-μL urine sample were extracted with the SPME DVB/CAR/PDMS fiber in a 2-mL vial for 20 min at 40°C. The SPME fiber with absorbed urinary volatiles was inserted into the split less injection port of a gas chromatography system (GCMS-TQ8030, Shimadzu Corp., Japan) for 2 min at 240°C. The fused silica capillary column CP Sil 8CB (30 m × 0.25 mm ID × 0.25 μm film thickness, Agilent Technologies, Tokyo, Japan) was used for separation. The temperature programme was for 5 min at 40°C, for 45 min at 5°C/min, and for 50 min at 240°C. The column flow was constant at 1 mL/min of helium. The temperature of the transfer line was set to 300°C, and the ion source temperature was maintained at 180°C. Ionizing energy was 70 eV and scanning frequency was 0.2 s/spectrum of 40-500 m/z.
After sample analysis with SPME-GC–MS, MSDIAL was used to construct a list of all relevant peaks [22]. All peaks detected were expressed in relative standard deviation (RSD) values, in which case for each peak the standard deviation of the response in all Quality Control (QC) samples is divided by the average of the response in all QC samples and filtered by RSD < 30% and peak intensity of fold change ≥ 5 for blank sample versus urine samples, leading to the list of 160 candidate compounds. The chromatographic peak height of each compound was analysed by Multivariate analyses using Statistic analysis tool in Microsoft Excel (RIKEN Center for Sustainable Resource Science). To find a set of robust biomarkers, principal component analysis (PCA) was applied to interpret the maximum amount of information briefly by decreasing the dimensionality of the data set to a two-dimensional space without much loss of information. The first and second principal components from urine components data were extracted to explore the possibility of discriminating differences between various samples. From PCA loading plot, the biomarker candidates were extracted as the components specified to cancer patients.
Compound identification of biomarker candidates were based on matching of retention time and fragment pattern of the authentic standards against the mass spectral library with high similarity (a score > 0.9) [MassBank (LINK) or NIST mass spectral library (NIST 11)], and commercially available chemicals (phenol (CAS #108-95-2), Tokyo Chemical Industry Co. Ltd. (TCI), P1610; dimethyl succinate (CAS #106-65-0), TCI, S0104; acetophenone (CAS #98-86-2), TCI, A0061; 2-phenyl-2-propanol (CAS #617-94-7), TCI, P0213; 3,5,5-trimethyl-2-cyclohexenone (CAS #78-59-1), TCI, I0151; dimethyl glutarate (CAS #1119-40-0), TCI, G0185; 2,6-xylidine (CAS #87-62-7), TCI, D0669; piperitone (CAS #89-81-6), TCI, P1783; 2,6-di(propan-2-yl)phenol (CAS #2078-54-8); 2-hydroxy-2-methylpropiophenone (CAS #7473-98-5), TCI, H0991).
Using a linear calibration curve of biomarker concentrations to GC-MS peak areas and simple linear models of the concentrations to GC-MS peak heights, we estimated concentrations of ten biomarkers in the original and diluted urine mixture samples. In the measurement for the calibration, a capillary column of InertCap Pure WAX (30 m × 0.25 mm ID × 0.5 μm film thickness, GL Sciences Inc., Tokyo, Japan), which eluted more symmetric shapes of peaks compared to those of DB-5MS (30 m × 0.25 mm ID × 0.25 μm film thickness, Agilent Technologies, Tokyo, Japan) that was equivalent to CP Sil 8CB in a better selectivity for aromatic compounds by a weak polarity, was used with GCMS-QP2010 Ultra (Shimadzu Corp., Kyoto, Japan) and the SPME DVB/CAR/PDMS fiber. Standard solutions for ten biomarkers were prepared at five concentrations out of 1, 2, 5, 20, 50, 200, 500, 1000, and 2000 ng/mL as mixtures of a biomarker in 25-μL dimethyl sulfoxide and 250-μL ultrapure water. All ten of linear calibration curves for peak areas to biomarker concentrations had correlation coefficients of >0.99. Concentrations of biomarkers in the 250-μL original urine mixture sample of patients with prostate cancer (pre-RP Um) were estimated with respective peak areas and the linear calibration curves (Table 3). Concentrations of biomarkers except for 2,6-xylidine in the other original urine mixture samples were conveniently estimated by a simple linear model of peak height to biomarker concentration with a factor of dilution (Tables 1 & 3).
Table 3: Differences in SPME-GC-MS peaks and concentrations of biomarkers
between pairs of urine mixture samples for healthy volunteers, patients with
bladder cancer, and patients with prostate cancer.
|
Peak # |
Compound |
parameters |
Healthy volunteers |
Bladder cancer |
Bladder cancer |
Prostate cancer
(endocrine therapy) |
Prostate cancer |
prostate cancer-mimic
sample |
||||||
|
H1–3 |
H4–6 |
post-TUR K:Um |
pre-TUR K:Um |
post-TUR N:Um |
pre-TUR N:Um |
post-RP Pe:Um |
pre-RP Pe:Um |
post-RP P:Um |
pre-RP P:Um |
|||||
|
Peak height (a.u. in the upper row) and concentration (ppb in the
lower row) in the original urine mixture sample |
||||||||||||||
|
81 |
Phenol |
peak height |
171 |
104 |
1,715 |
338 |
70 |
279 |
267 |
3,349 |
157 |
5,261 |
||
|
concentration (ppb) |
49 |
30 |
489 |
96 |
20 |
80 |
76 |
955 |
45 |
1,500 |
334 |
|||
|
m/z = 94.0; retention time (min) = 12.157 (12.477 for DB-5MS column; 32.663
for InertCap Pure WAX column) |
||||||||||||||
|
relat.to_healthy Um |
1.24 |
0.76 |
12.4 |
2.45 |
0.51 |
2.03 |
1.94 |
24.3 |
1.14 |
38.2 |
8.5 |
|||
|
relat.to_healthy #81 |
1.24 |
0.76 |
12.4 |
2.45 |
0.51 |
2.03 |
1.94 |
24.3 |
1.14 |
38.2 |
0.22 |
|||
|
relat.to_#70 |
0.010 |
0.007 |
0.094 |
0.016 |
0.004 |
0.016 |
0.016 |
0.180 |
0.013 |
0.283 |
(/pre-RP) |
|||
|
101 |
Dimetyl succinate |
peak height |
74 |
68 |
705 |
240 |
153 |
125 |
222 |
3,236 |
212 |
8,464 |
||
|
concentration (ppb) |
0.59 |
0.54 |
5.58 |
1.90 |
1.21 |
0.99 |
1.76 |
25.6 |
1.68 |
67.0 |
19.7 |
|||
|
m/z = 115.0; retention time (min) = 13.995 (14.320 in DB-5MS column; 23.740 for
InertCap Pure WAX column) |
||||||||||||||
|
relat.to_healthy Um |
1.04 |
0.96 |
9.90 |
3.38 |
2.15 |
1.76 |
3.13 |
45.5 |
2.98 |
119 |
34.9 |
|||
|
relat.to_healthy #81 |
0.54 |
0.49 |
5.11 |
1.74 |
1.11 |
0.91 |
1.61 |
23.5 |
1.54 |
61.4 |
0.29 |
|||
|
relat.to_#70 |
0.005 |
0.004 |
0.04 |
0.01 |
0.01 |
0.007 |
0.01 |
0.17 |
0.02 |
0.46 |
(/pre-RP) |
|||
|
104 |
Acetophenone |
peak height |
1,471 |
1,154 |
12,159 |
1,304 |
1,156 |
1,079 |
5,428 |
5.1×10⁴ |
3,979 |
8.2×10⁴ |
||
|
concentration (ppb) |
0.86 |
0.68 |
7.14 |
0.77 |
0.68 |
0.63 |
3.19 |
29.9 |
2.34 |
48.0 |
9.2 |
|||
|
m/z = 105.0; retention time (min) = 15.073 (15.383 in DB-5MS column; 25.040 for
InertCap Pure WAX column) |
||||||||||||||
|
relat.to_healthy Um |
1.12 |
0.88 |
9.26 |
0.99 |
0.88 |
0.82 |
4.13 |
38.7 |
3.03 |
62.3 |
12.0 |
|||
|
relat.to_healthy #81 |
10.7 |
8.37 |
88.2 |
9.45 |
8.39 |
7.82 |
39.4 |
369 |
28.9 |
593 |
0.19 |
|||
|
relat.to_#70 |
0.09 |
0.08 |
0.67 |
0.06 |
0.07 |
0.06 |
0.33 |
2.74 |
0.32 |
4.40 |
(/pre-RP) |
|||
|
109 |
2-Phenyl-2-propanol |
peak height |
2,297 |
2,839 |
2.4×10⁴ |
3,903 |
1,472 |
1,289 |
9413 |
9.5×10⁴ |
8379 |
1.8×10⁵ |
||
|
concentration (ppb) |
2.00 |
2.47 |
20.5 |
3.40 |
1.28 |
1.12 |
8.19 |
82.7 |
7.29 |
160 |
16.3 |
|||
|
m/z = 121.0; retention time (min) = 15.738 (16.081 in DB-5MS column; 27.607 for
InertCap Pure WAX column) |
||||||||||||||
|
relat.to_healthy Um |
0.89 |
1.11 |
9.18 |
1.52 |
0.57 |
0.50 |
3.67 |
37.0 |
3.26 |
71.6 |
7.3 |
|||
|
relat.to_healthy #81 |
16.7 |
20.6 |
171 |
28.3 |
10.7 |
9.35 |
68.3 |
689 |
60.8 |
1,334 |
0.10 |
|||
|
relat.to_#70 |
0.14 |
0.19 |
1.30 |
0.19 |
0.09 |
0.07 |
0.57 |
5.12 |
0.68 |
9.90 |
(/pre-RP) |
|||
|
119 |
3,5,5-Trimethyl-2-cyclohexenone |
peak height |
580 |
366 |
1.5×10⁶ |
628 |
694 |
273 |
6.4×10⁴ |
5.7×10⁵ |
7.5×10⁴ |
1.2×10⁶ |
||
|
concentration (ppb) |
0.14 |
0.09 |
352 |
0.15 |
0.16 |
0.06 |
15.3 |
135 |
17.8 |
290 |
128 |
|||
|
m/z = 138.0; retention time (min) = 16.883 (17.288 in DB-5MS column; 23.787 for
InertCap Pure WAX column) |
||||||||||||||
|
relat.to_healthy Um |
1.23 |
0.77 |
3,148 |
1.33 |
1.47 |
0.58 |
136 |
1,206 |
159 |
2,592 |
1,142 |
|||
|
relat.to_healthy #81 |
4.21 |
2.65 |
10,791 |
4.56 |
5.03 |
1.98 |
467 |
4,133 |
544 |
8,886 |
0.44 |
|||
|
relat.to_#70 |
0.035 |
0.024 |
81.9 |
0.030 |
0.043 |
0.016 |
3.90 |
30.7 |
6.12 |
66.0 |
(/pre-RP) |
|||
|
123 |
Dimethyl glutarate |
peak height |
314 |
267 |
261 |
253 |
211 |
178 |
491 |
8229 |
648 |
2.2×10⁴ |
||
|
concentration (ppb) |
3.8 |
3.2 |
3.2 |
3.1 |
2.6 |
2.2 |
6.0 |
100 |
7.9 |
270 |
208 |
|||
|
m/z = 129.0; retention time (min)
= 17.369 (17.708 in DB-5MS column;
26.337 for InertCap Pure WAX column) |
||||||||||||||
|
relat.to_healthy Um |
1.08 |
0.92 |
0.90 |
0.87 |
0.73 |
0.61 |
1.69 |
28.3 |
2.23 |
76.4 |
58.9 |
|||
|
relat.to_healthy #81 |
2.28 |
1.93 |
1.89 |
1.84 |
1.53 |
1.29 |
3.56 |
59.7 |
4.70 |
161 |
0.77 |
|||
|
relat.to_#70 |
0.019 |
0.018 |
0.014 |
0.012 |
0.013 |
0.010 |
0.030 |
0.443 |
0.053 |
1.20 |
(/pre-RP) |
|||
|
129 |
2,6-Xylidine |
peak height |
302 |
302 |
1,250 |
1,312 |
419 |
639 |
1,835 |
1.8×10⁴ |
1,140 |
4.9×10⁴ |
||
|
concentration (ppb) |
not determined due to a significant
desorption-resistant amount |
+10.5 |
||||||||||||
|
m/z = 121.0; retention time (min)
= 18.263 (18.586 in DB-5MS column;
29.497 for InertCap Pure WAX column) |
||||||||||||||
|
relat.to_healthy Um |
1.00 |
1.00 |
4.14 |
4.34 |
1.39 |
2.11 |
6.07 |
58.9 |
3.77 |
161 |
|
|||
|
relat.to_healthy #81 |
2.19 |
2.19 |
9.06 |
9.52 |
3.04 |
4.63 |
13.31 |
129 |
8.27 |
352 |
‒ |
|||
|
relat.to_#70 |
0.018 |
0.020 |
0.069 |
0.063 |
0.026 |
0.037 |
0.11 |
0.96 |
0.093 |
2.61 |
(/pre-RP) |
|||
|
152 |
Piperitone |
peak height |
1,422 |
5,831 |
296 |
2,409 |
297 |
241 |
3,158 |
2.1×10⁴ |
468 |
7.9×10⁴ |
||
|
concentration (ppb) |
0.83 |
3.41 |
0.17 |
1.41 |
0.17 |
0.14 |
1.85 |
12.3 |
0.27 |
46.0 |
9.3 |
|||
|
m/z = 110.0; retention time (min)
= 20.947 (21.336 in DB-5MS column;
27.057 for InertCap Pure WAX column) |
||||||||||||||
|
relat.to_healthy Um |
0.39 |
1.61 |
0.08 |
0.66 |
0.08 |
0.07 |
0.87 |
5.78 |
0.13 |
21.7 |
4.4 |
|||
|
relat.to_healthy #81 |
10.3 |
42.3 |
2.14 |
17.5 |
2.15 |
1.75 |
22.9 |
152 |
3.39 |
570 |
0.20 |
|||
|
relat.to_#70 |
0.087 |
0.384 |
0.016 |
0.115 |
0.019 |
0.014 |
0.191 |
1.13 |
0.038 |
4.23 |
(/pre-RP) |
|||
|
155 |
2-Hydroxy-2-methylpropiophenone |
peak height |
153 |
98 |
134 |
130 |
124 |
122 |
631 |
5,959 |
1,157 |
1.5×10⁴ |
||
|
concentration (ppb) |
2.05 |
1.31 |
1.80 |
1.73 |
1.65 |
1.63 |
8.43 |
79.6 |
15.5 |
200 |
15.5 |
|||
|
m/z = 105.0; retention time (min)
= 21.7 (22.027 in DB-5MS column;
34.293 for InertCap Pure WAX column) |
||||||||||||||
|
relat.to_healthy Um |
1.22 |
0.78 |
1.07 |
1.03 |
0.98 |
0.97 |
5.02 |
47.4 |
9.20 |
119 |
9.20 |
|||
|
relat.to_healthy #81 |
1.11 |
0.71 |
0.97 |
0.94 |
0.90 |
0.88 |
4.58 |
43.2 |
8.39 |
109 |
0.08 |
|||
|
relat.to_#70 |
0.009 |
0.006 |
0.007 |
0.006 |
0.008 |
0.007 |
0.038 |
0.32 |
0.094 |
0.81 |
(/pre-RP) |
|||
|
165 |
2,6-Di(propan-2-yl)phenol |
peak height |
122 |
111 |
68 |
140 |
369 |
4,693 |
130 |
1.6×10⁴ |
160 |
2.6×10⁴ |
||
|
concentration (ppb) |
0.02 |
0.01 |
0.01 |
0.02 |
0.05 |
0.60 |
0.02 |
2.00 |
0.02 |
3.30 |
0.02 |
|||
|
m/z = 163.0; retention time (min)
= 23.76 (24.263 in DB-5MS column;
33.039 for InertCap Pure WAX column) |
||||||||||||||
|
relat.to_healthy Um |
1.05 |
0.95 |
0.58 |
1.20 |
3.16 |
40.2 |
1.12 |
134 |
1.37 |
222 |
1.37 |
|||
|
relat.to_healthy #81 |
0.89 |
0.81 |
0.49 |
1.02 |
2.68 |
34.0 |
0.94 |
113 |
1.16 |
188 |
0.01 |
|||
|
relat.to_#70 |
0.007 |
0.007 |
0.004 |
0.007 |
0.023 |
0.273 |
0.008 |
0.843 |
0.013 |
1.39 |
(/pre-RP) |
|||
Table 3. Differences in SPME-GC-MS peaks and concentrations of biomarkers
between pairs of urine mixture samples for healthy volunteers, patients with
bladder cancer, and patients with prostate cancer (continued).
|
Peak # |
Compound |
parameters |
Healthy volunteers |
Bladder cancer |
Bladder cancer |
Prostate cancer
(endocrine therapy) |
Prostate cancer |
|||||
|
H1–3 |
H4–6 |
post-TUR K:Um |
pre-TUR K:Um |
post-TUR N:Um |
pre-TUR N:Um |
post-RP Pe:Um |
pre-RP Pe:Um |
post-RP P:Um |
pre-RP P:Um |
|||
|
70 |
unidentified |
peak height |
1.6×10⁴ |
1.5×10⁴ |
1.8×10⁴ |
2.1×10⁴ |
1.6×10⁴ |
1.7×10⁴ |
1.7×10⁴ |
1.9×10⁴ |
1.2×10⁴ |
1.9×10⁴ |
|
relat.to_healthy Um |
1.00 |
0.92 |
1.11 |
1.27 |
0.98 |
1.05 |
1.01 |
1.13 |
0.75 |
1.13 |
||
|
relat.to_#70 |
1.00 |
1.00 |
1.00 |
1.00 |
1.00 |
1.00 |
1.00 |
1.00 |
1.00 |
1.00 |
||
|
relat.to_#36 |
0.17 |
0.18 |
0.18 |
0.13 |
0.18 |
0.18 |
0.16 |
0.18 |
0.17 |
0.15 |
||
|
36 |
unidentified |
peak height |
9.7×10⁴ |
8.5×10⁴ |
9.9×10⁴ |
1.6×10⁵ |
9.0×10⁴ |
9.7×10⁴ |
1.1×10⁵ |
1.0×10⁵ |
7.2×10⁴ |
1.2×10⁵ |
|
relat.to_healthy Um |
1.00 |
0.88 |
1.02 |
1.65 |
0.93 |
1.00 |
1.10 |
1.07 |
0.74 |
1.25 |
||
|
relat.to_#70 |
5.90 |
5.59 |
5.44 |
7.65 |
5.65 |
5.64 |
6.42 |
5.57 |
5.87 |
6.50 |
||
|
relat.to_#36 |
1.00 |
1.00 |
1.00 |
1.00 |
1.00 |
1.00 |
1.00 |
1.00 |
1.00 |
1.00 |
||
|
87 |
unidentified |
peak height |
4,158 |
3,619 |
3,115 |
2,540 |
2,241 |
2,364 |
2,819 |
3,662 |
1,936 |
1,789 |
|
relat.to_healthy Um |
1.00 |
0.87 |
0.75 |
0.61 |
0.54 |
0.57 |
0.68 |
0.88 |
0.47 |
0.43 |
||
|
relat.to_#70 |
0.25 |
0.24 |
0.17 |
0.12 |
0.14 |
0.14 |
0.17 |
0.20 |
0.16 |
0.10 |
||
|
relat.to_#36 |
0.04 |
0.04 |
0.03 |
0.02 |
0.02 |
0.02 |
0.03 |
0.04 |
0.03 |
0.01 |
||
|
92 |
unidentified |
peak height |
1,771 |
1,387 |
2,157 |
1,495 |
1,722 |
1,147 |
2,195 |
1,720 |
1,612 |
2,099 |
|
relat.to_healthy Um |
1.00 |
0.78 |
1.22 |
0.84 |
0.97 |
0.65 |
1.24 |
0.97 |
0.91 |
1.19 |
||
|
relat.to_#70 |
0.11 |
0.09 |
0.12 |
0.07 |
0.11 |
0.07 |
0.13 |
0.09 |
0.13 |
0.11 |
||
|
relat.to_#36 |
0.018 |
0.016 |
0.022 |
0.009 |
0.019 |
0.012 |
0.021 |
0.017 |
0.022 |
0.017 |
||
post-antibiotic pro.: post-TUR K:Um with antibiotic prophylaxis;
TUR: Transurethral Resection; RP: Radical Prostatectomy.
All patient samples were mixtures of 25 urine
samples (5 patients × 5 samples). DB-5MS column is equivalent to CP Sil 8CB column.
Ratio of the peak height for the respective sample relative (relat.) to that of
an average of those for H1–3 and H4–6 mixture samples Um.
>10-fold (red) and 2–10-fold (blue) increases from the
peak height of the healthy volunteer in were highlighted.
Concentration of 2,6-xylidine could not be accurately estimated by a significant (more than 20%) desorption-resistant amount in SPME fiber after the extraction. Just after the measurement of 250-μL standard solution of 200-ng/mL 2,6-xylidine, subsequent 1st -3rd measurements of 250-μL ultrapure water alone resulted in 59%, 25%, and 14% of corresponding peak areas, respectively, in the chromatography, suggesting a ca. 50% carry-over contamination before a complete desorption treatment. Considering this significant desorption-resistant amount for 2,6-xylidine, we performed complete desorption treatments for the SPME fiber and confirmed no carry-over contamination in the measurement of the ultrapure water just before each measurement for every urine sample or biomarker standard solution.
V Identification of Biomarkers for Prostate and Bladder Cancers
To reproduce the pre-RP Um, there are two alternative ways, which result in non-adjusted occult-blood concentrations or non-adjusted relative concentrations of urinary major volatile components and biomarkers. If the sniffer mice would use an olfactory cue of cancer-characteristic odor for the urinary odor discrimination, relative concentrations of urinary major components and biomarkers should be reproduced. In this alternative, we prepared adjusting additives of eight biomarker compounds for prostate cancer in five dilution steps. To reduce relatively greater evaporation losses in minor components compared to that of the major component during mixing processes, we increased the concentrations of seven relatively minor components by ca. 13% and reduced the concentration of the major component, phenol, by 47%. A 5 × 10¹⁰-fold additives of eight biomarker compounds at their respective concentrations in 50% EtOH was prepared and was sequentially diluted 500-fold and 1000-fold with distilled water, and 100-fold with 0.5 × 10⁻³ v/v post-RP Um, and then 25-fold and 1000-fold with distilled water. The final concentrations of eight biomarkers in the prostate cancer-characteristic odor-mimic post-RP Um and those of the measured pre-RP Um are listed in (Table 3). Matching of olfactory cue of prostate cancer-mimic Um to that of the real pre-RP Um vs. post-RP Um was examined by the Y-maze behavioural assay. The sniffer mice were trained with the enantiomeric odor pair, the urinary bladder cancer odor, and the urinary prostate cancer odor.
VI Statistical Analysis
The %Correct for one of two identical targets is 50% (chance) in the two-alternative choice task. Statistical analyses of average %Correct among all mice for individual odor pairs at respective concentrations near the thresholds were performed using the chi-square test for total numbers of trials for six sniffer mice (e.g., >59.43%, P <0.05 for 108 trials). Estimated threshold concentrations were calculated as the concentrations for the odds ratio (%Correct to chance), 59.43% ÷ 50% = 1.1886 of the logit, with P = 76.65% by linear regression models of %Correct vs. logarithmic concentration for the ranges as shown in (Figure 1).
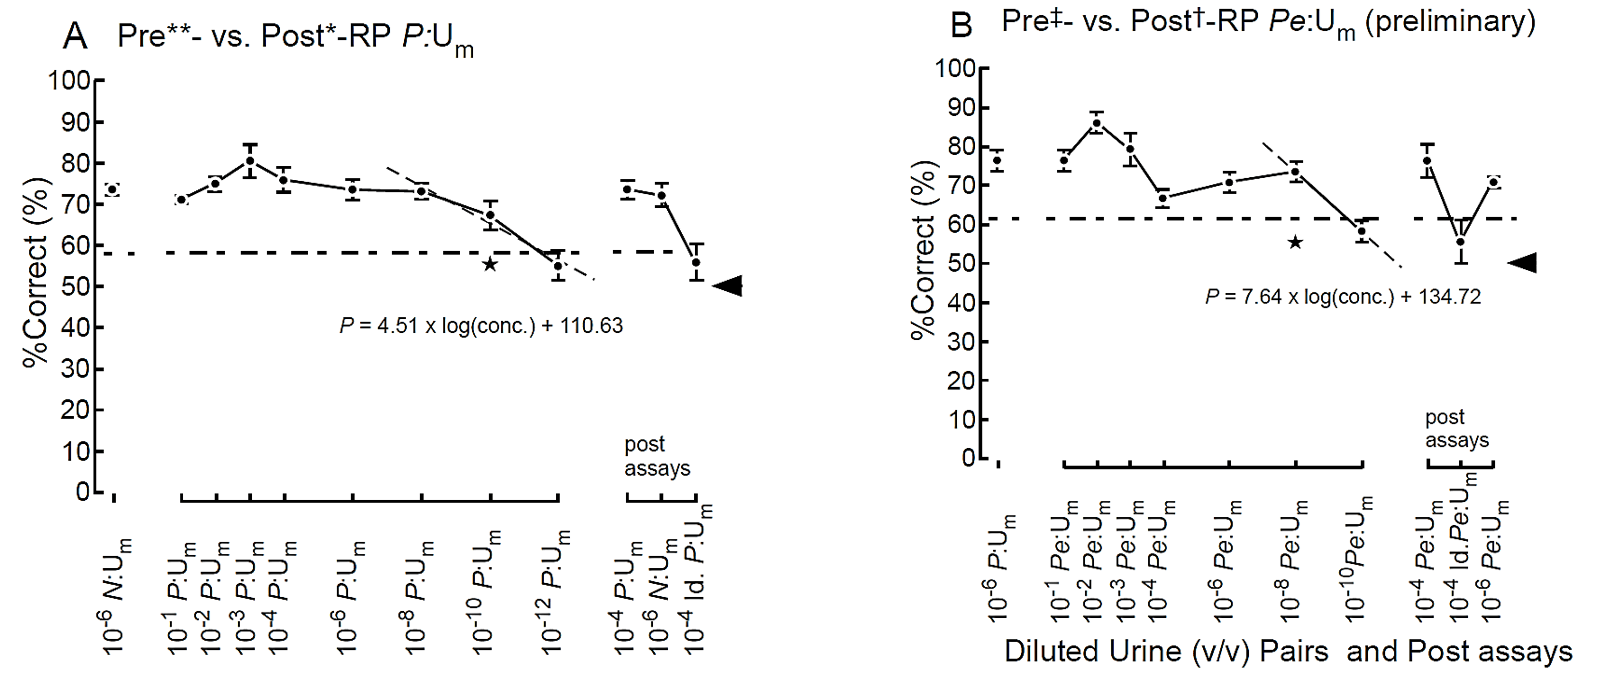
Figure 1: Odor discrimination thresholds of sniffer mice for prostate cancer. A) Odor discrimination of sniffer mice between equal-occult blood pre**- vs. post*-radical prostatectomy (post*-RP) urine mixture (Um) of five patients with prostate cancer. Post-assays, 10−4 pre**- vs. post*-RP P:Um, 10−6 pre§- vs. post¶-transurethral resection (post-TUR) of bladder cancer N:Um and identical P:Um pair: 10−6 pre**- vs. pre**-RP P:Um. The percent correct (%Correct) for a training odor pair—10−6 N:Um pair just before the prostate cancer urine discrimination assay is shown on the left side. B) Odor discrimination of sniffer mice between equal-occult blood pre‡- vs. post†-RP Pe:Um of five patients with prostate cancer after neoadjuvant endocrine therapy. Post-assays, 10−6 pre‡- vs. post†-RP Pe:Um and identical Pe:Um pair: 10−6 pre‡- vs. pre‡-RP Pe:Um. Two alternative forced choice assays with target vs. non-target odors were performed in a Y-maze. %Correct (mean ± SE; 18 trials × 4-8 mice) is shown. Tasks performed at threshold are marked by the star. A linear regression model of %Correct vs. logarithmic concentration (gray broken line) is shown in the range. Chain lines indicate the %Correct significantly above chance performance (P = 0.05 for 72 to 144 trials, 18 trials/mouse). Black arrowheads indicate chance levels (50%). Extra-dilution rates for equal-occult blood Ums were 1/50** v/v, 1/2* v/v, 1/10‡ v/v, 1/3† v/v, 1/13§ v/v, and 1/6 v/v.
Perspective
Based on the range of mean ± 1.29 × SD for cumulative probability of 80.3% in a normal distribution of %Correct for the respective positive control odor pairs (CNT), the criterion of −1.29 × SD was used as the greatest fall of %Correct of a test odor from those of the temporally prior and posterior positive control trials (the learned odor). A fall (negative value) in %Correct smaller than −1.29 × SD or a rise (positive value) was judged to be identical to the learned CNT odor (marked with ○), whereas a fall greater than −1.29 × SD was judged to be different from the learned odor (marked with ≠ in Supplementary Table 4 and @ in Figure 2A), leading to confusion of sniffer mice upon switching between distinct olfactory cues (Supplementary Tables 3 & 4). %Rank of each trial was percentage of CNT trials with %Correct lower than that of the test odor, shown as relative position of the %Correct in increasing order of CNT %Correct. For an assay session where SD was nearly larger than 2-fold of other SDs, the −1.29 × SD in a relatively stable CNT session related to test odors was used. Considering unstable behavioural scores and large SE during the initial phase (<10 assays) of urinary odor discrimination training, the −1.65 × SD for the cumulative probability of 90.1% was used as the borderline for the mismatch between the olfactory cues of the present and previous urine samples (−7.9% for the bladder cancer and −5.9% for the prostate cancer in Supplementary Table 4).
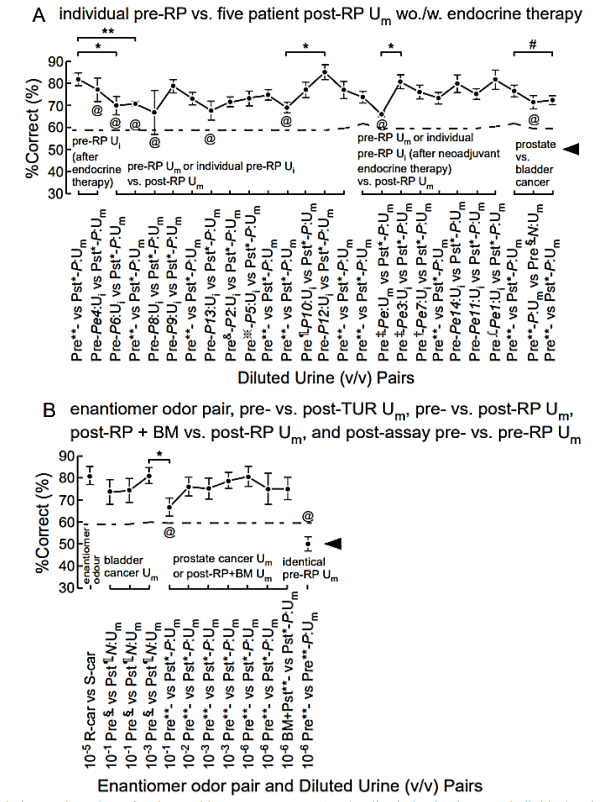
Figure 2: Mice can discriminate urine odors of patients with prostate cancer. A) Odor discrimination between individual patient pre-radical prostatectomy (pre-RP) urine mixture (Ui) vs. five patient post-RP urine mixture (Um), pre-RP Um (after neoadjuvant endocrine therapy) vs. post-RP Um, and pre-RP prostate cancer Um vs. pre-transurethral resection (pre-TUR) of bladder cancer N:Um. 106-fold diluted equal-occult blood urine samples were used. B) Odor discrimination between an enantiomer odor pair, pre- vs. post-TUR N:Um, pre- vs. post-RP Um, post-RP + biomarker (BM) vs. post-RP Um for cancer-characteristic olfactory cue, and identical pre-RP Um pair for the post assay. Two alternative forced choice assays with target vs. non-target odors were performed in a Y-maze. The P value of paired difference in %Correct is indicated by #(P ≥ 0.05), *(0.01 ≤ P < 0.05), and **(P < 0.01). %Correct (mean ± SE, 18 trials × 4-7 mice) is shown. @ indicates a mismatch between the test and learned odors. Extra-dilution rates for equal-occult blood Ums were 1/50** v/v, 1/2* v/v, 1/10‡ v/v, 1/3† v/v, 1/13§ v/v, 1/6¶ v/v, 1/100& v/v, 1/140※ v/v, and 1/90∫ v/v. Chain lines indicate %Correct significantly above chance performance (P = 0.05 for 90 to 126 trials, 18 trials/mouse). Black arrowheads indicate chance levels (50%).
Perspective
P values (Student’s t-test) in statistical comparisons of two successive or selected %Correct of sniffer mice was calculated using Microsoft Excel 2013. %P>0.05 of each trial was percentage of P > 0.05 pairwise difference between the trial and one of all CNT trials (Supplementary Tables 3 & 4). %P<0.05 of each trial was percentage of P < 0.05 pairwise difference between the trial and not-CNT or confusing CNT trial. Some trials with confusion-induced %Correct falls did not reach statistical significance (#P > 0.05) for their %Correct differences with positive control trials due to increases in inter-animal variations (Figure 2A). Considering this potential confounder, we did not use the student t-test to judge %Correct of trials as match or mismatch to those of the positive controls. Inter-sample variability of biomarker concentrations was compared in boxplot. The 10th, 25th, 75th, and 90th percentiles for urine mixture samples were calculated by PERCENTILE.EXC of Microsoft Excel 2013. Instead of 10th and 90th percentiles, minimum and maximum values were used for individual patient samples. Paired differences between pre- and post-RP urine samples were evaluated by paired Student t-test in Excel 2013.
Results
I Odor Discrimination Threshold of Mice for Prostate Cancer-Induced Urine Odor Change
During the initial training of sniffer mice with carvone enantiomers in the Y-maze, the average percent correct odor choice (%Correct) for the target odor gradually increased higher than chance [11]. After a subsequent urine odor discrimination training with bladder cancer N:Um pair, odor threshold of sniffer mice for prostate cancer-induced urinary odor was examined in a 10- or 100-fold dilution series of a pre- vs. post-radical prostatectomy (post-RP) Ums in equal-occult blood conditions. Similarly, to that of bladder cancer, the %Correct of sniffer mice declined at lower urine concentrations, resulting in the lowest detectable Um concentration of 2.0 × 10⁻¹² v/v (10−10 × 1/50; estimated odor discrimination threshold = 9.2 × 10⁻¹⁵ v/v) for a pre- vs. post-RP Um pair (Tables 1 & 2; Figure 1A, Supplementary Table 1). We confirmed the consistency of the choice in the post assays after completing the assays at the lowest concentration at which the sniffer mice could not discriminate the target odors and were instead rewarded by chance (Figure 1A). The extremely low threshold of 9.2 × 10⁻¹⁵ v/v for urinary odor of prostate cancer was ca. 104-fold lower than that of bladder cancer in an equal-occult blood condition (Table 2).
II Prostate Cancer Odors in Urine Samples were Weakened after Neoadjuvant Endocrine Therapy
To determine whether prostate cancer-induced urinary olfactory cues are reduced by neoadjuvant endocrine therapy, we measured the odor discrimination threshold of sniffer mice for post-endocrine therapy-prostate cancer Um pairs in a 10-fold dilution series in the Y-maze. We obtained the lowest detectable Um concentration of 1.0 × 10⁻⁹ v/v (10−8 × 1/10; estimated odor discrimination threshold = 3.6 × 10⁻¹² v/v, a preliminary result for four sniffer mice) (Table 2; Figure 1B, Supplementary Tables 1 & 2). The approximately 390-fold higher discrimination threshold for pre-RP Um of prostate cancer patients after neoadjuvant endocrine therapy indicates that the urinary body odor disorder in patients with prostate cancer is reduced in strength after endocrine therapy but is still more salient than the bladder cancer-induced odor. Together, our previous and present data indicate that urinary olfactory cues in Ums increase in the following order: dietary variation < bladder cancer < occult blood < prostate cancer after neoadjuvant endocrine therapy < antibiotic drug metabolites < prostate cancer (Figure 3) [11]. If the sniffer mice could recognize urine-characteristic odor with relatively constant compounds and their disorders with elemental odor ratios of disease-characteristic compounds to common constant compounds, they could also discriminate individual patient pre-RP Ui samples from the post-RP Um samples by the learned olfactory cue for prostate cancer. Next, we tested this.
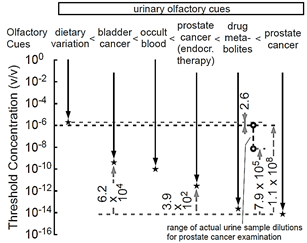
Figure 3: Odor discrimination thresholds of sniffer mice for urinary olfactory cues. Odor discrimination ranges (downward arrows) and thresholds (stars) of sniffer mice for urinary olfactory cues are shown [11]. Observed threshold differences indicate that urinary olfactory cues increase in the following order: dietary variation < bladder cancer < occult blood < prostate cancer (after neoadjuvant endocrine therapy) < antibiotic drug metabolites < prostate cancer. The concentration of 10−6 v/v (indicated by the black open circle) is used for prostate cancer examination of individual patient pre-resection urine samples as being subthreshold of dietary urine variation and suprathreshold of prostate cancer. Range of actual concentrations of urine mixture samples for prostate cancer examination in equal-occult blood 106-fold diluted conditions ranged from 1.0 × 10⁻⁶ v/v (black open circle) to 7.1 × 10⁻⁹ v/v (gray open circle).
III Sniffer Mice Efficiently Discriminate between Individual Pre-RP Uis and Post-RP Um
After training with pre-RP Um of five patients with prostate cancer (positive control), sniffer mice discriminated 8/8 individual prostate cancer patient pre-RP Ui vs. post-RP Um in 106-fold diluted equal-occult blood conditions (the left half of Figure 2A, Supplementary Table 1). The %Correct of sniffer mice retained significantly higher than the chance level for all eight individual patient pre-RP Ui samples. In addition, the %Correct of the positive controls sometimes caused a minor perturbation. The largest and transiently-developing reduction of %Correct was initiated by the Pe4:Ui sample, the patient of which was treated with Avolve (dutasteride, a 5α-reductase inhibitor with an elimination half-life of five weeks) and sustained for the subsequent three trials (P6:Ui, P:Um, P8:Ui, marked with @ in Figure 2A). This quasi-confusion of the sniffer mice suggested a drug metabolite-altered olfactory cue in Pe4:Ui sample as previously observed for patients on antibiotic prophylaxis [11]. Next, we tested ability of the sniffer mice to discriminate the prostate cancer odor after endocrine therapy in the condition of their learned prostate cancer odor of the five-patient Um without endocrine treatment as the olfactory cue.
The maximal perturbation of %Correct was observed anteriorly and posteriorly only at pre-RP prostate cancer after endocrine therapy Pe:Um (marked with @ in Figure 2A). This result suggested a difference in olfactory cues or relative odor intensity between the pre-RP urine samples with and without endocrine therapy in patients with prostate cancer, as expected from the difference in odor thresholds. This set of fall and rise in %Correct indicates that the olfactory cues significantly differ and yet are somewhat similar between prostate cancer odors with and without endocrine therapy. Unexpectedly, the same sniffer mice discriminated 6/6 individual, endocrine therapy-treated patient pre-RP Ui samples from untreated-patient post-RP Um (the left 2nd point and the right half of Figure 2A, Supplementary Tables 1 & 3). During the latter assays, %Correct slightly elevated and remained almost constant, suggesting no confusion of the sniffer mice upon switching between the prostate cancer odors with and without endocrine therapy. Together with the elevated threshold of prostate cancer odor by neoadjuvant endocrine therapy, the result indicates that the olfactory cue of the prostate cancer odor after endocrine therapy is biologically similar to that of a diluted prostate cancer odor at least in the most salient elements.
IV The Criterion for Judgement in Match and Mismatch of Test Odor to the Learned Odor
Notably, the sniffer mice also discriminated prostate cancer Um vs. bladder cancer Um in the diluted equal-occult blood condition with a higher %Correct than the chance level (the right penultimate point of Figure 2A, Supplementary Tables 1 & 3). However, %Correct was slightly reduced compared to those of the prior and posterior positive controls, although they did not statistically differ, suggesting no marked confusion of sniffer mice by an effect of bladder cancer odor as the negative control. In our previous proof-of-principle study, sniffer mice displayed significant perturbation in discrimination performance upon switching salient olfactory cues between occult blood and bladder cancer Ums, similarly to urine sample pairs without the learned olfactory cue [11]. In order to judge the degree of perturbation in %Correct as match or mismatch between a test odor and the learned odor, we considered the range of %Correct mean ± 1.29 × standard deviation (SD) for cumulative probability of 80.3% in a normal distribution of %Correct for the respective positive controls. The criterion of −1.29 × SD as the greatest %Correct fall of test odor from those of the prior and posterior positive controls resulted in 63% (5/8) and 83% (5/6) sensitivities of the sniffer mouse behavioural assay to individual prostate cancer patients treated without and with endocrine therapy, respectively (Supplementary Tables 3 & 4). The five patients (Pe1, 3, 7, 11, 14) treated with LH-RH were all judged as the learned prostate cancer, whereas the Pe4 patient treated with Avolve was only judged as mismatch (marked by @) to the learned prostate cancer (Figure 2A).
V Identification of Volatile Biomarkers for Prostate and Bladder Cancers
As the molecular basis of the olfactory cues for the cancer-characteristic odors, we analysed tumor-associated increases in concentrations of volatile compounds between the five Um pairs for patients with prostate and bladder cancers and healthy volunteers using SPME-GC-MS (Supplementary Figure 2, mean ± SD; Table 3). PCA was used to find robust biomarkers in pre-RP Um, compared to post-RP Um of patients of prostate cancer, and healthy volunteer Um. Using the GC-MS data of all relevant peaks, principal component 1 (PC1) vs. PC2 showed clear separation between the pre- and post-RP Um groups (PC1: 51.4% and PC2: 18.5%) (data not shown), indicating that tumor resection has effects on urinary odor feature. As potential biomarkers for the pre-RP Um, 13 compounds were extracted from PCA loading plot. Ten of them were identified and were found to be >21.7-fold higher in peak height in pre-RP Um for prostate cancer than in healthy volunteer Um (Table 3, Supplementary Figure 2). Notably, 2,6-xylidine (#129) was included to reproduce a prostate cancer-mimic odor as described below but excluded from concentration-based analyses due to its significant desorption-resistant amount (>20%) after extraction (see Materials and Methods).
Among the ten potential biomarkers for prostate cancer, 2,6-di(propan-2-yl)phenol (#165) also apparently (40-fold) increased in the bladder cancer pre-transurethral resection (pre-TUR) N:Um when compared to healthy volunteers, while the phenol (#81) slightly (2-fold) increased, and the remaining eight did not (Table 3). The two commonly-increased compounds, #81 and #165, were likely attributable to a partial similarity between the olfactory cues of prostate and bladder cancers (Figure 4). Relatively small increase in peak #81 for bladder cancer could discriminate between bladder and prostate cancers in ratios of patient to healthy volunteer [#81:#165 = 2:40 (bladder cancer) vs. 38:222 (prostate cancer)], (Table 3). No significant increase in the eight biomarkers (#101, #104, #109, #119, #123, #129, #152, and #155) in the bladder cancer pre-TUR N:Um could be another origin of the distinct olfactory cues between the two cancers (Table 3).
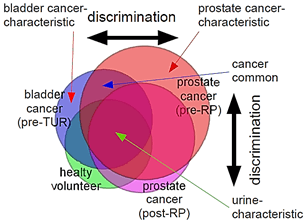
Figure 4: Schematic diagram for discrimination between similar but distinct odors. The sniffer mice would discriminate cancer-characteristic odors of biomarkers based on relative ratio of biomarkers for distinct cancers (cancer-characteristic + cancer-common increases/decreases in compound concentrations) vs. urine-characteristic profiles in compound concentrations. Overlapping regions contain similar profiles in relative compound concentrations common to different cancers or those common to cancers and healthy variations, leading to odor similarity, whereas non-overlapping regions contain status-characteristic profiles in compound concentrations, leading to odor-cue mismatch.
Interestingly, although all the nine biomarkers markedly decreased by tumor excision, seven biomarkers (#101: dimethyl succinate, #104: acetophenone, #109: 2-phyenyl-2-propanol, #119: 3,5,5-trimethyl-2-cyclohexenone, #123: dimethyl glutarate, #129: 2,6-xylidine, and #155: 2-hydroxy-2-methylpropiophenone) remained to be 2.2–159-fold higher in the post-RP Um than those of healthy volunteer Ums (Table 3). This result suggests that some of the biomarkers would contribute to the prostate cancer odor likely through tumor-triggered systems. Moreover, some peaks such as #70 and #36 were relatively constant among the five Um pairs, resulting in a higher stability of the relative peak height ratios of #36 to #70, as shown by a lower coefficient of variation (11% = 0.673/6.023) than the original one (23% = 23,800/103,000) (Supplementary Figure 2, Table 3). These results indicate that cancer-type-specific patterns of relative peak height ratios could be used as non-invasive diagnostic tools for prostate and bladder cancers. For example, bladder cancer could be diagnosed by a characteristic pattern of increasing and maintaining in #81 (small), #165 (robust), #119 (no), and #155 (no), whereas prostate cancer could be done by a pattern of #81 (robust), #165 (more robust), #119 (extremely robust), #155 (robust), and #101 (robust) (Table 3).
VI Validation of the Olfactory Cue of Ppq-Level Urinary Biomarkers for Prostate Cancer in the 106-Fold Diluted Pre-PR Um by its Reproduction in the Post-PR Um
Using linear calibration curves of biomarker concentrations to GC-MS peak areas and simple linear models of the concentrations to GC-MS peak heights, we estimated ppq or sub-ppq levels of these nine biomarkers in the 106-fold-diluted Ums for odor discrimination behavioural assays (Table 4). Regardless of endocrine therapy, five biomarkers (#81, #101, #123, #152, and #165) were commonly higher in concentrations in 106-fold-diluted pre-RP Um than in post-RP Um, whereas relationships of pre- and post-RP concentrations for #104, #109, #119, and #155 biomarkers differed between patients with prostate cancer without and with endocrine therapy. This result suggests that sniffer mice could recognize the prostate cancer odor by increased odor intensities of the #81, #101, #123, #152, and #165 biomarkers, as well as a difference between P:Um and Pe:Um odors by relatively different odor intensities of the #104, #109, #119, and #155 biomarkers. In accordance with the relative increases common to the prostate and bladder cancers as described above, the two biomarkers (#81 and #165) were also higher in concentrations in 106-fold-diluted pre-TUR Um than in post-TUR Um, whereas relationships of pre- and post-TUR concentrations for #101, #104, #109, #123, #152, and #155 biomarkers differed between each pair of N:Um and K:Um for bladder cancer. Interestingly, among all the five Um pairs, phenol was similarly high (6.1-30 ppq) in concentrations in one or both samples of pairing partners.
Table 4: Differences in concentrations of biomarkers between
pairs of 106-fold diluted urine mixture samples for healthy
volunteers, patients with bladder cancer, and patients with prostate cancer.
|
Peak# |
Compound |
Healthy volunteers |
Bladder cancer
(post-antibiotic pro.) |
Bladder cancer |
Prostate cancer (endocrine
therapy) |
Prostate cancer |
||||||
|
H1–3 |
H4–6 |
post-TUR K:Um& |
pre-TUR K:Um¶ |
post-TUR N:Um¶ |
pre-TUR N:Um§ |
post-RP Pe:Um† |
pre-RP Pe:Um‡ |
post-RP P:Um* |
pre-RP P:Um** |
|||
|
Concentration (ppq) in the 106-fold diluted urine
mixture sample for behavioural assay |
|
|
|
|
||||||||
|
81 |
Phenol |
49 |
30 |
1.0 |
16 |
3.3 |
6.1 |
25 |
95 |
22 |
30 |
|
|
101 |
Dimethyl succinate |
0.59 |
0.54 |
0.011 |
0.32 |
0.20 |
0.08 |
0.59 |
2.6 |
0.84 |
1.3 |
|
|
104 |
Acetophenone |
0.86 |
0.68 |
0.014 |
0.13 |
0.11 |
0.05 |
1.1 |
3.0 |
1.2 |
1.0 |
|
|
109 |
2-Phenyl-2-propanol |
2.0 |
2.5 |
0.041 |
0.57 |
0.21 |
0.09 |
2.7 |
8.3 |
3.6 |
3.2 |
|
|
119 |
3,5,5-Trimethyl-2-cyclohexenone |
0.14 |
0.09 |
0.70 |
0.02 |
0.03 |
0.00 |
5.1 |
13 |
8.9 |
5.8 |
|
|
123 |
Dimethyl glutarate |
3.8 |
3.2 |
0.006 |
0.51 |
0.43 |
0.17 |
2.0 |
10 |
3.9 |
5.4 |
|
|
129 |
2,6-Xylidine |
not determined due
to a significant desorption-resistant amount |
||||||||||
|
152 |
Piperitone |
0.83 |
3.4 |
0.000 |
0.24 |
0.029 |
0.011 |
0.62 |
1.2 |
0.14 |
0.92 |
|
|
155 |
2-Hydroxy-2-methylprophenone |
2.0 |
1.3 |
0.004 |
0.29 |
0.28 |
0.13 |
2.8 |
8.0 |
7.7 |
4.0 |
|
|
165 |
2,6-di(propan-2-yl)phenol |
0.016 |
0.014 |
0.000 |
0.003 |
0.008 |
0.046 |
0.006 |
0.20 |
0.010 |
0.066 |
|
|
TUR: Transurethral
Resection; RP: Radical Prostatectomy. Extra-dilution rates for equal-occult blood urine samples were 1/50** v/v,
1/2* v/v, 1/10‡ v/v, 1/3† v/v, 1/13§ v/v,
1/6 v/v, 1/500& v/v. post-antibiotic pro., post-TUR
K:Um during antibiotic
prophylaxis. All patient samples were mixtures of 25 urine samples (5
patients × 5 samples). >10-fold (red) and
2–10-fold (blue)
increases from the peak height of the healthy volunteer in the original urine
mixture samples Ums were highlighted, as in (Table 3). |
||||||||||||
Next, we asked whether the eight-compound biomarker (#81, #101, #104, #109, #119, #123, #129, #152) can reproduce the olfactory cue of the prostate cancer by adding the biomarkers to the post-RP Um, where their respective concentrations were not identical to those in at the pre-RP Um (Table 3). The #165 compound (also known as an anaesthetic agent propofol) was excluded because of short half-life time (3-12 hours by oxidative degradation) and a minor component in the pre-RP Um [23-25]. As expected, sniffer mice discriminated this prostate cancer-mimic odor in the post-RP Um with the behavioural score identical to that for the real prostate cancer odor (Figure 2B, Supplementary Table 5). The post assay with the identical odor pair confirmed that the sniffer mice mainly used the olfactory cue but not any visual cue for the choice (marked by the right-sided @ in Figure 2B, see Materials and Methods). The concentrations of the eight biomarkers in the prostate cancer-mimic urine sample were 0.10–0.77-fold (0.32 ± 0.23, mean ± S.D.) of the pre-RP P:Um except for #129 (not determined) (Table 3). Thus, we validated eight volatile urinary biomarkers nearly at their original relative concentrations (0.23-1.00-fold when normalized by #123; 0.72 ± 0.51, mean ± S.D. except for #129) as the prostate cancer cue even when adding a similar profile of the biomarkers to the post-RP Um by using the sniffer mouse behavioural assay.
How much could such a characteristic biomarker profile maintain in the urine mixture sample near the odor discrimination threshold? Surprisingly, phenol was estimated at only 5,738 molecules in the 0.3-mL, 2×10¹²-fold diluted, and prostate cancer-discernible pre-RP P:Um, and other four biomarkers were around 500 molecules, and remaining three and one biomarkers were around 100 and 6.7 molecules, respectively (Supplementary Table 6). Moreover, the eight biomarkers were estimated to be in a similar range with different relative ratios in the 7.7×10¹⁰-fold diluted and bladder cancer-discernible pre-TUR N:Um. At almost the chance-level but significant discrimination for the pre- and post-TUR K:Um pair, they were estimated at 3.1 and 0.19 molecules, respectively. These results suggest that sniffer mice could detect thousands or hundreds of odor molecules of a few or several biomarkers for prostate cancer in this Y-maze behavioural assay, consistent with the super-sensitivity of the mice to (−)-wine lactone and its enantiomeric odor discrimination [17]. In contrast, there were more than 104 and 106 molecules in 0.3-mL endocrine therapy-treated prostate cancer Ums and healthy volunteer Ums, respectively, at the most diluted and discernible urine samples (Supplementary Table 6). Together with the differences in odor discrimination thresholds, these results indicate that prostate cancer-characteristic biomarkers or their profile produce a more salient olfactory cue than those of bladder cancer and healthy volunteer, compared to those of cancer-common or urine-common olfactory cues (Figure 4).
Notably, the concentration of #119 was highest (352 ppb in the original Ums) in post-TUR of bladder cancer on antibiotic prophylaxis (Supplementary Table 7). Considering that the compound of peak #119 increased 3,148-fold in post-TUR K:Um on antibiotic prophylaxis but not in pre-TUR K:Um and robust increases in post-RP Ums, 3,5,5-trimethyl-2-cyclohexenone would be a biomarker of antibiotic metabolites or activated immune responses. At least, the eight biomarkers and two #165 and #129 compounds significantly differed between pre- and post-RP Ums in concentrations or relative peak height/area ratios to those of healthy volunteers, whereas all compounds except for #152 did not differ between a pair of healthy volunteer Ums (Figure 5). Although in four of 12 patients the concentrations of biomarkers were markedly low, the sniffer mice discriminated three (P10, Pe11, and Pe14) of the four as the prostate cancer odor (Supplementary Tables 4 & 7, Supplementary Figure 3). Taken together, provisional cut-off values for non-invasive diagnosis, which we determined in the five Um pairs, produced 42%-100% sensitivity and 84%-100% specificity of single biomarkers, and 67% (8/12) sensitivity and 100% (20/20) specificity of a combinatorial method for prostate cancer, and 100% (1/1) sensitivity and 100% (31/31) specificity for bladder cancer, respectively (Supplementary Table 7).
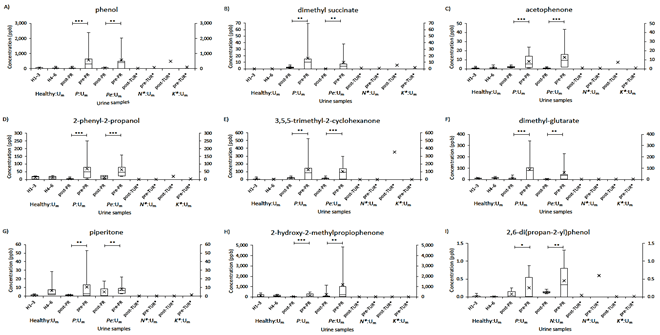
Figure 5: Comparison of nine urine volatile biomarkers in concentrations between individual urine samples for pairs of healthy volunteers and pre- and post-RP samples of patients with prostate or bladder cancer. A box, the 25th-50th-75th percentiles in concentrations; error bars, 10th-25th and 75th-90th percentiles; ×, mean of individual urine samples. P value for paired difference (t-test), 0.05 > P* ≥ 0.01, 0.01 > P** ≥ 0.001, 0.0001 > P***.
Discussion
In this study, we reveal the super-sensitivity of mice to ppq- to thousand-molecule-level olfactory cues of urinary volatile biomarkers for prostate and bladder cancers with olfactory-based validation. Two different conditions (without or with endocrine therapy and without or with post-antibiotic prophylaxis, respectively) resulted in different odor discrimination thresholds for both prostate and bladder cancers. Seven of the biomarkers, 2,6-xylidine, 2-phenyl-2-propanol, 3,5,5-trimethyl-2-cyclohexenone, 2,6-di(propan-2-yl)phenol, dimethyl succinate, phenol, and acetophenone, have been reported to be associated with an increased risk of bladder cancer, lung cancer, and lung cancer-cell metabolites, respectively, while two of methyl glutarate and piperitone have been not reported [8, 26-28]. The former consistency between the previous and our results strongly support the effectiveness of these tumor-related biomarkers and our strategy for identifying urinary biomarkers in urine mixture samples. The latter inconsistency in significant biomarkers would be attributable to differences between the sample preparations. Notably, the sniffer mice did not use donor-unique odors as olfactory cue in odor discrimination behavioural assays, because the donor odors were presented below the threshold of the sniffer mice in paired pre- and post-PR 5-patient urine mixture samples with >106-fold dilution.
I Prostate Cancer-Characteristic Odor would be Partially Comprised of Oncometabolite-Associated Compounds and/or Immune System-Related Compounds
Interestingly, dimethyl succinate is the inactive analogue of dimethyl fumarate, which has anti-cancer stem cell properties [29]. Succinate, which is known as an oncometabolite, is produced in tricarboxylic acid cycle as a metabolic intermediate with multiple biological roles [30-33]. For example, succinate promotes angiogenesis, which is essential for tumor growth, via a G protein-coupled receptor, SUCNR1 [32]. Moreover, mitochondrial oxidation of succinate drives proinflammatory macrophages, suggesting an indirect association of dimethyl succinate with aggressive immune responses [33-35]. Some of the seven biomarkers, which markedly decreased and yet remained to be 2.2-159-fold higher than those of healthy volunteer, would be attributable to tumor-originated dimethyl succinate-activated immune system in a recovery period or inter-individual variability in healthy condition.
II A Non-Invasive Diagnostic Assay Based on the Super-sensitive Murine Olfactory Performance with Perceptual Ambiguity
The present results also point out that as odor solutions decrease in the concentrations, gradual decreases in numbers of responsive olfactory receptors and their decreasing input signals to the brain result in the gradually-decreased %Corrects of the sniffer mice (Figure 1). This means that as %Correct of the sniffer mice for an odor decreases, their perceptual ambiguity increases. Moreover, this olfactory mechanism of odor discrimination and identification with perceptual ambiguities also can explain how sniffer dogs trace the body odor of a target person. Sniffer dogs start to trace a given olfactory cue of a target person’s body odor with the oldest footprint among the points between the start site and the present location of the target person. The oldest footprint presents the faintest odor, because its key compounds continue to decrease in concentrations by vaporization for the longest time after its footprint was left on the ground. When the sniffer dogs can perceive an olfactory cue of the target person’s body odor with a significance at the start site, they easily trace the olfactory cue on the foot prints along the way that the person walked more recently and made foot prints with less-reducing body odor-related compounds.
Besides these findings of the principle for odor discrimination and identification, the mouse behavioural assay validated the biomarkers at least for prostate cancer. The identical %Corrects between the real prostate-cancer odor and the biomarker-presenting mimic odor strongly support an interpretation that the other increased compounds do not markedly contribute to the olfactory cue of prostate cancer. Not surprisingly, neither single biomarkers nor a combinatorial method could detect prostate cancer in four of 12 patient urine samples, P10, Pe11, and Pe14 of which super-sensitive sniffer mice could detect. It is possible that biomarkers would somewhat increase but at a lower level than GC-MS thresholds. We cannot exclude the possibility that there are unidentified biomarkers for prostate and bladder cancers. Relative contributions of the eight biomarker compounds and major urine-characteristic and constant compounds will be investigated in future studies with new samples.
As a non-invasive diagnostic assay, we showed that sniffer mice can discriminate between urine odor changes in patients with prostate cancer regardless neoadjuvant endocrine therapy as well as bladder cancer in 106-fold-diluted equal-occult blood conditions (including less than 0.3 nL of the original urine sample) below the detection level of dietary variations. In the 18-25 sample mixture Um condition, urinary olfactory cues increased in the following order: dietary variation < bladder cancer < occult blood < prostate cancer (after neoadjuvant endocrine therapy) < antibiotic drug metabolites < prostate cancer (Figure 3). This relationship provides a biological basis for detection of body odor disorders in the diluted equal-occult blood urine mixture condition for non-invasive diagnostic tests for prostate and bladder cancers or other diseases.
III Criterion for Odor Match and Mismatch, Diagnostic Sensitivity
The criterion of −1.29 × SD resulted in a 63–83% sensitivity and 60-100% specificity of the sniffer mouse behavioural assay for prostate or bladder cancer or occult blood regardless of neoadjuvant endocrine therapy for prostate cancer (Supplementary Table 4). This performance is comparable to the 36-98% sensitivity and <10-99% specificity of sniffer dog assay for detection of prostate cancer [1, 18-21]. The sniffer mouse behavioural assay has at least two advantages over the sniffer dog assays. As described above, an advantage is a shorter training period (ca. three months) compared to one year for sniffer dogs. Another advantage is described below. In addition, our provisional cut-off values of the ten biomarkers exhibited 67% sensitivity and 100% specificity of combinatorial method for detection of prostate cancer, as similarly to the sniffer mouse behavioural assay. Notably, a half of diagnoses were identical between the two assays (P2, P5, P13, Pe1, Pe3, and Pe7) but the other half was not (P6, P8, P10, Pe11, Pe14, and Pe4). This difference is likely due to difference in sensitivity and biomarker profile difference-induced change in relative intensities of elemental odors from the learned olfactory cue, as well as the observed differences in relative increases of biomarkers in P6, P8, and Pe4. To address such a complicated issue, a huge amount of additional and systematic data should be collected and analysed in future.
IV Fechner’s Law in Odor Discrimination Accuracy in Mice
Interestingly, the linear regression model of %Correct vs. logarithmic concentration [P = 4.51 × log(conc.) + 110.63] (Figure 1), which is according to Fechner’s law, expects that a 10-fold concentration change results in a %Correct rise or fall of 4.51, the latter of which is nearly identical to −4.6 (fall of 4.6) for the criterion of −1.29 × SD for the learned prostate cancer odor. The greater intensity of urinary prostate cancer olfactory cues compared to the bladder cancer odor may help to identify common urinary volatile biomarkers, which would be [κ1 × log(6.2 × 10⁴)]-fold and [κ1 × log(1.6 × 10²)]-fold higher in odor intensities in pre- and post-endocrine therapy-prostate cancer urine samples, respectively, than that of the bladder cancer urine sample (κ1: constant; the latter reduced rate was calculated as 1.6 × 102 = 6.2 × 10⁴ ÷ 3.9 × 10²), or prostate cancer-specific urinary volatile biomarkers, which would be [κ2 × log(3.9 × 10²)]-fold higher in odor intensities in the prostate cancer urine sample than that of the post-endocrine therapy-prostate cancer urine sample (Figure 3). The constant κ is dependent on active compounds and cancer types.
Relative odor intensities of respective biomarkers or their cognate subsets would be estimated to be identical to their %Correct falls for partially-subtractive prostate cancer-mimic post-RP Um after the positive control pre-RP Um, or by relationships between %Correct falls of individual patients and their SPME-GC-MS peak height/area ratios to those of different 5-patient mixtures. Respective odor intensities can be also determined by analysing changes in odor discrimination thresholds for pairs of single or multiple biomarker-adding post-RP Um vs. the original post-RP Um compared to positive control pre- and post-RP Um pair. The availability of this quantitative analysis may add another advantage to the sniffer mouse Y-maze behavioural assay over the sniffer dog assays for identification of urinary volatile biomarkers.
In addition, potential distinct biomarkers for prostate and bladder cancers must be analysed to identify a set of reliable urinary volatile biomarkers. Notably, there are three possibilities for inconsistency of bladder cancer-biomarker 2,6-di(propan-2-yl)phenol between pre-TUR N:Um and K:Um. First, the compound would be markedly degraded during the longest six years for pre-TUR K:Um even at −20°C, whereas it was not during 4.5 years for pre-TUR N:Um. The remaining two factors were inter-individual variability and accidental delay of few hours from urine sampling to their storage in freezers and the one-day trouble of the freezer storage. A clinical validation study will address this issue.
V Quantitative Analysis for Urine-Common Compounds and Disease-Characteristic Compounds
This quantitative analysis will also identify common compounds with predicted peak height ratios as a chemical origin of the influence observed for the negative control bladder cancer odor in choice of the positive control prostate cancer odor. As sniffer dogs and mice would recognize urine-characteristic odor with relatively constant compounds and their disorders with elemental odor ratios of disease-characteristic compounds to common constant compounds such as #70, #36, ammonia, and so on (Figure 4). Moreover, the peak height of trans-4,5-epoxy-(E)-2-decenal (CAS #134454-31-2), which presents an intense odor characteristic of blood samples through lipid peroxidation as an olfactory cue of the occult blood, could be a reference that is almost identical between equal-occult blood urine mixtures used in our assays [36, 37]. Similarly, high concentrations (6.1-30 ppq) of phenol in one or both samples of the four pairing patient urine mixture samples suggests a possibility that the odor strength of phenol would be a reference value for equi-occult blood urine samples. Further studies are needed to determine whether sniffer mice recognize the odor of phenol as the olfactory cue of occult blood or a reference value for sample-characteristic odor in a unique combination of relative odor strengths of other biomarkers. Further discussions and limitations are available in supplementary material.
In the present study, we found that after the radical prostatectomy some of biomarker compounds remained to be more than two times higher in concentrations than those of healthy volunteers. This result suggests that some biomarkers originate from tumors, while others originate from cancer-associated disorders in other systems such as immune system. Recently, it is reported that body odors of sick-model mice induced body-odor disorders in healthy cage mates [38]. This study also suggests that disease odors induce to alter immune or some physiological systems, resulting in body odor disorders.
In summary, our study provides further evidence for the use of sniffer mice to detect cancer-induced changes in urine odor for the diagnosis of prostate and bladder cancers. Similar results emphasize the excellent ability of mice and dogs to discriminate weak but biologically important olfactory cues over those of more abundant compounds. Future studies will focus on the identification of urinary volatile and disease type-characteristic biomarkers for other cancers and infections, as well as specificity of the sniffer mouse behavioural assays across various cancers and other diseases for non-invasive disease diagnosis. Further, identified biomarkers will enable to identify key olfactory receptors which may govern a salient elemental odor characteristic of a target disease odor for fabricating olfactory-compatible cell sensors with an analogous algorithm to the olfactory parallel and segmented signaling [39-43].
Acknowledgement
We are grateful to Fumi Watanabe for her technical assistance with the behavioural experiments. We would like to express our sincere thanks to Yasuhiko Takahashi, Atsufumi Ozoe, Kentaro Kobayashi, Yuki Kodama, Jun Abe, Kengo Sakurai and Kohei Matsunaga of Sumitomo Chemical Co., Ltd. for measurements and PCA analyses of SPME-GC-MS peaks and related discussions, and for an original draft of related methods in the manuscript (A.O. and Y.T.). We would also like to thank Dr. Kazuyuki Kiyosue for providing the mice used in this study. We are profoundly grateful to Drs. Yuji Katsuoka, and Shinya Uchimoto for their collecting urine samples in the previous study, which were used in the training of sniffer mice in this study. We also thank our animal care staff for cares of the mice. This study was supported by a Grant-in-Aid for Scientific Research (B) #15H02730 (T.S.), grants (T.S.) from the Ministry of Economy, Trade and Industry, Japan, grants (Y.M.) from Aino University, and research budget from Sumitomo Chemical Co., Ltd. for SPME-GC-MS measurements.
Author Contributions
T.S. and Y.M. planned and conducted the project. Y.M., M.N., K.Y. and S.M. collected and prepared urine samples and Y.M., M.N. and K.Y. determination of cancer status. T.S. conducted the behavioural experiments and analysed the behavioural and SPME-GC-MS data. All authors discussed about interpretation of data. The manuscript was written by T.S. and Y.M.
Competing Interests
None.
Article Info
Article Type
Research ArticlePublication history
Received: Sat 03, Jul 2021Accepted: Sat 17, Jul 2021
Published: Wed 28, Jul 2021
Copyright
© 2023 Takaaki Sato. This is an open-access article distributed under the terms of the Creative Commons Attribution License, which permits unrestricted use, distribution, and reproduction in any medium, provided the original author and source are credited. Hosting by Science Repository.DOI: 10.31487/j.IJCST.2021.01.02
Figures & Tables
Table 1: Blood, proteins, glucose testing in P-series
patient urine samples using urine test strips.
|
Pre-RP urine samples |
Post-RP urine samples |
Control Um |
|||||||||||
|
P2:Ui |
P5:Ui |
P6:Ui |
P8:Ui |
P9:Ui |
P:Um |
P2:Ui |
P5:Ui |
P6:Ui |
P8:Ui |
P9:Ui |
P:Um |
pre-TUR: |
|
|
Cancer |
pros. |
pros. |
pros. |
pros. |
pros. |
pros. |
blad. |
||||||
|
Stage |
Ⅱ |
Ⅱ |
Ⅱ |
Ⅱ |
Ⅱ |
5Ⅱ |
5Ⅰ |
||||||
|
Gleason score / Grade |
9 |
7 |
6 |
7 |
7 |
7.2 |
3H+2L |
||||||
|
Age |
77 |
70 |
62 |
63 |
69 |
62–77 |
69–91 |
||||||
|
Gender |
♂ |
♂ |
♂ |
♂ |
♂ |
♂ |
♂ |
||||||
|
Sampling (5
days) |
(-41)– |
(-34)– |
(-30)– |
(-30)– |
(-27)– |
(-41)– |
1–22 |
1–29 |
1–33 |
1–26 |
1–22 |
1–33 |
(-53)– |
|
Haemoglobin (mg/dℓ) |
|||||||||||||
|
stock Ui/Um |
1.00 |
1.40 |
0.00 |
0.00 |
0.00 |
0.50 |
0.02 |
0.15 |
0.00 |
0.00 |
0.01 |
0.02 |
0.13 |
|
10-1-diluted
Ui/Um |
0.10 |
0.15 |
0.00 |
0.00 |
0.00 |
0.10 |
0.00 |
0.02 |
0.00 |
0.00 |
0.00 |
0.00 |
0.00 |
|
10-2-diluted Ui/Um |
0.00 |
0.04 |
0.00 |
0.00 |
0.00 |
0.00 |
0.00 |
0.00 |
0.00 |
0.00 |
0.00 |
0.00 |
0.00 |
|
10-3-diluted
Ui/Um |
0.00 |
0.00 |
0.00 |
0.00 |
0.00 |
0.00 |
0.00 |
0.00 |
0.00 |
0.00 |
0.00 |
0.00 |
0.00 |
|
Dilution for equi-occult blood of 0.01 mg/dℓ or less
Hb |
|||||||||||||
|
Extra-dilution rate |
100 |
140 |
1 |
1 |
1 |
50 |
2 |
15 |
1 |
1 |
1 |
2 |
13 |
|
Protein (mg/dℓ) |
|||||||||||||
|
stock Ui/Um |
15.0 |
50.0 |
50.0 |
15.0 |
0.0 |
30.0 |
0.0 |
15.0 |
50.0 |
0.0 |
15.0 |
15.0 |
7.5 |
|
10-1-diluted
Ui/Um |
0.0 |
0.0 |
0.0 |
0.0 |
0.0 |
0.0 |
0.0 |
0.0 |
0.0 |
0.0 |
0.0 |
0.0 |
0.0 |
|
10-2-diluted Ui/Um |
0.0 |
0.0 |
0.0 |
0.0 |
0.0 |
0.0 |
0.0 |
0.0 |
0.0 |
0.0 |
0.0 |
0.0 |
0.0 |
|
10-3-diluted
Ui/Um |
0.0 |
0.0 |
0.0 |
0.0 |
0.0 |
0.0 |
0.0 |
0.0 |
0.0 |
0.0 |
0.0 |
0.0 |
0.0 |
|
Glucose (mg/dℓ) |
|||||||||||||
|
stock Ui/Um |
0 |
0 |
0 |
0 |
0 |
0 |
0 |
200 |
0 |
0 |
0 |
30 |
50 |
|
10-1-diluted
Ui/Um |
0 |
0 |
0 |
0 |
0 |
0 |
0 |
0 |
0 |
0 |
0 |
0 |
0 |
|
10-2-diluted Ui/Um |
0 |
0 |
0 |
0 |
0 |
0 |
0 |
0 |
0 |
0 |
0 |
0 |
0 |
|
10-3-diluted
Ui/Um |
0 |
0 |
0 |
0 |
0 |
0 |
0 |
0 |
0 |
0 |
0 |
0 |
0 |
Pros.: Prostate; pre-TUR: pre-Transurethral Resection; Blad.:
Bladder; Hb: Haemoglobin.
Individual patient urine mixture (Ui)
of equal volumes of five urine samples from each patient with prostate cancer. P-series
urine mixture (P:Um) of equal volumes of 25 urine samples
from five patient P2, P5, P6, P8, and P9 on five different days
for each pre- and post-radical prostatectomy (post-RP). Ranges of patient 1st–5th
sampling days are shown, when day 0 is the ablative operation day of the
patient. *Previously prepared and reported sample [11].
Table 1: Blood, proteins, glucose testing in P-series patient urine
samples (continued).
|
Parameters and diluted
urine samples |
Pre-RP urine samples |
Post-RP urine samples |
||||||
|
P10:Ui |
P12:Ui |
P13:Ui |
P:Um |
P10:Ui |
P12:Ui |
P13:Ui |
P:Um |
|
|
Cancer |
pros. |
pros. |
pros. |
pros. |
|
|
|
|
|
Stage |
Ⅱ |
Ⅱ |
Ⅱ |
5Ⅱ |
|
|
|
|
|
Gleason score |
8 |
7 |
6 |
7.2 |
|
|
|
|
|
Age |
62 |
78 |
66 |
62–77 |
|
|
|
|
|
Gender |
♂ |
♂ |
♂ |
♂ |
|
|
|
|
|
Sampling (5 days) |
(-34)– |
(-27)– |
(-27)– |
(-41)– |
1–29 |
1–22 |
1–22 |
1–33 |
|
Haemoglobin (Hb, blood)
(mg/dℓ) |
|
|
|
|
|
|
|
|
|
stock Ui/Um
(1st) |
0.06 |
0.00 |
0.00 |
0.50 |
0.00 |
0.30 |
0.00 |
0.02 |
|
10-1-diluted Ui/Um |
0.00 |
0.00 |
0.00 |
0.10 |
0.00 |
0.05 |
0.00 |
0.00 |
|
10-2-diluted
Ui/Um |
0.00 |
0.00 |
0.00 |
0.00 |
0.00 |
0.00 |
0.00 |
0.00 |
|
10-3-diluted Ui/Um |
0.00 |
0.00 |
0.00 |
0.00 |
0.00 |
0.00 |
0.00 |
0.00 |
|
Dilution for equi-occult
blood of 0.01 mg/dℓ or less Hb |
|
|
|
|
|
|
|
|
|
Extra-dilution rate |
6 |
1 |
1 |
50 |
1 |
30 |
1 |
2 |
|
Protein (mg/dℓ) |
|
|
|
|
|
|
|
|
|
stock Ui/Um
(1st) |
0.0 |
0.0 |
0.0 |
30.0 |
15.0 |
0.0 |
0.0 |
15.0 |
|
10-1-diluted Ui/Um |
0.0 |
0.0 |
0.0 |
0.0 |
0.0 |
0.0 |
0.0 |
0.0 |
|
10-2-diluted
Ui/Um |
0.0 |
0.0 |
0.0 |
0.0 |
0.0 |
0.0 |
0.0 |
0.0 |
|
10-3-diluted Ui/Um |
0.0 |
0.0 |
0.0 |
0.0 |
0.0 |
0.0 |
0.0 |
0.0 |
|
Glucose (mg/dℓ) |
|
|
|
|
|
|
|
|
|
stock Ui/Um
(1st) |
0 |
0 |
0 |
0 |
0 |
400 |
0 |
30 |
|
10-1-diluted Ui/Um |
0 |
0 |
0 |
0 |
0 |
80 |
0 |
0 |
|
10-2-diluted
Ui/Um |
0 |
0 |
0 |
0 |
0 |
0 |
0 |
0 |
|
10-3-diluted Ui/Um |
0 |
0 |
0 |
0 |
0 |
0 |
0 |
0 |
Pros.: Prostate; Hb: Haemoglobin.
Individual patient urine mixture (Ui)
of equal volumes of five urine samples from each patient with prostate cancer. P-series
urine mixture (P:Um) of equal volumes of 25 urine samples
from five patient P2, P5, P6, P8, and P9 on five different days
for each pre- and post-radical prostatectomy (post-RP). Abbreviation: pros.,
prostate. Ranges of patient 1st–5th sampling days are
shown, when day 0 is the ablative operation day of the patient.
Table 2: Discrimination thresholds of sniffer mice for pairs
of human urine mixtures in a Y-maze.
|
Urine mixture pair |
Dilution types |
Discrimination thresholds (D.T.) of urine mixtures |
Cancer |
Stage |
Gleason |
Age |
Gender |
Sampling period |
|
pre-RP P:Um |
equal-occult blood |
2.0 × 10⁻¹² (9.2 × 10⁻¹⁵) |
prostate |
5 Ⅱ |
7.2 |
62–77 |
♂ |
(−41)–(−1) |
|
post-RP P:Um |
none |
– |
1–33 |
|||||
|
pre-RP Pe:Um |
equal-occult blood |
1.0 × 10-9* (3.6 × 10-12)* |
prostate (ET) |
4Ⅱ+ 1Ⅲ |
6.0 |
58–80 |
♂ |
(−41)–(−1) |
|
post-RP Pe:Um |
none |
– |
1–29 |
|||||
|
pre-TUR N:Um |
equal-occult blood |
7.7 × 10⁻¹⁰** (5.7 × 10⁻¹⁰)** |
bladder |
5 I |
3H + 2L |
69–91 |
♂ |
(−53)–(−1) |
|
post-TUR N:Um |
none |
– |
8–127 |
|||||
|
healthy H1–3 Um |
equally diluted |
1.0 × 10⁻⁵** (2.6 × 10⁻⁶)** |
none |
– |
– |
52–75 |
♂ |
(−17)–(−1)¶ |
|
healthy H4–6 Um |
none |
– |
0–11# |
RP: Radical Prostatectomy;
ET: neoadjuvant Endocrine Therapy; TUR: Transurethral Resection of bladder
tumor. P:Um: P-series Urine mixture.
(Um) is an equal-volume mixture of 25
urine samples from five patients with prostate cancer: P2, P5, P6, P8, and P9 on
five different days. Pe:Um,
Pe-series Um is an
equal-volume mixture of 25 urine samples from five patients: Pe1, Pe3, Pe7, Pe11, and Pe14 on five different days. The
discrimination thresholds of sniffer mice were obtained as the lowest urine
concentrations with the average values of the %Correct for 4-8 mice (18 trials
per mouse) greater than 61.5% or 58.3% that were significantly different from
chance level (P = 0.05 for 72 or 144
trials). Estimated threshold concentration in parenthesis was calculated by the
odds ratio (%Correct to chance) of the logit, with P = 76.65% and linear regression models of %Correct. Urine sample
was diluted in distilled water (v/v). *Preliminary result for four mice (the
lowest concentration with the %Correct greater than 61.55%, P = 0.05 for 72 trials). **Thresholds
for bladder cancer N:Um
and healthy H1–3 vs. H4–6 Ums were previously
reported [11].
Table 3: Differences in SPME-GC-MS peaks and concentrations of biomarkers
between pairs of urine mixture samples for healthy volunteers, patients with
bladder cancer, and patients with prostate cancer.
|
Peak # |
Compound |
parameters |
Healthy volunteers |
Bladder cancer |
Bladder cancer |
Prostate cancer
(endocrine therapy) |
Prostate cancer |
prostate cancer-mimic
sample |
||||||
|
H1–3 |
H4–6 |
post-TUR K:Um |
pre-TUR K:Um |
post-TUR N:Um |
pre-TUR N:Um |
post-RP Pe:Um |
pre-RP Pe:Um |
post-RP P:Um |
pre-RP P:Um |
|||||
|
Peak height (a.u. in the upper row) and concentration (ppb in the
lower row) in the original urine mixture sample |
||||||||||||||
|
81 |
Phenol |
peak height |
171 |
104 |
1,715 |
338 |
70 |
279 |
267 |
3,349 |
157 |
5,261 |
||
|
concentration (ppb) |
49 |
30 |
489 |
96 |
20 |
80 |
76 |
955 |
45 |
1,500 |
334 |
|||
|
m/z = 94.0; retention time (min) = 12.157 (12.477 for DB-5MS column; 32.663
for InertCap Pure WAX column) |
||||||||||||||
|
relat.to_healthy Um |
1.24 |
0.76 |
12.4 |
2.45 |
0.51 |
2.03 |
1.94 |
24.3 |
1.14 |
38.2 |
8.5 |
|||
|
relat.to_healthy #81 |
1.24 |
0.76 |
12.4 |
2.45 |
0.51 |
2.03 |
1.94 |
24.3 |
1.14 |
38.2 |
0.22 |
|||
|
relat.to_#70 |
0.010 |
0.007 |
0.094 |
0.016 |
0.004 |
0.016 |
0.016 |
0.180 |
0.013 |
0.283 |
(/pre-RP) |
|||
|
101 |
Dimetyl succinate |
peak height |
74 |
68 |
705 |
240 |
153 |
125 |
222 |
3,236 |
212 |
8,464 |
||
|
concentration (ppb) |
0.59 |
0.54 |
5.58 |
1.90 |
1.21 |
0.99 |
1.76 |
25.6 |
1.68 |
67.0 |
19.7 |
|||
|
m/z = 115.0; retention time (min) = 13.995 (14.320 in DB-5MS column; 23.740 for
InertCap Pure WAX column) |
||||||||||||||
|
relat.to_healthy Um |
1.04 |
0.96 |
9.90 |
3.38 |
2.15 |
1.76 |
3.13 |
45.5 |
2.98 |
119 |
34.9 |
|||
|
relat.to_healthy #81 |
0.54 |
0.49 |
5.11 |
1.74 |
1.11 |
0.91 |
1.61 |
23.5 |
1.54 |
61.4 |
0.29 |
|||
|
relat.to_#70 |
0.005 |
0.004 |
0.04 |
0.01 |
0.01 |
0.007 |
0.01 |
0.17 |
0.02 |
0.46 |
(/pre-RP) |
|||
|
104 |
Acetophenone |
peak height |
1,471 |
1,154 |
12,159 |
1,304 |
1,156 |
1,079 |
5,428 |
5.1×10⁴ |
3,979 |
8.2×10⁴ |
||
|
concentration (ppb) |
0.86 |
0.68 |
7.14 |
0.77 |
0.68 |
0.63 |
3.19 |
29.9 |
2.34 |
48.0 |
9.2 |
|||
|
m/z = 105.0; retention time (min) = 15.073 (15.383 in DB-5MS column; 25.040 for
InertCap Pure WAX column) |
||||||||||||||
|
relat.to_healthy Um |
1.12 |
0.88 |
9.26 |
0.99 |
0.88 |
0.82 |
4.13 |
38.7 |
3.03 |
62.3 |
12.0 |
|||
|
relat.to_healthy #81 |
10.7 |
8.37 |
88.2 |
9.45 |
8.39 |
7.82 |
39.4 |
369 |
28.9 |
593 |
0.19 |
|||
|
relat.to_#70 |
0.09 |
0.08 |
0.67 |
0.06 |
0.07 |
0.06 |
0.33 |
2.74 |
0.32 |
4.40 |
(/pre-RP) |
|||
|
109 |
2-Phenyl-2-propanol |
peak height |
2,297 |
2,839 |
2.4×10⁴ |
3,903 |
1,472 |
1,289 |
9413 |
9.5×10⁴ |
8379 |
1.8×10⁵ |
||
|
concentration (ppb) |
2.00 |
2.47 |
20.5 |
3.40 |
1.28 |
1.12 |
8.19 |
82.7 |
7.29 |
160 |
16.3 |
|||
|
m/z = 121.0; retention time (min) = 15.738 (16.081 in DB-5MS column; 27.607 for
InertCap Pure WAX column) |
||||||||||||||
|
relat.to_healthy Um |
0.89 |
1.11 |
9.18 |
1.52 |
0.57 |
0.50 |
3.67 |
37.0 |
3.26 |
71.6 |
7.3 |
|||
|
relat.to_healthy #81 |
16.7 |
20.6 |
171 |
28.3 |
10.7 |
9.35 |
68.3 |
689 |
60.8 |
1,334 |
0.10 |
|||
|
relat.to_#70 |
0.14 |
0.19 |
1.30 |
0.19 |
0.09 |
0.07 |
0.57 |
5.12 |
0.68 |
9.90 |
(/pre-RP) |
|||
|
119 |
3,5,5-Trimethyl-2-cyclohexenone |
peak height |
580 |
366 |
1.5×10⁶ |
628 |
694 |
273 |
6.4×10⁴ |
5.7×10⁵ |
7.5×10⁴ |
1.2×10⁶ |
||
|
concentration (ppb) |
0.14 |
0.09 |
352 |
0.15 |
0.16 |
0.06 |
15.3 |
135 |
17.8 |
290 |
128 |
|||
|
m/z = 138.0; retention time (min) = 16.883 (17.288 in DB-5MS column; 23.787 for
InertCap Pure WAX column) |
||||||||||||||
|
relat.to_healthy Um |
1.23 |
0.77 |
3,148 |
1.33 |
1.47 |
0.58 |
136 |
1,206 |
159 |
2,592 |
1,142 |
|||
|
relat.to_healthy #81 |
4.21 |
2.65 |
10,791 |
4.56 |
5.03 |
1.98 |
467 |
4,133 |
544 |
8,886 |
0.44 |
|||
|
relat.to_#70 |
0.035 |
0.024 |
81.9 |
0.030 |
0.043 |
0.016 |
3.90 |
30.7 |
6.12 |
66.0 |
(/pre-RP) |
|||
|
123 |
Dimethyl glutarate |
peak height |
314 |
267 |
261 |
253 |
211 |
178 |
491 |
8229 |
648 |
2.2×10⁴ |
||
|
concentration (ppb) |
3.8 |
3.2 |
3.2 |
3.1 |
2.6 |
2.2 |
6.0 |
100 |
7.9 |
270 |
208 |
|||
|
m/z = 129.0; retention time (min)
= 17.369 (17.708 in DB-5MS column;
26.337 for InertCap Pure WAX column) |
||||||||||||||
|
relat.to_healthy Um |
1.08 |
0.92 |
0.90 |
0.87 |
0.73 |
0.61 |
1.69 |
28.3 |
2.23 |
76.4 |
58.9 |
|||
|
relat.to_healthy #81 |
2.28 |
1.93 |
1.89 |
1.84 |
1.53 |
1.29 |
3.56 |
59.7 |
4.70 |
161 |
0.77 |
|||
|
relat.to_#70 |
0.019 |
0.018 |
0.014 |
0.012 |
0.013 |
0.010 |
0.030 |
0.443 |
0.053 |
1.20 |
(/pre-RP) |
|||
|
129 |
2,6-Xylidine |
peak height |
302 |
302 |
1,250 |
1,312 |
419 |
639 |
1,835 |
1.8×10⁴ |
1,140 |
4.9×10⁴ |
||
|
concentration (ppb) |
not determined due to a significant
desorption-resistant amount |
+10.5 |
||||||||||||
|
m/z = 121.0; retention time (min)
= 18.263 (18.586 in DB-5MS column;
29.497 for InertCap Pure WAX column) |
||||||||||||||
|
relat.to_healthy Um |
1.00 |
1.00 |
4.14 |
4.34 |
1.39 |
2.11 |
6.07 |
58.9 |
3.77 |
161 |
|
|||
|
relat.to_healthy #81 |
2.19 |
2.19 |
9.06 |
9.52 |
3.04 |
4.63 |
13.31 |
129 |
8.27 |
352 |
‒ |
|||
|
relat.to_#70 |
0.018 |
0.020 |
0.069 |
0.063 |
0.026 |
0.037 |
0.11 |
0.96 |
0.093 |
2.61 |
(/pre-RP) |
|||
|
152 |
Piperitone |
peak height |
1,422 |
5,831 |
296 |
2,409 |
297 |
241 |
3,158 |
2.1×10⁴ |
468 |
7.9×10⁴ |
||
|
concentration (ppb) |
0.83 |
3.41 |
0.17 |
1.41 |
0.17 |
0.14 |
1.85 |
12.3 |
0.27 |
46.0 |
9.3 |
|||
|
m/z = 110.0; retention time (min)
= 20.947 (21.336 in DB-5MS column;
27.057 for InertCap Pure WAX column) |
||||||||||||||
|
relat.to_healthy Um |
0.39 |
1.61 |
0.08 |
0.66 |
0.08 |
0.07 |
0.87 |
5.78 |
0.13 |
21.7 |
4.4 |
|||
|
relat.to_healthy #81 |
10.3 |
42.3 |
2.14 |
17.5 |
2.15 |
1.75 |
22.9 |
152 |
3.39 |
570 |
0.20 |
|||
|
relat.to_#70 |
0.087 |
0.384 |
0.016 |
0.115 |
0.019 |
0.014 |
0.191 |
1.13 |
0.038 |
4.23 |
(/pre-RP) |
|||
|
155 |
2-Hydroxy-2-methylpropiophenone |
peak height |
153 |
98 |
134 |
130 |
124 |
122 |
631 |
5,959 |
1,157 |
1.5×10⁴ |
||
|
concentration (ppb) |
2.05 |
1.31 |
1.80 |
1.73 |
1.65 |
1.63 |
8.43 |
79.6 |
15.5 |
200 |
15.5 |
|||
|
m/z = 105.0; retention time (min)
= 21.7 (22.027 in DB-5MS column;
34.293 for InertCap Pure WAX column) |
||||||||||||||
|
relat.to_healthy Um |
1.22 |
0.78 |
1.07 |
1.03 |
0.98 |
0.97 |
5.02 |
47.4 |
9.20 |
119 |
9.20 |
|||
|
relat.to_healthy #81 |
1.11 |
0.71 |
0.97 |
0.94 |
0.90 |
0.88 |
4.58 |
43.2 |
8.39 |
109 |
0.08 |
|||
|
relat.to_#70 |
0.009 |
0.006 |
0.007 |
0.006 |
0.008 |
0.007 |
0.038 |
0.32 |
0.094 |
0.81 |
(/pre-RP) |
|||
|
165 |
2,6-Di(propan-2-yl)phenol |
peak height |
122 |
111 |
68 |
140 |
369 |
4,693 |
130 |
1.6×10⁴ |
160 |
2.6×10⁴ |
||
|
concentration (ppb) |
0.02 |
0.01 |
0.01 |
0.02 |
0.05 |
0.60 |
0.02 |
2.00 |
0.02 |
3.30 |
0.02 |
|||
|
m/z = 163.0; retention time (min)
= 23.76 (24.263 in DB-5MS column;
33.039 for InertCap Pure WAX column) |
||||||||||||||
|
relat.to_healthy Um |
1.05 |
0.95 |
0.58 |
1.20 |
3.16 |
40.2 |
1.12 |
134 |
1.37 |
222 |
1.37 |
|||
|
relat.to_healthy #81 |
0.89 |
0.81 |
0.49 |
1.02 |
2.68 |
34.0 |
0.94 |
113 |
1.16 |
188 |
0.01 |
|||
|
relat.to_#70 |
0.007 |
0.007 |
0.004 |
0.007 |
0.023 |
0.273 |
0.008 |
0.843 |
0.013 |
1.39 |
(/pre-RP) |
|||
Table 3. Differences in SPME-GC-MS peaks and concentrations of biomarkers
between pairs of urine mixture samples for healthy volunteers, patients with
bladder cancer, and patients with prostate cancer (continued).
|
Peak # |
Compound |
parameters |
Healthy volunteers |
Bladder cancer |
Bladder cancer |
Prostate cancer
(endocrine therapy) |
Prostate cancer |
|||||
|
H1–3 |
H4–6 |
post-TUR K:Um |
pre-TUR K:Um |
post-TUR N:Um |
pre-TUR N:Um |
post-RP Pe:Um |
pre-RP Pe:Um |
post-RP P:Um |
pre-RP P:Um |
|||
|
70 |
unidentified |
peak height |
1.6×10⁴ |
1.5×10⁴ |
1.8×10⁴ |
2.1×10⁴ |
1.6×10⁴ |
1.7×10⁴ |
1.7×10⁴ |
1.9×10⁴ |
1.2×10⁴ |
1.9×10⁴ |
|
relat.to_healthy Um |
1.00 |
0.92 |
1.11 |
1.27 |
0.98 |
1.05 |
1.01 |
1.13 |
0.75 |
1.13 |
||
|
relat.to_#70 |
1.00 |
1.00 |
1.00 |
1.00 |
1.00 |
1.00 |
1.00 |
1.00 |
1.00 |
1.00 |
||
|
relat.to_#36 |
0.17 |
0.18 |
0.18 |
0.13 |
0.18 |
0.18 |
0.16 |
0.18 |
0.17 |
0.15 |
||
|
36 |
unidentified |
peak height |
9.7×10⁴ |
8.5×10⁴ |
9.9×10⁴ |
1.6×10⁵ |
9.0×10⁴ |
9.7×10⁴ |
1.1×10⁵ |
1.0×10⁵ |
7.2×10⁴ |
1.2×10⁵ |
|
relat.to_healthy Um |
1.00 |
0.88 |
1.02 |
1.65 |
0.93 |
1.00 |
1.10 |
1.07 |
0.74 |
1.25 |
||
|
relat.to_#70 |
5.90 |
5.59 |
5.44 |
7.65 |
5.65 |
5.64 |
6.42 |
5.57 |
5.87 |
6.50 |
||
|
relat.to_#36 |
1.00 |
1.00 |
1.00 |
1.00 |
1.00 |
1.00 |
1.00 |
1.00 |
1.00 |
1.00 |
||
|
87 |
unidentified |
peak height |
4,158 |
3,619 |
3,115 |
2,540 |
2,241 |
2,364 |
2,819 |
3,662 |
1,936 |
1,789 |
|
relat.to_healthy Um |
1.00 |
0.87 |
0.75 |
0.61 |
0.54 |
0.57 |
0.68 |
0.88 |
0.47 |
0.43 |
||
|
relat.to_#70 |
0.25 |
0.24 |
0.17 |
0.12 |
0.14 |
0.14 |
0.17 |
0.20 |
0.16 |
0.10 |
||
|
relat.to_#36 |
0.04 |
0.04 |
0.03 |
0.02 |
0.02 |
0.02 |
0.03 |
0.04 |
0.03 |
0.01 |
||
|
92 |
unidentified |
peak height |
1,771 |
1,387 |
2,157 |
1,495 |
1,722 |
1,147 |
2,195 |
1,720 |
1,612 |
2,099 |
|
relat.to_healthy Um |
1.00 |
0.78 |
1.22 |
0.84 |
0.97 |
0.65 |
1.24 |
0.97 |
0.91 |
1.19 |
||
|
relat.to_#70 |
0.11 |
0.09 |
0.12 |
0.07 |
0.11 |
0.07 |
0.13 |
0.09 |
0.13 |
0.11 |
||
|
relat.to_#36 |
0.018 |
0.016 |
0.022 |
0.009 |
0.019 |
0.012 |
0.021 |
0.017 |
0.022 |
0.017 |
||
post-antibiotic pro.: post-TUR K:Um with antibiotic prophylaxis;
TUR: Transurethral Resection; RP: Radical Prostatectomy.
All patient samples were mixtures of 25 urine
samples (5 patients × 5 samples). DB-5MS column is equivalent to CP Sil 8CB column.
Ratio of the peak height for the respective sample relative (relat.) to that of
an average of those for H1–3 and H4–6 mixture samples Um.
>10-fold (red) and 2–10-fold (blue) increases from the
peak height of the healthy volunteer in were highlighted.
References
1. Bax C,
Taverna G, Eusebio L, Sironi S, Grizzi F et
al. (2018) Innovative Diagnostic Methods for Early Prostate
Cancer Detection through Urine Analysis: A Review. Cancers (Basel) 10:
123. [Crossref]
2. Filella
X, Fernández Galan E, Fernández Bonifacio R, Foj L (2018) Emerging biomarkers
in the diagnosis of prostate cancer. Pharmgenomics
Pers Med 11: 83-94. [Crossref]
3. Ji
W, Sun B, Su C (2017) Targeting MicroRNAs in Cancer Gene Therapy. Genes (Basel) 8: 21.
4. Adams
BD, Parsons C, Walker L, Zhang WC, Slack FJ (2017) Targeting noncoding RNAs in
disease. J Clin Invest 123: 761-771. [Crossref]
5.
Silva CL, Passos M, Câmara JS (2011)
Investigation of urinary volatile organic metabolites as potential cancer
biomarkers by solid-phase microextraction in combination with gas
chromatography-mass spectrometry. Br J
Cancer 105: 1894-1904. [Crossref]
6. Porto
Figueira P, Pereira JAM, Câmara JS (2018) Exploring the potential of needle
trap microextraction combined with chromatographic and statistical data to
discriminate different types of cancer based on urinary volatomic biosignature.
Anal Chim Acta 1023: 53-63. [Crossref]
7.
Jiménez Pacheco A, Salinero Bachiller M,
Iribar MC, López Luque A, Miján Ortiz JL et
al. (2018) Furan
and p-xylene as candidate biomarkers for prostate cancer. Urol Oncol 36: 243.e21-243.e27.
[Crossref]
8.
Hanai Y, Shimono K, Matsumura K,
Vachani A, Albelda S et al. (2012) Urinary volatile compounds as biomarkers for
lung cancer. Biosci Biotechnol Biochem
76: 679-684. [Crossref]
9. Jobu
K, Sun C, Yoshioka S, Yokota J, Onogawa M et al. (2012) Metabolomics study on the biochemical profiles of
odor elements in urine of human with bladder cancer. Biol Pharm Bull 35:
639-642. [Crossref]
10. Abraham
NM, Spors H, Carleton A, Margrie TW, Kuner T et al. (2004) Maintaining accuracy at the expense of speed:
stimulus similarity defines odor discrimination time in mice. Neuron 44:
865-876. [Crossref]
11. Sato
T, Katsuoka Y, Yoneda K, Nonomura M, Uchimoto S et al. (2017) Sniffer mice discriminate urine odours of patients
with bladder cancer: A proof-of-principle study for non-invasive diagnosis of
cancer-induced odours. Sci Rep 7: 14628. [Crossref]
12.
Fischer
S, Bergmann A, Steffens M, Trefz P, Ziller M et al. (2015) Impact of
food intake on in vivo VOC concentrations in exhaled breath assessed in a
caprine animal model. J Breath Res 9: 047113. [Crossref]
13.
Fischer
S, Trefz P, Bergmann A, Steffens M, Ziller M et al. (2015) Physiological
variability in volatile organic compounds (VOCs) in exhaled breath and released
from faeces due to nutrition and somatic growth in a standardized caprine
animal model. J Breath Res 9:
027108. [Crossref]
14. Schaefer
ML, Yamazaki K, Osada K, Restrepo D, Beauchamp GK (2002) Olfactory fingerprints
for major histocompatibility complex-determined body odors II: relationship
among odor maps, genetics, odor composition, and behavior. J Neurosci 22:
9513-9521. [Crossref]
15. Kwak
J, Willse A, Matsumura K, Opiekun MC, Yi W et al. (2008) Genetically-based olfactory signatures persist
despite dietary variation. PLoS One 3: e3591. [Crossref]
16. Matsumura
K, Opiekun M, Oka H, Vachani A, Albelda SM et al. (2010) Urinary volatile
compounds as biomarkers for lung cancer: a proof of principle study using odor
signatures in mouse models of lung cancer. PLoS
One 5: e8819. [Crossref]
17. Sato
T, Kobayakawa R, Kobayakawa K, Emura M, Itohara S et al. (2015) Supersensitive detection and discrimination of
enantiomers by dorsal olfactory receptors: evidence for hierarchical odour
coding. Sci Rep 5: 14073. [Crossref]
18. Gordon
RT, Schatz CB, Myers LJ, Kosty M, Gonczy C et al. (2008) The use of canines in the detection of human
cancer. J Altern Complement Med 14: 61-67. [Crossref]
19. Cornu
JN, Cancel Tassin G, Ondet V, Girardet C, Cussenot O (2011) Olfactory detection
of prostate cancer by dogs sniffing urine: a step forward in early diagnosis. Eur Urol 59: 197-201. [Crossref]
20. Elliker
KR, Sommerville BA, Broom DM, Neal DE, Armstrong S et al. (2014) Key considerations for the experimental training
and evaluation of cancer odour detection dogs: lessons learnt from a
double-blind, controlled trial of prostate cancer detection. BMC Urol 14: 22. [Crossref]
21. Taverna
G, Tidu L, Grizzi F, Torri V, Mandressi A et al. (2015) Olfactory system of highly
trained dogs detects prostate cancer in urine samples. J Urol 193:
1382-1387. [Crossref]
22. Tsugawa
H, Cajka T, Kind T, Ma Y, Higgins B et al. (2015) MS-DIAL: data-independent MS/MS deconvolution for comprehensive
metabolome analysis. Nat Methods 12: 523-526. [Crossref]
23. Chidambaran
V, Costandi A, D’Mello A (2015) Propofol: a review of its role in pediatric
anesthesia and sedation. CNS
Drugs 29: 543-563. [Crossref]
24. Baker
MT, Gregerson MS, Martin SM, Buettner GR (2003) Free radical and drug oxidation products in an intensive care unit
sedative: propofol with sulfite. Crit Care Med 31: 787-792. [Crossref]
25. MICROMEDEX
Thomson Health Care (2002) USPDI-Drug Information for the Health Care
Professional. 22nd ed. Greenwood Village CO 1: 2467.
26. Gan
J, Skipper PL, Gago Dominguez M, Arakawa K, Ross RK et al. (2004) Alkylaniline-hemoglobin adducts and risk of
non-smoking-related bladder cancer. J
Natl Cancer Inst 96:
1425-1431. [Crossref]
27. Tao
L, Day BW, Hu B, Xiang YB, Wang R et
al. (2013) Elevated 4-aminobiphenyl and 2,6-dimethylaniline hemoglobin
adducts and increased risk of bladder cancer among lifelong nonsmokers--The
Shanghai Bladder Cancer Study. Cancer
Epidemiol Biomarkers Prev 22:
937-945. [Crossref]
28. Hanai
Y, Shimono K, Oka H, Baba Y, Yamazaki K et
al. (2012) Analysis of volatile organic compounds released from human
lung cancer cells and from the urine of tumor-bearing mice. Cancer Cell Int 12: 7. [Crossref]
29. Kastrati
I, Siklos MI, Calderon Gierszal EL, El Shennawy L, Georgieva G et al. (2016) Dimethyl Fumarate
Inhibits the Nuclear Factor κB Pathway in Breast Cancer Cells by Covalent
Modification of p65 Protein. J Biol Chem
291: 3639-3647. [Crossref]
30. Eijkelenkamp
K, Osinga TE, Links TP, van der Horst Schrivers ANA (2020) Clinical
implications of the oncometabolite succinate in SDHx-mutation carriers. Clin Genet 97: 39-53. [Crossref]
31. Pozza
ED, Dando I, Pacchiana R, Liboi E, Scupoli MT et al. (2020)
Regulation of succinate dehydrogenase and role of succinate in cancer. Semin Cell Dev Biol 98: 4-14. [Crossref]
32. Mu
X, Zhao T, Xu C, Shi W, Geng B et al. (2017) Oncometabolite succinate promotes
angiogenesis by upregulating VEGF expression through GPR91-mediated STAT3 and
ERK activation. Oncotarget 8: 13174-13185. [Crossref]
33. Nowicki
S, Gottlieb E (2015) Oncometabolites: tailoring our genes. FEBS J 282:
2796-2805. [Crossref]
34. Lampropoulou
V, Sergushichev A, Bambouskova M, Nair S, Vincent EE et al. (2016) Itaconate Links Inhibition of Succinate
Dehydrogenase with Macrophage Metabolic Remodeling and Regulation of
Inflammation. Cell Metab 24: 158-166. [Crossref]
35. Mills
EL, Kelly B, Logan A, Costa ASH, Varma M et
al. (2016) Succinate Dehydrogenase Supports Metabolic
Repurposing of Mitochondria to Drive Inflammatory Macrophages. Cell 167: 457-470. [Crossref]
36. Arshamian
A, Laska M, Gordon AR, Norberg M, Lahger C et al. (2017) A mammalian blood odor component serves as an
approach-avoidance cue across phylum border - from flies to humans. Sci Rep 7: 13635. [Crossref]
37. Buettner
A, Schieberle P (2001) Aroma properties of a homologous series of
2,3-epoxyalkanals and trans-4,5-epoxyalk-2-enals. J Agric Food Chem 49:
3881-3884. [Crossref]
38. Gervasi
SS, Opiekun M, Martin T, Beauchamp GK, Kimball BA (2018) Sharing an environment
with sick conspecifics alters odors of healthy animals. Sci Rep 8: 14255. [Crossref]
39. Sato
T, Kawasaki T, Mine S, Matsumura H (2016) Functional Role of the C-Terminal
Amphipathic Helix 8 of Olfactory Receptors and Other G Protein-Coupled
Receptors. Int J Mol Sci 17: 1930. [Crossref]
40. Rokni
D, Hemmelder V, Kapoor V, Murthy VN (2014) An olfactory cocktail party: figure-ground segregation of odorants in
rodents. Nat Neurosci 17: 1225-1232. [Crossref]
41. Sato
T, Kajiwara R, Takashima I, Iijima T (2016) A novel method for quantifying
similarities between oscillatory neural responses in wavelet time-frequency
power profiles. Brain Res 1636: 107-117. [Crossref]
42. Sato T, Matsukawa M, Mizutani Y, Iijima T, Matsumura H (2018) Initial, transient, and specific interaction between G protein-coupled receptor and target G protein in parallel signal processing: a case of olfactory discrimination of cancer-induced odors. Med Res Arch 6: 1801.
43. Sato T (2019) Conserved 2nd Residue of Helix 8 of GPCR May Confer the Subclass-Characteristic and Distinct Roles through a Rapid Initial Interaction with Specific G Proteins. Int J Mol Sci 20: 1752. [Crossref]