


The need to implement effective tobacco control programs is undeniable due to the significant and well-established health hazards of smoking.1 Tobacco use remains the leading preventable cause of morbidity and mortality from chronic diseases worldwide, resulting in over eight million deaths annually, and the rate of morbidity and mortality is rising globally due to an increase in smoking-related diseases.2,3 Therefore, the first and the most crucial strategy to confront this global pandemic is the comprehensive implementation of effective tobacco control policies and programs.4–7 To achieve this objective, the WHO negotiated the Framework Convention on Tobacco Control (FCTC) in 2003—representing the world’s first public health treaty. As of July 2021, 182 countries representing 90% of the global population have ratified the FCTC.7 The implementation of the FCTC is credited with preventing an estimated 49 million smoking-attributable deaths within the first ten years of its implementation.5,6 In 2008, a policy and program measures package based on critical articles of the FCTC was developed to help promote and guide FCTC implementation. This package includes six main components, namely: Monitor tobacco use and prevention policies, Protect people from tobacco smoke, Offer help to quit tobacco use, Warn people about the dangers of tobacco, Enforce bans on tobacco advertising, promotion and sponsorship, and Raise taxes on tobacco (MPOWER; to empower).8,9 Experience has revealed that implementing the six strategies mentioned above can reliably decrease the consumption and reduce the consequences and complications of tobacco use in middle- and high-income countries.10–13 Some studies have reported that an analysis of MPOWER implementation by countries may create a competitive challenge between countries to improve their status on tobacco control through international peer pressure.14–18
The objectives of this study are to use results from the 2008 to 2018 MPOWER scores to (i) Report national MPOWER scores to allow countries to benchmark, measure, monitor, compare and stimulate MPOWER implementation; and (ii) Identify independent factors that influence MPOWER implementation.
METHODS
Study design
The design of this study was based on previous observational analyses of bi-annual MPOWER reports.14–18 The data for all MPOWER reporting periods from 2008 to 2018 was retrieved from the WHO Global Health Observatory.19 The data for each country was represented using seven measurable variables, reflecting all MPOWER components, including two indicators for Warn (package warnings and mass media campaigns). All variables have a gradient range of 0-4 (5 gradients) except for Monitor, which has a range of 0-3 (4 gradients) for a maximum possible score of 34 (4 + (5×6) = 34). The scoring is based on previously published methodology.13
Variables and data sources
The primary data source was the WHO Global Health Observatory (GHO)20 which includes all the MPOWER national results collected between 2008 and 2018. The GHO also includes national datasets for (1) tobacco smoking prevalence,21 (2) government objectives on tobacco control,22 (3) national cigarette affordability,23 (4) the annual tobacco control budget of each country,24 (5) the existence of a government tobacco control agency,25 and (6) the number of tobacco control staff employed by national governments.25 All variables, except smoking prevalence, were used for the covariate analysis. Smoking prevalence and its relationship to MPOWER scores have been examined and reported by others.
The secondary data source was Our World in Data (OWID),26 an online repository of numerous health, social, political and economic indices and datasets. The OWID indices selected for this study included (1) literacy rates on a scale of 0 to 10027; (2) the political regime scale from a full democracy to full autocracy28; (3) the United Nations human development index which includes life expectancy, education, and gross national income with an aggregate score between 0 and 129; and (4) the World Bank’s four national income classifications including low income, low-middle, upper-middle, and high income.30
Per capita tobacco control budgets for each country were calculated by dividing a country’s annual budget for tobacco control in equivalent U.S. dollars by its total population size. The standard currency reported by the U.S. Department of Treasury was used for any country without its currency reported in the GHO database. The total population for all countries was obtained from the World Development Indicator Databank (WDI) of the World Bank. For all country currencies without a standard average equivalent of 1 USD in the U.S. Department of Treasury database, an average rate (March 31st, June 30th, September 30th, and December 31st) was calculated from historical currency tables.31
Statistical analysis
The results were organized by the six WHO regions and by the four World Bank national income classifications to allow for geopolitical and economic analysis. Missing or incomplete data in the WHO report received a score of zero in our analysis.
The association between MPOWER scores and potential covariates was analysed using chi-square for categorical variables and student t-test and repeated measure ANOVA for continuous variables to check between and within subjects’ differences. Paired tests were used for the difference in the mean between years, and predictive modelling was performed using traditional forecasting methods. Analysis was performed using the Statistical Package for the Social Sciences (SPSS) version 27.0 (IBM SPSS, Armonk, NY).
RESULTS
The WHO regional numerical breakdowns among the 195 countries represented in this study are Europe & Central Asia (51), Sub-Saharan Africa (48), Latin American & Caribbean (33), East Asia & Pacific (32), Middle East & North Africa (21), South Asia (8) and North America (2). The World Bank national income gradients among the 195 countries represented in this study are Low Income (29), Lower Middle Income (50), Upper Middle Income (56) and High Income (60).
MPOWER scoring in 2018
Twenty (20) countries achieved excellence in implementing MPOWER in 2018 by attaining at least 30 points out of a total of possible 34, including Brazil and Turkey (34 = perfect score); Australia, Ireland and New Zealand (33 points); Panama and United Kingdom (32 points); Costa Rica, Pakistan, Seychelles, and Thailand (31 points); Chile, Czechia, El Salvador, Georgia, Luxembourg, Norway, Republic of Moldova, Senegal and Spain (30 points). The total population of these 20 countries is about 800 million out of a total global population of 7.59 billion (10.5% of the world population). The 15 countries with the lowest levels of implementation include South Sudan (11 points); Monaco (12 points); Equatorial Guinea, Guinea-Bissau, Haiti, Malawi and Somalia (13 points); Central African Republic, Saint Kitts and Nevis, and Sierra Leone (14 points); Angola, Dominica, and Saint Vincent and the Grenadines (15 points); and Liberia and Sao Tome and Principe (16 points). Table 1 contains the 2018 scores for each country.
MPOWER rankings of all nations
The WHO regions reporting the highest levels of implementation in 2018 in mean country scores in order of ranking were (1) North America (27.0 points); (2) Europe & Central Asia (26.6 points); (3) East Asia & Pacific (25.4 points); South Asia (25.3 points); the Middle East & North Africa (24.3 points); Latin America & Caribbean (23.1 points) and Sub-Saharan Africa (20.1 points). The mean scores of countries according to national income levels are high-income (26.4 points), upper-middle-income (24.2 points), lower-middle-income (23.2 points), and low-income (19.3 points). MPOWER scoring changes by region appear in Figure 1, scoring changes by income level appear in Figure 2, and MPOWER rankings in 2018 appear in Figure 3.


The highest rates of implementation for the MPOWER variables in 2018 were (1) Warn (package) with a mean score of 3.86 out of a possible 5 points; (2) Enforce (advertising bans) with a mean score of 3.79 out of a possible 5 points; (3) Offer with a mean score of 3.70 out of a possible 5 points and (4) Raise with a mean score of 3.48 out of a possible 5 points. The lowest rates of implementation were (1) Warn (mass media) with a mean score of 2.84 out of a possible 5 points; (2) Protect with a mean score of 3.40 out of a possible 5 points; and (3) Monitor with a mean score of 2.81 out of a possible 4 points. These results can be found in Table 2.
Changes from 2008 to 2018
National implementation
Twenty-three (23) countries recorded a minimum MPOWER scoring increase of at least 10 points between 2008 and 2018 (i.e., most improved scores), including Timor-Lest (15); Senegal (14); Costa-Rica, Pakistan, Seychelles, and Cambodia (13); El Salvador, Republic of Moldova, and Honduras (12); Brazil, Georgia, Russian Federation, Turkmenistan, Suriname, Guyana, and Namibia (11); and Turkey, Luxembourg, Argentina, Saudi Arabia, Chad, Fiji, and Nepal (10). Six (6) countries recorded a decline in MPOWER scores between 2008 and 2018 (i.e., least improved scores), including Guatemala and Malawi (-2) and Belgium, Djibouti, Dominica and Eritrea (-1). Thirteen (13) countries recorded no change in scores between 2008 and 2018, including Belize, Central African Republic, Cuba, Equatorial Guinea, Guinea, Haiti, Marshall Islands, Mauritius, Monaco, Niger, Saint Kitts, Syrian Arab Republic, and Uruguay. These results can be found in Table 3.
The mean point change rankings of WHO regions between 2008 and 2018 are (1) South Asia (7.25 points = 40.3% increase); (2) East Asia and Pacific (6.06 points = 31.3% increase); (3) Europe and Central Asia (5.51 points = 26.2% increase); (4) North America (5.50 points = 25.5% increase); (5) Latin America and Caribbean (5.30 points = 29.8% increase); (6) Middle East and North Africa (4.19 points = 20.9% increase) and (7) Sub-Saharan Africa (3.92 points = 24.3% increase). The mean point change rankings according to income level are (1) lower-middle income (5.7 points = 32% increase); (2) upper-middle income (5.3 points = 28% increase); (3) high income (5.2 points = 24% increase and (4) low income (3.6 points = 23% increase).
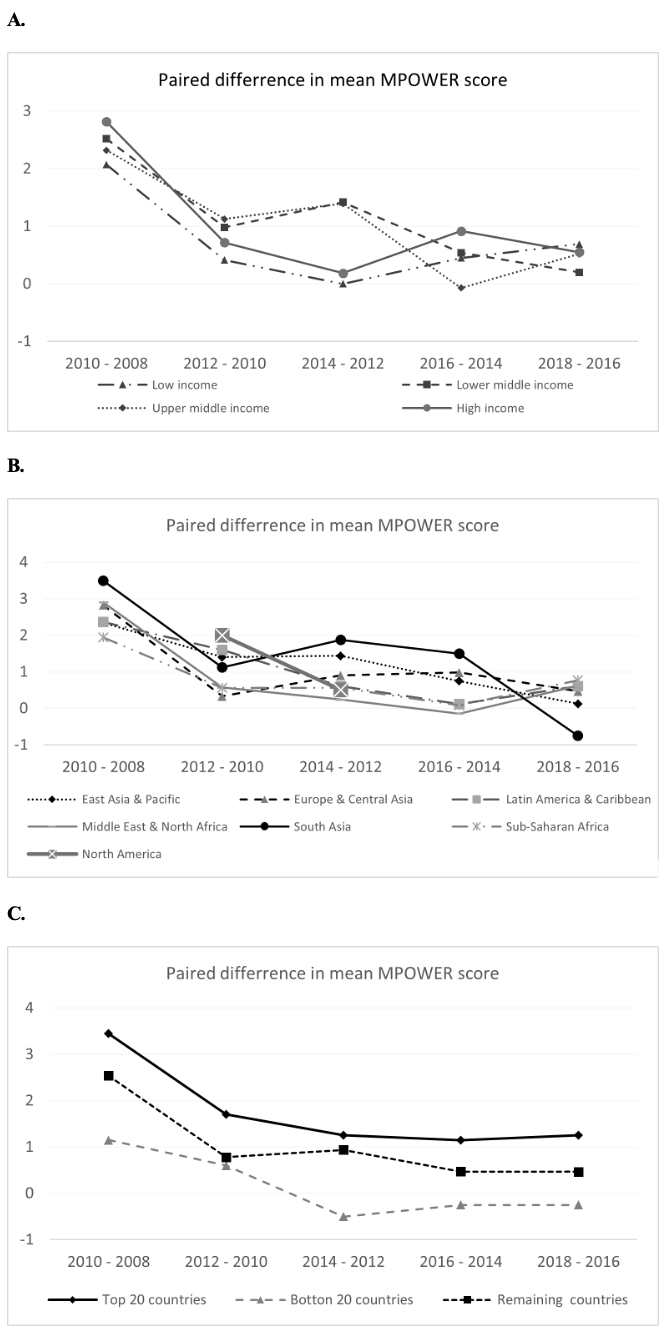
Repeated measure analysis showed that the estimated marginal means of MPOWER score has been increasing since 2008. This increase is observed across different levels of income and different WHO regions except for the bottom 20 countries in the 2018 MPOWER rankings. These low-performing countries reported declining scores after an initial increase between 2008 and 2012. However, paired test analysis revealed that the largest increase in MPOWER scoring occurred in the first reporting period following the introduction of the MPOWER measures in 2008. Figure 4 reveals a significant increase in MPOWER score in 2008-2010 (range, 3.5 in the Southeast Asia region to 1.15 in the bottom 20 countries). This increase declined sharply from 2010-2012 (ranging from 1.7 in the top 20 countries to 0.41 in low-income countries). The 2014-2016 and 2016-2018 reveal largely insignificant increases in MPOWER scoring (ranging from 1.25 in the top 20 countries to -0.75 in Southeast Asia) (Figures 4, panels A-C).

Figure 5 shows projected dates for achieving full MPOWER implementation score stratified by countries’ income levels. At the current implementation rate, high- and middle-income countries are projected to achieve full MPOWER implementation by 2040, led by high-income countries, which are forecast to reach the 34-point target by 2036. The projections also reveal that low-income countries are not expected to achieve full MPOWER implementation in the foreseeable future. While these trends are encouraging for most countries, they suggest that full MPOWER implementation is unlikely in many low-income countries.

Implementation of MPOWER elements
The highest degree of implementation of MPOWER elements between 2008 and 2018 was Warn (packaging), with a 1.17-point increase, reflecting a 10-year improvement of 43.7%. The second highest increase was Protect, with a 0.82-point rise, representing a relative change of 31.6%. The third greatest improvement was 0.66 points for Enforce (advertising ban), reflecting a relative rise of 20.9%. The fourth highest change was 0.34 points for Offer, representing a relative increase of 10.2%. The lowest degree of MPOWER implementation was Monitor, with a relative 10-year increase of 0.9%, reflecting a 0.03-point increase. The second lowest improvement was Warn (mass media), reflecting a 0.10-point rise, or a relative change of 3.8%. The third lowest change was Raise, with a 0.25-point increase, representing a relative improvement of 7.6%. These results can be found in Table 2.
Impact of covariates
Several influential covariates were identified through selective analysis of health, social, political and economic indicators in the WHO Global Health Observatory and the Our World in Data online dataset repository. This study examined these indicators between the 20 best performing MPOWER countries and the 20 worst performing nations (Table 4). Covariates that appear to positively influence MPOWER implementation include lower cigarette affordability (P=0.03; t=-2.30), the overall tax score (P<0.001; t=4.67) the presence of national tobacco control objectives (P=0.001, X2=22.7), the human development index score (P<0.001; t=5.1), the national corruption index score (P<0.001; t=3.96), the political regime index score (P<0.001; t=5.76), and the national literacy rate (P=0.003; t=3.18). Covariates that did not influence MPOWER implementation included a government tobacco control agency (P=0.12; X2=4.28) and the number of tobacco control staff employed by the government (P=0.78; t=1.85).
DISCUSSION
For the first time since MPOWER was launched in 2008, two countries achieved a perfect score of 34 in the 2018 MPOWER rankings: Brazil and Turkey. Notably, neither country is ranked as a high-income country, which should motivate middle-income countries and high-income countries to implement MPOWER fully. Of the 20 top performing countries in 2018, 10 were ranked as high-income, seven were rated as upper-middle income, 3 were lower-middle income, and none were low-income nations. Together, these countries represent 10.4% of the world population. This modest degree of high MPOWER implementation is concerning, considering the large number of countries (182) that have ratified the FCTC. Of the 20 countries with the lowest MPOWER scores in 2018, 9 were ranked as low-income, two were rated as low-middle income, 5 were high-middle income, and 4 were high-income countries.
Of the 23 countries that achieved a minimum 10-point increase between 2008 and 2018, 3 were high-income countries, 12 were upper-middle income countries, 7 were lower-middle income, and 1 was a low-income nation. Nineteen (19) middle-income countries were among the 23 most improved nations for MPOWER implementation between 2008 and 2018. All WHO regions realised 10-year improvements in MPOWER scores, with the greatest progress achieved by South Asia, East Asia & Pacific, and Europe & Central Asia (Figure 2). Although high-income countries had the highest MPOWER rankings in 2018, middle-income countries are the top performers in achieving the most improved 10-year scores. MPOWER scores improved among all income gradients. However, lower- and upper-middle-income nations achieved more relative progress than high- and low-income countries. Unfortunately, the gap in MPOWER implementation between low-income and non-low-income countries is growing wider over time, perhaps due to external influences on MPOWER scores, such as compromised human development, more oppressive government regimes, and higher rates of corruption. Given these challenges, more work is justified to assist low-income countries with MPOWER implementation.
Regarding the 10-year implementation of MPOWER elements, Warn (package) was by far the most well-implemented policy measure with a 15.3 point scoring increase reflecting a relative rise of 44%, followed by Protect (smoking ban) (9.7 points = 32% increase) with and Enforce (advertising ban) (9.1 points = 21% increase). The most disappointing results were Monitor with a 1% increase, Warn (mass media) with a 4% increase and Raise (taxes) with an 8% increase in implementation over ten years. Tobacco taxes are the single most effective means of reducing tobacco use. This vital tobacco control measure’s relatively low implementation rate is disturbing and warrants further attention.
Covariates
The relationship between MPOWER and selected covariates was somewhat inconsistent and counter-intuitive. For example, tobacco control objectives and cigarette affordability are positively associated with MPOWER implementation, but the existence of a government tobacco control agency and government funding for tobacco control is not correlated. Similarly, socio-economic indicators such as the human development index, the national corruption index and the political regime index are positively associated with MPOWER implementation. High- and middle-income countries report higher rates of MPOWER implementation, and low-income countries report lower implementation rates. Further analysis of country demographics and social, political, and economic indicators and their relationship to MPOWER implementation is warranted.
Limitations
The MPOWER implementation results were self-reported to the WHO by participating nations and were validated by WHO regional offices in consultation with tobacco control experts in each country.8,9 The scope of this study did not allow for any additional auditing or scrutiny of the national self-reports. Secondly, the MPOWER numerical scoring tables were obtained from the WHO Global Health Observatory. The numerical data does not appear in the MPOWER biannual reports, and there is potential for inconsistencies. Thirdly, MPOWER does not address all the possible influences on tobacco control and smoking behaviour, such as tobacco industry interference, which has been identified as the largest barrier to implementing FCTC globally.32 Article 5.3 of the FCTC addresses tobacco industry interference, and another independent global index measures national adherence to this critical indicator.33 In addition, MPOWER does not address any supply-side tobacco control measures nor the four established elements of the tobacco marketing mix, specifically place (point of sale) and product (design and production).34 Finally, the authors selected the covariates subjectively based on their perceived potential impact on MPOWER scores.
CONCLUSIONS
Twenty-three (23) countries achieved MPOWER scoring improvements of at least 10 points out of a possible 34 between 2008 and 2018. Twenty countries achieved the highest MPOWER rankings in 2019, providing the best models for other countries to follow. Based on this study’s projections, high- and middle-income countries will achieve full MPOWER implementation by 2040 at current adoption rates. Although MPOWER rates are increasing among low-income countries, the projected date of full implementation is uncertain. The approval of a new global strategy to accelerate FCTC implementation at the 8th Conference of the Parties held in Geneva in 2018 holds promise for further progress, especially if it is adequately resourced.35
The relative ranking of nations’ implementation of WHO MPOWER tobacco control measures provides a global performance index to benchmark, monitor, measure, compare and stimulate MPOWER implementation and to promote tobacco use reduction among all countries.
Although this analysis is not exhaustive, it helps to identify common characteristics of countries that have achieved high levels of MPOWER implementation. The analysis also sheds light on independent covariates that influence MPOWER implementation. We encourage others to conduct further analyses. The increasing availability of public domain datasets provides further opportunities to enhance the understanding of MPOWER and tobacco control implementation.
Funding
None.
Authorship contributions
L.H. conceived the study and wrote the draft manuscript based on previous publications by G.H. G.H. assisted with study design and writing. F.H. performed data analysis and assisted with study design and writing.
Competing interests
The authors have completed the Unified Competing Interest form at www.icmje.org/coi_disclosure.pdf (available upon request from the corresponding author) and declare no conflicts of interest.
Correspondence to:
Les Hagen, ASH Canada, PO Box 52117 RPO Garneau, Edmonton, Alberta, Canada T6G 2T5.