
More Information
Submitted: 07 April 2020 | Approved: 21 April 2020 | Published: 22 April 2020
How to cite this article: Jacobs M. Neuroticism and BMI: The role of genetic tendency, behavior and environment on body weight. New Insights Obes Gene Beyond. 2020; 4: 004-012.
DOI: 10.29328/journal.niogb.1001012
ORCiD: orcid.org/0000-0001-5943-8507
Copyright License: © 2020 Jacobs M. This is an open access article distributed under the Creative Commons Attribution License, which permits unrestricted use, distribution, and reproduction in any medium, provided the original work is properly cited.
Keywords: BMI; Personality; Genetic risk; Health

Neuroticism and BMI: The role of genetic tendency, behavior and environment on body weight
Molly Jacobs*
Health Sciences BLDG, Greenville, NC 27858, USA
*Address for Correspondence: Molly Jacobs, 600 Moye Blvd, Mail Stop 668, 4340E Health Sciences BLDG, Greenville, NC 27858, USA, Tel: 252-744-6182; Email: jacobsm17@ecu.edu
Introduction: Recent research has explored the role that personality traits play in health and weight determination. This study extends current research by evaluating the extent to which behavior mediates the impact of neuroticism and body weight using polygenic risk as a measure of neurotic tendency.
Methods: Structural equation modelling disaggregates the effect of neurotic tendency on BMI into direct and indirect effects. Indirect effects-those transmitted through mediating health behaviors—allow for the simultaneous comparison of multiple behavioral mediators— exercise frequency, smoking intensity, sleep sufficiency and screen time.
Results: While health-related behavior-screen time, sleep, smoking and exercise-directly influence BMI, neurotic tendency showed no direct effect. The strong association between neurotic tendency and behavior, however, indicated that polygenic risk of neuroticism indirectly influenced BMI through two health related behaviors-screen time and smoking. Therefore, the relationship between neurotic disposition and BMI is transmitted through behavioral pathways rather than directly.
Conclusion: This research offers novel insight into the relationship between personality and health outcomes. If behavior manifests through personality disposition, then understanding the relationship between personality, behavior and BMI will help guide weight management interventions to focus on strategies to help manage responses to stress to elicit desired weight outcomes.
Public health and medical researchers have dedicated ample resources to discovering the critical determinants of body weight. Studies have documented a variety of social, demographic, and genetic factors associated with body weight, but they may not explain all the observed heterogeneity. Recently, personality traits that describe individual disposition and behavior have received attention for the role they play in individual health and weight [1]. Increasing evidence suggests that personality traits substantially contribute to health and health behavior [2].
However, the relationship between personality traits and body weight is confounded by family fixed effects, individual behavior, and genetic backgrounds [3]. Among the “big five” personality traits, conscientiousness and neuroticism have shown the strongest association with body weight and garnered the most attention among social scientist [4-7]. However, studies have shown that neuroticism is associated with low BMI [8], high rates of obesity [9,10] and it has no relationship with body weight [11].
This study builds upon previous research by examining the association between neuroticism and weight using an objective measure of neurotic tendency-polygenic risk score (PGS)—calculated from individual genetic data. A structural equation framework evaluates the relationship controlling for genetic, family and individual effects. Mediation analysis test whether the neuroticism/weight relationship is mediated by behavior disaggregating the total effect into a direct effect of PGS on body mass index (BMI) and an indirect effect-as transmitted through exercise, smoking, screen time and sleep-accounting for the extent to which behavioral factors mediate this association. Results show that association between BMI and neuroticism is mediated by smoking and exercise frequency and may be modified by the context in which individuals live. In addition, the study examines whether the associations vary by ancestral background.
Neuroticism is defined as a long-term tendency to be in a negative or anxious emotional state. It is not a medical condition but a personality trait. People with neuroticism tend to have more depressed moods and suffer from feelings of guilt, envy, anger, and anxiety more frequently and more severely than other individuals [13]. Previous studies have shown evidence of robust associations between elevated scores of neuroticisms and obesity [4,5,13], suggesting a positive association between neuroticism and BMI. Neuroticism has been associated with both extremes of the BMI distribution—obese and underweight—and increased risk of unhealthy BMI [13-15]. In general, correlations were stronger for women and older individuals, and certain minority groups [16].
Much of the personality associations is likely due to the behavioral tendencies associated with these traits. Studies have reported that conscientious individuals high on are more physically active [17], less likely to overeat [18] and more like to report disordered eating [19]. Behavioral factors have been reported to account for as much as 50% of the association between personality and BMI [13]. Therefore, behaviors should be in investigations of personality and BMI as they could likely mediate any observed associations.
Neuroticism, depression, and well-being are, to some extent, heritable [20-23], similar to biological and personal characteristics [24,25]. Research has found robust associations between neuroticism and cardiovascular disease, type 2 diabetes, BMI, weight gain and a variety of psychiatric symptoms [14,15,26,27]. However, it is unclear how these personality traits relate to health outcomes. Some hypothesize that behavioral differences, such as alcohol and tobacco use, sex or exercise, could account for the effect of personality on physical health [28-31]. Neurotic individuals could be more focused on weight leading to higher levels of exercise and more controlled dietary habits [18,32-35].
Demographic characteristics such as gender, age and race/ethnicity, rather than behavior, could moderate the association between personality and BMI [9,13,36-38], as different cohorts have shown different levels of association between personality traits and physical outcomes [8,37-41].
The present study examines the relationship between genetic risk of neuroticism and BMI evaluating the extent to which behavior and demographic factors mediate the observed impact. Extending beyond previous analyses which used surveys, questionnaires or self-assessments of personality as indicators of personality, this analysis uses polygenic risk score (PGR) as a measure of neurotic tendency [42]. PGS provides a measure of the cumulative additive genetic influences on neuroticism which is standard across individuals [43,44]. It is important to note that PGS measures risk of neuroticism, rather than current individual level of neurotic tendency. Many of the current studies are based on cross-sectional data, this paper uses a longitudinal panel capturing health status and behavior at various points in time. While the concept of linking personality traits and health outcomes is not unique, examining the association between genetic tendencies toward a personality traits and BMI while assessing the degree to behavior mediates the observed effect is novel to this work.
Data
Analysis utilizes the first three waves of data from the National Longitudinal Study of Adolescent to Adult Health (Add Health)—a longitudinal study of adolescents in grades 7-12 during the 1994-95 school year followed into young adulthood with in-home interviews. Waves I, II, and III were conducted in September 1994-December 1995, April 1996-August 1997 and August 2001-April 2002, respectively and contain consistent elements allowing longitudinal assessment of environmental, behavioral, and demographic controls. Mean values for all covariates are provided in table 1.
| Table 1: | ||||||||||
| Demographic Characteristics Means and Frequency by Ancestral Group | ||||||||||
| European Ancestry | African Ancestry | Asian Ancestry | Hispanic Ancestry | |||||||
| N = | 22516 | N = | 7644 | N = | 1732 | N = | 3816 | |||
| Variable | Min | Max | Mean | Std. Error | Mean | Std. Error | Mean | Std. Error | Mean | Std. Error |
| Female | 0 | 1 | 0.4717 | 0.0090 | 0.4427 | 0.0117 | 0.5543 | 0.0200 | 0.5147 | 0.0164 |
| General Health | 1 | 5 | 2.1433 | 0.0153 | 2.1674 | 0.0232 | 2.2304 | 0.0825 | 2.2275 | 0.0276 |
| Screen Time | 0 | 100 | 13.1440 | 0.2229 | 17.6101 | 0.3813 | 13.9693 | 0.6911 | 14.2642 | 0.3610 |
| Smoking | 0 | 30 | 13.5150 | 0.3312 | 7.6801 | 0.3941 | 9.3829 | 0.7075 | 9.2120 | 0.7858 |
| BMI | 2 | 91 | 24.9322 | 0.1118 | 26.3859 | 0.1705 | 24.5398 | 0.7420 | 25.8943 | 0.2692 |
| Exercise | 0 | 3 | 1.2048 | 0.0107 | 1.1919 | 0.0140 | 1.2083 | 0.0163 | 1.2139 | 0.0175 |
| Body Perception | 1 | 5 | 3.3519 | 0.0110 | 3.3054 | 0.0158 | 3.2776 | 0.0812 | 3.4268 | 0.0266 |
| Sufficient Sleep | 0 | 1 | 0.7359 | 0.0050 | 0.6921 | 0.0071 | 0.6609 | 0.0204 | 0.7113 | 0.0106 |
| Age | 12 | 34 | 21.2080 | 0.1276 | 21.2841 | 0.1956 | 21.7825 | 0.4572 | 21.5934 | 0.2426 |
| School | 0 | 1 | 0.5966 | 0.0065 | 0.6077 | 0.0087 | 0.6318 | 0.0171 | 0.5942 | 0.0078 |
| Highest Grade | 1 | 22 | 9.4456 | 0.0732 | 9.2024 | 0.1394 | 10.1895 | 0.1308 | 9.3846 | 0.1384 |
| PC1- Parent Relationship to Adolescent | -0.779 | 0.170 | 0.0000 | 0.0002 | 0.0000 | 0.0005 | 0.0000 | 0.0034 | -0.0001 | 0.0016 |
| PC2 Bio Mother in HH | -0.613 | 0.161 | 0.0000 | 0.0002 | 0.0000 | 0.0006 | 0.0001 | 0.0094 | 0.0001 | 0.0015 |
| PC3- Ever Lived with Bio Mother | -0.085 | 0.017 | -0.0001 | 0.0005 | -0.0001 | 0.0017 | 0.0001 | 0.0077 | -0.0001 | 0.0045 |
| PC4- Most Recent YR Lived with Bio Mother | -0.450 | 0.444 | 0.0000 | 0.0002 | 0.0000 | 0.0006 | 0.0000 | 0.0028 | 0.0000 | 0.0018 |
| PC5- Monthly Support from Bio Mother | -0.070 | 0.186 | 0.0000 | 0.0005 | 0.0001 | 0.0005 | 0.0001 | 0.0094 | -0.0004 | 0.0030 |
| PC6- Bio Father in HH | -0.371 | 0.480 | 0.0000 | 0.0002 | 0.0002 | 0.0005 | 0.0000 | 0.0020 | 0.0001 | 0.0013 |
| PC7- Ever Lived with Bio Father | -0.296 | 0.563 | 0.0001 | 0.0002 | -0.0001 | 0.0006 | -0.0001 | 0.0010 | 0.0001 | 0.0011 |
| PC8- Most Recent Year Live with Bio Father | -0.328 | 0.218 | 0.0000 | 0.0003 | 0.0001 | 0.0010 | 0.0000 | 0.0030 | 0.0000 | 0.0010 |
| PC9- Monthly Support from Bio Father | -0.510 | 0.462 | 0.0000 | 0.0002 | 0.0002 | 0.0005 | 0.0000 | 0.0029 | -0.0002 | 0.0007 |
| PC10- Best Friend in School | -0.516 | 0.246 | 0.0000 | 0.0002 | 0.0001 | 0.0006 | 0.0000 | 0.0022 | -0.0002 | 0.0016 |
| Estimates are weighted using longitudinal sampling weights. Data is clustered by school sampling unit and stratified by region. | ||||||||||
Genetic covariates
Identifying the biological pathways and genes associated with neuroticism has the potential to facilitate understanding of the physiological components [45]. As with other complex disorders, neuroticism appears to be a multifactorial, polygenic trait, influenced by multiple environmental factors and genetic loci whose individual effects are small [46]. Since individual effects are small, one way to identify causal variants is to consider the cumulative associations of multiple single nucleotide polymorphisms (SNPs) simultaneously [47].
One way to examine the aggregate influence of multiple genetic markers is by generating a polygenic risk score (PGS) based on results from a genome-wide association studies (GWAS). A PGS can be thought of as a measure of ‘genetic burden’ associated with a phenotype [48]. PGSs are generated by running a GWAS on a discovery sample, selecting SNPs on the basis of their association with the phenotype, and creating a sum of their phenotype-associated alleles (often weighted by the SNP-specific coefficients from the GWAS), that can be evaluated in a separate replication sample [44,49,50]. PGS serves as the best prediction for the trait that can be made when considering variation in multiple genetic variants. A PGS explains at least a few percent of a phenotype’s variance and can therefore be assumed to effectively incorporate a significant fraction of the genetic variants affecting the phenotype. PGS represent a weighted sum of the associations between allele frequencies and the associated phenotype resulting in a free measure of the cumulative additive genetic influences on the phenotype being studied. This allows researchers to capture the broad influence of genetics in various analyses [44,50].
Approximately 80% of Add Health respondents provided saliva samples enabling calculation of genotyped data for four genetic ancestry groups of Add Health respondents-European ancestry, African ancestry, Hispanic ancestry, and East Asian ancestry. Since results comparing PGSs for individuals of different ancestry groups may be less predictive and PGSs are standardized within ancestry groups to account for between-group population stratification, ancestral groups are analyzed separately [51,52].
To further control for within-group population stratification, principal components (PCs) of the genome-wide data are included in analyses [53,54]. In a structural equation framework, estimation would not allow for the inclusion of all PCs due to problems of multicollinearity. Therefore, this study calculated a weighted linear combination of the PCs where each item’s weight is its factor loading representing its contribution. This index measure accounts for the within group variation and stratification of genetic structure using a single, weight component.
Other covariates
Age, gender, school enrollment, residence in the south and general health perception were included as demographic conditions given their association with BMI and behavior. Age was measured continuously while school enrollment, southern residence and gender were modeled dichotomously. General health captures respondents’ categorical classifications of overall health: 1-excellent, 2-very good, 3-good, 4-fair and 5-poor.
Dependent variable
Self-reported weight and height are used to construct measurement-error adjusted BMI (weight in kilograms divided by height in meters squared) for individuals by wave. For ease of statistical inference, the logarithm of BMI is used as the dependent variable.
Potential mediators
Exercise frequency, smoking intensity, sleep sufficiency and screen time were tested as potential behavioral mediators. Exercise, ranging from zero to 20, captures how many times in the past week respondents exercised or went to a fitness center to workout. Cigarette smoking includes the number of days in the last month that respondents smoked cigarettes and ranges from zero to 30. Screen time includes the number of hours, from zero to 160, the respondent watched television or video, played video games or viewed electronic devices in the past week. Sleep sufficiency is given a value of one is the respondents reports getting enough sleep at night and zero otherwise.
Mediation analyses
This uses mediation analysis to explore the underlying mechanism by which neuroticism affects BMI. Mediation analysis, as popularized in psychology and the social sciences by Judd and Kenny and Baron and Kenny [55,56], enables the decomposition of total causal effects into an indirect effect and direct effect. Mediation refers to the transmission of the effect of an independent variable on a dependent variable through one or more other variables-referred to as mediators. Mediation analysis allows the total effect of PGS on BMI to be decomposed into an indirect and direct effect. The direct effect measures the extent to which the BMI changes when the PGS increases by one unit and the mediator variables (behaviors) remain unaltered. In figure 1, the direct is represented by c or c’ when the mediators are included. The indirect effect measures the change in the in BMI when PGS is fixed and the mediator variables change. In figure I, the indirect effect is represented by ab. The total effect is equal to the sum of the direct and indirect effects (c’ + ab).
Analyses uses structural equation modeling (SEM). SEM can capture complex, dynamic relationships by incorporating the path model presented in figure I through a system of linked regression-style equations [57-59]. This application of SEM allows the indirect effect of multiple mediators to be separated and their relative mediation effects compared [59]. The model is estimated using the R package lavaan, which is available from the Comprehensive R Archive Network (CRAN) at https://cran.r-project.org/web/packages/lavaan/index.html. Regression analysis uses log of BMI is the dependent variable and includes controls for gender, age, school enrollment, residence in the south and principle component effects. Pathway estimation uses the bootstraps method to measure uncertainty in estimating the mediation effects. A vector of weights is used since the observations in the Add Health are not treated equally in the analysis. The weights account for longitudinal sampling variation in sampling and response patterns.
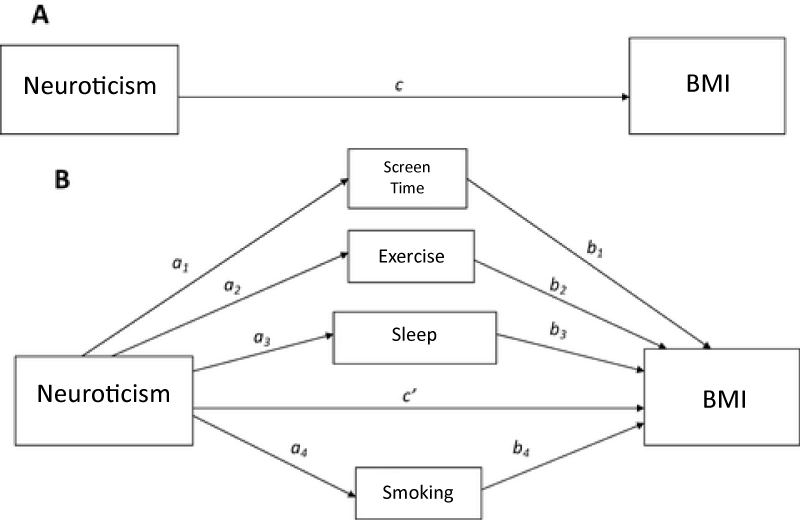
Figure 1:
Descriptive
Table I presents participant characteristics. The sample includes 4,501 individuals. Nearly half, 47%, are female and 37% reside in the south. Age ranges from 12–24 years. Average BMI was 24-considered normal weight. PGS varies between -14 and 34, with an average of eight. However, PGS cannot be interpreted in absolute terms. It can only explain relative risk for neuroticism. The data used for generating a polygenic risk score comes from a large-scale genomic study that finds genomic variants by comparing groups with a certain disease to a group without the disease. A polygenic risk score indicates how a person’s risk compares to others with a different genetic constitution. However, polygenic scores do not provide a baseline or timeframe for the progression of a disease. Polygenic risk scores only show correlations, not causations. Respondents had an average of 14 hours of screen time each day, exercised 3 times each week and smoked 14 out of the last 30 days.
Mediation models
Mediation model results table 2 showed estimates of all relationships outlined in figure 1. The columns denote values of corresponding a, b and c estimates. Control variables assume the expect sign and significance. Females have lower BMI than males and age is positively correlated with weight. As baseline BMI increases, so does BMI in the observed wave. Those enrolled in school have lower comparative BMI due to higher education and healthy lifestyle effects. The mediation model framework allows for behaviors to have both direct effects (b) and indirect effects (a) transmitted through PGS on BMI. Estimates show no significant direct BMI effect from getting enough sleep. However, exercise, smoking and screen time direct effect BMI. Higher amounts of exercise and smoking have a negative direct effect, while higher amounts of screen time have a positive direct impact.
| Table 2: | |||||
| SEM Mediation Model Estimates | |||||
| Dependent | Independent | Estimate | Std Error | Z Stat | |
| BMI | Exercise (b1) | -0.009* | 0.001086 | -8.0228 | |
| BMI | Sleep (b2) | -0.001 | 0.002563 | -0.5456 | |
| BMI | Smoking (b3) | -0.008* | 0.001482 | -5.28033 | |
| BMI | TV (b4) | 0.007* | 0.001259 | 5.601243 | |
| BMI | SPGSNEUG (c) | 0.014 | 0.024707 | 0.549415 | |
| BMI | Baseline | 0.885* | 0.010191 | 86.8162 | |
| BMI | South | 0.002 | 0.006013 | 0.375328 | |
| BMI | BIO_SEX | -0.007* | 0.003399 | -2.05013 | |
| BMI | School | -0.046* | 0.005635 | -8.09106 | |
| BMI | Age | 0.011* | 0.000384 | 27.891 | |
| BMI | 0.121* | 0.036835 | 3.286515 | ||
| Exercise | SPGSNEUG (a1) | -0.088 | 0.155892 | -0.56299 | |
| Sleep | SPGSNEUG (a2) | 0.139* | 0.061237 | 2.263638 | |
| Smoking | SPGSNEUG (a3) | -0.437* | 0.156426 | -2.79189 | |
| TV | SPGSNEUG (a4) | -0.485* | 0.135283 | -3.58229 | |
| Exercise Indirect Effect | a1*b1 | 0.001 | 0.001375 | 0.555872 | |
| Sleep Indirect Effect | a2*b2 | 0.000 | 0.000358 | -0.54193 | |
| Smoking Indirect Effect | a3*b3 | 0.004* | 0.001378 | 2.480624 | |
| TV Indirect Effect | a4*b4 | -0.003* | 0.001168 | -2.92472 | |
| Total Indirect Effect | (a1*b1)+(a2*b2)+(a3*b3)+(a4*b4) | 0.001 | 0.002364 | 0.241831 | |
| Total Effect | c+(a1*b1)+(a2*b2)+(a3*b3)+(a4*b4) | 0.015 | 0.024629 | 0.57438 | |
| Dependent Variable: logBMI *= Statically Significant at 95% Level Estimates are weighted using longitudinal sampling weights. Data is clustered by school sampling unit and stratified by region. |
|||||
While genetic neurotic tendency has no direct effect on BMI (c in figure 1), it is significantly correlated with sleep, smoking and screen time. Neurotic tendency Is positively associated with receiving enough sleep and negatively associated with high amount of screen time and smoking. These results are not surprising given the significant relationships between neuroticism and sleep, sleep problems and sleep duration [60]. Neurotic individuals have also been shown to be more vulnerable to compulsive behaviors-like smoking and screen time-and more susceptible to addiction [61-63].
These correlations explain the estimated indirect effect (a*b). The indirect effect refers to the transmission of the PGS effect on BMI through sleep, screen time, exercise and smoking—the mediators. The magnitude of the indirect effect indicates the amount of mediation. Indirect effects are relatively small in magnitude (-0.00019 to 0.004). Exercise (0.001) and smoking have a positive indirect effect (0.004) while screen time (-0.003) and sleep (-0.00019) had a negative indirect effect. These indirect effects represent the impact that PGS has on BMI through its influence on behavior. For example, the positive correlation between neurotic tendency and smoking frequency results in a positive indirect effect on BMI.
The total indirect effect (0.001) is the sum of all indirect behavioral effects. Adding the total indirect effect to the direct effect results in the total effect of genetic tendency for neuroticism on BMI (0.015). The net positive influence is consistent with other studies which showed an elevated level of neuroticism among obese individuals. Obese and underweight individuals report more psychiatric symptoms than normal-weight individuals [14] suggesting a positive association between neuroticism and BMI [4,5,13]. To ensure that results were robust to gender differences, SEM models were re-estimated separately for males and females (Table 3). Results show no variation from the pooled model. Therefore, results are assumed to be robust to gender.
| Table 3: | ||||
| Male: SEM Mediation Model Estimates | ||||
| Dependent | Independent | Estimate | Std Error | Z Stat |
| BMI | Exercise (b1) | -0.00864* | 0.00164 | -5.26883 |
| BMI | Sleep (b2) | -0.00372 | 0.003746 | -0.99252 |
| BMI | Smoking (b3) | -0.00503* | 0.002395 | -2.10098 |
| BMI | TV (b4) | 0.009805* | 0.002026 | 4.839968 |
| BMI | SPGSNEUG (c) | 0.030994 | 0.034029 | 0.910831 |
| BMI | Baseline | 0.936672* | 0.011876 | 78.87257 |
| BMI | South | 0.0109 | 0.006783 | 1.60696 |
| BMI | School | -0.04381* | 0.007796 | -5.61989 |
| BMI | Age | 0.010986* | 0.000583 | 18.83627 |
| BMI | 0.143109* | 0.041839 | 3.420449 | |
| Exercise | SPGSNEUG (a1) | -0.18448 | 0.172553 | -1.06911 |
| Sleep | SPGSNEUG (a2) | 0.133954 | 0.09742 | 1.37502 |
| Smoking | SPGSNEUG (a3) | -0.31085 | 0.246366 | -1.26174 |
| TV | SPGSNEUG (a4) | -0.65168* | 0.264452 | -2.46428 |
| Exercise Indirect Effect | a1*b1 | 0.001594 | 0.001509 | 1.056207 |
| Sleep Indirect Effect | a2*b2 | -0.0005 | 0.000638 | -0.78106 |
| Smoking Indirect Effect | a3*b3 | 0.001564 | 0.001376 | 1.136914 |
| TV Indirect Effect | a4*b4 | -0.00639* | 0.002759 | -2.31596 |
| Total Indirect Effect | (a1*b1)+(a2*b2)+(a3*b3)+(a4*b4) | -0.00373 | 0.003736 | -0.9984 |
| Total Effect | c+(a1*b1)+(a2*b2)+(a3*b3)+(a4*b4) | 0.027265 | 0.034962 | 0.779841 |
| Female: SEM Mediation Model Estimates | ||||
| Dependent | Independent | Estimate | Std Error | Z Stat |
| BMI | Exercise (b1) | -0.00851* | 0.0016 | -5.3198 |
| BMI | Sleep (b2) | 0.001331 | 0.003566 | 0.373119 |
| BMI | Smoking (b3) | -0.01135* | 0.002042 | -5.56117 |
| BMI | TV (b4) | 0.003801* | 0.00153 | 2.484358 |
| BMI | SPGSNEUG (c) | -0.0025 | 0.035443 | -0.07054 |
| BMI | Baseline | 0.825804* | 0.012917 | 63.93144 |
| BMI | South | -0.00512 | 0.006646 | -0.77106 |
| BMI | School | -0.04728* | 0.006643 | -7.11689 |
| BMI | Age | 0.010513* | 0.0005 | 21.0251 |
| BMI | 0.020182 | 0.071144 | 0.283676 | |
| Exercise | SPGSNEUG (a1) | 0.000338 | 0.244887 | 0.001381 |
| Sleep | SPGSNEUG (a2) | 0.156097* | 0.080042 | 1.950183 |
| Smoking | SPGSNEUG (a3) | -0.54336* | 0.20062 | -2.70838 |
| TV | SPGSNEUG (a4) | -0.2956 | 0.207046 | -1.4277 |
| Exercise Indirect Effect | a1*b1 | -2.9E-06 | 0.002085 | -0.00138 |
| Sleep Indirect Effect | a2*b2 | 0.000208 | 0.000574 | 0.361624 |
| Smoking Indirect Effect | a3*b3 | 0.006169* | 0.002783 | 2.216862 |
| TV Indirect Effect | a4*b4 | -0.00112 | 0.000892 | -1.26016 |
| Total Indirect Effect | (a1*b1)+(a2*b2)+(a3*b3)+(a4*b4) | 0.00525 | 0.003625 | 1.448144 |
| Total Effect | c+(a1*b1)+(a2*b2)+(a3*b3)+(a4*b4) | 0.00275 | 0.034344 | 0.080068 |
| Dependent Variable: log BMI | ||||
| *= Statically Significant at 95% Level | ||||
| Estimates are weighted using longitudinal sampling weights. Data is clustered by school sampling unit and stratified by region. | ||||
However, estimates of the total indirect effect, direct effect and the total effects are insignificant at the 95% level. Were statistically significant. Given that studies have shown strong relationships between neuroticism and body weight, these results are surprisingly. Three logical explanations explain lack of significance. First, this study used polygenic risk as a measure of neurotic tendency, while other analyses have employed binary or discrete ratings of neurotic tendencies. While undoubtedly related, these dependent variables assess different individual traits leading to different causal pathways. Second, genetic risk of neuroticism, as measured by additive genetic risk of the phenotype, could exert a primary diiect effect on health-related behavior. Rather than influencing body weight through direct and indirect pathways, the BMI effect could transmit exclusively through behavior. Finally, PGS of neuroticism could exert indirect effects through behavioral pathways not considered in this study. This association could manifest through health-related behaviors such as diet, alcohol consumption and drug use [15]. Future research exploring this topic should include additional behavioral mediators to explore alternative hypotheses of behavioral effects.
Despite the observed complexities of the SEM framework and estimated network of causal pathways, these results have important clinical implications for both those diagnosed with personality disorders but also for those with genetic pre-disposition to these disorders. Emotional eating, for example, could be indicative of neurotic individuals while also contributing to increase BMI. Emotional eating could be a protective response to naturally occurring stressors. If emotional eating manifests from genetic neurotic tendency, then understanding the relationship between PGS, health behavior and BMI will inform strategies designed to assist weight. Individuals with neurotic tendencies should be mindful of how their innate behavioral responses impact body weight and other health outcomes [64]. Weight management interventions should address new strategies to help them manage their responses to stress and negative stimuli to elicit desired weight outcomes.
This paper explored the role of genetic disposition to neuroticism in BMI determination through an explanatory mechanism of health-related behavior. Guided by previous literature, this paper tested a theoretical model suggesting that neuroticism was indirectly associated with BMI through smoking intensity, exercise frequency, sleep and screen time (Figure 1). The model was tested using a sample of individuals age 12 to 34. Using polygenic risk of neuroticism as an indicator of heritable neurotic tendency, analysis employed the SEM framework to estimate a mediation model of potential behavioral mediators.
While previous studies showed correlations between neuroticism and weight outcomes, this paper, accounting for explicit behavioral pathways, showed no significant direct effect of PGS on BMI. Exercise, smoking and screen time did, however, show significant direct BMI effects. The direct behavioral effects combined with the significant association between PGS and sleep, smoking and screen time resulted in two robust indirect BMI associations-smoking and screen time. Therefore, the relationship between PGS and BMI was transmitted through behavioral pathways thus attenuating the direct effect. The BMI/PGS relationship is mediated by health-related behaviors suggesting that the increased risk of neurotic tendency effects BMI through the characteristic behaviors of these individuals.
However, our study is not without limitations. First, distinct genetic lineage among ancestral groups require separate analyses when genetic information is included. However, sample size restrictions precluded analysis of Africa, Asian and Hispanic ancestry groups. While robust, the model of European ancestral group cannot be generalized to other racial and ethnic groups that might present different pathways between neuroticism and BMI. Second, while analysis controlled for age, it did not control for all age-related factors, such as more adaptive coping strategies, maturation and life changes and development of complex interpersonal relationships and social networks [65]. Third, BMI used self-reported height and weight which can lead to an underestimation and overestimation of weight and height, respectively [66]. Despite these shortcomings, studies find that BMI is an excellent approximation of actual body weight across populations [67,68]. Fourth, it is possible that health related behaviors other than those included in this study serve as prevalent mediators. Fast food consumption, hydration levels and meal habits could have stronger associations’ neuroticism and BMI.
Despite these limitations, this research offers novel insight into the relationship between personality and health. Polygenic risk score—an object measure of neurotic tendency across all individuals—provided an alternative to survey-based measures of neuroticism. These findings represent an important step in reducing the reliance on survey-based personality assessments in mediation studies of health outcomes. The results of the present study suggest that personality is significantly associated with BMI indirectly via smoking and screen time. Generally, these associations with behavioral mediators were relatively weak, and the only behaviors that were significantly related to BMI were smoking and screen time after adjusting for gender, age and region. Future studies should consider the utilizing the polygenic scores to assess personality traits and include additional behaviors to test for indirect effects.
- Mortensen EL, Flensborg-Madsen T, Molbo D, Christensen U, Osler M, et al. Personality in late midlife: associations with demographic factors and cognitive ability. J Aging Health 2014; 26: 21–36. PubMed: https://www.ncbi.nlm.nih.gov/pubmed/24584258
- McCrae RR, Costa PT. Personality in adulthood: A five-factor theory perspective (2nd ed.). New York, NY: Guilford Press. 2003.
- Kim J. Personality traits and body weight: Evidence using sibling comparisons. Soc Sci Med. 2016; 163: 54-62. PubMed: https://www.ncbi.nlm.nih.gov/pubmed/27394194
- Gerlach G, Herpertz S, Loeber S. Personality traits and obesity: a systematic review. Obes Rev. 2015; 16: 32–63. PubMed: https://www.ncbi.nlm.nih.gov/pubmed/25470329
- Sutin AR, Ferrucci L, Zonderman AB, Terracciano A. Personality and obesity across the adult life span. J Pers Soc Psychol. 2011; 101: 579–592. PubMed: https://www.ncbi.nlm.nih.gov/pubmed/21744974
- Sutin AR, Terracciano A). Sutin AR1, Terracciano A. Pers Individ Dif. 2019; 137: 76-79. PubMed: https://www.ncbi.nlm.nih.gov/pubmed/31571707
- Sutin AR, Stephan Y2, Terracciano A. Parent-Reported Personality and Weight Transitions Across Adolescence. Child Obes. 2019; 16: 117-121. PubMed: https://www.ncbi.nlm.nih.gov/pubmed/31660757
- Jokela M, Hintsanen M, Hakulinen C, Batty GD, Nabi H, et al. Association of personality with the development and persistence of obesity: A meta-analysis based on individual-participant data. Obes Rev. 2013; 14; 315–323. PubMed: https://www.ncbi.nlm.nih.gov/pubmed/23176713
- Armon G, Melamed S, Shirom A, Shapira I, Berliner S. Personality traits and body weight measures: Concurrent and across-time associations. Eur J Personality. 2013; 27: 398–408.
- Magee CA, Heaven PCL. Big-five personality factors, obesity and 2-year weight gain in Australian adults. J Res Personality. 2011; 45: 332–335.
- Mõttus R, McNeill G, Jia X, Craig LC, Starr JM, et al. The associations between personality, diet and body mass index in older people. Health Psychol. 2013; 32: 353–360. PubMed: https://www.ncbi.nlm.nih.gov/pubmed/21928903
- Wilson RS, Krueger KR, Gu L, Bienias JL, Mendes de Leon CF, et al. Neuroticism, extraversion, and mortality in a defined population of older persons. Psychosomatic medicine. 2005; 67: 841-845. PubMed: https://www.ncbi.nlm.nih.gov/pubmed/16314587
- Sutin AR, Terracciano A. Personality Traits and Body Mass Index: Modifiers and Mechanisms. Psychol Health. 2016; 31: 259-275. PubMed: https://www.ncbi.nlm.nih.gov/pubmed/26274568
- de Wit LM, van Straten A, van Herten M, Penninx BW, Cuijpers P. Depression and body mass index, a u-shaped association. BMC Public Health. 2009; 9: 14. PubMed: https://www.ncbi.nlm.nih.gov/pubmed/19144098
- Lahey BB. Public health significance of neuroticism. Am Psychol. 2009; 64: 241-256. PubMed: https://www.ncbi.nlm.nih.gov/pubmed/19449983
- Costa PT, McCrae RR. Normal personality assessment in clinical practice: the NEO Personality Inventory. Psychol Assess 1992; 4: 5.
- Rhodes RE, Smith NEI. Personality correlates of physical activity: a review and meta‐analysis. Br J Sports Med. 2006; 40: 958–965. PubMed: https://www.ncbi.nlm.nih.gov/pmc/articles/PMC2577457/
- Keller C, Siegrist M. Does personality influence eating styles and food choices? Direct and indirect effects. Appetite. 2015; 84: 128–138. PubMed: https://www.ncbi.nlm.nih.gov/pubmed/25308432
- Ellickson-Larew S, Naragon-Gainey K, Watson D. Pathological eating behaviors, BMI, and facet-level traits: the roles of conscientiousness, neuroticism, and impulsivity. Eat Behav. 2013; 14: 428–431. PubMed: https://www.ncbi.nlm.nih.gov/pubmed/24183129
- Gillespie NA, Evans DE, Wright MM, Martin NG. Genetic simplex modeling of Eysenck’s dimensions of personality in a sample of young Australian twins. Twin Res. 2004; 7: 637–648. PubMed: https://www.ncbi.nlm.nih.gov/pubmed/15607015
- Rettew DC, Vink JM, Willemsen G, Doyle A, Hudziak JJ, et al. The genetic architecture of neuroticism in 3301 Dutch adolescent twins as a function of age and sex: a study from the Dutch Twin Register. Twin Res Hum Genet. 2006; 9: 24–29. PubMed: https://www.ncbi.nlm.nih.gov/pubmed/16611464
- Lamb DJ, Middeldorp CM, van Beijsterveldt CE, Bartels M, van der Aa N, et al. Heritability of anxious-depressive and withdrawn behavior: age-related changes during adolescence. J Am Acad Child Adolesc Psychiatry. 2010; 49: 248–255. PubMed: https://www.ncbi.nlm.nih.gov/pubmed/20410714
- Bartels M, van de Aa N, van Beijsterveldt CE, Middeldorp CM, Boomsma DI. Adolescent self-report of emotional and behavioral problems: interactions of genetic factors with sex and age. J Can Acad Child Adolesc Psychiatry. 2011; 20, 35–52. PubMed: https://www.ncbi.nlm.nih.gov/pmc/articles/PMC3024721/
- Kendler KS, Gardner CO, Gatz M, Pederson NL. The sources of co-morbidity between major depression and generalized anxiety disorder in a Swedish national twin sample. Psychol Med. 2007; 37: 453–462. PubMed: https://www.ncbi.nlm.nih.gov/pubmed/17121688
- Vassend O, Roysamb E, Nielsen CS. Neuroticism and self-reported somatic health: a twin study. Psychol Health. 2011; 27: 1-12. PubMed: https://www.ncbi.nlm.nih.gov/pubmed/21678178
- Luppino FS, de Wit LM, Bouvy PF, Stijnen T, Cuijpers P, et al. Overweight, obesity, and depression: A systematic review and Psychology & Health 273 meta-analysis of longitudinal studies. Arch Gen Psychiatry. 2010; 67: 220–229. PubMed: https://www.ncbi.nlm.nih.gov/pubmed/20194822
- Sutin AR, Zonderman AB. Depressive symptoms are associated with weight gain among women. Psychol Med. 2012; 42: 2351–2360. PubMed: https://www.ncbi.nlm.nih.gov/pubmed/22475128
- Cooper M1, Frone MR, Russell M, Mudar P. Drinking to regulat e positive and negative emotions: A motivational model of alcohol use. J Pers Soc Psychol. 1995; 69: 990–1005. PubMed: https://www.ncbi.nlm.nih.gov/pubmed/7473043
- Gustafson R. Does a moderate dose of alcohol reinforce feelings of pleasure, well-being, happiness and joy? A brief communication. Psychol Rep. 1991; 69: 220–222. PubMed: https://www.ncbi.nlm.nih.gov/pubmed/1961796
- Wills TA, Shiffman S. Coping and substance use: A conceptual framework. In S Shiffman & TA Wills (Eds.), Coping and substance use. Orlando, FL: Academic Press. 1985; 3–24.
- Brandon TH. Negative affect as motivation to smoke. Current Directions in Psychological Science. 1994; 3: 33–37.
- Courneya KS, Hellsten LAM. Personality correlates of exercise behavior, motives, barriers and preferences: An application of the five-factor model. Personality and Individual Differences. 1998; 24: 625–633.
- Tiainen AM, Männistö S, Lahti M, Blomstedt PA, Lahti J, et al. Personality and dietary intake – Findings in the Helsinki birth cohort study. PLoS One. 2013; 8: e68284. PubMed: https://www.ncbi.nlm.nih.gov/pubmed/23874573
- Terracciano A, Schrack JA, Sutin AR, Chan W, Simonsick EM, et al. Personality, metabolic rate and aerobic capacity. PLoS One. 2013; 8: e54746. PubMed: https://www.ncbi.nlm.nih.gov/pmc/articles/PMC3556088/
- Walker RJ, Christopher AN, Wieth MB, Buchanan J. Personality, time-of-day preferences, and eating behavior: The mediational role of morning-eveningness. Personality and Individual Differences. 2015; 77: 13 –17.
- Olivo G, Gour S, Schiöth HB. Low Neuroticism and Cognitive Performance are Differently Associated to Overweight and Obesity: A Cross-Sectional and Longitudinal UK Biobank study. Psychoneuroendocrinology. 2019; 101: 167-174. PubMed: https://www.ncbi.nlm.nih.gov/pubmed/30469083
- Brummett BH, Babyak MA, Williams RB, Barefoot JC, Costa PT, et al. NEO personality domains and gender predict levels and trends in body mass index over 14 years during midlife. J Res Personality. 2006; 40: 222–236.
- Faith MS, Flint J, Fairburn CG, Goodwin GM, Allison DB. Gender differences in the relationship between personality dimensions and relative body weight. Obes Res . 2001; 9: 647–650. PubMed: https://www.ncbi.nlm.nih.gov/pubmed/11595783
- Kakizaki M, Kuriyama S, Sato Y, Shimazu T, Matsuda-Ohmori K, et al. Personality and body mass index: A cross-sectional analysis from the Miyagi Cohort Study. J Psychosom Res. 2008; 64: 71 –80. PubMed: https://www.ncbi.nlm.nih.gov/pubmed/18158002
- Shim U, Kim HN, Roh SJ, Cho NH3, Shin C, et al. Personality traits and body mass index in a Korean population. PLoS One. 2014; 9: e90516. PubMed: https://www.ncbi.nlm.nih.gov/pubmed/24598991
- Ogden CL, Carroll MD, Kit BK, Flegal KM. Prevalence of childhood and adult obesity in the United States, 2011–2012. JAMA. 2014; 311: 806–814. PubMed: https://www.ncbi.nlm.nih.gov/pubmed/24570244
- Hoyt AL, Rhodes RE, Hausenblas HA, Giacobbi Jr, PR. Integrating five-factor model facet-level traits with the theory of planned behavior and exercise. Psychol Sport Exercise. 2009; 10: 565–572.
- Belsky DW, Israel S. Integrating Genetics and Social Science: Genetic Risk Scores. Biodemography Soc Biol.. 2014; 60: 137–155. PubMed: https://www.ncbi.nlm.nih.gov/pubmed/25343363
- Dudbridge F. Polygenic Epidemiology: Polygenic Epidemiology. Genet Epidemiol. 2016; 40: 268–172. PubMed: https://www.ncbi.nlm.nih.gov/pubmed/27061411
- Highland HM, Avery CL, Duan Q, Li Y, Harris KM. Quality Control Analysis of Add Health GWAS Data. 2018.
- Collins AL, Sullivan PF. Genome-wide association studies in psychiatry: what have we learned? Br J Psychiatry. 2013; 202: 1–4. PubMed: https://www.ncbi.nlm.nih.gov/pubmed/23284144
- Wray NR, Goddard ME, Visscher PM. Prediction of individual genetic risk to disease from genome-wide association studies. Genome research. 2007; 17: 1520–1528. PubMed: https://www.ncbi.nlm.nih.gov/pubmed/17785532
- Wray NR, Goddard ME, Visscher PM. Prediction of individual genetic risk of complex disease. CurrOpin Genet Dev. 2008; 18: 257–263. PubMed: https://www.ncbi.nlm.nih.gov/pubmed/18682292
- de Vlaming R, Groenen PJ. The Current and Future Use of Ridge Regression for Prediction in Quantitative Genetics. Biomed Res Int.. 2015: 143712. PubMed: https://www.ncbi.nlm.nih.gov/pubmed/26273586
- Dudbridge F. Power and predictive accuracy of polygenic risk scores. PLOS Genetics. 2013; 9: e1003348. PubMed: https://www.ncbi.nlm.nih.gov/pubmed/23555274
- Martin AR, Gignoux CR, Walters RK, Wojcik GL, Neale BM. et al. Human Demographic History Impacts Genetic Risk Prediction across Diverse Populations. Am J Hum Genet. 2017; 100: 635-649. PubMed: https://www.ncbi.nlm.nih.gov/pubmed/28366442
- Ware EB. Jessica F, Arianna G, Colter M, Jennifer AS, et al. Heterogeneity in Polygenic Scores for Common Human Traits. BioRxiv. 2017; 106062.
- Braudt DB, Harris KM. Polygenic Scores (PGSs) in the National Longitudinal Study of Adolescent to Adult Health (Add Health) – Release 1.” Chapel Hill, NC: Carolina Population Center, University of North Carolina at Chapel Hill. 2018.
- Price AL, Patterson NJ, Plenge RM, Weinblatt ME, Shadick NA,. et al. Principal Components Analysis Corrects for Stratification in Genome-Wide Association Studies. Nat Genet. 2006; 38: 904–909. PubMed: https://www.ncbi.nlm.nih.gov/pubmed/16862161
- Judd CM, Kenny DA. Process Analysis: Estimating Mediation in Treatment Evaluations. Evaluation Review. 1981; 5: 602–619.
- Baron RM, Kenny DA. The moderator–mediator variable distinction in social psychological research: Conceptual, strategic, and statistical considerations. J Pers Soc Psychol. 1986; 51: 1173–1182. PubMed: https://www.ncbi.nlm.nih.gov/pubmed/3806354
- Gunzler D, Chen T, Wu P, Zhang H. Introduction to mediation analysis with structural equation modeling. Shanghai archives of psychiatry. 2013; 25: 390–394. PubMed: https://www.ncbi.nlm.nih.gov/pmc/articles/PMC4054581/
- Yu Q, Fan Y, Wu X. General multiple mediation analysis with an application to explore racial disparity in breast cancer survival. Journal of Biometrics and Biostatistics. 2014; 5: 189.
- Yu Q, Li B. mma: An R Package for Mediation Analysis with Multiple Mediators. J Open Res Soft. 2017; 5: 11.
- Duggan KA, Friedman HS, McDevitt EA, Mednick SC. Personality and healthy sleep: the importance of conscientiousness and neuroticism. PloS one. 2014; 9: e90628. PubMed: https://www.ncbi.nlm.nih.gov/pubmed/24651274
- Goodwin R, Hamilton SP. Cigarette smoking and panic: the role of neuroticism. Am J Psychiatry. 2002; 159: 1208-1213. PubMed: https://www.ncbi.nlm.nih.gov/pubmed/12091201
- Hu S, Brody CL, Fisher C, Gunzerath L, Nelson ML, et al. Interaction between the serotonin transporter gene and neuroticism in cigarette smoking behavior. Mol Psychiatry. 2000; 5: 181-188. PubMed: https://www.ncbi.nlm.nih.gov/pubmed/10822346
- Zvolensky MJ, Taha F, Bono A, Goodwin RD. Big five personality factors and cigarette smoking: A 10-year study among US adults. J Psychiatr Res. 2015; 63: 91-96. PubMed: https://www.ncbi.nlm.nih.gov/pubmed/25799395
- Kitayama S, Park J, Miyamoto Y, Date H, Boylan JM, et al. Behavioral Adjustment Moderates the Link Between Neuroticism and Biological Health Risk: A US–Japan Comparison Study. Pers Soc Psychol Bull. 2018; 44: 809-822. PubMed: https://www.ncbi.nlm.nih.gov/pubmed/29380686
- Diehl M, Coyle N, Labouvie-Vief G. Age and sex differences in strategies of coping and defense across the life span. Psychol Aging. 1996; 11: 127-139. PubMed: https://www.ncbi.nlm.nih.gov/pubmed/8726378
- Spencer EA, Appleby PN, Davey GK, Key TJ. Validity of self-reported height and weight in 4808 EPIC–Oxford participants. Public Health Nutr. 2002; 5: 561-565. PubMed: https://www.ncbi.nlm.nih.gov/pubmed/12186665
- Jeffery RW. Socioeconomic status, ethnicity and obesity in women. Ann Epidemiol. 1996; 6: 263-265. PubMed: https://www.ncbi.nlm.nih.gov/pubmed/8876835
- Kuczmarski MF, Kuczmarski RJ, Najjar M.. Effects of age on validity of self-reported height, weight, and body mass index: findings from the Third National Health and Nutrition Examination Survey, 1988–1994. J Am Diet Assoc. 2001; 101: 28-34. PubMed: https://www.ncbi.nlm.nih.gov/pubmed/11209581
- Andersen BL, Cacioppo JT. Delay in seeking a cancer diagnosis: Delay stages and psychophysiological comparison processes. Br J Soc Psychol. 1996; 34: 33–52 PubMed: https://www.ncbi.nlm.nih.gov/pubmed/7735731
- Bartels M, Cacioppo JT, van Beijsterveldt TC, Boomsma DI. Exploring the association between well-being and psychopathology in adolescents. Behav Genet. 2013; 43L 177–190. PubMed: https://www.ncbi.nlm.nih.gov/pubmed/23471543
- Croyle RT, Uretsky MB. Effects of mood on self-appraisal of health status. Health Psychol. 1987; 6: 239–253. PubMed: https://www.ncbi.nlm.nih.gov/pubmed/3595548
- Dracup K, Moser DK, Eisenberg M, Meischke H, Alonzo AA, et al. Causes of delay in seeking treatment for heart attack symptoms. Soc Sci Med. 1995; 40: 379–392. PubMed:
- Genetics of Personality Consortium. Meta-analysis of genome-wide association studies for neuroticism, and the polygenic association with major depressive disorder. JAMA Psychiatry 72, 642–650 (2015) PubMed: https://www.ncbi.nlm.nih.gov/pubmed/7899950
- Johnson EJ, Tversky A. Affect, generalization, and the perception of risk. J Pers Social Psychol. 1983; 45; 20–31.
- Kendler KS, Myers J. The genetic and environmental relationship between major depression and the five-factor model of personality. Psychol Med. 2010; 40: 801–806. PubMed: https://www.ncbi.nlm.nih.gov/pubmed/19732485
- Lange T, Rasmussen M, Thygesen LC. Assessing natural direct and indirect effects through multiple pathways. Ame J Epidemiol. 20014; 179: 513–518. PubMed: https://www.ncbi.nlm.nih.gov/pubmed/24264291
- Lange T, Vansteelandt S, Bekaert M. A Simple Unified Approach for Estimating Natural Direct and Indirect Effects. Ame J Epidemiol.2012; 176: 190–195. PubMed: https://www.ncbi.nlm.nih.gov/pubmed/22781427
- Leith KP, Baumeister RF. Why do bad moods increase self-defeating behavior? Emotion, risk taking, and self-regulation. J Pers Soc Psychol. 1996; 71, 1250–1267. PubMed: https://www.ncbi.nlm.nih.gov/pubmed/8979390
- Loeys T, Moerkerke B, De Smet O, Buysse A, Steen J3, et al. Flexible Mediation Analysis in the Presence of Nonlinear Relations: Beyond the Mediation Formula. Multivariate Behav Res. 2013; 48: 871–894. PubMed: https://www.ncbi.nlm.nih.gov/pubmed/26745597
- Mayer JD, Volanth AJ. Cognitive involvement in the emotional response system. Motivation and Emotion. 1985; 9: 261–275.
- Mayer JD, Gaschke YN, Braverman DL, Evans TW. congruent judgment is a general effect. J Pers Social Psychol. 1992; 63: 119–132.
- Safer MA, Tharps QJ, Jackson TC, Leventhal H. Determinants of three stages of delay in seeking care at a medical care clinic. Med Care. 1979; 17: 11–29. PubMed: https://www.ncbi.nlm.nih.gov/pubmed/759741
- Salovey P1, Birnbaum D. Influence of mood on health-relevant cognitions. J Pers Soc Psychol. 1989; 57: 539–551. PubMed: https://www.ncbi.nlm.nih.gov/pubmed/2778638
- Schwarz N, Clore GL. Feelings and phenomenal experiences. In E. T.Higgins & A. W.Kruglanski (Eds.), Social psychology: Handbook of basic principles. New York: Guilford Press. 1996; 433–465.
- Sutin AR, Rogers DL, Mercado A, Weimer A, Rodriguez CC, et al. The association between personality traits and body mass index varies with nativity among individuals of Mexican origin. Appetite. 2015; 90: 74-79. PubMed: https://www.ncbi.nlm.nih.gov/pubmed/25747285
- Sutin AR, Terracciano A. With nativity among individuals of Mexican origin. Appetite. 2015; 90: 74 –79.
- Weinstein ND. Testing four competing theories of health-protective behavior. Health Psychol. 1993; 12: 324–333. PubMed: https://www.ncbi.nlm.nih.gov/pubmed/8404807
- Wilson KE, Dishman RK. Personality and physical activity: A systematic review and meta-analysis. Personality and Individual Differences. 2015; 27: 230–242.