
More Information
Submitted: August 29, 2021 | Approved: November 22, 2021 | Published: November 23, 2021
How to cite this article: Taha S, Ali SK, D’Ascenzo F, Hasan-Ali H, Ghzally Y, et al. RV Function by cardiac magnetic resonance and its relationship to RV longitudinal strain and neutrophil/lymphocyte ratio in patients with acute inferior ST-segment elevation myocardial infarction undergoing primary percutaneous intervention. J Cardiol Cardiovasc Med. 2021; 6: 059-065.
DOI: 10.29328/journal.jccm.1001120
Copyright License: © 2021 Taha S, et al. This is an open access article distributed under the Creative Commons Attribution License, which permits unrestricted use, distribution, and reproduction in any medium, provided the original work is properly cited.
Keywords: Right ventricular longitudinal strain; Neutrophil/lymphocyte ratio; Inferior wall myo-cardial infarction; Right ventricular dysfunction; Primary percutaneous coronary intervention; Cardiac magnetic resonance imaging; Right ventricular ejection fraction; Fractional area change

RV Function by cardiac magnetic resonance and its relationship to RV longitudinal strain and neutrophil/lymphocyte ratio in patients with acute inferior ST-segment elevation myocardial infarction undergoing primary percutaneous intervention
Salma Taha1#* , Shrouk Kelany Ali1, Fabrizio D’Ascenzo2, Hosam Hasan-Ali1, Yousra Ghzally1# and Mohamed Abdel Ghany1
1Department of Cardiology, Assiut University, Egypt
2Department of Medical Science, Division of Cardiology, University of Turin, Italy
#ST and YG contributed equally in this work
*Address for Correspondence: Salma Taha, MD, Department of Cardiology, Assiut University, Egypt, Email: esmaeil.salma@gmail.com
Background: Although acute inferior myocardial infarction (MI) is usually regarded as being lower risk compared with acute anterior MI, right ventricular (RV) myocardial involvement (RVMI) may show an increased risk of cardiovascular (CV) morbidity and mortality in patients with inferior MI. CMR is ideal for assessing the RV because it allows comprehensive evaluation of cardiovascular morphology and physiology without most limitations that hinder alternative imaging modalities.
Objectives: To evaluate the sensitivity of strain and strain rate of the RV using 2D speckle tracking echo and the neutrophil/ lymphocyte ratio (NLR) compared to cardiac MRI (CMR) as the gold standard among patients with inferior STEMI undergoing primary percutaneous coronary intervention (PCI).
Methodology: 40 Patients with inferior MI who had primary PCI were included in the study; they were divided into two groups according to the RVEF using CMR. NLR was done in comparison to RVEF.
Results: out of the 40 patients, 18 (45%) patients had RV dysfunction. 2D echocardiography was done for all patients, where fractional area change (FAC) in the RV dysfunction group appeared to be significantly reduced compared to the group without RV dysfunction (p value = 0.03). In addition, RV longitudinal strain (LS) by speckle tracking echo was reduced with an average of 19.5 ± 3.9% in the RV dysfunction group.
Both CMR- derived RV SV, and EF were lower among the RV dysfunction group, (26.8 ± 15.8) ml and (35.4 ± 6.9)% respectively, with large RV systolic volume, with a highly statistically significant difference in comparison to the other group (p value = 0.000). Complications, heart block was significantly higher in patients with RV dysfunction (p value = 0.008) as it occurred in 5 (27.8%) patients.
N/L ratio for predicting RV dysfunction by CMR had a cut-off value of > 7.7 with low sensitivity (38.8%) and high specificity (77.3 %). In contrast, LS for predicting RV dysfunction by CMR had high sensitivity (83.3%) and high specificity (63.6%) with p value = 0.005.
Conclusion: Our results showed that RV dysfunction in inferior MI is better detected using cardiac magnetic resonance imaging. In inferior STEMI patients who underwent primary PCI, NLR has low sensitivity but high specificity for predicting RVD when measured by cardiac MRI.
Despite advancements in invasive treatment strategies and antiplatelet, anticoagulant, and anti-ischemic treatment options, the mortality rate is high in patients with myocardial infarction (MI) [1].
Autopsy findings showed that right ventricular myocardial involvement (RVMI) is observed in up to 50% of patients with inferior ST-segment elevation myocardial infarction (STEMI). However, the long-term prognosis is generally good for those who survive the event [2].
RV function is an important parameter in cardiac disease. In the clinical arena, two-dimensional echocardiography can be used to assess RV dysfunction. In addition, several new echocardiographic techniques, including tissue Doppler imaging (TDI), strain rate imaging using speckle tracking echo (STE), real-time three-dimensional echocardiography (RT3DE), and contrast echocardiography, may further enhance our capability for assessing RV function [3].
CMR is the gold standard technique for assessing right ventricular function. It is a non-invasive tool providing high-resolution three-dimensional images of the heart [4]. CMR is both accurate and reproducible concerning quantitative RV volumes, structure, and function assessment. Combining a time-resolved 3D dataset, clear distinction between the blood pool and the myocardium, and high spatial and temporal resolutions allow for accurate RV measurements regardless of its morphology or orientation within the thorax and without geometrical assumptions [5].
RV LS is acquired using tissue Doppler imaging or speckle-tracking imaging. Since strain values by tissue Doppler imaging are angle-dependent, RV LS is now measured by 2DE speckle tracking analysis. RV-free wall LS is the strain in the RV-free wall on the apical 4-chamber view. RV global LS is defined as averaged strain on the RV-free wall and interventricular septum. RV-free wall strain is generally higher than RV global LS [6].
Pooled data (though heavily weighted by a single vendor) suggest that global longitudinal RV free wall strain > -20% (i.e., < 20% in absolute value) is likely abnormal [7].
MI triggers an intense inflammatory response essential for cardiac repair, but it is also implicated in the pathogenesis of post-infarction remodeling and heart failure [8].
The current study evaluates the sensitivity of the NLR and RV function and strain compared to CMR among patients with inferior STEMI undergoing primary PCI.
Study design and population
A prospective observational cross-sectional study analyzed patients from March 2019 till September 2019 with inferior STEMI presented within 12 h from the symptom onset that underwent primary PCI in Assiut Heart Hospital.
Out of 95 patients who presented with inferior MI and underwent primary PCI, 40 underwent CMR and echo, as shown in Figure 1.
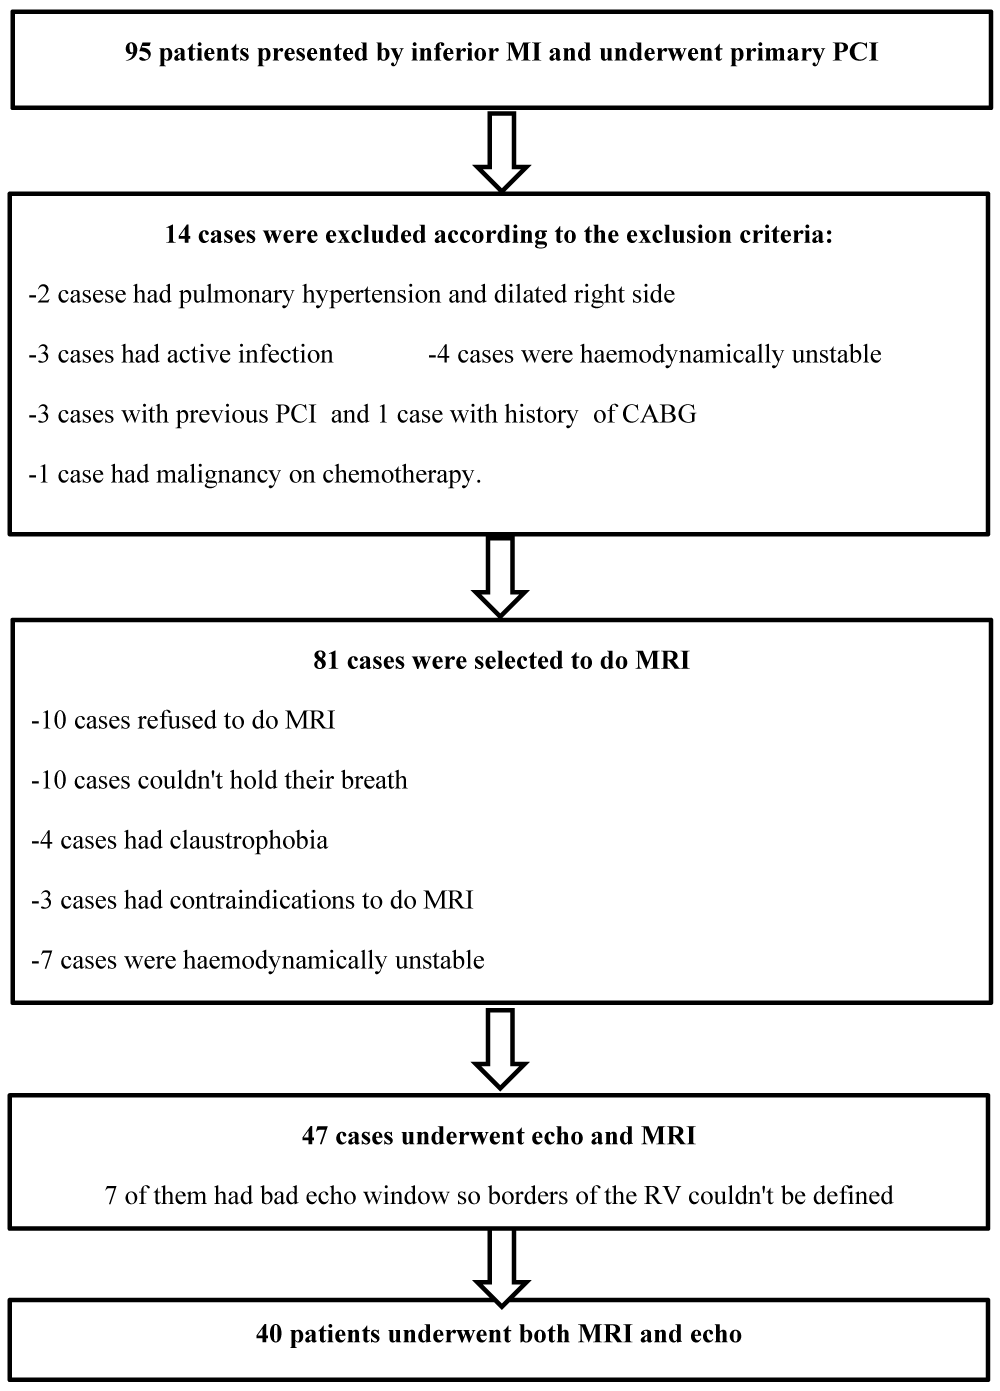
Figure 1: The study scheme.
All 40 patients underwent full examination and history taking then 12 leads ECG was recorded immediately after admission to the emergency room. In addition, blood samples were collected from the antecubital vein at the emergency room for laboratory analysis.
Diagnostic ST elevation in the absence of left ventricular hypertrophy (LVH) or left bundle-branch block (LBBB) as defined by the European Society of Cardiology (ESC)/American College of Cardiology Foundation (ACCF)/American Heart Association (AHA)/World Heart Federation Task Force for the Universal Definition of Myocardial Infarction as new ST elevation at the J point in at least two contiguous leads of 2 mm (0.2 mV) in men or 1.5 mm (0.15 mV) in women in leads V2–V3 and/or of 1 mm (0.1 mV) in other contiguous chest leads or the limb leads [9].
All cases underwent primary PCI according to the time frame of the ESC guidelines within less than 120 minutes from ECG diagnosis to detect angiographic variables as the infarcted related artery, target lesion location, TIMI flow before and after PCI [10].
Echocardiography and speckle tracking imaging
Within 24 hours of primary PCI, 2D echo and speckle tracking echocardiography were done using Phillips healthcare Epiq 7 C, release 1.7.1 using S5-1 probe. In addition, tricuspid annular plane systolic excursion (TAPSE); 2. Fractional area change (FAC), and tissue Doppler imaging (systolic annular velocity (‘’S’) were performed and collected for each patient.
Apical four-chamber views were specifically optimized to visualize the right ventricle and obtain echocardiographic cine loops by recording three consecutive heart cycles (> 61 frames per second). Data were stored in a mobile device in DICOM format, and offline analyses were performed using QLAB 10.4 software (Philips Healthcare). The interest (ROI) region was automatically estimated and adjusted to fit the RV-free wall thickness and the septum. Adequate tracking was verified in real-time and was corrected by adjusting the ROI or manually editing the contour to ensure optimal tracking. Special care was taken to fine-tune the region of interest using visual assessment during cine loop playback to ensure that the segments were tracked appropriately.
Cardiac MRI scan
All MRI scans were performed within 24 hours of Philips’s admission (Ingenia, Philips Medical Systems, the Netherlands) 1.5 Tesla MRI scanner using a phased array cardiac receiver coil. After visualizing the heart’s long and short axes, a multiphase steady-state free precession sequence (SSFP) with retrospective electrocardiographic triggering was applied to visualize two-chamber, three-chamber, and four-chamber views. Guided by these views, a multislice and multiphase SSFP sequence was applied perpendicular to the ventricular septum, encompassing the whole heart. These sequences were individually adjusted to acquire short-axis slices with optimal spatial and temporal resolution. All patients underwent standard cine steady-state-free precession images of the left ventricle and the right ventricle in the long-axis planes and a stack of short-axis.
T2 weighted images were obtained using a T2 weighted triple inversion recovery breath-hold pulse sequence (repetition time 2 x R-R interval, echo time 80 ms; flip angle 180°, voxel size 0.71 x 0.71 x 8.0 mm).
Image analysis
Offline analysis was done with dedicated Philips software. Cine loops were used to choose end-diastole (ED) and end-systole (ES). ED was defined as the phase with the largest RV (and left ventricular (LV)) cavity and ES as the phase with the smallest RV and LV cavity. Tracing of endocardial and epicardial borders was performed manually on each ED and ES short-axis view. The sums of the traced contours in ED and ES were used to calculate ED volume (EDV) and ES volume (ESV) using a disc summation technique. EDV and ESV were used to calculate Stroke Volume (SV) and Ejection Fraction (EF). SV was defined as EDV - ESV, and EF as [(EDV - ESV)/EDV] × 100%, as shown in Figure 2.
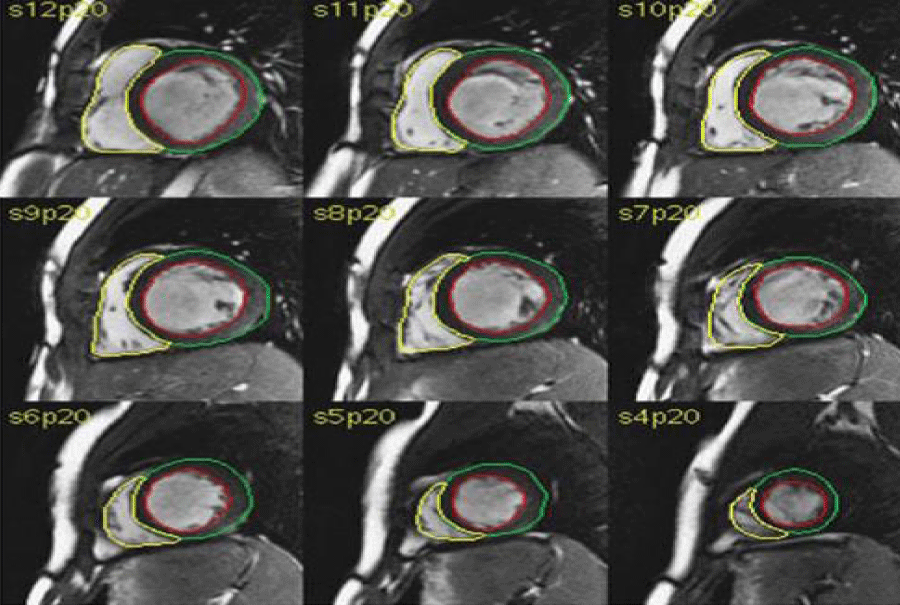
Figure 2: RV analysis by CMR.
Analysis of the right ventricle was performed per slice basis by manual contouring of the endocardial and epicardial borders, including trabeculations and papillary muscles as part of the right ventricular volume was calculated based on the Simpson’s method.
Body surface area (BSA) has been shown to have an independent influence on RV mass and volumes. Absolute and normalized RV volumes are significantly larger in males compared to females. Further, RV mass and volumes decrease with age [11,12].
Areas with increased signal intensity on T2 weighted images were analyzed qualitatively with an expert (Y.G.) and were delineated manually. Areas with falsely increased power due from the blood pool close to endocardium due to slow flow were excluded.
Statistical analysis
Data was collected and analyzed using SPSS (Statistical Package for the Social Science, version 19, IBM, and Armonk, New York). Continuous data were expressed in mean ± SD or median (range), while nominal data were expressed in frequency (percentage).
Chi-square test (independent sample T-test) was used to compare the nominal data of different groups in the study, while crosstab was used to compare the mean of two different groups. Spearman correlation was used to determine the correlation between different continuous parameters in the study and RV function. p value was significant if < 0.05. Receiver operator characteristic (ROC) analysis was performed to select cut-off values with suitable sensitivity and specificity to detect RV function factors.
Patient data and characteristics
Forty patients were included in the study. The mean age of the studied population was 58.5 ± 7.8 years, 85% were males, and 72% were smokers. 42% of the patients were known to have DM, and 32% were known to have HTN. The onset of chest pain in the studied patients was within 5.4 ± 2.4 hours. The study population was divided into two groups based on RVEF detected by CMR. Patients with RV dysfunction (RVD) (n = 18) was defined as EF < 50% and another group with no RV dysfunction (Non -RVD) (n = 22) with EF ≥ 50%.
Baseline demographic data did not show a significant difference between the groups. Still, ST-segment elevation in the right leads was significantly higher in patients with RVD with a p value of 0.003.
Clinical data did not show a significant difference except that heart block was significantly higher in patients with RVD as it occurred in 5 (27.8%) patients. In contrast, it ‘did not occur in any patient with absent RVD with p value = 0.008, as shown in Table 1.
| Table 1: Demographic data, ECG findings, and clinical data of the RV function groups. | |||
| Variable | RV dysfunction | RV dysfunction | p value |
| Present (n = 18) 45% | Absent (n = 22) 55% | ||
| Age (years) | 60.0 ± 8.7 | 57.4 ± 6.9 | 0.32 |
| Weight (kg) | 76.6 ± 9.9 | 72.4 ± 9.8 | 0.19 |
| Height (cm) | 169.4 ± 5.5 | 170.1 ± 7.1 | 0.75 |
| Smoking | 12 (66.7%) | 17 (77.3%) | 0.45 |
| HTN | 5 (27.8%) | 8 (36.4%) | 0.56 |
| DM | 5 (27.8%) | 12 (54.5%) | 0.08 |
| ST segment elevation: - Right leads - Lateral leads - Posterior leads |
10 (55.6%) Zero 3 (16.7%) |
5 (22.7%) 4 (18.2%) 4 (18.2%) |
0.03** 0.05** 0.9 |
| Onset of chest pain (hours) | 4.8 ± 1.4 | 5.9 ± 3.0 | 0.15 |
| Cardiogenic Shock | 3 (16.7%) | 2 (9.1%) | 0.47 |
| Heart Block | 5 (27.8%) | Zero | 0.008** |
| Arrhythmia: - AF - VF - VT |
2 (11.1%) Zero 1 (5.6%) |
1(4.5%) 1 (4.5%) 1 (4.5%) |
0.7 |
| Data were expressed in the form of mean ± SD and frequency (percentage). Cm; centimeters; Kg: Kilo-grams; DM: Diabetes Mellitus; HTN: Hypertension; AF: Atrial Fibrillation; VF: Ventricular Fibrillation; VT; Ventricular Tachycardia | |||
Angiographic data
The mean door to balloon inflation time was 30.2 ± 11.6 minutes, and according to the angiographic data, IRA of 33 (82.5%) patients was RCA.
Angiographic data did not show a significant difference between the groups of the RV function.
Cardiac MRI derived analysis
Right ventricular volumes and ejection fraction:
There was a significant reduction in the RVEF among the RVD where the average RvEF was 35.4 ± 6.9% vs. 62.6 ± 10.3% in non -RVD, with a marked increase of 57.4 ± 18.3 ml/m2 in the ESVi in the Non-RVD group vs. 32.7 ± 12.4 ml/m2 in the non-RVD group. While the EDVi didn’t show a significant difference in both groups.
Lower values regarding CMR-derived RVEF and SV; (46.7 ± 13.0) % and (36.5 ± 18.6) ml, respectively, were seen in the RCA-IRA group. Both values showed a significant difference compared to other IRA groups; p values were 0.005 for EF and 0.004 for SV. The largest ESV was seen in the RCA-IRA group (82.3 ± 27.4) ml with a significant difference (p value 0.02), shown in Table 2.
| Table 2: RV function by MRI of the different IRA groups. | |||||
| Variables | LAD n = 1 (2.5%) |
LCX n = 5(12.5%) |
OM n = 1(2.5%) |
RCA n = 33 (82.5%) |
p value |
| EDV(ml) | 126.7 | 103.4 ± 26.3 | 136.6 | 120.2 ± 34.2 | 0.69 |
| ESV (ml) | 83.2 | 74.5 ± 32.5 | 22.8 | 82.3 ± 27.4 | 0.02 |
| SV (ml) | 43.5 | 55.9 ± 35.9 | 113.9 | 36.5 ± 18.6 | 0.004 |
| EF (%) | 55.6 | 66.7 ± 22.4 | 86.8 | 46.7 ± 13.0 | 0.005 |
| Data were expressed in the form of mean ± SD and frequency (percentage). IRA: Infarcted Related Artery; LAD: Left anterior Descending; LCX: Left Circumflex; OM2: Obtuse Marginal 2; RCA: Right Coronary Artery; EDV: End-Diastolic Volume; ESV: End-Systolic Volume; SV: Stroke Volume; EF: Ejection Fraction; ml: milliliter | |||||
T2 mapping and myocardial edema
Signal enhancement on T2 STIR images was detected in 25% (n = 10) of the studied population. However, myocardial enhancement didn’t significantly correlate with reduced longitudinal strain or NLR, p value > 0.05.
Echocardiographic parameters compared to CMR
Fractional area change (FAC) was 34.5 ± 12.3% in the RVD group, which appeared to be significantly reduced compared to the group without RVD with FAC of 42.9 ± 11.9% p value 0.03).
For the TDI measurement, only ‘A’ velocity and the isovolumetric relaxation time (IVCT) were significantly reduced in the RVD group versus the non-RVD group (p value = 0.05, 0.02 respectively). RV LS by speckle tracking echo was -19.5 ± 3.9% in the RVD group, which showed a significant difference from the non-RVD group (p value = 0.008), Table 3.
| Table 3: Echocardiographic characteristics of the RV function groups. | |||
| Variable | RV dysfunction | Non RV dysfunction | p value |
| (n = 18) 45% | (n = 22) 55% | ||
| TAPSE (mm) | 17.2 ± 4.2 | 20.0 ± 5.5 | 0.14 |
| E/A ratio | 0.9 ± 0.3 | 0.9 ± 0.3 | 0.78 |
| FAC (%) | 34.5 ± 12.3 | 42.9 ± 11.9 | 0.03** |
| TDI: S' velocity (cm/s) E' velocity (cm/s) A' velocity (cm/s) IVRT (ms) IVCT (ms) |
11.1 ± 2.7 8.3 ± 2.6 13.0 ± 3.3 85.2 ± 13.3 79.0 ± 18.8 |
12.0 ± 4.0 9.1 ± 3.5 15.5 ± 4.8 77.8 ± 17.5 98.1 ± 29.0 |
0.39 0.44 0.05** 0.14 0.02** |
| Longitudinal strain% | -19.5 ± 3.9 | -15.3 ± 5.3 | 0.008** |
| Data were expressed in the form of mean ± SD and frequency (percentage). TAPSE: Tricuspid Annular Plane Systolic Excursion; mm: millimeter; FAC: Fractional Area Change; TDI: Tissue Doppler Imaging: cm/s; centimeter/second; S': Systolic Annular Velocity; E': Early Diastolic Annular Velocity; A': Late Diastolic Annular Velocity; ms: millisecond; IVRT: Iso-Volumetric Relaxation Time; IVCT: Iso-Volumetric Contraction Time. | |||
AUC for longitudinal strain for predicting RV by CMR was 0.729 with a significance level, p value = 0.005, as shown in Figure 3 and Table 5. Thus, LS < -15.6 was found to predict RVD with a sensitivity of 83.3 and specificity of 63.6.
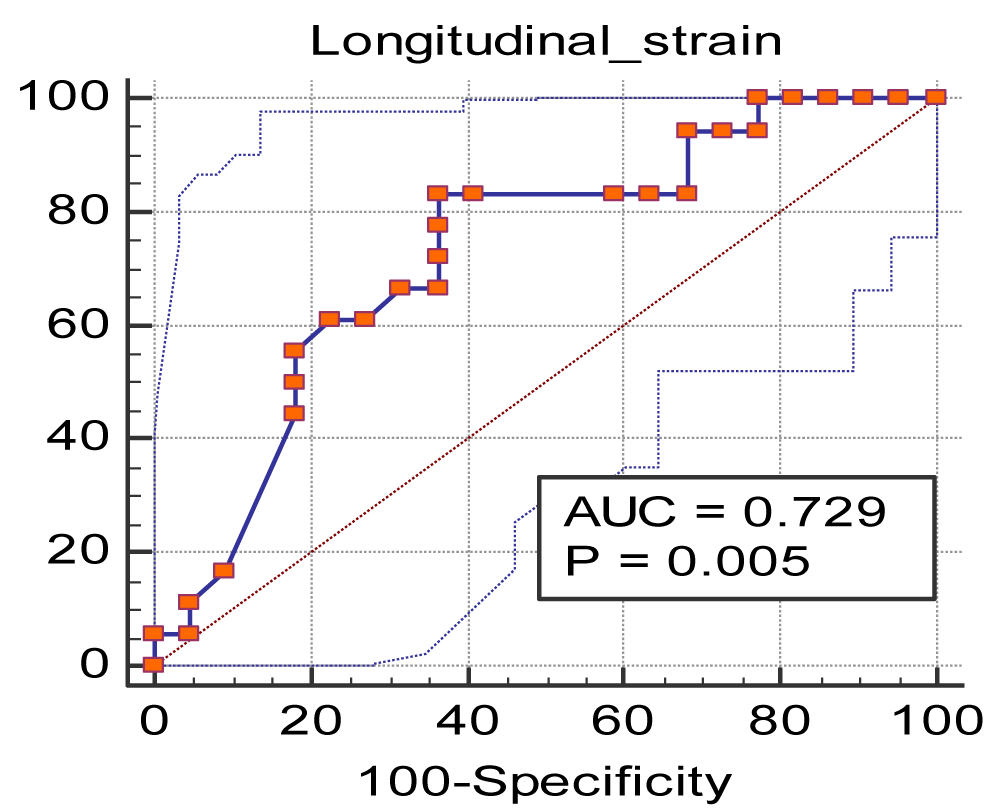
Figure 3: ROC curve of the longitudinal strain for predicting RV dysfunction by MRI.
Lower values regarding CMR-derived RVEF and SV; (46.7 ± 13.0) % and (36.5 ± 18.6) ml, respectively, were seen in the RCA-IRA group. Both values showed a significant difference compared to other IRA groups; p values were 0.005 for EF and 0.004 for SV. The largest ESV was seen in the RCA-IRA group (82.3 ± 27.4) ml with a significant difference (p value 0.02), shown in Table 2.
Neutrophils leucocytic ratio analysis
The neutrophil count was higher (78.5 ± 8.7 (10^3/uL)) in the RVD group, while the lymphocytic count was lower (14.2 ± 6.0 (10^3/uL)), so the N/L ratio was higher (7.3 ± 5.2) in the RVD group as shown in Table 4.
| Table 4: Angiographic and laboratory data of the RV function groups. | |||
| Variable | RV dysfunction | RV dysfunction | p value |
| Present (n = 18) 45% |
Absent (n = 22) 55% |
||
| Door to balloon inflation (mins) | 28.9 ± 7.8 | 31.4±14.1 | 0.51 |
| IRA: - LAD - LCX - OM2 - RCA |
zero 1 (5.6%) Zero 17 (94.4%) |
1 (4.5%) 4 (18.2%) 1 (4.5%) 16 (72.7%) |
0.40 |
| Initial TIMI flow: - I - Zero |
3 (16.7%) 15 (83.3%) |
5 (22.7%) 17 (77.3%) |
0.63 |
| Target lesion location: - Distal segment - Midsegment - Proximal segment |
4 (22.2%) 5 (27.8%) 9 (50%) |
5 (22.7%) 6 (27.3 %) 11 (50%) |
0.99 |
| Final TIMI flow: - III - Zero |
18 (100%) Zero |
21 (95.5 %) 1 (4.5%) |
0.36 |
| Neutrophilic count (10^3/uL) | 78.5 ± 8.7 | 76.8 ± 9.3 | 0.57 |
| Lymphocytic count (10^3/uL) | 14.2 ± 6.0 | 15.6 ± 7.0 | 0.50 |
| N/L ratio | 7.3 ± 5.2 | 6.4 ± 4.1 | 0.54 |
| Data were expressed in the form of mean ± SD and frequency (percentage). TIMI: Thrombolysis In Myocardial Infarction; IRA: Infarcted Related Artery; LAD: Left Anterior Descending; LCX: Left Circumflex; OM2: Obtuse Marginal 2; RCA: Right Coronary Artery; N/L ratio: Neutrophil/Lymphocytic Ratio. | |||
| Table 5: ROC curve of the longitudinal strain. | |
| Sample size | 40 |
| Positive groupa | 18 (45.00%) |
| Negative groupb | 22 (55.00%) |
| Disease prevalence (%) | 45.0 |
| Area under the ROC curve (AUC) | 0.729 |
| Standard Errora | 0.0818 |
| 95% Confidence intervalb | 0.565 to 0.857 |
| z statistic | 2.794 |
| Significance level P (Area = 0.5) | 0.0052 |
| Cutoff value | ≤ -15.6 |
| Sensitivity | 83.33 |
| Specificity | 63.64 |
| aRvaffect = 1; bRvaffect = 0 | |
ROC curve analysis showed that the cut-off value of the N/L ratio for predicting RVD by CMR was > 7.7 with sensitivity 38.89 and specificity 77.27 with a p value of 0.65, as shown in Figure 4 and Table 6.

Figure 4: ROC curve of N/L ratio for predicting RV affection by CMR.
| Table 6: ROC curve of N/L ratio. | |
| Sample size | 40 |
| Positive groupa | 18 (45.00%) |
| Negative groupb | 22 (55.00%) |
| Disease prevalence (%) | 45.0 |
| Area under the ROC curve (AUC) | 0.543 |
| Standard Errora | 0.0951 |
| 95% Confidence intervalb | 0.378 to 0.701 |
| z statistic | 0.451 |
| Significance level P (Area = 0.5) | 0.6518 |
| Cutoff value | > 7.7 |
| Sensitivity | 38.89 |
| Specificity | 77.27 |
| aRvaffect = 1; bRvaffect = 0 | |
Right ventricular dysfunction (RVD) can be observed in 30% to 50% of patients with inferior wall myocardial infarction (Inf-MI) and is usually associated with high mortality. Therefore, early detection of right ventricular myocardial involvement (RVMI) plays a key role in planning the most appropriate treatment strategy and determining a favorable prognosis [13,14]. Primary percutaneous coronary intervention (PPCI) succeeded in achieving lower mortality rates than thrombolytic therapy in patients with RVMI [15].
The advantages of RV free wall LS measurements include potential means to assess myocardial contractility that is less loads dependent and can be applied in a wide variety of diseases [16].
Strain also has the advantage of overcoming “tethering” or the movement of the diseased myocardium via pulling by the healthy myocardium surrounding it [17].
CMR is currently considered the reference standard for functional and volumetric RV studies. Therefore, as a part of our study, CMR was used to divide the study group into RVD and non RVD groups, which demarcated the risk factor for developing RVD among inf MI patients. In concordance with our study’s result, Yaylak, et al. and Mohamed, et al. showed no significant difference between the two groups regarding age, DM, and HTN [18,19].
Our results also showed that the patients with heart block were significantly higher in the group with RVD. In addition, in cases with RV MI, which matched with Santangelo, et al.’s study, bradyarrhythmias were significantly higher in the group with severe RVD [20].
In our study, RCA as the IRA had the largest ESV and the lowest EF, which appeared to be statistically significant.
Speckle tracking echo showed that the longitudinal strain was significantly lower in the group with RVD. ROC curve analysis showed LGS cut-off value was < -15.6 with sensitivity 83.3% and specificity of 63.6% with p value 0.005. In concordance, the result of our study is Kanar, et al. [21]. While standard echo, FAC in our study was significantly lower in the group with RV dysfunction with a p value of 0.03, which agreed with Santangelo, et al. study, FAC < 35% was a statistically significant p value < 0.001 [20].
Neutrophils are seen as a marker of ongoing inflammation, and lymphocytes as a marker of regulatory pathways. The neutrophil-to-lymphocyte ratio (NLR) (calculated via dividing neutrophil count by lymphocyte count) as an indication of systemic inflammation has been demonstrated to be associated with poor clinical outcomes in various cardiovascular diseases, including acute coronary syndrome (ACS). Furthermore, high NLR to be independently and strongly associated with increased risk of complications and mortality post-acute MI [22,23].
By using the ROC curve analysis, the N/L ratio was higher than the results of Yaylak, et al. and Mohamed, et al. as, in their studies, the RV function was assessed by TAPSE, which is load and angle-dependent [18,19]. Still, we used CMR to detect RV function, which has been established as the gold standard imaging method for assessing RV function and myocardial fibrosis [24,25].
RV dysfunction in inferior MI is better detected using cardiac magnetic resonance imaging. While LS in speckle tracking has higher sensitivity in detecting RV dysfunction, NLR has low sensitivity but high specificity for predicting RVD compared to CMR.
Limitations
The sample size was relatively small due to the difficulty in doing MRI by all the patients.
Inability to do gadolinium enhancement CMR due to financial issues.
- Wang JY, Goodman SG, Saltzman I, Wong GC, Huynh T, et al. Cardiovascular risk factors and in-hospital mortality in acute coronary syndromes: insights from the Canadian global registry of acute coronary events. Can J Cardiol. 2015; 31: 1455-1461. PubMed: https://pubmed.ncbi.nlm.nih.gov/26143140/
- Goldstein JA. Pathophysiology and management of right heart ischemia. J Am College Cardiol. 2002; 40: 841-853. PubMed: https://pubmed.ncbi.nlm.nih.gov/12225706/
- Mehta SR, Eikelboom JW, Natarajan MK, Diaz R, Yi C, Gibbons RJ, et al. Impact of right ventricular involvement on mortality and morbidity in patients with inferior myocardial infarction. J A Coll Cardiol. 2001; 37: 37-43. PubMed: https://pubmed.ncbi.nlm.nih.gov/11153770/
- Ali ER, Mohamad AM. Diagnostic accuracy of cardiovascular magnetic resonance imaging for assessment of right ventricular morphology and function in pulmonary artery hypertension. Egyptian J Chest Dis Tuberculosis. 2017; 66: 477-4786.
- Yeh DD, Foster E. Is MRI the preferred method for evaluating right ventricular size and function in patients with congenital heart disease? MRI is not the preferred method for evaluating right ventricular size and function in patients with congenital heart disease. Circ Cardiovasc Imaging. 2014; 7: 198-205. PubMed: https://pubmed.ncbi.nlm.nih.gov/24449549/
- Wu WC, Rathore SS, Wang Y, Radford MJ, Krumholz HM. Blood transfusion in elderly patients with acute myocardial infarction. New Engl J Med. 2001; 345: 1230-1236. PubMed: https://pubmed.ncbi.nlm.nih.gov/11680442/
- Lang RM, Badano LP, Mor-Avi V, Afilalo J, Armstrong A, et al. Recommendations for cardiac chamber quantification by echocardiography in adults: an update from the American Society of Echocardiography and the European Association of Cardiovascular Imaging. J Am Soc Echocardiogr. 2015; 28: 001-039. PubMed: https://pubmed.ncbi.nlm.nih.gov/25559473/
- Frangogiannis NG. The immune system and cardiac repair. Pharmacol Res. 2008; 58: 88-111. PubMed: https://pubmed.ncbi.nlm.nih.gov/18620057/
- Thygesen K. Alpert JS, Jaffe AS, Simoons ML, Chaitman BR, et al. Third universal definition of myocardial infarction. Eur Heart J. 2012; 33: 2551-2567. PubMed: https://pubmed.ncbi.nlm.nih.gov/22922414/
- Ibánez B, James S, Agewall S, Antunes MJ, Bucciarelli-Ducci C, et al. 2017 ESC Guidelines for the management of acute myocardial infarction in patients presenting with ST-segment elevation. Eur Heart J. 2018; 39:119-177. PubMed: https://pubmed.ncbi.nlm.nih.gov/28886621/
- Hudsmith LE, Petersen SE, Francis JM, Robson MD, Neubauer S. Normal human left and right ventricular and left atrial dimensions using steady state free precession magnetic resonance imaging. J Cardiovasc Magn Reson. 2005; 7: 775-782. PubMed: https://pubmed.ncbi.nlm.nih.gov/16353438/
- Maceira AM, Prasad SK, Khan M, Pennell DJ. Reference right ventricular systolic and diastolic function normalized to age, gender and body surface area from steady-state free precession cardiovascular magnetic resonance. Eur Heart J. 2006; 27: 2879-2888. PubMed: https://pubmed.ncbi.nlm.nih.gov/17088316/
- Kakouros N, Cokkinos DV. Right ventricular myocardial infarction: pathophysiology, diagnosis, and management. Postgrad Med J. 2010; 86: 719-728. PubMed: https://pubmed.ncbi.nlm.nih.gov/20956396/
- Galea N, Francone M, Carbone I, Cannata D, Vullo F, et al. Utility of cardiac magnetic resonance (CMR) in the evaluation of right ventricular (RV) involvement in patients with myocardial infarction (MI). Radiol Med. 2013; 119: 309-317. PubMed: https://pubmed.ncbi.nlm.nih.gov/24337758/
- Lupi-Herrera E, González-Pacheco H, Juárez-Herrera Ú, Espinola-Zavaleta N, Chuquiure-Valenzuela E, et al. Primary reperfusion in acute right ventricular infarction: An observational study. World J Cardiol. 2014; 6: 14-22. PubMed: https://pubmed.ncbi.nlm.nih.gov/24527184/
- Wu VC, Takeuchi M. Echocardiographic assessment of right ventricular systolic function. Cardiovasc Diagn Ther. 2018; 8: 70-79. PubMed: https://pubmed.ncbi.nlm.nih.gov/29541612/
- Mertens LL, Friedberg MK. Imaging the right ventricle—current state of the art. Nat Rev Cardiol. 2010; 7: 551-563. PubMed: https://pubmed.ncbi.nlm.nih.gov/20697412/
- Yaylak B, Ede H, Baysal E, Altıntas B, Akyuz S, et al. Neutrophil/lymphocyte ratio is associated with right ventricular dysfunction in patients with acute inferior ST-segment elevation myocardial infarction. Cardiol J. 2016; 23: 100-106. PubMed: https://pubmed.ncbi.nlm.nih.gov/26412608/
- Mohamed S, Khairat I, Seham F. The Association between Neutrophil to Lymphocyte Ratio and Systolic Right Ventricular Dysfunction in Patients with Acute Inferior ST-Segment Elevation Myocardial Infarction. Med J Cairo Univers. 2019; 87: 3181-3187.
- Santangelo S, Fabris E, Stolfo D, Merlo M, Vitrella G, et al. Right ventricular dysfunction in right coronary artery infarction: A primary PCI registry analysis. Cardiovasc Revasc Medi. 2020; 21: 189-194. PubMed: https://pubmed.ncbi.nlm.nih.gov/31189522/
- Kanar BG, Tigen MK, Sunbul M, Cincin A, Atas H, et al. The impact of right ventricular function assessed by 2‐dimensional speckle tracking echocardiography on early mortality in patients with inferior myocardial infarction. Clin Cardiol. 2018; 41: 413-418. PubMed: https://pubmed.ncbi.nlm.nih.gov/29577346/
- Ertem AG, Ozcelik F, Kasapkara HA, Koseoglu C, Bastug S, et al. Neutrophil lymphocyte ratio as a predictor of left ventricular apical Thrombus in patients with myocardial infarction. Korean Circ J. 2016; 46: 768-773. PubMed: https://pubmed.ncbi.nlm.nih.gov/27826334/
- Gul U, Kayani AM, Munir R, Hussain S. Neutrophil lymphocyte ratio: a prognostic marker in acute ST elevation myocardial infarction. J Coll Physicians Surg Pak. 2017; 27: 4-7. PubMed: https://pubmed.ncbi.nlm.nih.gov/28292359/
- Mewton N, Liu Chia Y, Croisille P, Bluemke D, Lima JA. Assessment of myocardial fibrosis with cardiac magnetic resonance. J Am Coll Cardiol. 2011; 57: 891–903. PubMed: https://pubmed.ncbi.nlm.nih.gov/21329834/
- Barranhas AD, Santos AS, Coelho-Filho OR, Marchiori E, Rochitte CE, et al. Cardiac magnetic resonance imaging in clinical practice. Radiol Bras. 2014; 47: 1-8.