
More Information
Submitted: August 30, 2021 | Approved: December 13, 2021 | Published: December 14, 2021
How to cite this article: Nargis N, Channabasappa S, Balakrishna N, Niharika S. A study to correlate the central corneal thickness to the severity of diabetic retinopathy and HbA1c levels in type 2 diabetes mellitus. Int J Clin Exp Ophthalmol. 2021; 5: 029-038.
DOI: 10.29328/journal.ijceo.1001041
Copyright Licence: © 2021 Nargis N, et al. This is an open access article distributed under the Creative Commons Attribution License, which permits unrestricted use, distribution, and reproduction in any medium, provided the original work is properly cited.
Keywords: Diabetic retinopathy; Central corneal thickness; HbA1c; Corneal endothelial morphology; Diabetes mellitus

A study to correlate the central corneal thickness to the severity of diabetic retinopathy and HbA1c levels in type 2 diabetes mellitus
Neha Nargis1* , Seema Channabasappa2, Nischala Balakrishna3 and Singri Niharika4
1Glaucoma Fellow, Sankara Eye Hospital, Shimoga, India
2Professor, Department of Ophthalmology, MS, Vydehi Institute of Medical Sciences & Research Centre, Bangalore, India
2Ophthalmology Resident, Vydehi Institute of Medical Sciences & Research Centre, Bangalore, India
4Glaucoma Fellow, Sankara Eye Hospital, Bangalore, India
*Address for Correspondence: Dr. Neha Nargis, Glaucoma Fellow, Sankara Eye Hospital, Thirthahalli, Shimoga, Karnataka, 577202, India, Email: dr.nehanargis@gmail.com
Background: Diabetic retinopathy (DR) is one of the most common causes of preventable blindness. Patients with Diabetes Mellitus (DM) develop not only DR but also corneal endothelial damage leading to anatomical and physiological changes in cornea. Central corneal thickness (CCT) is a key parameter of refractive surgery and Intraocular pressure (IOP) estimation. The role of CCT and higher glycemic index in DR needs to be researched upon.
Objectives: To identify the corneal endothelial morphology in patients with type 2 DM, to measure the Central Corneal thickness (CCT) in patients with type 2 Diabetes Mellitus, to assess the relationship of CCT with HbA1C levels in the study group and to correlate the CCT with the severity of Diabetic retinopathy in the study group.
Methods: A cross-sectional observational study was conducted between January 2018 and June 2019 in Vydehi Institute of Medical Sciences and Research Centre, Bangalore. The study included 100 subjects with type 2 DM for 5 years or more. Patients with comorbidities that may affect the severity of DR or alter CCT and other corneal endothelial parameters such as glaucoma, previous ocular surgery or trauma, corneal degenerations and dystrophies, chronic kidney disease and Hypertension were excluded. DR was assessed by dilated fundoscopy, fundus photography and optical coherence imaging of the macula and graded as per the Early Treatment of Diabetic Retinopathy Study (ETDRS) classification. CCT and other corneal endothelial parameters were measured through specular microscopy. Relevant blood investigations including blood sugar levels were done for all patients.
Statistical analysis: Relationship between CCT and grades of DR and HbA1c levels were established using the Chi-Square test. The level of significance was set at p < 0.05.
Results: The mean CCT in patients with no diabetic retinopathy, very mild and mild non-proliferative diabetic retinopathy (NPDR), moderate NPDR, severe and very severe NPDR and PDR was 526.62 ± 8.084 μm, 542.07 ± 8.713 μm, 562.16 ± 8.255 μm, 582.79 ± 7.368 μm and 610.43 ± 18.256 μm respectively. Analysis of the relationship between CCT and severity of DR showed a statistically significant positive correlation between the two parameters (Pearson r = 0.933, P=0.001). Beyond this, a correlation was found between all the corneal endothelial parameters and severity of DR. Multivariate analysis showed that advanced DR was positively correlated with CV (r = 0.917) and CCT (r = 0.933); while it was negatively correlated with ECD (r = -0.872) and Hex (r = -0.811).
A statistically significant correlation was also found between CCT and HbA1c. Also increasing age, duration of DM and higher glycemic index were positively correlated with severity of DR.
Conclusion: This study, by demonstrating a strong correlation between the central corneal thickness to the severity of DR and HbA1c levels emphasizes the importance of evaluation of corneal endothelial morphology in the early screening and diagnosis of microvascular complications of DM.
Diabetes continues to be a tremendous health burden in the world affecting about 415 million adults which is likely to reach 642 million in 2040 out of which 62.4 million people are living in India alone [1,2]. Type 2 DM or insulin-independent DM is the most common form of diabetes. DM is a major cause of preventable blindness in the world. An exponential increase in the global number of diabetics has resulted in a proportionate rise in long term vascular complications such as retinopathy. Patients with DR are 25 times more likely to turn blind than non-diabetics [1]. Almost half of the diabetics globally have some degree of DR at any given point of time [2]. DR is categorised as NPDR or PDR based on neovascularisation into the vitreous through a break in the internal limiting membrane.
Patients with DM develop not only Diabetic retinopathy (DR) but also corneal endothelial damage. Corneal endothelium in diabetics is under continuous metabolic stress causing change in endothelial parameters. CCT is an important indicator for the functioning of corneal endothelium pump. It is a key parameter of refractive surgery and estimation of IOP. Rajesh et al suggested that hyperglycemia altered endothelial structure leading to hydration of cornea thus increasing the corneal thickness [4]. Several studies suggested CCT and endothelial parameters did not significantly correlate with HbA1c and severity of DR [5-7], whereas some studies showed CCT was significantly correlated with HbA1c [4,8].
Our study aims to correlate CCT and corneal endothelial changes with the DR status and HbA1c levels in type 2 DM. With this study results it will be possible to recommend routine assessment of CCT and corneal endothelium especially in conditions like glaucoma assessment and prior to keratorefractive procedures in type 2 DM hence preventing visual disability by early detection and management.
One of the main difficulties in establishing whether there is a relationship between the degree of hyperglycemia and the long-term complications of diabetes including DR is the lack of a reliable and objective method for assessing diabetic control. Blood, urine glucose and urine ketone testing do not provide the clinicians with a quantitative and reliable measure of glycemia over an extended period of time. Recordings of glycated proteins, primary hemoglobin and serum proteins have added a new dimension to the glycemic assessment. HbA1c can give us a quantitative estimate of the average glycemia over weeks and months.
HbA1c has been known to be a marker to assess the long-term control of DM. Studies in the past have shown that HbA1c levels could be associated with the severity of DR as well, but only few studies have shown correlation between HbA1c with the different grades of DR and CCT. Hence, this study is being conducted to study the effect of diabetes on CCT (obtained using a specular microscope) and to correlate CCT with the severity of DR and HbA1c. It can indicate the importance of early screening and diagnosis of CCT and corneal endothelial parameters in patients with DR and necessary therapeutic intervention in order to prevent undue ocular damage and blindness in patients with type 2 DM.
Study design: It is a cross-sectional study.
Period: The period of study was from January 2018 to June 2019.
Source of data: Clinically Diagnosed Cases of type-2 Diabetes Mellitus fulfilling the inclusion and exclusion criteria visiting the Ophthalmology out-patient department as well as those admitted under the departments of Ophthalmology, and General Medicine at Vydehi Institute of Medical Sciences and Research Centre, Whitefield, Bangalore.
Sampling procedure: Out of the patients visiting OPD, 100 patients with clinically diagnosed type 2 DM who fulfilled the selection criteria and gave written informed consent were included in the study by simple random sampling.
Selection criteria
Inclusion criteria: Diagnosed cases of Type 2 diabetes mellitus (cut off parameters - FBS >126, PPBS >200) aged 40-60 years, greater than 5 years’ duration.
Exclusion criteria: 1) Glaucoma 2) Previous ocular surgery or trauma 3) Corneal diseases or dystrophies or degeneration. 4) Contact lens wearers 5) Patients on topical medications 6) Tear film interfering systemic drugs (hormone replacement or antihistaminics) 7) Impaired tear function - RA or SLE 8) Axial myopes, retinal degeneration and dystrophies 9) Treated cases of Diabetic Retinopathy 10) Anemia 11) Systemic hypertension 12) Chronic kidney disease 13) Optic atrophy.
Ethical clearance: Prior to commencement of the study, ethical clearance was obtained from the Institutional Ethical Committee - VIEC/2016/APP/152.
Methods of data collection: Informed written consent of the participant was taken. History and baseline data were collected using a pre-structured proforma.
Ophthalmological examination:
1. Best-corrected visual acuity was recorded using Snellen’s visual acuity chart for distance and Jaeger’s chart for near vision.
2. Wet Refraction and axial length measurement using A-scan.
3. Intraocular pressure was measured by Goldmann applanation tonometry.
4. Slit lamp examination of the anterior and posterior segment was done.
5. Pupils of both eyes were dilated with tropicamide eye drops followed by:
-
➣ A detailed fundus examination of both eyes under the slit lamp using 78D and 90D lenses
➣ Indirect ophthalmoscopy using +20D lens
➣ 7 field fundus photography and
➣ Spectral Domain Optical Coherence Tomography imaging of the macula was done if required
➣ Fundus fluorescein angiography and gonioscopy were done when indicated.
6. Specular microscopy (KONAN CELL CHEK): The following corneal endothelial parameters were recorded using fixed frame analysis. Quantitative analysis of cell count was done by corner method. The parameters recorded were:
- Endothelial cell density (ECD) in cells/mm2
- Coefficient of variation (CV)
- Percentage of Hexagonality (HEX)
- Cell Area (NUM)
- Central corneal thickness (CCT) in μm
Fundus findings among cases were classified according to the early treatment for diabetic retinopathy study (ETDRS) classification.
Diabetic Retinopathy grading done as per the Abbreviated “Early Treatment Diabetic Retinopathy Study (ETDRS) classification.”
-
➣ Non-Proliferative Diabetic Retinopathy (NPDR)
I. Very mild NPDR: Microaneurysms only.
II. Mild NPDR: Any or all of microaneurysms, retinal hemorrhages, exudates, cotton wool spots, up to the level of moderate NPDR. No intraretinal microvascular anomalies (IRMA) or significant beading.
III. Moderate NPDR:
-
• Severe retinal hemorrhages (about 20 medium-large per quadrant) in 1-3 quadrants or mild IRMA
• Significant venous beading in no more than 1 quadrant
• Cotton wool spots commonly present
IV. Severe NPDR: (4-2-1 rule) one of
-
• Severe hemorrhages in all 4 quadrants
• Significant venous beading in 2 or more quadrants
• Moderate IRMA in one or more quadrants
V. Very severe NPDR: 2 or more of the criteria for severe NPDR
-
➣ Proliferative diabetic retinopathy (PDR)
I. Mild-moderate PDR: Neovascularization of the disc (NVD) or neovascularization elsewhere (NVE), but extent insufficient to meet the high –risk criteria.
II. High-risk PDR:
-
• NVD (about 1/3-disc area)
• Any NVD with vitreous hemorrhage
• NVE greater than ½ disc area with vitreous hemorrhage
Clinically significant macular edema (CSME) as defined in the ETDRS: [15].
-
• Retinal thickening within 500 μm of the centre of the macula
• Hard exudates within 500 μm of the centre of the macula associated with adjacent retinal thickening
• Retinal thickening of 1-disc area or more, any part of which is within 1 disc diameter of the centre of the macula
Other investigation done based on the need of the patient care:
Blood investigations
1) Sugar profile: FBS, PPBS, HBA1c, RBS
2) Blood urea, Serum creatinine
3) ESR
4) Haemoglobin %
At the end of 15 months, the collected data were tabulated, statistically analyzed, and the severity of Type 2 DM was correlated with corneal morphology using the parameters of the specular microscope.
Outcome variables
1. The Endothelial cell morphology and CCT in Type 2 DM will be known.
2. Relationship between CCT and grade of diabetic retinopathy will be established.
3. The association of HbA1c values with CCT will be established.
Statistical analysis
Data was entered in MS Excel file and statistically analyzed using Statistical Package for Social Sciences [SPSS] version 20. [IBM SPASS statistics (IBM corp. Armonk, NY, USA released 2011)].
Descriptive statistics: Descriptive statistics of the explanatory and outcome variables was calculated by mean, standard deviation for quantitative variables, frequency and proportions for qualitative variables.
Inferential statistics
1) Chi square test was used to test the significance between qualitative variables. 2) Unpaired t test was used to test the significant difference for quantitative variables between two groups. 3) ANOVA test was used to test the significant difference for quantitative variables for more than 2 groups. 4) Pearson correlation was applied to test the correlation between two quantitative variables. 5) The level of significance was set at p - value < 0.05.
Sample size of estimation: Assuming an absolute precision of 8% required sample size has been calculated as 71 (alpha error 8%). In this study we took a sample size of 100 patients.
Sample size calculated by using formula -
n = {[z]2[ (1-α/2)] σ2 }/d2
Where, SD = 34.3, Absolute precision = 8%, Required sample size = 71, σ = SD, d = precision, CI = z(1-α/2), Confidence Interval = 95%.
The present study to correlate the Central Corneal thickness to the severity of Diabetic Retinopathy and HbA1c levels in type 2 Diabetes Mellitus included 100 patients who fulfilled the selection criteria and gave written informed consent. For statistical analysis, the mean of the two eyes was considered and ETDRS grades of very mild and mild NPDR were grouped together and severe and very severe NPDR were grouped together.
As depicted in Graph 1, in our study 62% of the patients were males and 38% of the patients were females.
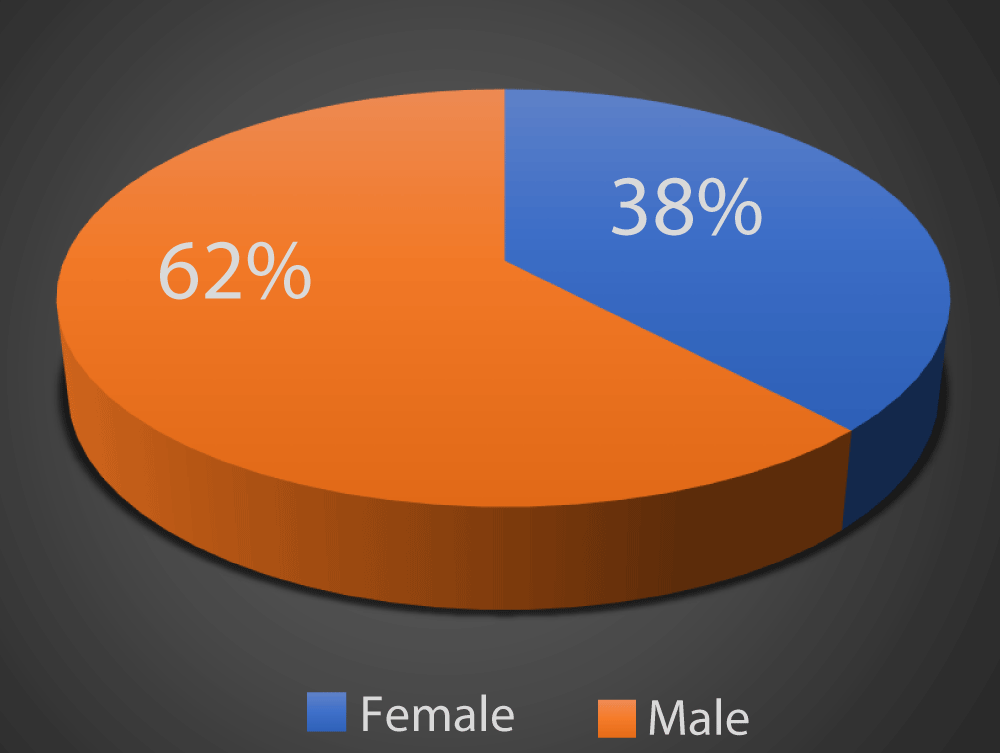
Graph 1: Distribution of study subjects according to gender.
Graph 2 shows that out of the 100 diabetic patients in our study, 8 patients were between 40-45 years, 25 patients were between 46-49 years, 31 patients were between 50-54 years while 36 patients were between 55-60 years.
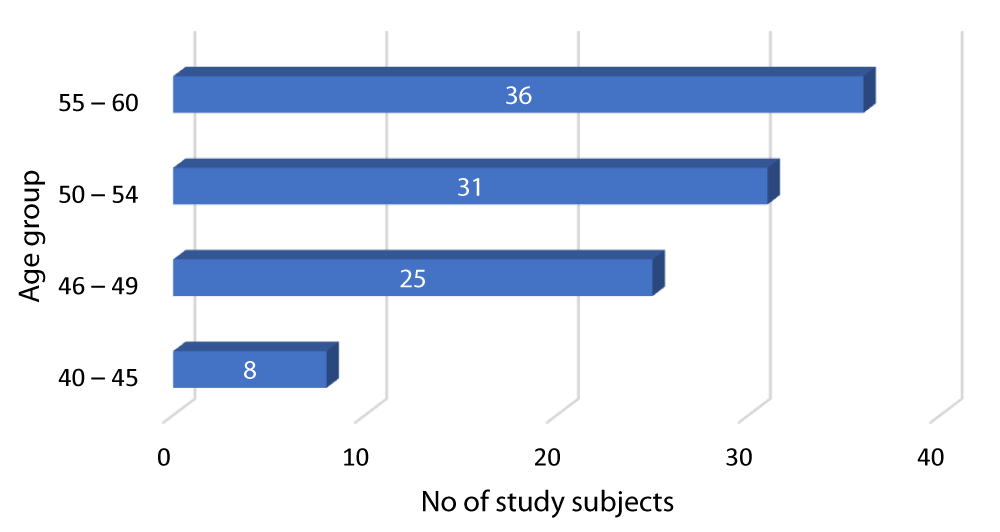
Graph 2: Distribution of diabetes according to Age group of the study subjects.
Table 1 shows that in our study, 84 patients had Type 2 DM since 5-10 years, while the remaining 16 patients had diabetes for over 10 years.
| Table 1: Distribution of study subjects according to duration of diabetes | ||
| Duration of diabetes (in years) | Frequency | Percent |
| > 5 – 10 | 84 | 84.0 |
| > 10 | 16 | 16.0 |
| Total | 100 | 100.0 |
Graph 3 shows the mean HbA1c of patients with HbA1c between 4-5.6 is 5.1 with a SD of 0.34, the mean HbA1c of patients with HbA1c between 5.61-6.5 is 6 with a SD of 0.23, and the mean HbA1c of patients with HbA1c > 6.5 is 8.5 with a SD of 1.09 (Table 2).
| Table 2: Frequency, Mean and SD of HbA1c levels of study subjects. | ||||
| HbA1c | Frequency | Percent | Mean | Standard Deviation |
| 4 - 5.6 | 35 | 35% | 5.1 | 0.34 |
| 5.61 - 6.5 | 31 | 31% | 6.0 | 0.23 |
| > 6.5 | 34 | 34% | 8.5 | 1.09 |
| Total | 100 | 100.0% | 6.5 | 1.60 |
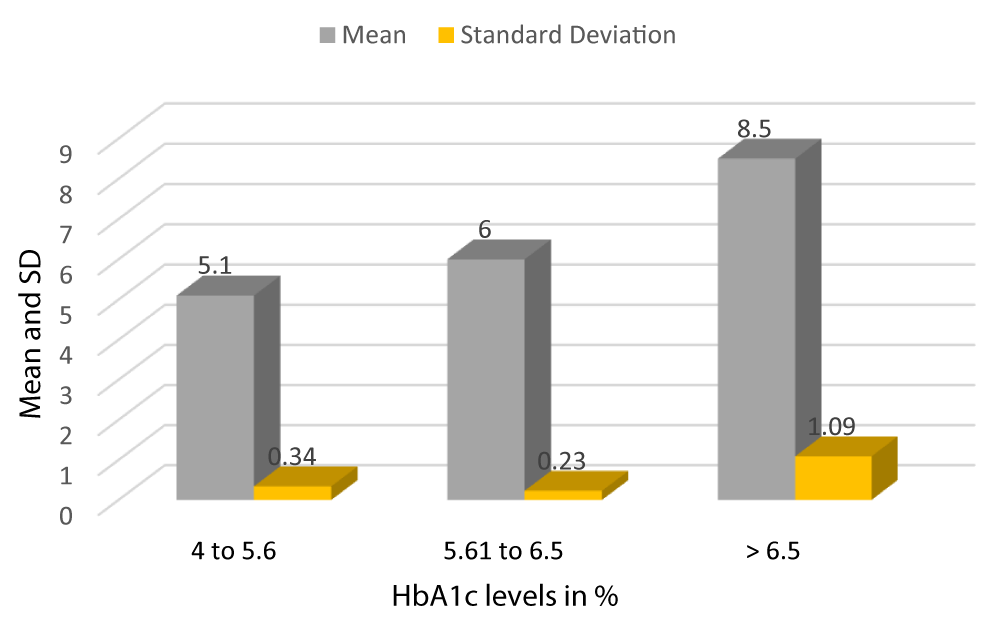
Graph 3: Mean and SD of HbA1c of Study subjects.
As depicted in Graph 4, out of the 100 patients with Type-2 DM, 21 patients had no diabetic retinopathy, 28 patients had very mild and mild NPDR, 25 patients had Moderate NPDR, 19 patients had Severe and very severe NPDR while 7 patients had PDR.
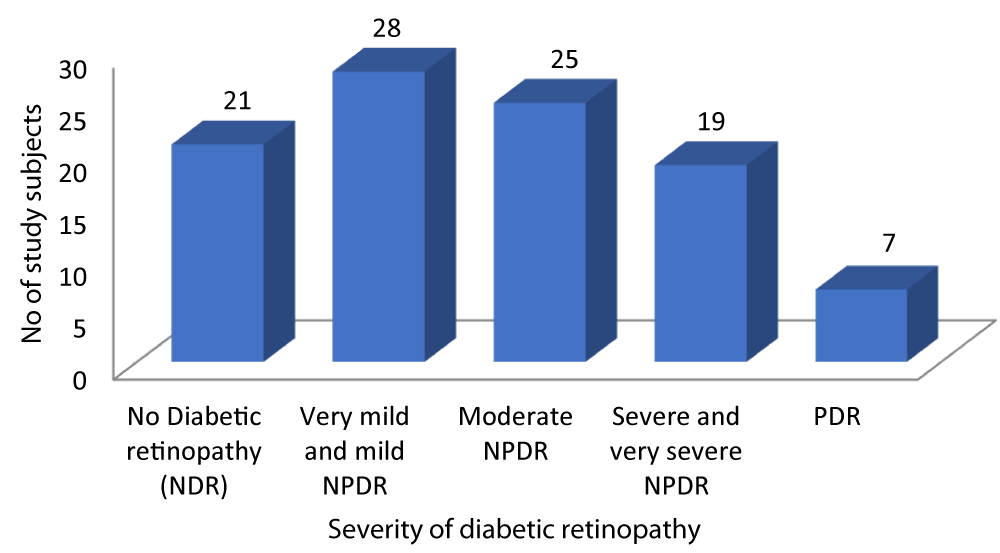
Graph 4: Distribution of patients according to Severity of diabetic retinopathy.
According to Table 3 and Graph 5, all patients with no diabetic retinopathy, very mild and mild NPDR and moderate NPDR had diabetes of duration between 5-10 years. Out of the 19 patients with severe and very severe NPDR, 7 patients had diabetes of duration 5-10 years and 12 patients had diabetes of duration greater than 10 years. Out of the 7 patients with PDR, 3 patients had diabetes of duration 5-10 years and 4 patients had diabetes of duration greater than 10 years. The above observation was statistically significant (p - value = 0.01). There was a positive correlation between duration of DM and severity of DR (r - value 0.817).
| Table 3: Correlation of duration of diabetes and severity of diabetic retinopathy. | ||||||
| Severity of diabetic retinopathy | Duration of DM | Total | Chi square | r - value | p - value | |
| 5-10 years | > 10 years | |||||
| No Diabetic retinopathy |
21 | 0 | 21 | 54.35 | 0.817 | 0.001 |
| 25.0% | 0.0% | 21.0% | ||||
| Very mild and mild NPDR | 28 | 0 | 28 | |||
| 33.3% | 0.0% | 28.0% | ||||
| Moderate NPDR | 25 | 0 | 25 | |||
| 29.8% | 0.0% | 25.0% | ||||
| Severe and very severe NPDR | 7 | 12 | 19 | |||
| 8.3% | 75.0% | 19.0% | ||||
| PDR | 3 | 4 | 7 | |||
| 3.6% | 25.0% | 7.0% | ||||
| Total | 84 | 16 | 100 | |||
| 100.0% | 100.0% | 100.0% | ||||
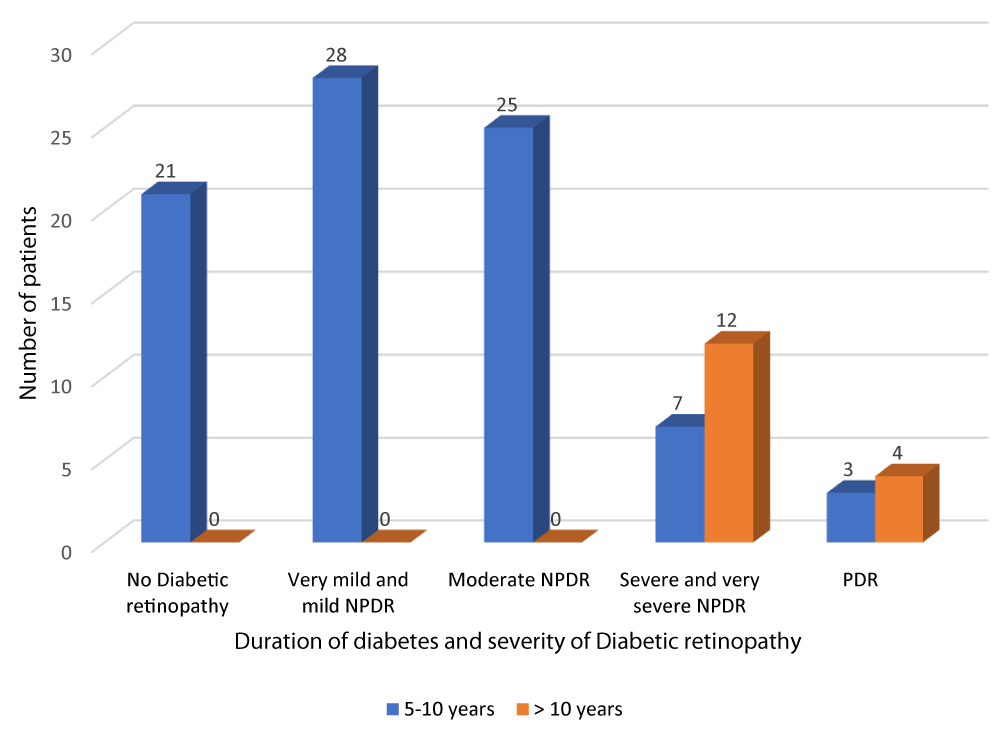
Graph 5: Correlation of duration of diabetes and severity of diabetic retinopathy.
Table 4 and Graph 6 shows out of the 100 diabetic patients evaluated, the mean age of patients with no diabetic retinopathy was 46.57 ± 4.434 years. The mean age of patients with very mild and mild NPDR was 50.54 ± 3.873 years. The mean age of patients with moderate NPDR was 53.52 ± 3.164 years. The mean age of patients with severe and very severe NPDR was 57 ± 3.109 years. The mean age of patients with PDR was 58.14 ± 1.215 years. This observation was statistically significant (p - value = 0.01). Our study found a positive correlation between age and severity of DR (r - value 0.731).
| Table 4: Correlation between age and Severity of diabetic retinopathy. | |||||||
| Severity of Diabetic retinopathy | Age (years) | 95% CI | F - value | r - value | p - value | ||
| Mean | SD | Lower Bound | Upper Bound | ||||
| No Diabetic retinopathy | 46.57 | 4.434 | 44.55 | 48.59 | 28.616 | 0.731 | 0.001 |
| Very mild and mild NPDR | 50.54 | 3.873 | 49.03 | 52.04 | |||
| Moderate NPDR | 53.52 | 3.164 | 52.21 | 54.83 | |||
| Severe and very severe NPDR | 57.00 | 3.109 | 55.50 | 58.50 | |||
| PDR | 58.14 | 1.215 | 57.02 | 59.27 | |||
| Total | 52.21 | 5.215 | 51.18 | 53.24 | |||
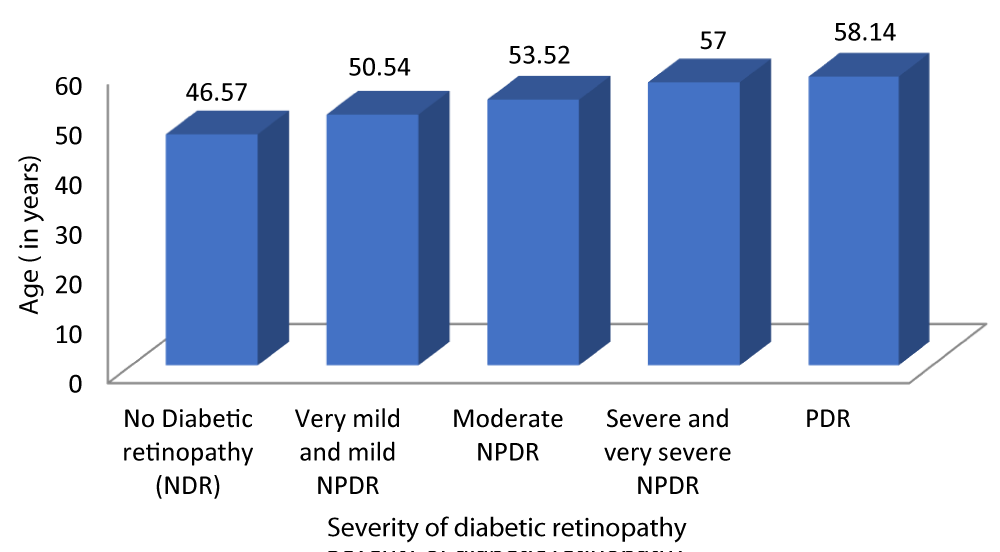
Graph 6: Correlation between age and Severity of diabetic retinopathy.
Table 5 and Graph 7 shows the mean HbA1c in patients with no diabetic retinopathy was 5.05%. The mean HbA1c in patients with very mild and mild NPDR was 5.64%. The mean HbA1c in patients with moderate NPDR was 6.36%. The mean HbA1c in patients with severe and very severe NPDR was 8.26%. The mean HbA1c in patients with severe PDR was 9.86%. With a p - value of 0.01 which was statistically significant and a r - value of 0.887 our study was able to establish a strongly positive correlation between HbA1c and severity of DR.
| Table 5: Correlation between HbA1c and Severity of diabetic retinopathy. | |||||||
| Severity of Diabetic retinopathy | HbA1c (%) | 95% CI | F - value | r - value | p - value | ||
| Mean | SD | Lower Bound | Upper Bound | ||||
| No Diabetic retinopathy | 5.05 | .384 | 4.87 | 5.22 | 128.139 | 0.887 | 0.001 |
| Very mild and mild NPDR | 5.64 | .488 | 5.45 | 5.83 | |||
| Moderate NPDR | 6.36 | .860 | 6.00 | 6.72 | |||
| Severe and very severe NPDR | 8.26 | .452 | 8.05 | 8.48 | |||
| PDR | 9.86 | 1.069 | 8.87 | 10.85 | |||
| Total | 6.49 | 1.560 | 6.18 | 6.80 | |||
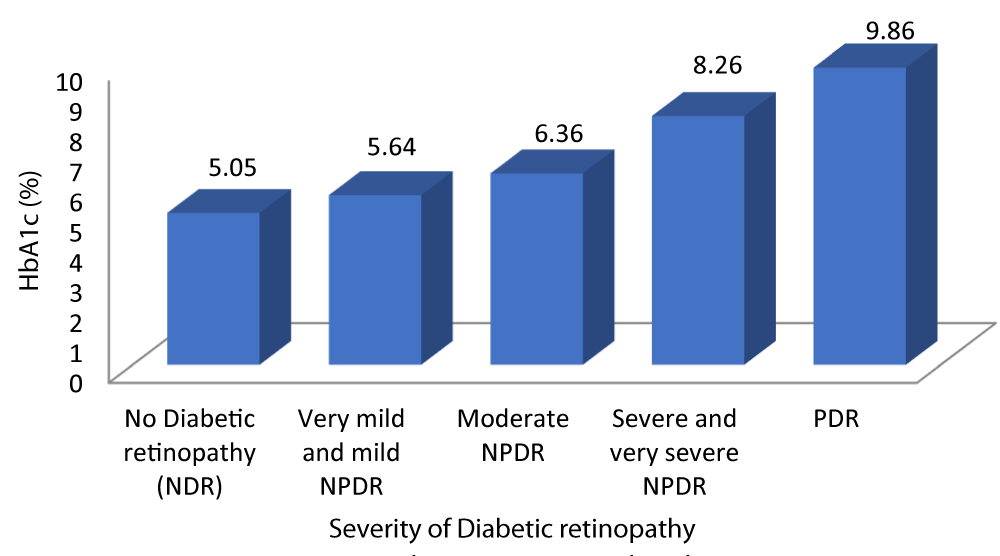
Graph 7: Shows increased HbA1c levels with increased Severity of diabetic retinopathy.
Table 6 and Graph 8 shows the mean duration for which patients with no diabetic retinopathy have been diabetic is 6.52 years. The mean duration for which patients with very mild and mild NPDR have been diabetic is 6.96 years. The mean duration for which patients with moderate NPDR have been diabetic is 8.76 years. The mean duration for which patients with severe and very severe NPDR have been diabetic is 11.63 years. The mean duration for which patients with PDR have been diabetic is 12.14 years. This observation was statistically significant (p - value = 0.001) showing advanced stages of DR was associated with increased duration of diabetes.
| Table 6: Association between Severity of diabetic retinopathy and duration of diabetes. | ||||||
| Severity of Diabetic retinopathy | Duration of diabetes (years) | 95% CI | f - value | p - value | ||
| Mean | SD | Lower Bound | Upper Bound | |||
| No Diabetic retinopathy | 6.52 | .750 | 6.18 | 6.87 | 63.585 | 0.001 |
| Very mild and mild NPDR | 6.96 | .922 | 6.61 | 7.32 | ||
| Moderate NPDR | 8.76 | 1.165 | 8.28 | 9.24 | ||
| Severe and very severe NPDR | 11.63 | 1.892 | 10.72 | 12.54 | ||
| PDR | 12.14 | 2.193 | 10.11 | 14.17 | ||
| Total | 8.57 | 2.438 | 8.09 | 9.05 | ||
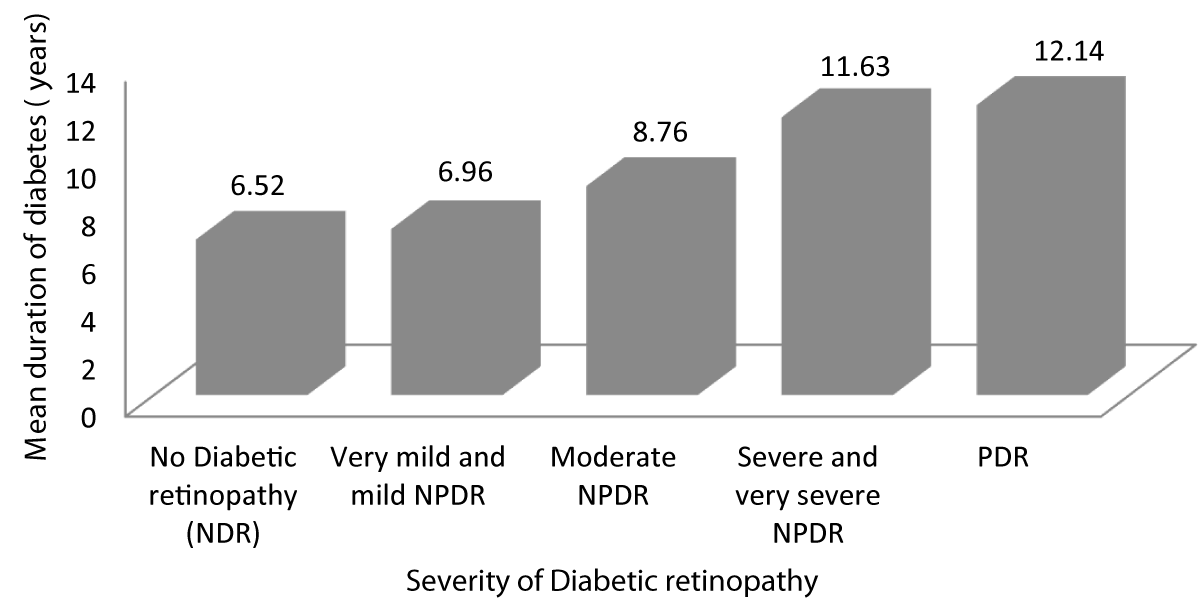
Graph 8: Shows increased Severity of diabetic retinopathy with increased duration of diabetes.
Table 7 and Graph 9 depicts the mean CCT for patients with no diabetic retinopathy was 526.62 ± 8.084. The mean CCT for patients with very mild and mild NPDR was 542.07 ± 8.713. The mean CCT for patients with very moderate NPDR was 562.16 ± 8.255. The mean CCT for patients with severe and very severe NPDR was 582.79 ± 7.368. The mean CCT for patients with PDR was 610.43 ± 18.256. Analysis of the relationship between CCT and severity of DR showed a statistically significant positive correlation between the two parameters (Pearson r = 0.933, p = 0.001).
| Table 7: Correlation between CCT and Severity of diabetic retinopathy. | |||||||
| Severity of Diabetic retinopathy | CCT (µm) | 95% CI | f - value | r - value | p - value | ||
| Mean | SD | Lower Bound | Upper Bound | ||||
| No Diabetic retinopathy | 526.62 | 8.084 | 522.94 | 530.30 | 175.444 | 0.933 | 0.001 |
| Very mild and mild NPDR | 542.07 | 8.713 | 538.69 | 545.45 | |||
| Moderate NPDR | 562.16 | 8.255 | 558.75 | 565.57 | |||
| Severe and very severe NPDR | 582.79 | 7.368 | 579.24 | 586.34 | |||
| PDR | 610.43 | 18.256 | 593.54 | 627.31 | |||
| Total | 556.37 | 25.983 | 551.21 | 561.53 | |||
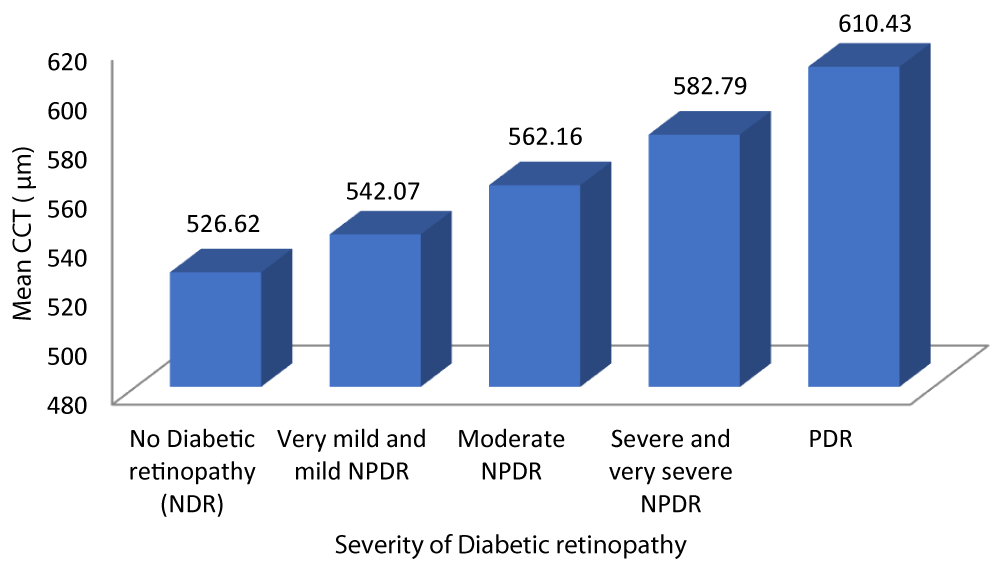
Graph 9: Variation of CCT with Severity of diabetic retinopathy.
| Table 8: Correlation between ECD and Severity of diabetic retinopathy. | |||||||
| Severity of diabetic retinopathy | ECD (cells/mm2) | 95% CI | F - value | r - value |
p - value |
||
| Mean | SD | Lower Bound | Upper Bound | ||||
| No Diabetic retinopathy | 2657.62 | 160.475 | 2584.57 | 2730.67 | 100.508 | -0.872 | 0.001 |
| Very mild and mild NPDR | 2409.86 | 85.739 | 2376.61 | 2443.10 | |||
| Moderate NPDR | 2274.52 | 37.521 | 2259.03 | 2290.01 | |||
| Severe and very severe NPDR | 2160.74 | 48.008 | 2137.60 | 2183.88 | |||
| PDR | 2096.86 | 22.843 | 2075.73 | 2117.98 | |||
| Total | 2358.81 | 204.576 | 2318.22 | 2399.40 | |||
Table 8 and graph 10 summarizes the data for correlation between ECD and severity of DR. The patients with no diabetic retinopathy had a mean ECD of 2657.62 cells/mm2. The patients with very mild and mild NPDR had a mean ECD of 2409.86 cells/mm2. The patients with moderate NPDR had a mean ECD of 2274.52 cells/mm2. The patients with severe and very severe NPDR had a mean ECD of 2160.74 cells/mm2. The patients with PDR had a mean ECD of 2096.86 cells/mm2. Analysis of the relationship between ECD and severity of DR showed a statistically significant negative correlation between the two parameters (Pearson r = -0.872, p = 0.001).
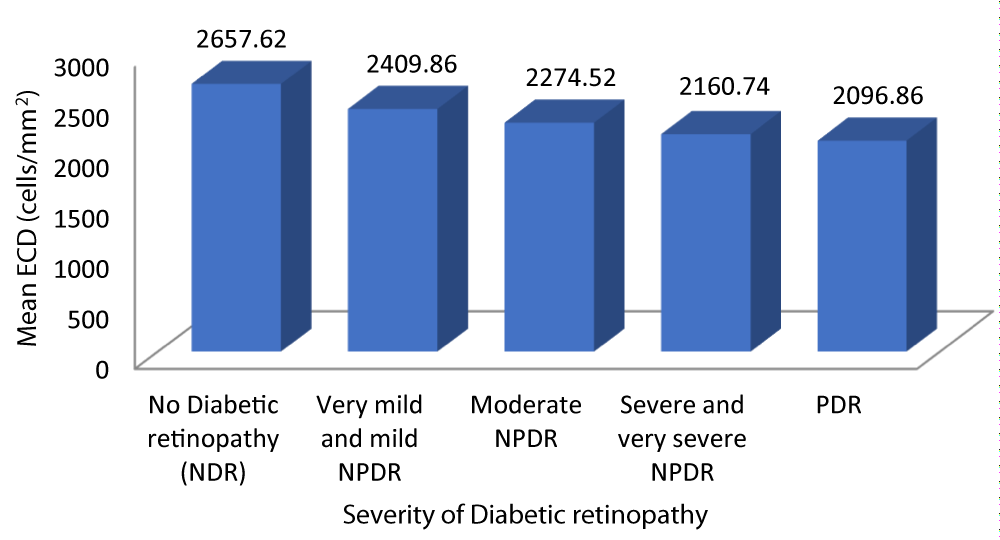
Graph 10: Shows decreasing ECD with increased Severity of diabetic retinopathy.
Table 9 and Graph 11 depicts the patients with no diabetic retinopathy had a mean CV of 33 ± 2.470. The patients with very mild and mild NPDR had a mean CV of 39.82 ± 2.178. The patients with moderate NPDR had a mean CV of 43 ± 1.878. The patients with severe and very severe NPDR had a mean CV of 48.11 ± 2.470. The patients with PDR had a mean CV of 50.14 ± 2.854. With a p - value of 0.001 which was statistically significant and a r - value of 0.917 our study was able to establish a strongly positive correlation between CV and severity of DR.
| Table 9: Correlation between CV and Severity of diabetic retinopathy. | |||||||
| Severity of diabetic retinopathy | CV (%) | 95% CI | f - value | r - value | p-value | ||
| Mean | SD | Lower Bound | Upper Bound | ||||
| No Diabetic retinopathy | 33.00 | 2.470 | 31.88 | 34.12 | 145.062 | 0.917 | 0.001 |
| Very mild and mild NPDR | 39.82 | 2.178 | 38.98 | 40.67 | |||
| Moderate NPDR | 43.12 | 1.878 | 42.34 | 43.90 | |||
| Severe and very severe NPDR | 48.11 | 2.470 | 46.91 | 49.30 | |||
| PDR | 50.14 | 2.854 | 47.50 | 52.78 | |||
| Total | 41.51 | 5.952 | 40.33 | 42.69 | |||
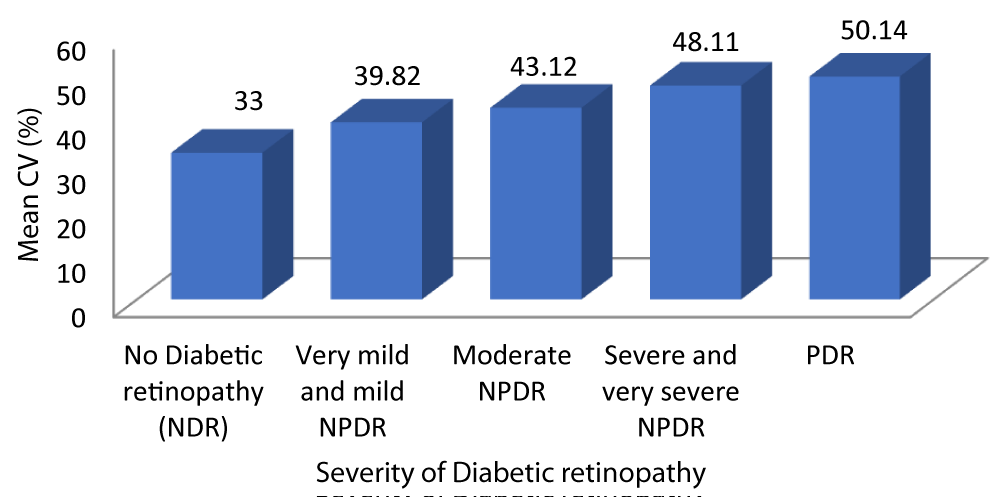
Graph 11: Correlation between CV and Severity of diabetic retinopathy.
Table 10 and Graph 12 depicts that the patients with no diabetic retinopathy had a mean HEX of 45.76 ± 5.069. The patients with very mild and mild NPDR had a mean HEX of 39.79 ± 3.614. The patients with moderate NPDR had a mean HEX of 35.72 ± 3.410. The patients with severe and very severe NPDR had a mean HEX of 31.47 ± 2.736. The patients with PDR had a mean HEX of 30.14 ± 1.069. With a p - value of 0.001 which was statistically significant and a r - value of -0.811 our study was able to establish a strongly negative correlation between hexagonality of cells and severity of DR.
| Table 10: Correlation between Hexagonality of cells and Severity of diabetic retinopathy. | |||||||
| Severity of diabetic retinopathy | HEX (%) | 95% CI | f - value | r - value | p - value | ||
| Mean | SD | Lower Bound | Upper Bound | ||||
| No Diabetic retinopathy | 45.76 | 5.069 | 43.45 | 48.07 | 50.198 | -0.811 | 0.001 |
| Very mild and mild NPDR | 39.79 | 3.614 | 38.38 | 41.19 | |||
| Moderate NPDR | 35.72 | 3.410 | 34.31 | 37.13 | |||
| Severe and very severe NPDR | 31.47 | 2.736 | 30.16 | 32.79 | |||
| PDR | 30.14 | 1.069 | 29.15 | 31.13 | |||
| Total | 37.77 | 6.363 | 36.51 | 39.03 | |||
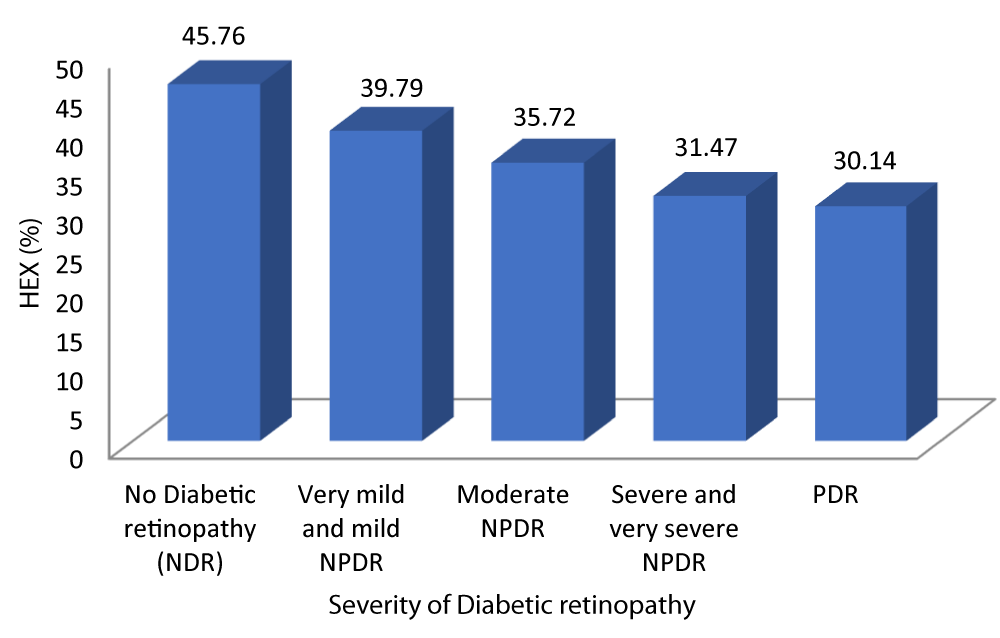
Graph 12: Shows decreased Hexagonality of cells with increasing Severity of diabetic retinopathy.
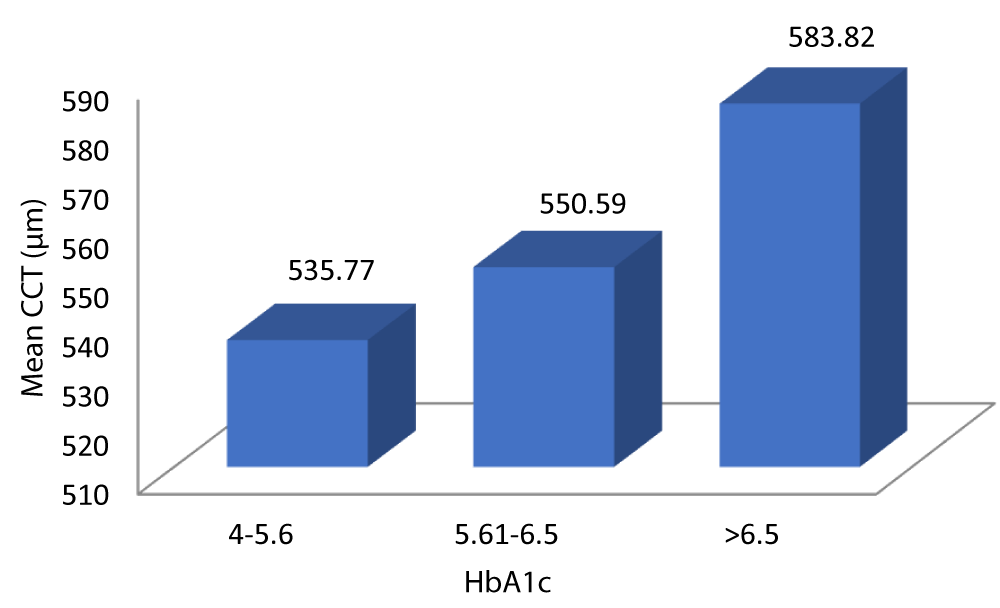
Table 11 and Graph 13 summarizes the data for correlation between CCT and glycemic control. The patients with HbA1c 4-5.6 had a mean CCT of 535.77 µm. The patients with HbA1c 5.61-6.5 had a mean CCT of 550.59 µm. The patients with HbA1c > 6.5 had a mean CCT of 583.82 µm. The above observation was statistically significant (p - value = 0.001). Analysis of the relationship between CCT and HbA1c in our study showed a statistically significant positive correlation between the two parameters (Pearson = 0.856, p = 0.001).
| Table 11: Correlation between CCT and HbA1c. | |||||||
| HbA1c (%) | CCT (µm) | 95% CI | f - value | r - value | p - value | ||
| Mean | Std. Dev | Lower Bound | Upper Bound | ||||
| 4 - 5.6 | 535.77 | 13.632 | 531.09 | 540.45 | 75.906 | 0.856 | 0.001 |
| 5.61 - 6.5 | 550.59 | 14.659 | 545.31 | 555.88 | |||
| > 6.5 | 583.82 | 20.215 | 576.65 | 590.99 | |||
| Total | 556.37 | 25.983 | 551.21 | 561.53 | |||
Graph 13: Demonstrates the variation of CCT with HbA1c.
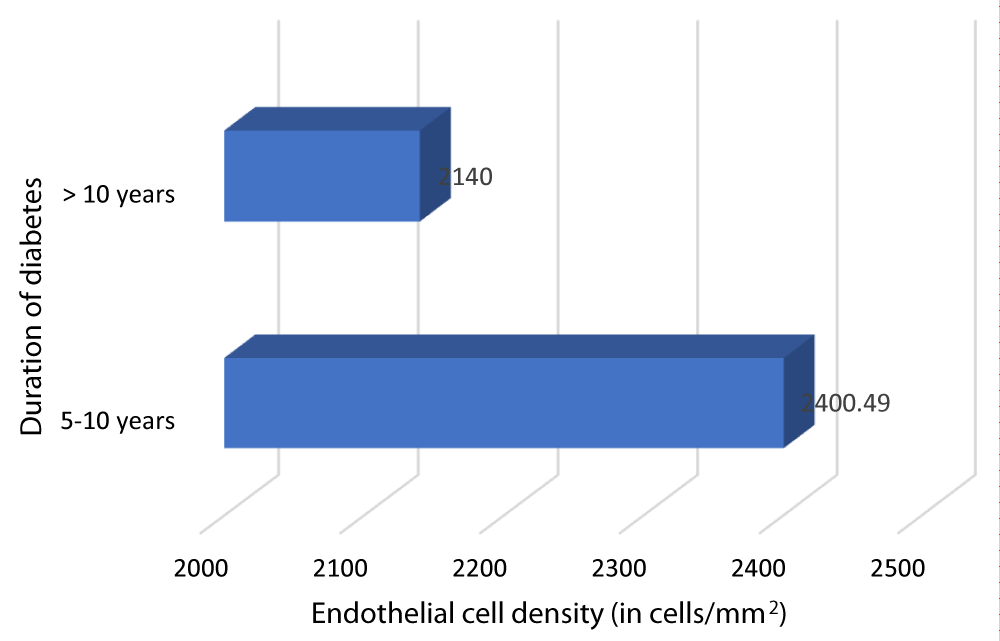
Table 12 and Graph 14 depicts the relationship between ECD and duration of DM. The patients with DM of duration 5-10 years had a mean ECD of 2400.49 cells/mm2. The patients with DM of duration > 10 years had a mean ECD of 2140 cells/mm2. Our study showed a statistically significant negative correlation between ECD and duration of DM (Pearson r = -0.698, p = 0.001).
| Table 12: Correlation between ECD and Durationof DM. | ||||||
| Duration of DM (in years) |
N | ECD (cells/mm2) | Mean diff | r - value | p - value | |
| Mean | SD | |||||
| 5- 10 | 84 | 2400.49 | 196.08 | 260.488 | -0.698 | 0.001 |
| >10 | 16 | 2140 | 51.7687 | |||
Graph 14: Variation of ECD with Duration of DM.
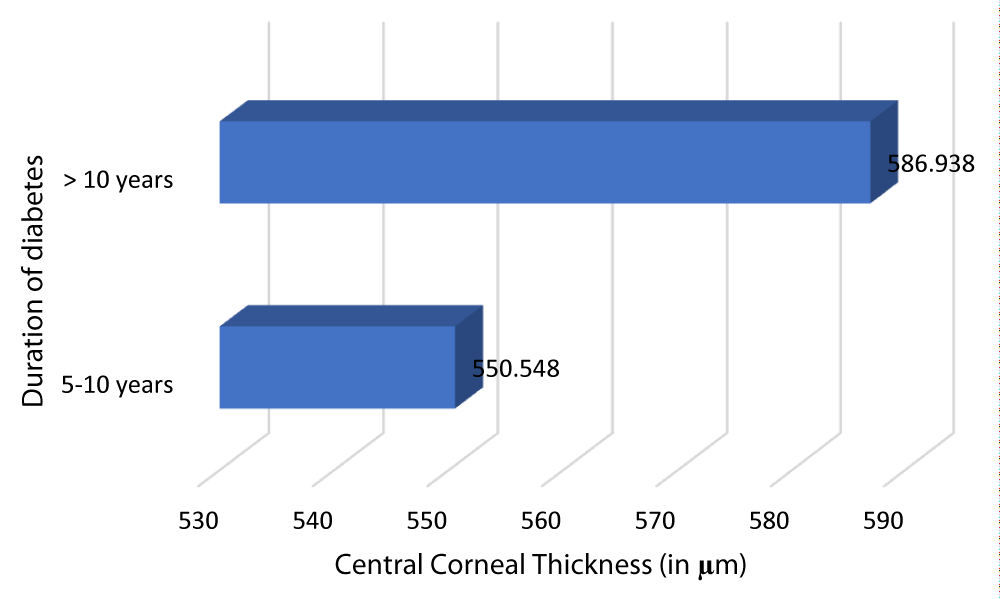
Table 13 and Graph 15 summarizes the patients with DM of duration 5-10 years had a mean CCT of 550.548 µm. The patients with DM of duration > 10 years had a mean CCT of 586.938 µm. This observation was statistically significant (p - value = 0.001) with a r - value of 0.757, hence establishing a positive correlation between CCT and duration of DM.
| Table 13: Correlation between CCT and Duration of DM. | ||||||
| Duration of DM (in years) |
N | CCT (µm) | Mean diff | r - value | p - value | |
| Mean | SD | |||||
| 5-10 | 84 | 550.548 | 23.7128 | -36.39 | 0.757 | 0.001 |
| >10 | 16 | 586.938 | 12.567 | |||
Graph 15: Depicts an increased CCT and with increased Duration of DM.
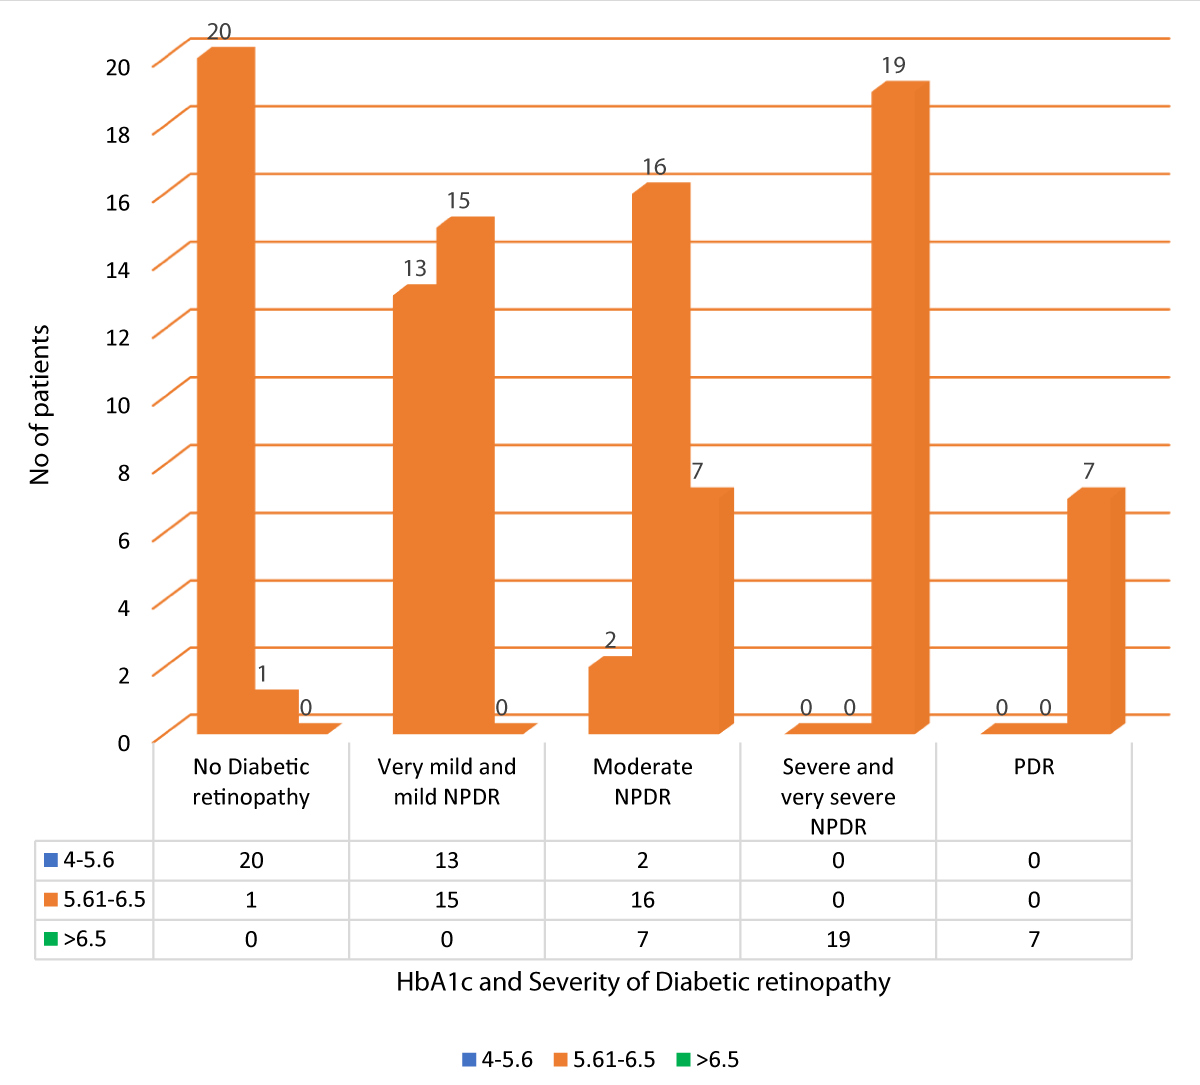
Table 14 and Graph 16 summarizes the data for correlation between HbA1c and severity of DR. Out of 21 patients with no diabetic retinopathy, 20 patients had HbA1c between 4-5.6, and 1 patient had HbA1c between 5.61-6.5. Out of 28 patients with very mild and mild NPDR, 13 patients had HbA1c between 4-5.6, and 15 patients had HbA1c between 5.61-6.5. Out of the 25 patients with moderate NPDR, 2 patients had HbA1c between 4-5.6, 16 patients had HbA1c between 5.61-6.5 and 7 patients had HbA1c > 6.5. All 19 patients with severe and very severe NPDR had HbA1c > 6.5. All 7 patients of PDR had HbA1c > 6.5. Our study showed a statistically significant positive correlation between HbA1c and severity of DR (Pearson r = 0.887, p = 0.001).
| Table 14: Correlation between HbA1c and Severity of DR. | |||||||
| Severity of diabetic retinopathy | HbA1c | Total | Yate's chi square | r-value | p-value | ||
| 4 - 5.6 | 5.61 - 6.5 | > 6.5 | |||||
| No Diabetic retinopathy | 20 | 1 | 0 | 21 | 114.111 | 0.887 | 0.001 |
| 20.0% | 1.0% | 0.0% | 21.0% | ||||
| Very mild and mild NPDR | 13 | 15 | 0 | 28 | |||
| 13.0% | 15.0% | 0.0% | 28.0% | ||||
| Moderate NPDR | 2 | 16 | 7 | 25 | |||
| 2.0% | 16.0% | 7.0% | 25.0% | ||||
| Severe and very severe NPDR | 0 | 0 | 19 | 19 | |||
| 0.0% | 0.0% | 19.0% | 19.0% | ||||
| PDR | 0 | 0 | 7 | 7 | |||
| 0.0% | 0.0% | 7.0% | 7.0% | ||||
| Total | 35 | 32 | 33 | 100 | |||
| 35.0% | 32.0% | 33.0% | 100.0% | ||||
Graph 16: Variation between HbA1c and Severity of DR.
The present cross-sectional study was conducted in the Department of Ophthalmology, Vydehi Institute of Medical Sciences and Research Centre, Bangalore between January 2018 and June 2019, with the aim of correlating the Central Corneal thickness to the severity of Diabetic Retinopathy and HbA1c levels in type 2 Diabetes Mellitus. Our study included 100 patients with type 2 DM who fulfilled the selection criteria and gave written informed consent.
Central corneal thickness is an important indicator of corneal health status and decisions involving refractive surgery and estimation of intraocular pressure. Diabetic keratopathy leads to a spectrum of changes occurring in the cornea of diabetic patients. In our study we found that Diabetic patients exhibit a greater statistically significant average CCT which increases with the severity of DR.
There are many postulations explaining this. Some studies say reduction of Na+- K+ ATPase activity directly inhibits the corneal endothelial pump while others explain intracellular accumulation of sorbitol which is an osmotic agent causing corneal hydration. Recent studies suggest Advanced glycation end products (AGEs) act as cross-linking agents to increase the covalent bond in corneal stroma, eventually increasing its thickness. The CCT in diabetics signifies overall functional and morphological status of cornea. It has been reported as a sensitive indicator of early diabetic keratopathy and an important parameter for refractive surgeries.
McNamara, et al. observed a positive correlation between HbA1c level and CCT in Type 1 diabetics and reported increased CCT in diabetics but found no direct correlation with HbA1c level in type 2 DM which was found in our study. This observation was reinforced by Yasgan S, et al. Assessment of CCT and ECD in different stages of DR can indicate how rapidly the disease spreads, which in turn could be used as a guideline for effective early detection and timely management.
Rashmi Kumari, et al. [16] conducted a case control study in Max Eye Hospital, Patna, (from May 2015 to April 2016). They measured CCT in 100 patients out of which 50 were diabetics and 50 were non-diabetics and concluded that the diabetic patients had thicker cornea as compared to the non–diabetics.
Prem pal Kaur, et al. [11] conducted cross sectional study at Amritsar on 240 eyes, in which 120 eyes of diabetic patients and 120 eyes of non-diabetic patients taken at Government Medical College, Amritsar, and found that in the diabetic group, the mean CCT and mean endothelial cell density varies significantly from non-diabetic controls. They also concluded that CCT was significantly thicker for diabetics with duration of > 10 years and HbA1c > 7.
In contrast Kenji Inoue et al [17] in Japan, compared the endothelial structure and thickness of the cornea in diabetic and non-diabetics. They found no significant difference between CCT in the diabetics to non-diabetics. Corneal endothelial cell structure was damaged, but CCT was not increased in type 2 diabetic patients. However, Allan Storr‐Paulsen, et al. [18] established that Type 2 diabetic subjects showed a significant increase in CCT compared to non-diabetic control subjects but did not differ from the non‐diabetic control subjects with regards to endothelial cell density, hexagonality or variation in CV. Su, et al. also observed that among 3280 Malay adults aged 40 to 80 years, those with diabetes and hyperglycemia showed significantly thicker central corneas, which was independent of age and IOP levels. Abdul Ghani, et al. [8] in Sudanese population and Busted, et al. [14], reported similar results as present study.
Although, the exact molecular mechanism of the cause of increased CCT in patients with type 2 DM is debatable, structural or functional alterations of the corneal endothelium induced by hydration of the cornea due to hyperglycemia could be a key aspect in corneal thickening [12]. Others suggested the necessity of corneal pleomorphism and polymegathism or collagen cross-linking in increasing corneal thickness in DR [12].
It is now proven that the polyol (sorbitol-aldose reductase) pathway plays an important role in altering the corneal morphology in diabetics. [9] High glucose increases the aldolase reductase activity leading to accumulation of sorbitol (an osmotic agent) in corneal epithelial and endothelial cells which is followed by the swelling of corneal endothelial cells. Additionally, Na+- K+ ATPase activity is also reduced in the corneal endothelium leading to altered morphology and corneal destruction [9].
Our study identified participants being predominantly males and in the age group of 50-59 years (Table 1 and 2). Similar age distribution of patients with DR have been reported by other researchers globally. Mean CCT was lowest among patients with no diabetic retinopathy, while it significantly increased in patients with NPDR and PDR.
Some studies have shown the corneal endothelium in diabetics is under continuous metabolic stress having increased coefficient of variation of endothelial cell area, decreased percentage of hexagonality and increased corneal auto fluorescence [2,13,14]. Significant reduction in ECD compared to no DR was observed in NPDR and PDR.
Finally, mean CCT and ECD were significantly correlated with different grades of DR, with CCT increasing (significant positive correlation) and ECD decreasing (significant negative correlation) in progressive stages of retinopathy. Thus, early detection and diagnosis of DR in type 2 DM patients is necessary to prevent any added comorbidity and untimely mortality.
One of the studies conducted previously in this regard showed that the risk of PDR was 6 times higher among diabetics with poor glycemic control. Another similar study showed that the HbA1c levels correlated with prevalence of retinopathy status in diabetic patients on insulin therapy. Reductions in blood glucose or HbA1c concentrations through tight blood glucose control in diabetics reduces the rate of progression of DR and microvascular complications such as DR, neuropathy and nephropathy.
The findings of our study suggest that decreasing HbA1c values or achieving ADA criteria can prevent or delay the onset and progression of microvascular complications such as diabetic retinopathy. Because diabetic retinopathy is a serious microvascular complication, regular screening for DR and tighter glycemic control could reduce the number of people developing vision-threatening retinopathy.
This study demonstrates a strong positive correlation between the CCT to the severity of DR and HbA1c levels. The corneas of Type 2 diabetics were significantly thicker, indicating that patients with thick corneas are more likely to be found in advanced stages of the disease. In advanced stages of DR, Endothelial cell density (ECD) and hexagonality (Hex) decreased whereas coefficient of variation in cell size (CV) increased.
CCT and CV showed positive correlation whereas ECD and Hex showed negative correlation with progressive stages of DR. Routine assessment of CCT and corneal endothelial structure may be beneficial in all diabetic patients along with their usual retinopathy assessment to prevent visual disability by early detection and management.
We conclude that it is important to critically assess the corneal endothelium with specular microscopy in all patients with Type 2 DM. It should be a part of the routine preoperative assessment in all patients undergoing intraocular surgeries like refractive surgeries and keratoplasty, which will help in predicting post-operative corneal complications. It will also be possible to identify preoperatively, high-risk cornea patients who are prone to early decompensation.
The present cross-sectional study was conducted in the Department of Ophthalmology, Vydehi Institute of Medical Sciences and Research Centre, Bangalore between January 2018 and June 2019, with the aim of correlating the Central Corneal thickness to the severity of Diabetic Retinopathy and HbA1c levels in type 2 Diabetes Mellitus. Our study included 100 patients with type 2 DM who fulfilled the selection criteria and gave written informed consent.
This study aimed to determine the association of CCT with HbA1c and different grades of Diabetic Retinopathy.
100 participants were included in the study, in whom relevant history regarding their diabetes was noted i.e., age at the time of diagnosis of DM, duration of DM, nature and duration of treatment received, glycemic control and compliance to the treatment.
Patients were evaluated for their HbA1c levels, hyper-tension, sugar profile and renal parameters. Each participant’s diabetic retinopathy status was classified according to the ETDRS classification.
Our study found a positive correlation between different grades of diabetic retinopathy with CCT and HbA1c levels. The other factor which had a significant correlation was duration of diabetes. Also, our study showed a correlation between the corneal endothelial parameters i.e. ECD, hexagonality, and co-efficient of variation and severity of diabetic retinopathy which was statistically significant.
- International Diabetes Federation Atlas, International Diabetes federation. http://www.idf.org/diabetesatlas. Seventh edition. 2015
- Shukla EJ, Nicholson AD, Agrawal AH, Rathod DB. Correlation between severity of Type 2 diabetes mellitus and corneal morphology using specular microscopy in Indian population: A case-control study. Sudanese J Ophthalmol. 2016; 8: 30-35.
- Schultz RO, Matsuda M, Yee RW, Edelhauser HF, Schultz KJ. Corneal endothelial changes in type I and type II diabetes mellitus. Am J Ophthalmol.1984; 98: 401-410. PubMed: https://pubmed.ncbi.nlm.nih.gov/6486211/
- Rangnath KN, Parekh R, Suresh KP, Dharmalingam M. Corneal endothelium count and thickness in diabetes mellitus. Int J Diab Dev Ctries. 2006; 26: 24-25.
- Choo MM, Prakash K, Samsudin A, Soong T, Ramli N, et al. Corneal changes in T2DM in Malaysia. Int J Ophthalmol. 2010; 3: 234-236. PubMed: https://pubmed.ncbi.nlm.nih.gov/22553561/
- El-Agamy A, Alsubaie S. Corneal endothelium and central corneal thickness changes in T2DM. Clin Ophthalmol. 2017; 11: 481-486. PubMed: https://pubmed.ncbi.nlm.nih.gov/28280298/
- Ahuja SS, Bammigatti C, Kumar P. Corneal Endothelial changes in patients of Type 2 DM using specular Microscopy. EC Ophthalmol. 2017; 6: 100-107.
- Abdulghani YS, Ali TO. Correlation between central corneal thickness and diabetes in Sudanese patients. National J Med Res. 2013; 3: 309-311.
- Sasmal NK, Das S, Singh S. Association of central corneal thickness and central corneal endothelial cell count with progressive stages of diabetic retinopathy. J Evid Based Med. Healthc. 2017; 4: 4924-4928.
- Dabas R, Sethi S, Garg M, Aggarwal R, Lamba S, et al. Central Corneal Thickness (CCT) in Diabetic Subjects and its Correlation with Disease Duration and Severity. Ann Int Med Den Res. 2017; 3: OT04-OT06.
- Kaur P, Singh B, Bal BS, Kaur I. CCT in T2DM patients and its correlation with duration, HbA1c levels and severity of retinopathy. IOSR J Dental Med Sci. 2016; 15: 91-94.
- American diabetes association “Tests of glycemia in diabetes”, Clinical practice recommendations. 2003. 107-108.
- Kadhim YJ, Farhood QK. Central corneal thickness of Iraqi population in relation to age, gender, refractive errors, and corneal curvature: a hospital-based cross-sectional study. Clin Ophthalmol. 2016; 10: 2369–2376. PubMed: https://pubmed.ncbi.nlm.nih.gov/27932859/
- Busted N, Olsen T, Schmitz O. Clinical observations on the corneal thickness and the corneal endothelium in DM. Br J Ophthalmol. 1981; 65: 687-690. PubMed: https://pubmed.ncbi.nlm.nih.gov/7317320/
- Bowling B. Kanski's clinical Ophthalmology. 8 ed: Elsevier; 2016.
- Kumari R, Saha BC. Central corneal thickness and diabetes – a study of correlation in terms of duration and glycemic control. Int J Contempor Med Res. 2017; 4: 767-769.
- Inoue K, Kato S, Inoue Y, Amano S, Oshika T. The corneal endothelium and thickness in type II diabetes mellitus. Jpn J Ophthalmol. 2002; 46: 65-69. PubMed: https://pubmed.ncbi.nlm.nih.gov/11853716/
- Storr‐Paulsen A, Singh A, Jeppesen H, Norregaard JC, Thulesen J. Corneal endothelial morphology and central thickness in patients with type II diabetes mellitus. Acta Ophthalmol. 2014; 92: 158-160. PubMed: PubMed: https://pubmed.ncbi.nlm.nih.gov/23387877/