Research Article
A Preliminary Laboratory Investigation of Methane Generation Potential from Brewery Wastewater using UASB Reactor

MA Karim1* and Benjamin L Moss2
1Department of Civil and Construction Engineering, Kennesaw State University, Marietta Campus 1100 South Marietta Parkway, L-114, Marietta, Georgia 30060, USA
2Principal Engineer, Hazen and Sawyer 5775 Peachtree Dunwoody Road NE, Suite D-520, Atlanta, GA 30342, USA
*Address for Correspondence: Dr. MA Karim, Associate Professor, Department of Civil and Construction Engineering, Kennesaw State University, Marietta Campus 1100 South Marietta Parkway, L-114, Marietta, Georgia 30060, USA, Tel: 804-986-3120; 470-578-5078; Email: mkarim4@kennesaw.edu; makarim@juno.com
Dates: Submitted: 24 April 2017; Approved: 15 May 2017; Published: 17 May 2017
How to cite this article: Karim MA, Moss BL. A Preliminary Laboratory Investigation of Methane Generation Potential from Brewery Wastewater using UASB Reactor. Ann Civil Environ Eng. 2017; 1: 034-041. DOI: 10.29328/journal.acee.1001004
Copyright License: © 2017 Karim MA, et al. This is an open access article distributed under the Creative Commons Attribution License, which permits unrestricted use, distribution, and reproduction in any medium, provided the original work is properly cited.
Keywords: Brewery wastewater; Methane generation; Up flow anaerobic sludge blanketequations

ABSTRACT
A preliminary laboratory study was conducted using upflow anaerobic sludge blanket (UASB) reactor to investigate the potential of methane generation from brewery wastewater. Brewery wastewater from a local brewery company was collected and used in the experiments. The experiments were run for 15 days. The rate of methane production was about 5.32 L per kg of chemical oxygen demand (COD) removed per day. The pH reduction in the experimental reactor limited the ability of gas production and is likely the result of the temperature at which the experiments were conducted.
INTRODUCTION
Like domestic wastewater, treatment of brewery wastewater is a regulatory requirement to meet the national pollutant discharge elimination system (NPDES) permit limits. Although the brewing industries discharge large volumes of highly polluting effluents throughout the year [1,2], the brewing industry constitute an important economic segment of any country [3,4]. In fact, beer is the fifth most consumed beverage in the world behind tea, carbonates, milk and coffee [3]. Beer brewing involves two main steps, i.e., brewing and packaging of the finished product [5]. In addition, cleaning of tanks, bottles, machines, and floors produces high quantities of polluted water [5]. It is estimated that for the production of 1 L of beer, 3-10 L of waste effluent is generated depending on the production and specific water usage [1,3,6,7]. In other words, very large quantities of water are consumed during the beer brewing process [8]. Most breweries discharge 70% of their incoming water as effluent. Effluent is defined as wastewater that is generated and flows to the sewer system that ultimately goes to wastewater treatment plants. In most cases, due to the high COD content, brewery effluent disposal costs may be much higher than water supply costs and domestic wastewater treatment costs.
In anaerobic decomposition of brewery wastewater, biogas with a high concentration of methane is produced as a by-product, and this may be captured and used as an energy source, to generate electricity for export and to cover its own running power. Methane generation is a by-product of anaerobic process of wastewater treatment. Methane is classified as natural gas that can be used to generate electricity or as a fuel to heat boiler water or heat offices or houses. Therefore, estimate of the potential of methane generation is important for planning and usage purposes. For the brewing industry, energy is required during the process of brewing beer, package the beer, general equipment for the production, and the employee hygiene. When the brewing process is complete, the residual energy present in the wastewater can be harvested for providing energy to other required industrial processes [9]. Several studies [10,11], investigated the direct electricity generation from brewery wastewater decomposition using microbial fuel cells (MFCs) and membrane-free MFC. Their results suggested that it is feasible to generate electricity with the treatment of beer brewery wastewater and concluded that higher COD contents generate higher electric density.
The technology needs constant monitoring when put into use to ensure that the sludge blanket is maintained, and not washed out (thereby losing the effect). The heat produced as a by-product of electricity generation can be reused to heat the digestion tanks, nearby houses or offices. In this study, an attempt has been made to evaluate the potential methane generation rate from brewery wastewater using upflow anaerobic sludge blanket (USAB) reactor in a laboratory set up using local brewery wastewater. The main limitations of this study are: (1) the star-up of anaerobic systems is typically slow (2 or 3 weeks if seed sludge is used) and this study was conducted for 15 days that may not be suitable for drawing exclusive conclusions regarding biogas production. That is why the title was framed as “a preliminary investigation”. (2) The lab-scale reactors were modified anaerobic reactors instead of UASB reactors (i.e. the three-phase separator were replaced by external weirs to provide hydraulic barrier).
MATERIALS AND METHODS
The typical properties of brewery wastewater make it an excellent candidate for treatment using anaerobic reactors. Based on the typical data shown in table 1 brewery wastewater is considered a high strength wastewater. Upflow Anaerobic Sludge Blanket (USAB) reactors are one of the more common reactors that are being used now-a-days and especially with high strength wastes [8]. This was one of the reasons to use the USAB reactors in this study as the strength of the brewery wastewater used in this study is very high.
| Table 1: Typical characteristics of brewery wastewater. | |||||
| Parameter | Enitan et al., [12] | Inyang et al., [13] | Simate et al., [8] | Rao et al., [14] | This study (Moss) [15] |
| COD (mg/L) | 1096-8926 | 2000-6000 | 2000-6000 | 2000-6000 | 44,100-135,300 |
| BOD5 (mg/L) | 1609-3980 | 1200-3600 | 1200-3600 | 1200-3600 | --- |
| TSS (mg/L) | 530-3728 | 200-1000 | 2901-3000 | 2901-3000 | --- |
| Temperature (oC) | 24-30.5 | 18-40 | 18-40 | 18-40 | 23-35 |
| pH | 4.6-7.3 | 4.2-12 | 3-12 | 3-12 | 5.41-6.71 |
Brewery wastewater used in this study was collected from a local microbrewery located in the Atlanta area. The wastewater collected appears to be a representative sample of a typical wastewater discharge for a week period. The wastewater included cleaning chemicals (acids and bases), multiple different beer residuals, and water (which would be used for the cleaning of tanks). The brewery wastewater samples were collected in a 50L Nalgene bottle type container.
Experiments were run for a period of 15 days at a room temperature of approximately 23°C throughout the experiment period. This temperature was ideal because additional external energy would not be required to heat the reactors and would off-set the benefits of energy production. Maintaining and heating a system would also increase the maintenance effort associated with the installation of a reactor and increase the ongoing cost of the system. Wastewater was run through the reactor on a continuous basis using a peristaltic pump at a flow rate of 0.25 mL/min. Figure 1 illustrates the experimental set up that was used in this study. Seed sludge (Figure 1a) was introduced into the reactor approximately one day before the start of the test. It was a concern that residual chlorine from the city water system could impact microbial growth within the seed sludge. For this reason, the city water was mixed and held for over 10 days before introduction into the reactor. After one day most of the suspended solids during the introduction were settled back into the sludge blanket as the mixing was not continuous.
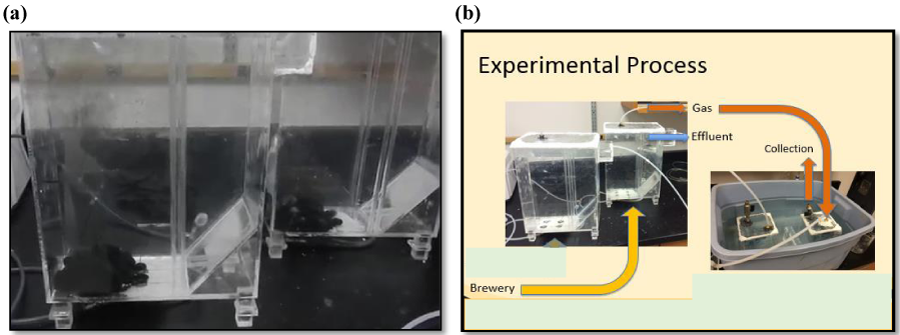
Figure 1: The schematic presentation of the experimental set up.
Influent tubing runs from the brewery wastewater, through peristaltic pump, into the bottom of the reactor. The influent locations were spread evenly along the bottom of the reactor in an attempt to evenly distribute flow across the bottom of the reactors. A sloped bottom (Figure 1) is located in the corner of the effluent end of the reactor which assisted in congregating the sludge blanket in the area of the influent locations. This also assisted in retaining biomass inside the reactor by locating the influents further away from the effluent. Some studies used baffles that are typically located on the sides of the tank to prevent solids from leaving the tank [16]. Effluent water leaves the tank through baffles located near top of the tank.
Brass hydraulic quick-connects were used to distribute flow to the four inlet locations. The quick connects were screwed into the reactor and sealed with 2-part epoxy glues at the threads. External weirs were constructed and placed on the reactors to provide a hydraulic barrier to retain generated gas in the collection device and provide a barrier to retain solids within the reactor. A brass nipple connector was use on the top of the reactor as gas collection port. The brass connections were screwed into the top of the reactor and threads were sealed using 2-part epoxy glues. Tubing was connected to the brass nipple and ran to the gas collection devices. Wastewater effluent samples were taken from the exterior weir of each reactor.
Hydraulic tests were conducted on the reactors before beginning the tests. The difference in the water surface of the reactors and effluent weir served as an on-going check of the air tightness of the reactors. Additionally the air displaced could be visual observed at the gas collectors. Effluent wastewater was collected in 5 gallon container and water volume was inspected nightly to insure consistent flow rate was maintained within each reactor.
Grab samples were collected periodically for determination of COD, pH, and gas volume. COD and pH samples were collected daily from the reactor influent and effluent. COD was determined using HACH DR/3900 automatic data logger spectrophotometer and the pH was determined using HACH HQ411d multimeter.
The gas was collected from the gas collection cubes (Figure 1b) in 10-L Teflon bags at 5-day interval for 15 days. This time frame was selected to provide an average production rate over the time frame, and allowed for more accurate measurement of relatively small volumes of gas compared to large scale reactors. The gas was initially analyzed using a Flame Ionization Detector (FID) by ASTM D7675-15. Since the gas content for all of the samples exceeded 1,000 ppm, which is the maximum determination limit FID, the gas samples were shipped to Test America Laboratory in Knoxville, TN. The volume and pressure (based on difference of water elevation inside and outside of the cube) were measured before gas samples were collected. The ideal gas law was applied to obtain the quantity of methane generated using the typical values listed in Simate et al. (2011). This study showed that brewery wastewater is composed of approximately 55-75% methane (CH4), 25-40% carbon dioxide (CO2), and traces of hydrogen sulfide (H2S). The details of the procedure can be found in [15].
RESULTS AND DISCUSSIONS
The brewery wastewater influent is an opaque yellow color and the effluent is translucent brown color. Suspended and settled solids were visually observed in the influent brewery wastewater and no solids were visually observed. Based on this observation, it appears as through the reactor retained solids. Solids retention is a concern for UASB reactors [17], and therefore was a focus during the building of the reactor. Strong odors originating from the brewery wastewater influent were noted throughout testing. In the beginning of the test, wastewater had a crisp beer smell. As days progressed the smell became increasing sour. It appears that this may be a result of pH drops within the influent and the reactors.
The variation of pH in brewer wastewater influent and effluent with time is presented in figure 2. The initial pH of the brewery wastewater influent and effluent were about 6.34 and 6.17 respectively, and by day nine of the experiment, the pH went down to 5.41 and 5.69 respectively. In order to prevent souring, pH was raised by adding sodium hydroxide to the influent. From day 9 to 15, the pH was raised from 5.41 to 6.71 that provided favorable environment for the microbes. The cost of the chemicals to increase the pH could offset cost savings of on-site gas production. The beer brewing process is an acid process, and micro-breweries utilize caustics such as sodium permanganate during the beer making process.
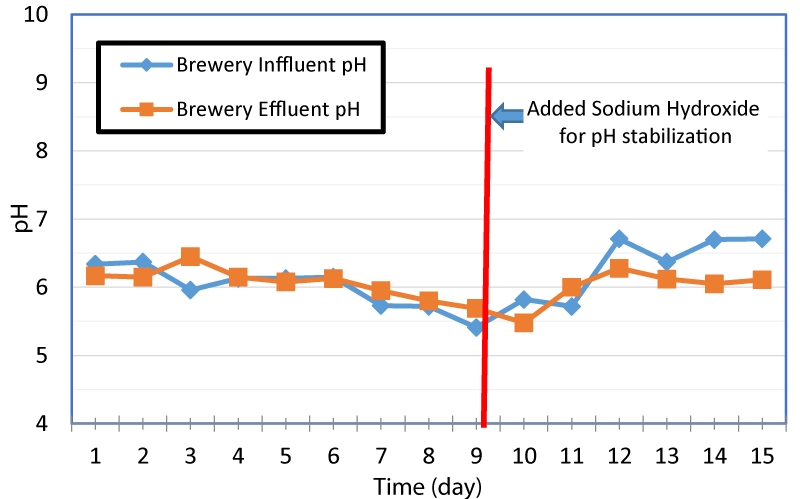
Figure 2: Variation of influent and effluent pH with time.
The variation of COD values in influent and effluent with time is presented in figure 3. As seen in this Figure, over the experiment period, the influent COD concentrations went down. This could be a result of the influent tubing located at the bottom of the wastewater containers and the tubing extracted the high strength settled solids from the container while wastewater with less solids remained at the top of the container. After day five of the experiment, the containers were mixed once a day to simulate the mixing effect of an equalization tank and provide consistent concentration of solids entering the influent tubing.
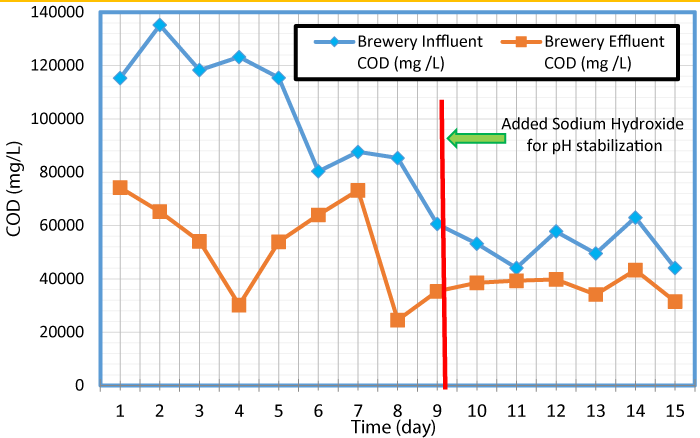
Figure 3: Variations of Influent and Effluent COD with time.
The COD values measured at the lab during this study was greater than 100,000 mg/L at the beginning of the experiment period, and exceeded 80,000 mg/L for 8 days out of the 15 days. Wastewater for previous studies was likely provided by larger breweries with larger operations than micro-breweries. A microbrewery may use less water compared to a larger operation (due to less equipment to clean, less waste, etc.) which would increase the COD concentration of the wastewater. The COD data gathered during this study suggest that the brewery reactor would digest and convert that COD to energy. In the digestion process, volatile fatty acid (VFAs) was formed when sugars and starches were broken down that ultimately reduce the pH of the reactors [17]. If the pH drops too low, the conversion of the VFAs to methane was hindered. This is commonly referred to as souring of the reactor, and the data suggest that this would have occurred inside of the reactor before the addition of sodium hydroxide. Sodium hydroxide was added to the influent tank to increase the pH as the microbes cannot survive in acidic environment.
The variation of overall and percent COD removal with time is shown in figure 4 and the variation of COD removal in g/day and pH with time at a flow rate of 0.25 mL/min is shown in figure 5. As seen in these Figures, high influent concentrations of COD (>100,000 ppm) were experienced in the first five days. The microorganisms seemed to respond to the loading of the reactors and produced increased both the percent and gram of COD removal for the first four days, but from day four to seven the percent COD removal dropped from 78% to 16%. The pH was consistent through the first 6 days and remained between 6.34 and 6.13. After day 6 and till day 9 (before the addition of the sodium hydroxide) the pH in the reactor went down from 6.15 to 5.41 (Figure 5). This could be the reason for a sharp decrease in the COD removal. The reduction of COD concentration and pH is likely a result of more VFAs being created than methanogenic bacteria that usually is converted into methane. After the addition of sodium hydroxide, the COD concentration reduced and ranged from 4,800 to 19,400 (relatively lower than the first two thirds of the test), but remained relatively consistent. It appears that if the pH remains consistent in the higher side, larger quantities of COD are removed. As changes (decrease) of pH occurred within the reactor, less COD was removed. The increase in COD removal during stable and/or increased pH period was observed for 6-7, 8-9, and 9-15 days.
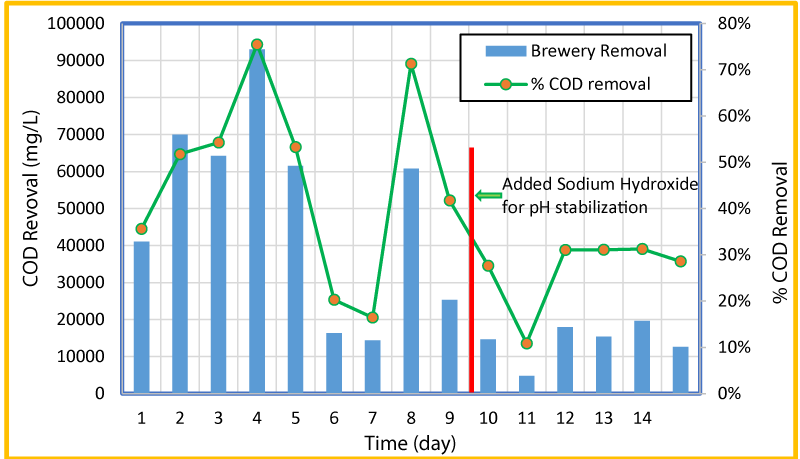
Figure 4: Variation of overall and percent COD removal with time.
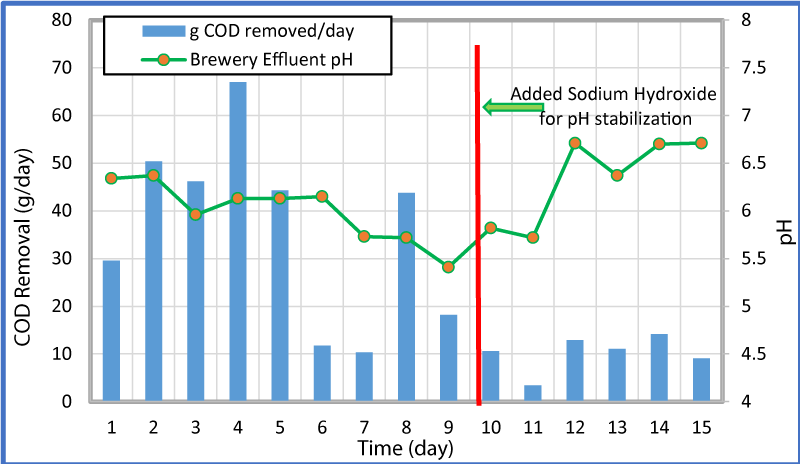
Figure 5: Variation of COD removal rate and pH with time.
The normalized methane volume per kg of COD removed versus time was plotted and presented in figure 6, to estimate the production rate of methane. As seen in this Figure, the data for day 11 was removed from the plot, due to low COD removal, which seemed to be an outlier. Three trend lines such as linear, polynomial and exponential were added in figure 6 to see which one is the best fit. Based on the R2 values, polynomial (R2=0.8893) seems to be the best fit and exponential (R2=0.6730) seems to be the least fit. In order to estimate the rate of CH4 production per kg of COD removal per day, the linear trend line (R2=0.7194) was used and the gas production rate over the experiment period was found to be about 5.32 liters of CH4 per kg of COD removed per day. The gas production increases during period of 10 to 15 days that could be due to the increase of pH during this period (Figures 2 and 5).
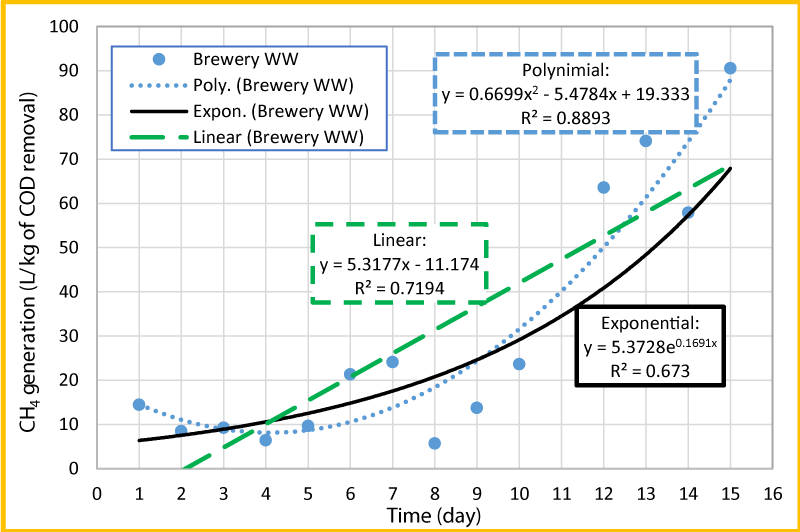
Figure 6: Variation of CH4 production rate per kg of COD removal with time.
CONCLUSION AND RECOMMENDATION
The preliminary study shows some potential of CH4 generation from brewery wastewater treatment using USAB reactor. Operating an UASB reactor will require chemical pH stabilization to raise the pH to balance the production of VFAs and the conversion of VFAs to methane. An UASB reactor treating brewery wastewater operated at 23°C produces approximately 5.32 liter of methane gas at ambient temperature and pressure per kg of COD removed per day. In the future studies, it is recommended to provide mixing for influent wastewater containers to prevent decreasing COD over the test period, increase temperature of the reactors to the Thermophilic Range (>35°C), stabilize pH throughout the experiment period to determine the gas production rate at a certain pH and ambient temperature and pressure, and eliminate the afore-mentioned limitations.
REFERENCES
- Braeken L, Van der Bruggen B, Vandecasteele C. Regeneration of brewery waste water using nanofiltration. Water Res. 2004; 38: 3075-3082. Ref.: https://goo.gl/vQ8svx
- Parawira W, Kudita I, Nyandoroh M G. A study of industrial anaerobic treatment of opaque beer brewery wastewater in a tropical climate using a full-scale UASB reactor seeded with activated sludge. Process Biochemistry. 2005; 40: 593-599. Ref.: https://goo.gl/gKzBeC
- Fillaudeau L, Blanpain-Aver P, Daufin G. Water, Wastewater and Waste Managment in Brewing Industries. Journal of Cleaner Production. 2006; 14: 463-471. Ref.: https://goo.gl/Ni306W
- Fillaudeau L, Boissier B, Moreau A, Blanpain-Avet P, Ermolaev S, et al. Investigation of rotating and vibrating filtration for clarification of rough beer. Journal of Food Engineering. 2007; 80: 206-217. Ref.: https://goo.gl/7WqrPE
- Doubla A, Laminsi A, Nzali A, Njoyim E, Kamsu-Kom J, et al. Organic pollutants abatement and biodecontamination of brewery effluents by a nonthermal quenched plasma at atmospheric pressure. Chemosphere. 2007; 69: 332-337. Ref.: https://goo.gl/F02ZS9
- Zupancic G, Skrjanec I, Logar RM. Anaerobic Co-Digestion of Excess Brewery Yeast in a Granular Biomass Reactor To Enhance The Production of Biomethane. Bioresource Technology. 2012; 124: 328-337. Ref.: https://goo.gl/3XPjyJ
- Kanagachandran K, Jayerantene R. Utilisation potential of brewery wastewater sludge as an organic fertilizer. Journal of the Institute of Brewing. 2006; 112: 92-96. Ref.: https://goo.gl/oNKGfs
- Simate GS, Cluett J, Iyuke SE, Musapatika ET, Ndlovu S, et al. The treatment of brewery wastewater for reuse: State of the art. Desalination. 2011; 273: 235-247. Ref.: https://goo.gl/B4YuiW
- Mao C, Feng Y, Wang X, Ren G. Review on Research Achievements of Biogas From Anaerobic Digestion. Renewable and Sustainabe Energy Reviews. 2015; 540-555. Ref.: https://goo.gl/hWsXWq
- Wang X, Feng YJ, Lee H. Electricity production from beer brewery wastewater using single chamber microbial fuel cell. Water Sci Technol. 2008; 57: 117-121. Ref.: https://goo.gl/4EAJbh
- Feng Y, Wang X, Logan BE, Lee H. Brewery wastewater treatment using air-cathode microbial fuel cells. Appl Microbiol Biotechnol. 2008; 78: 873-880. Ref.: https://goo.gl/EN75Km
- Enitan AM, Adeyemo J, Kumari S, Swalaha FM, Bux F. Characterization of Brewery Wastewater Composition. International Journal of Environmental, Chemical, Ecological, Geological and Geophysical Engineering. 2015; 9: 1057-1060. Ref.: https://goo.gl/pwA5dw
- Inyang UE, Bassey EN, Inyang JD. Characterization of Brewery Effluent Fluid. Journal of Engineering and Applied Sciences. 2012; 4: 67-77.
- Rao AG, Reddy TS, Prakash K, Vanajakshi SS, Joseph J, et al. pH regulation of alkaline wastewater with carbon dioxide: A case study of treatment of brewery wastewater in UASB reactor coupled with absorber. Bioresour Technol. 2007; 98: 2131-2136. Ref.: https://goo.gl/v1Fj7M
- Moss BL. Comparative Assessment of the Methane Generation from Brewery and Domestic Wastewater using USAB Reactor, MSCE thesis, Department of Civil and Construction Engineering, Kennesaw State University, Marietta Campus, 1100 South Marietta Parkway, Marietta. 2016; GA, May, 42.
- Mata-Alvarez J, Dosta J, Romero-Guiza MS, Fonoll X, Peces M, et al. A Critical Review on Anaerobic Co-Digestion Achievements between 2010 and 2013. Renewable and Sustainable Energy Reviews. 2014; 412-427. Ref.: https://goo.gl/VXGjao
- Tchobanoglous G, Burton FL, Stensel DH. Wastewater Engineering Treatment and Reuse (4th ed.) New York, New York: McGraw-Hill Higher Education. 2003.