Postoperative Audiometric Results of Patients with Otosclerosis in relation with High-resolution Computed Tomography and Intraoperative Macroscopic Findings
By Mehmet Fatih Karakus1, Mustafa Colak2, Kursat Murat Ozcan2, Aykut Ikinciogullari2, Serdar Ensari3, Haci Huseyin Dere4Affiliations
doi: 10.29271/jcpsp.2021.08.969ABSTRACT
Objective: To analyse postoperative audiological findings in fenestral otosclerosis patients treated with stapedotomy, focal location-extensiveness findings on temporal high-resolution computed tomography (HRCT), and intraoperative macroscopic stapes footplate findings. Moreover, preoperative audiological findings were compared with HRCT and intraoperative macroscopic findings.
Study Design: An observational study.
Place and Duration of Study: Department of Otorhinolaryngology, University of Health Sciences, Ankara Numune Training and Research Hospital, Turkey from January 2015 to January 2018.
Methodology: Patients were classified according to the temporal bone HRCT findings into three groups based on otosclerotic focus location and extensiveness. Macroscopic classification was based on the intraoperative findings of blue and white footplate. Patients with obliterative otosclerosis were not included in the study. Preoperative and postoperative audiological findings as well as surgical success were investigated. Findings were compared with HRCT and macroscopic classification groups.
Results: Postoperative air bone gap (ABG) increased as HRCT class increased from 0 to 3, meaning a more extensive otosclerotic focus (p=0.002). The comparison of the audiological outcomes, in accordance with the intraoperative findings, revealed that the postoperative air conduction pure-tone averages (AC PTA), ABG and ABG difference were higher in the white footplate group, with statistically significant differences compared to blue footplate group (p = 0.039, p = 0.001 and p=0.029, respectively).
Conclusion: Postoperative audiological findings were found to be correlated with intraoperative and HRCT findings. A white footplate seen at surgery or a more extensive otosclerotic focus on temporal HRCT indicates a suboptimal audiological outcome. HRCT findings should be taken into account when planning the surgery.
Key Words: Otosclerosis, Temporal bone HRCT, Footplate color, Stapedotomy, Audiometry.
INTRODUCTION
Otosclerosis is a focal idiopathic osteodystrophic disease of the otic capsule.1 The disease usually starts from the fissula antefenestram and spreads to the annular ligament and the stapes footplate.2
Conductive hearing loss develops due to the involvement of the stapes footplate. In addition to stapes fixation, it has been reported that toxic, inflammatory products may cause an enzymatic disorder affecting the membranous labyrinth and resulting in a mixed-type hearing.3 Depending on localisation of the otosclerotic focus, the disease is classified under two main headings: fenestral and retrofenestral otosclerosis. In the fenestral type, the focus may be localised in the tympanic segment of the oval window, round window, promontorium, and facial canal; whereas, in the retrofenestral type, the focus may be localised in the pericochlear region, semicircular canals, internal acoustic canal, vestibular aqueduct or cochlear aqueduct.4
Audiological findings are not sufficient to accurately predict the localisation and extent of the otosclerotic foci. High-resolution computed tomography (HRCT) of the temporal bone may be used to determine the presence of other middle ear pathologies, including tympanosclerosis, ossicular fixation and congenital anomalies, extent of otosclerotic foci in the oval window and stapes footplate, and presence of cochlear involvement.4 Naumann et al. described a classification regarding the localization–extensiveness of fenestral and retrofenestral otospongiotic foci in HRCT findings.5 On the other hand, Malafronte et al. described a macroscopic classification based on the intraoperative appearance of the stapes footplate.1
Predictive values of intraoperative macroscopic classification and HRCT findings on preoperative audiological variables and surgical success have not been clearly determined in literature.
The primary aim of this study was to determine the correlations of preoperative audiometric findings, HRCT classification, and intraoperative macroscopic classification. The secondary aim was to investigate the relations of radiological and intraoperative macroscopic classifications with surgical success.
METHODOLOGY
In this study, 37 ears of 33 patients, who underwent surgery for otosclerosis between January 2015 and January 2018 at the Otorhinolaryngology Clinic of Ankara Numune Training and Research Hospital, were retrospectively analysed. The study was approved by the local Ethics Committee (No. E-18-2072), and conducted in accordance with the ethical principles described by the Declaration of Helsinki. Patients with comorbid middle ear pathologies detected with temporal bone HRCT, such as congenital cholesteatoma, glomus tympanicum, tympanosclerosis, superior semicircular channel dehiscence; with retrofenestral otosclerosis; with incudomalleolar ossicular fixation detected intraoperatively; and those who had revision surgery were excluded from the study. Paients who had surgery for otosclerosis were included in this study.
Pure-tone speech audiometry measurements were performed preoperatively and 8 weeks after surgery. Air conduction (AC) thresholds, and bone conduction (BC) thresholds were measured. Pure-tone averages (PTA) were then determined, and air–bone gap (ABG) PTA values were calculated. For audiometric tests, AC 40 Clinical Audiometer (Interacuostic, Middelfart, Denmark) and AZ 27 Tympanometry (Interacuostic, Middelfart, Denmark) devices were used. Temporal bone HRCT was obtained preoperatively. Following a scan with 0.5- millimeter (mm) axial and 1-mm coronal cross-sectional range using an Alexion Multislice 16 CT Scanner (Toshiba, Otawara City, Tochigi, Japan).
Cases were classified according to the temporal bone HRCT findings. The focus could not be detected in group 0 patients, while a small focus localised in the fissula antefenestram was seen in group 1 patients (Figure I). Group 2 patients had a focus occupying at least half of the diameter of the oval window, localised in the oval window niche and/or cochleariform process area (Figure 2). Finally, group 3 patients had a wide focus, localised in occupying the entire oval window niche, that holds the entire oval window diameter (Figure 3).5
The stapedotomy technique included a transcanal modified Rosen’s incision. Ossicular chain was palpated; and to confirm that the stapes was immobile. Footplate appearance was evaluated, the incudostapedial joint was separated, and the tendon was cut. The anterior and posterior crura of the stapes were broken and the superstructure was removed. Stapes footplate was fenestrated with a perforator. A fluoroplastic teflon piston (0.6-mm diameter) was shortened to the appropriate length, and placed between the long arm of the incus and the footplate fenestrum.
Cases were macroscopically classified according to intraoperative findings. The patients who had blue colored footplate grouped as blue footplate patients (Figure 4). The patients who had white colored footplate grouped as white footplate patients (Figure 5). The patients whom the stapes footplate could not be distinctively seen grouped as obliterative otosclerosis patients.1
Surgical success was evaluated, based on the American Academy of Otolaryngology-Head and Neck Surgery Foundation criteria (postoperative ABG PTA 0–10 decibel (dB): highly successful, 11–20 dB: successful, 21–30 dB: acceptable, >30 dB: unsuccessful).6
Mean preoperative and postoperative AC PTA, BC PTA, ABG PTA values and ABG PTA difference values were calculated from the audiometric findings. The results were compared among the groups classified based on the temporal bone HRCT findings. Similarly, the same values were compared among the groups classified based on intraoperative macroscopic findings. The surgical success was also compared among different groups.
Qualitative variables were expressed as frequencies and percentages. Quantitative variables were expressed as mean with SD or median with IQR (25th percentile-75th percentile). Shapiro-Wilk test was used to assess the normality of quantitative variables. Differences between dependent two groups were analysed with paired t-test or Wilcoxon test. Differences between independent two groups were analysed using the unpaired t-test or Mann-Whitney U-test. Differences among groups were analysed by one-way analysis of variance or Kruskal-Wallis test. P < 0.05 was deemed statistically significant. SPSS statistical software (SPSS for Windows version 21.0; SPSS Inc, Chicago, IL, USA) was used for statistical analysis.
RESULTS
Of the 33 patients included in the study, 23 (69.7%) were females and 10 (30.3%) were males. The age ranged from 28 to 54 years (mean = 39.13 ± 6.65 years). Temporal bone HRCT could not detect any foci in 6 ears (16.2%) (Group 0). There were 7 ears (18.9%) in Group 1, 16 ears (43.2%) in Group 2, and 8 ears (21.6%) in Group 3. Intraoperative macroscopic classification revealed blue footplate in 27 ears (73.0%) and white footplate in 10 ears (27.0%). Mean preoperative ABG PTA values were calculated separately for HRCT classification groups (Table I).
Table I: Temporal bone HRCT and audiological findings (PTA dB).|
|
No focus (N=6) |
Group 1 (N=7) |
Group 2 (N=16) |
Group 3 (N=8) |
p-value |
|
Preoperative AC |
48.33±5.35 |
52.86±14.78 |
48.31±10.24 |
59.88±9.51 |
0.086 |
|
Preoperative BC |
20.50±4.14 |
25.86±11.48 |
20.81±5.15 |
20.88±7.77 |
0.425 |
|
Preoperative ABG |
27.83±5.38 |
27.00±6.86 |
27.50±8.88 |
39.00±12.90 |
0.031 |
|
Postoperative AC |
23.83±4.49 |
23.86±9.58 |
23.13±5.71 |
29.00±9.18 |
0.307 |
|
Postoperative BC |
17(14.25-20.5) |
15(8-23) |
12(10.25-18) |
12.5(9.25-16.5) |
0.248 |
|
Postoperative ABG |
6.67±2.80 |
8.71±3.86 |
9.63±2.96 |
16.50±8.26 |
0.002 |
|
ABG difference |
21.17±6.74 |
18.29±5.28 |
17.88±8.50 |
22.50±9.58 |
0.540 |
|
The values indicate median (IQR) and means-standard deviations. HRCT: High resolution computed tomography; PTA: Pure tone average (500, 1000, 2000, 4000 kHz); dB: Decibel. N: Number of ears; AC: Air conduction; BC: Bone conduction; and ABG: Air bone gap. |
|||||
|
|
Blue (N=27) |
White (N=10) |
p-value |
|
Preoperative AC |
48(41-53) |
61.5(54.5-67.25) |
0.001 |
|
Preoperative BC |
20(18-25) |
20.5(15.5-27) |
0.904 |
|
Preoperative ABG |
26.30±6.34 |
39.80±11.74 |
0.005 |
|
Postoperative AC |
23.15±6.52 |
28.70±8.15 |
0.039 |
|
Postoperative BC |
14.63±5.44 |
13.00±3.77 |
0.391 |
|
Postoperative ABG |
9(6-10) |
12.5(11-21.25) |
0.001 |
|
ABG difference |
17.78±6.62 |
24.10±9.60 |
0.029 |
|
The values indicate median (IQR) and means-standard deviations. PTA: Pure Tone Average (500, 1000, 2000, 4000 Hz); dB: Decibel; N: Number of ears; AC: Air conduction; BC: Bone conduction; and ABG: Air bone gap. |
|||
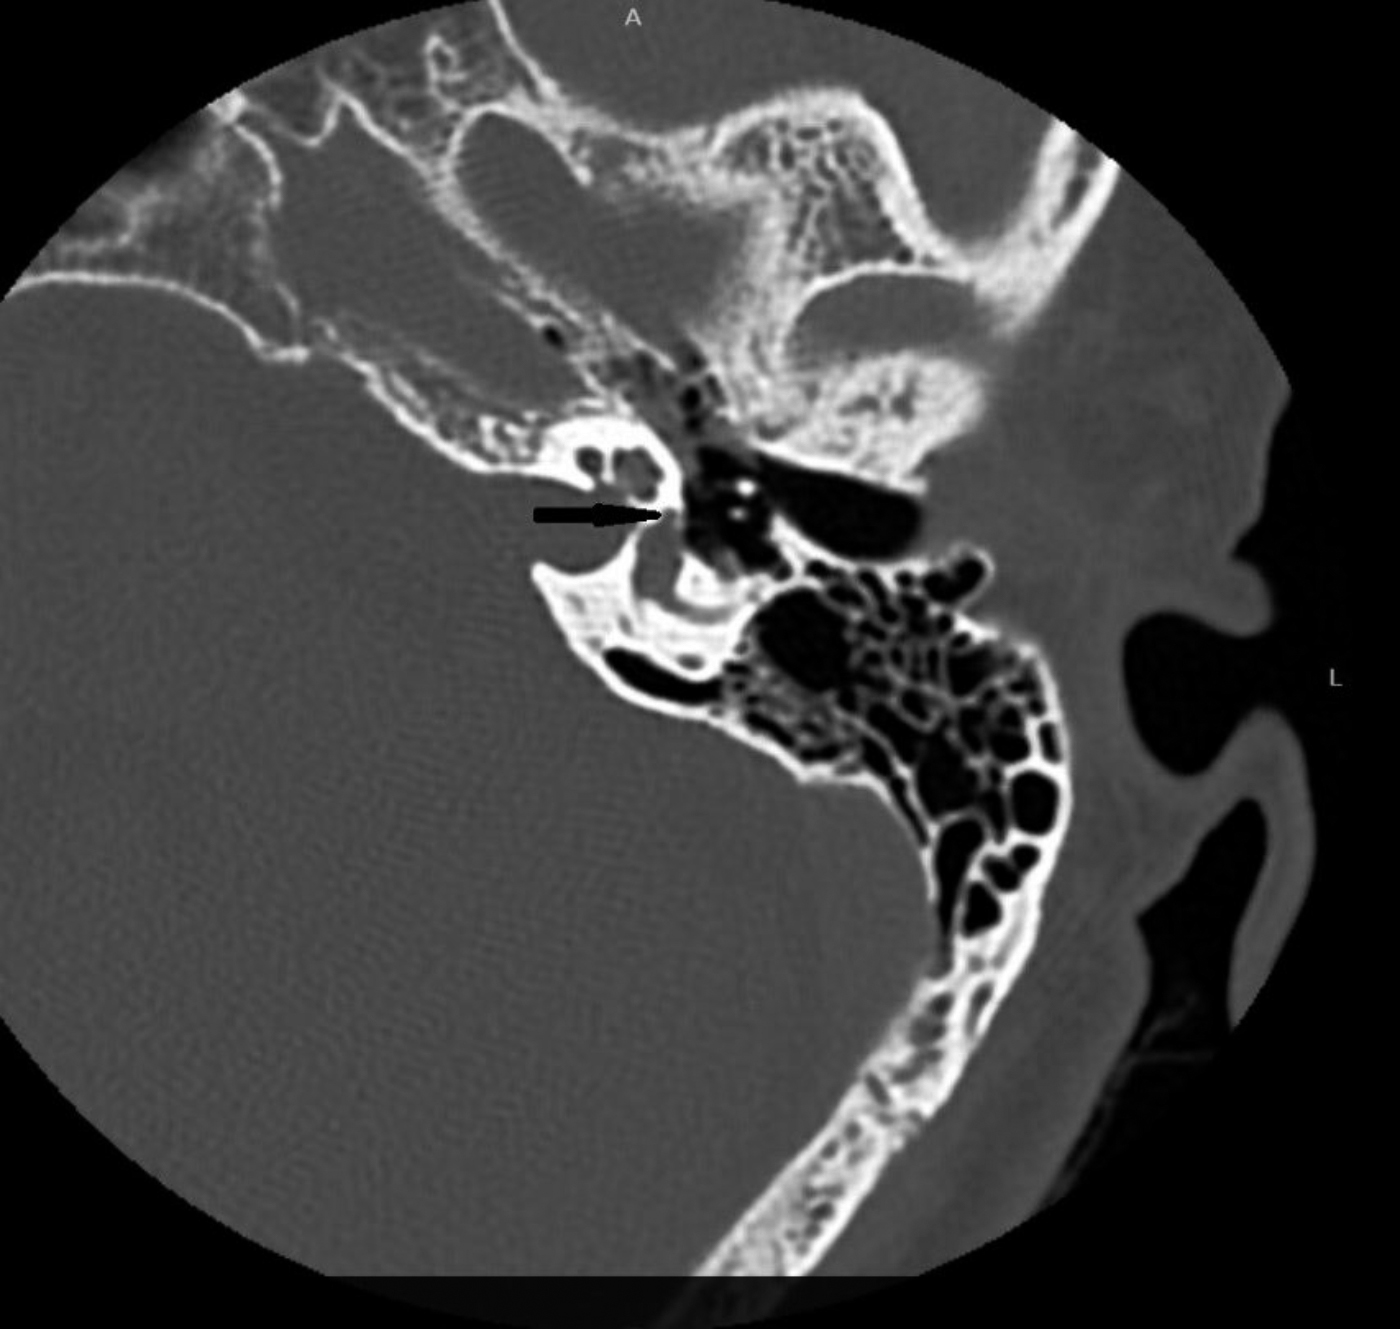 Figure 1: Left axial HRCT image demonstrating otosclerotic focus as bone demineralisation (black arrow) (a patient in group 1).
Median preoperative AC PTA and mean ABG PTA values were calculated for intraoperative macroscopic classification groups (Table II). AC PTA and ABG PTA values were significantly higher in the white footplate group (p=0.001 and p=0.005, respectively, Table II). Statistically significant differences were found between the preoperative and postoperative AC PTA, BC PTA, and ABG PTA (p <0.001). Postoperative ABG was found between 0 and 10 dB in 62.6% of patients. The overall success rate was found as 91.9%. The best audiological outcomes were in Group 0, and the worst outcomes were in Group 3 on HRCT findings (p=0.002, Table I). The postoperative AC PTA, ABG and ABG difference were higher in the white footplate group, with statistically significant differences compared to blue footplate group (p=0.039, p=0.001, p=0.029, respectively, Table II).
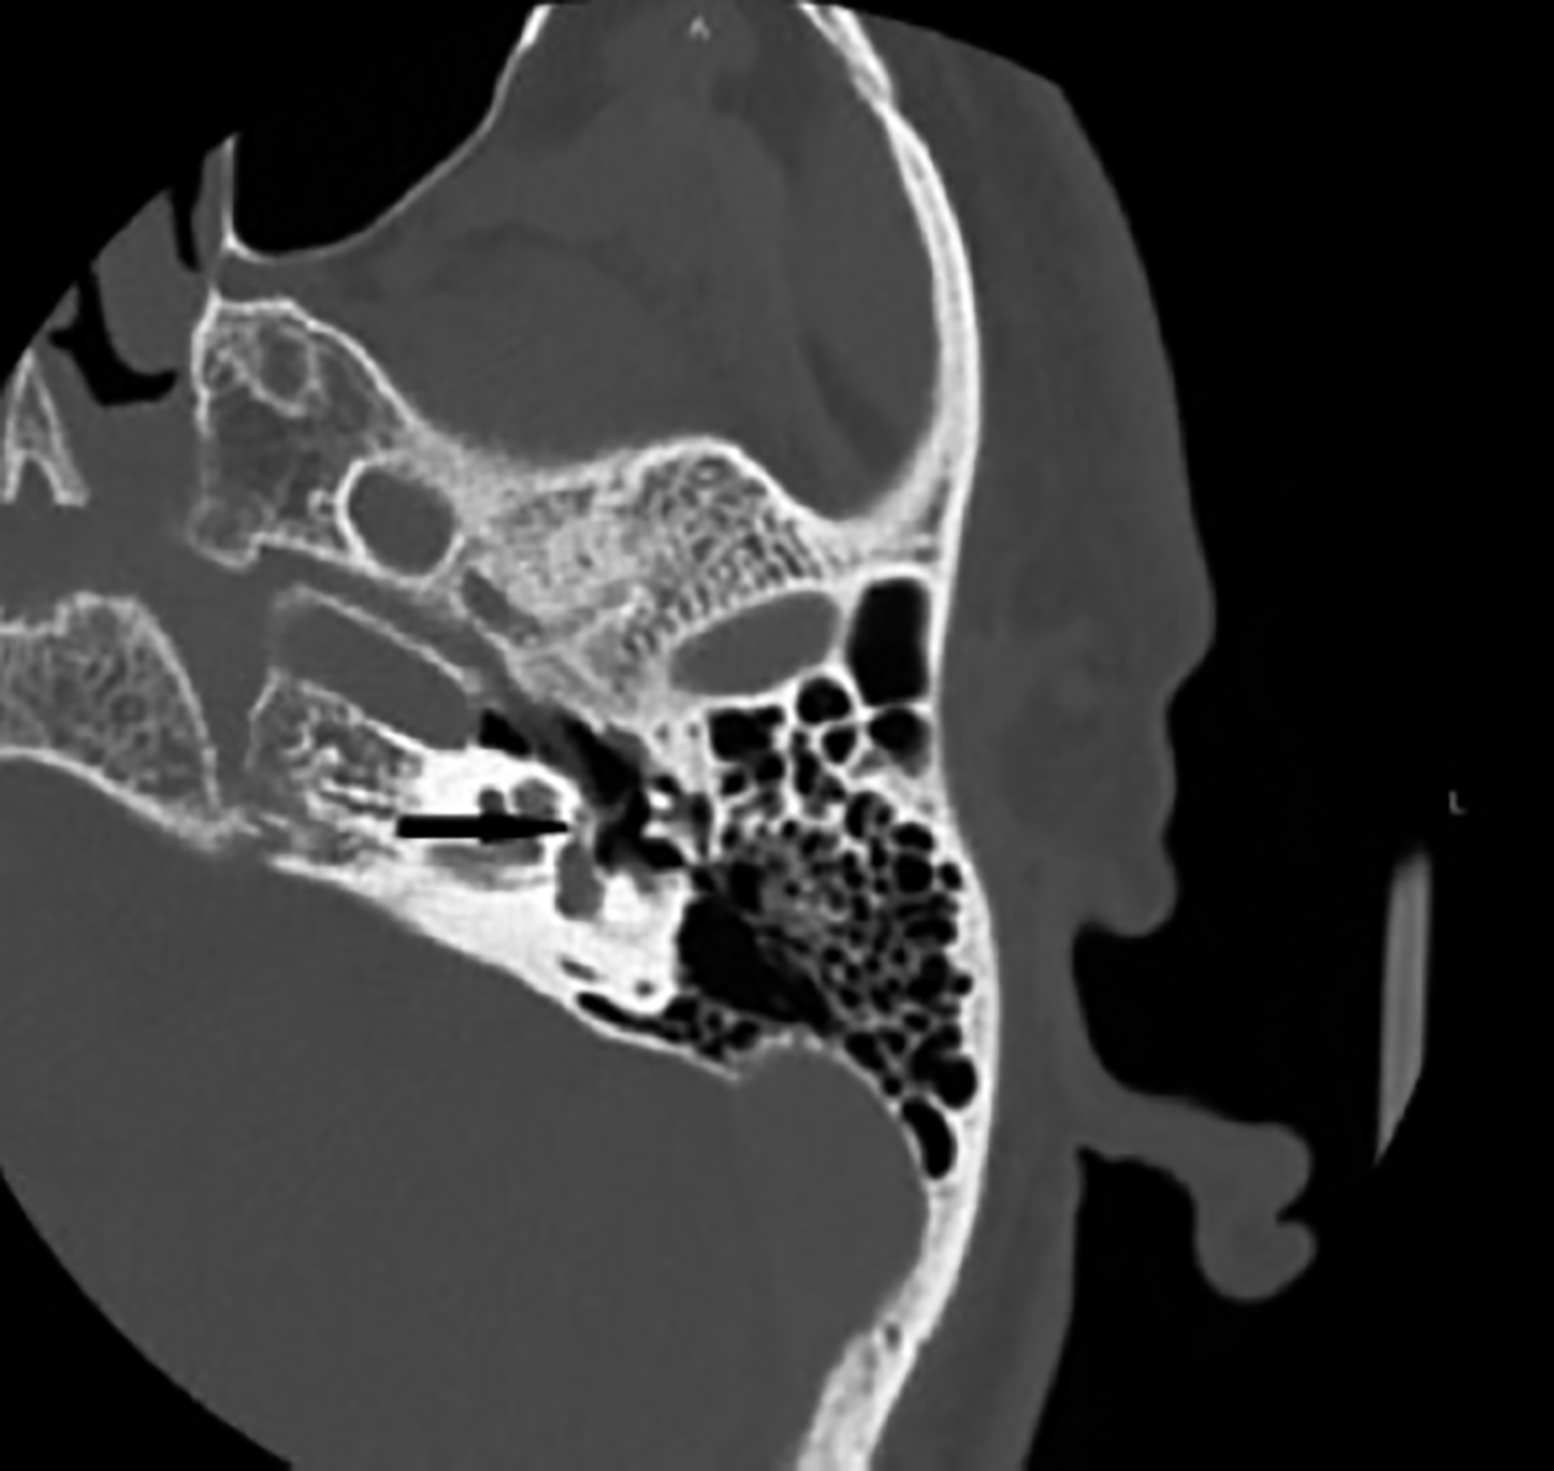 Figure 2: Left axial HRCT image demonstrating otosclerotic focus as bone demineralisation (black arrow) (a patient in group 2).
DISCUSSION
Otosclerosis should be suspected in case of unilateral or bilateral slowly progressing hearing loss, in absence of other causes of hearing loss and in presence of similar complaints in the family.7,8
Main treatment modality of otosclerosis is surgery. Several studies have been investigated about the effect of prognostic factors on surgical outcomes.
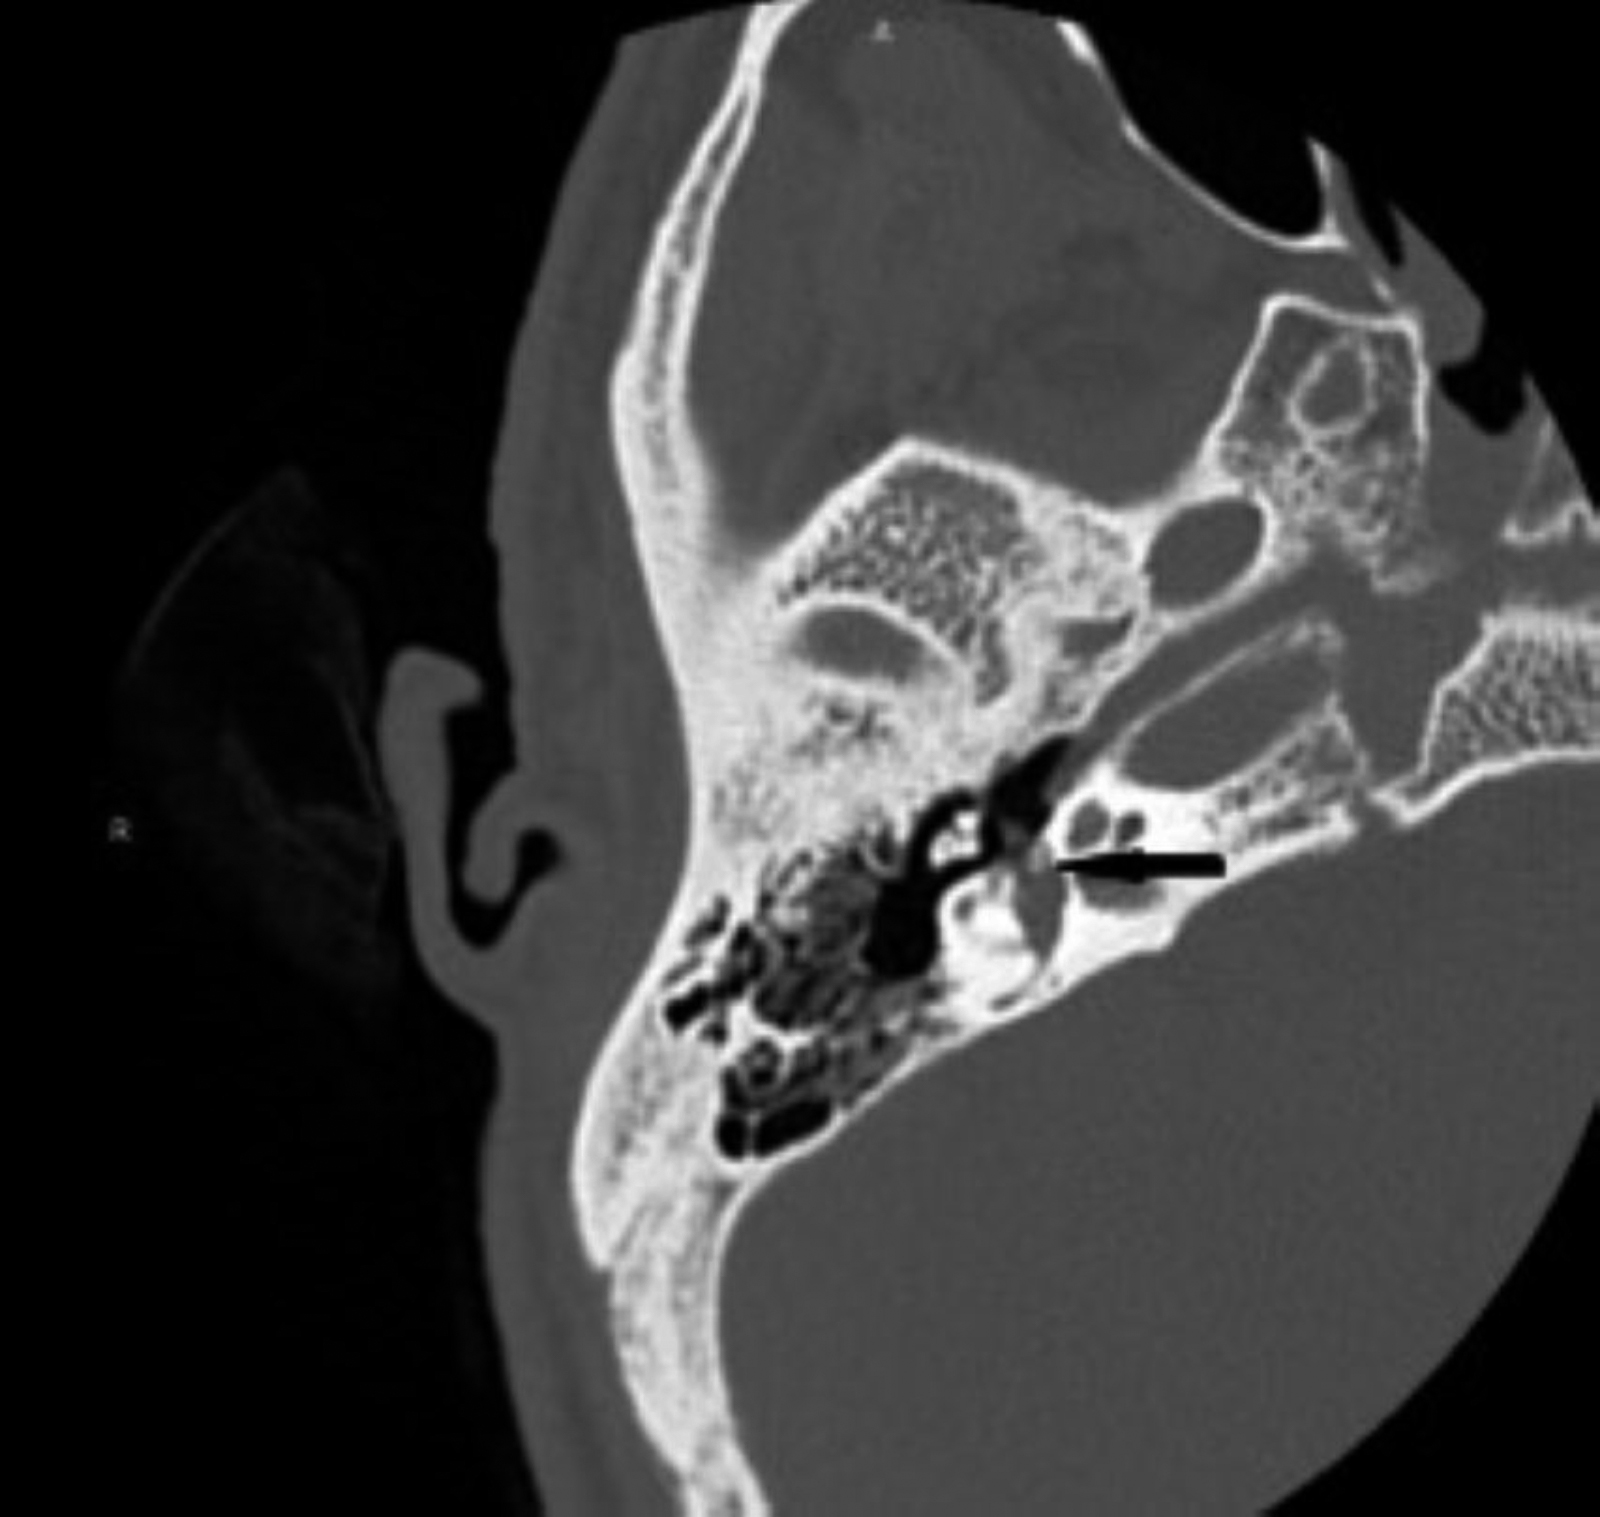 Figure 3: Right axial HRCT image demonstrating otosclerotic focus as bone demineralisation (black arrow) (a patient in group 3).
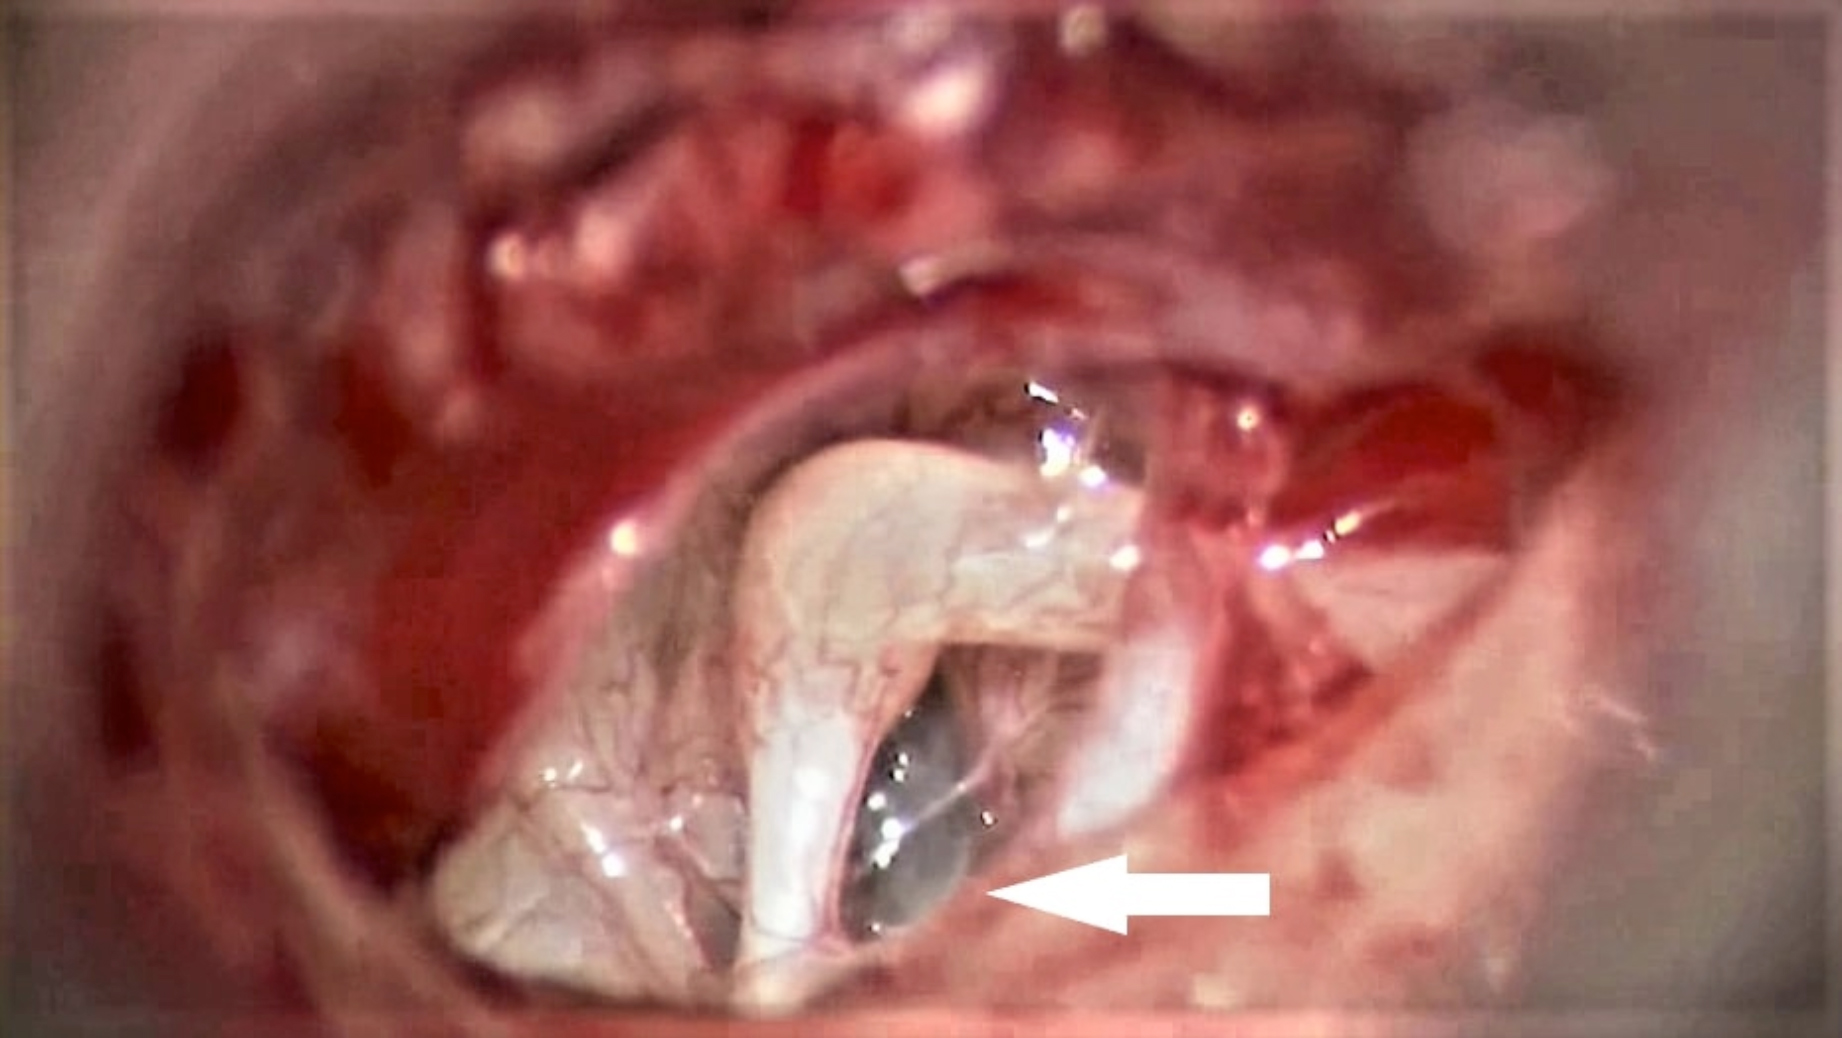 Figure 4: Otomicroscopic image showing a blue footplate (white arrow).
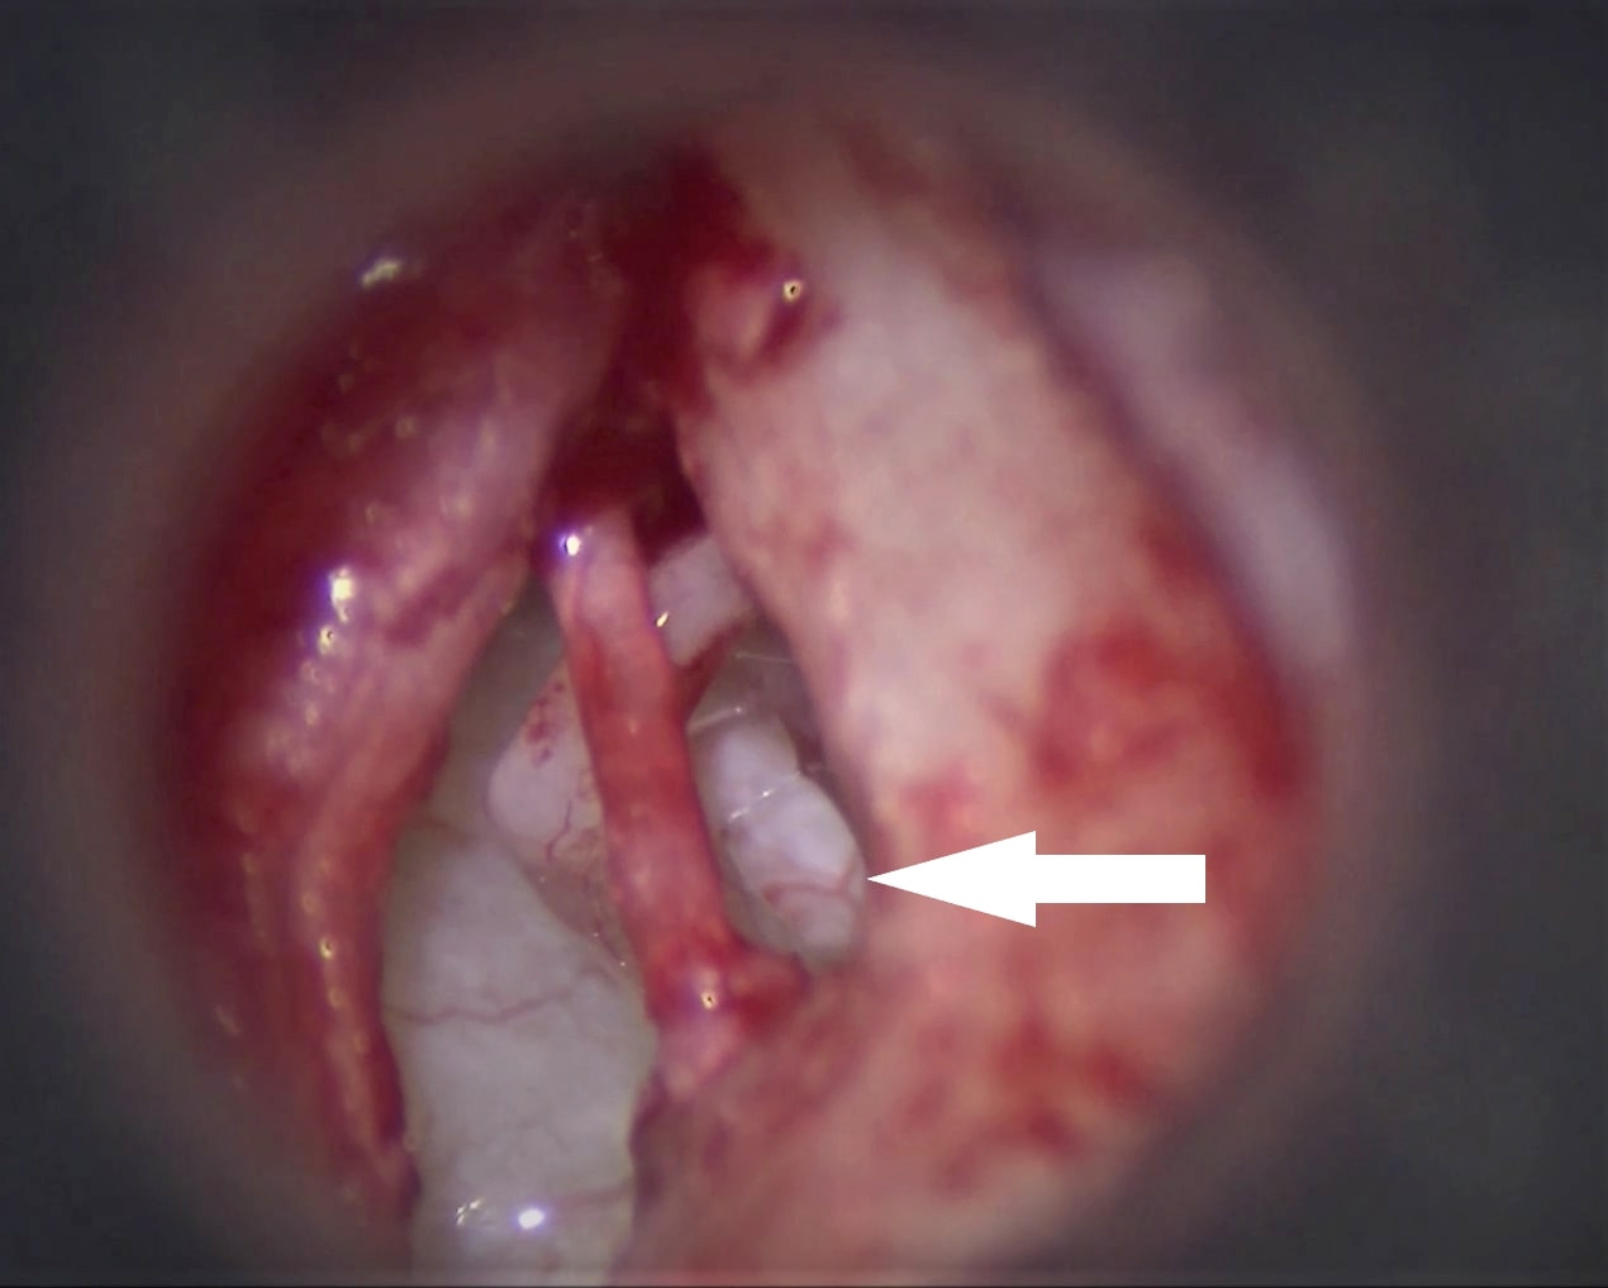 Figure 5: Otomicroscopic image showing a white footplate (white arrow).
Quaranta et al. investigated the impact of intraoperative factors on outcomes of otosclerosis; surgery; and found that obliterative pattern predicted a suboptimal functional outcome.9 Baklaci et al. showed that a preoperative wide ABG was poor prognostic factor for surgical success in patients with otosclerosis.10 When the results of audiometric measurements, temporal bone HRCT, and intraoperative macroscopic classification are taken altogether, they may still be insufficient to determine the surgical success. The success rates were reported as 94%, 91%, 82%, 71% and 87% by Wincent et al., Topdağ et al., Kisilevsky et al., Brujin et al. and Ahmed et al.,15 respectively.11-15 The surgical success rate in this study was 92%.
Demineralisation or radiolucent foci may be detected at fissula antefenestram or adjacent regions or otic capsule.7 Temporal bone HRCT significantly contributes to disease staging, surgical planning, and prognosis determination. It is, therefore, recommended to be used in the diagnosis.16 Min et al. compared the intensity ratios and sizes of otosclerotic foci appearing as hypodense areas with preoperative and postoperative audiological findings, and found a significant correlation between postoperative mean ABG values.7 Kiyomizu et al. reported a correlation between the size of otosclerotic focus and ABG values.17 Naumann et al. investigated whether there was a correlation between audiological test data and the classification based on localization–extensiveness of fenestral and retrofenestral otospongiotic foci in HRCT, and found a significant correlation between the size of fenestral otosclerotic foci and ABG values.5
Previous studies have reported significant changes in the preoperative and postoperative audiometric measurements in cases with retrofenestral (cochlear) involvement, and that these involvements affected the surgical results.17,18 In this study, retrofenestral otosclerosis patients with sensorineural hearing loss were excluded from the study, based on exclusion criteria. In this study, postoperative ABG increased as HRCT class increased from 0 to 3, meaning a more extensive otosclerotic focus. The results of this study showed that an extensive otosclerotic focus involving oval window seen on HRCT predicts a worse postoperative hearing outcome.
The color of the visible portion of the stapes footplate was intraoperatively evaluated by Malafronte et al.1 and classified as blue otosclerosis, white otosclerosis, and obliterative otosclerosis. In their study, 77% of the patients who underwent stapedotomy were identified to have blue footplates, and 23% were identified to have white footplates. Malafronte and Filosa found that the rate of blue otosclerosis was 74% and that of white otosclerosis was 26%.19
They found preoperative AC PTA as 65.9 dB and 66.8 dB, respectively, and reported no significant difference between the two groups. In the same study, it was found that hearing results were significantly better in the blue otosclerosis group compared to the white otosclerosis group.
In the present study, the frequency of blue otosclerosis (73%) and white otosclerosis (27%) were consistent with those in previous studies. Mean preoperative AC PTA and ABG PTA values were found to be significantly higher in the white footplate group. Postoperative AC PTA, postoperative ABG and ABG difference were significantly higher in white otosclerosis group compared to blue otosclerosis group.
CONCLUSION
Postoperative audiological findings were found to be correlated with intraoperative and HRCT findings. A white footplate seen at surgery or a more extensive otosclerotic focus on temporal HRCT indicates a poor audiological outcome. HRCT findings should be taken into account when planning the surgery.
ETHICAL APPROVAL:
Ethics Committee approval was received for this study from the ethics committee of University of Health Sciences, Ankara Numune Training and Research Hospital (Number: E-18-2072, June 26, 2018). All procedures performed in this study, involving human participants, were in accordance with the ethical standards of the Institutional and/or National Research Committee and with the 1964 Helsinki Declaration and its later amendments or comparable ethical standards.
PATIENTS’ CONSENT:
Informed consents were obtained from all individual participants included in the study.
CONFLICT OF INTEREST:
The authors declared no conflict of interest.
AUTHORS’ CONTRIBUTION:
MFK, MC, KMO, AI: Contributions to the conception or design of the work.
MFK, KMO, AI, HHD: Drafted the work and revised it critically.
MFK, MC, KMO, AI, SE HHD: Gave final approval of the version and agreed to be accountable for all aspects of the work.
REFERENCES
- Malafronte G, Filosa B, Cantone E. New macroscopic classification of stapedio-ovalar otosclerosis: A simplified rating for training in stapedotomy. Otol Neurotol 2008; 29(7):889-92. doi: 10.1097/MAO.0b013e31818201de.
- Virk JS, Singh A, Lingam RK. The role of imaging in the diagnosis and management of otosclerosis. Otol Neurotol 2013; 34(7):e55-60. doi: 10.1097/MAO.0b013e3182 98ac96.
- Tos M. Surgical solutions for conductive hearing loss of them annual of middle ear surgery. New York: Thieme 2000; p. 83-94.
- Kanzara T, Virk JS. Diagnostic performance of high resolution computed tomography in otosclerosis. World J Clin Cases 2017; 5(7):286-91. doi: 10.12998/wjcc.v5.i7. 286.
- Naumann IC, Porcellini B, Fisch U. Otosclerosis: Incidence of positive findings on high-resolution computed tomo-graphy and their correlation to audiological test data. Ann Otol Rhinol Laryngol 2005; 114(9):709-16. doi: 10.1177/ 00034 8940511400910.
- Monsell EM. New and revised reporting guidelines from the committee on hearing and equilibrium. American academy of otolaryngology-head and neck surgery foundation, Inc. Otolaryngol Head Neck Surg 1995; 113(3): 176-8. doi: 10.1016/S0194-5998(95)70100-1.
- Min JY, Chung WH, Lee WY, Cho YS, Hong SH, Kim HJ, et al. Otosclerosis: incidence of positive findings on temporal bone computed tomography (TBCT) and audiometric correlation in Korean patients. Auris Nasus Larynx 2010; 37(1):23-8. doi: 10.1016/j.anl.2009. 04.010.
- Driscoll CLW, Carlson ML. Otosclerosis. In: Lalwani AK, editor. Current Diagnosis&Treatment Otolaryngology Head and Neck Surgery, ed.3rd, USA: McGraw-Hill Companies, Inc.; 2012: p.689-98.
- Quaranta N, Piccininni K, Romanello M, Lucidi D, Sergi B. The impact of intra-operative factors in otosclerosis outcomes: Retrospective study in a tertiary centre. Acta Otorhinolaryngol Ital 2019; 39(3):197-204. doi: 10. 14639/0392-100X-2004.
- Baklaci D, Kuzucu I, Guler I, Kum RO, Ozcan M. Analysis of factors affecting postoperative functional outcome in patients with otosclerosis. Auris Nasus Larynx 2020; 47(2):203-8. doi: 10.1016/j.anl.2019.07.009
- Vincent R, Sperling NM, Oates J, Jindal M. Surgical findings and long-term hearing results in 3,050 stapedotomies for primary otosclerosis: A prospective study with the otology-neurotology database. Otol Neurotol 2006; 27(8 Suppl 2):25-47. doi: 10.1097/01.mao.0000235311. 80066.df.
- Topdağ DO, Topdağ M, Aydın O, Keskin G, Oztürk M, Işeri M. Evaluation of efficacy of otosclerosis surgery on hearing outcomes. Kulak Burun Bogaz Ihtis Derg 2014; 24(3):137-47. doi: 10.5606/kbbihtisas.2014.09734.
- KisilevskyVE, Dutt SN, Bailie NA, Halik JJ. Hearing results of 1145 stapedotomies evaluated with Amsterdam hearing evaluation plots. J Laryngol Otol 2009; 123(7): 730-6. doi: 10.1017/S0022215109004745.
- de Bruijn AJ, Tange RA, Dreschler WA. Efficacy of evaluation of audiometric results after stapes surgery in otosclerosis. I. The effects of using different audiologic parameters and criteria on success rates. Otolaryngol Head Neck Surg 2001; 124(1):76-83. doi: 10.1067/ mhn.2001. 111601
- Ahmed S, Raza N, Ali L, Ullah S, Iqbal S. Hearing improve-ment after stapedotomy using teflon loop prosthesis. J Coll Physicians Surg Pak 2006; 16(10):659-61. doi: 10.2006/JCPSP.659661.
- Kanona H, Rana I, Offiah C, Patel N. Importance of a dedicated neuroradiologist in reporting high-resolution computed tomography for otosclerosis: A retrospective comparison study of 40 patients. J Laryngol Otol 2017; 131(6):492-6. doi: 10.1017/S0022215117000561.
- Kiyomizu K, Tono T, Yang D, Haruta A, Kodama T, Komune S. Correlation of CT analysis and audiometry in Japanese otosclerosis. Auris Nasus Larynx 2004; 31(2):125-9. doi: 10.1016/j.anl.2004.01.006.
- Marx M, Lagleyre S, Escudé B, Demeslay J, Elhadi T, Deguine O, et al. Correlations between CT scan findings and hearing thresholds in otosclerosis. Acta Otolaryngol 2011; 131(4):351-7. doi: 10.3109/00016489.2010. 549841.
- Malafronte G, Filosa B. Fisch's reversal steps stapedotomy: When to use it? Otol Neurotol 2009; 30(8):1128-30. doi: 10.1097/MAO.0b013e3181be686e.