INTRODUCTION
Running remains one of the most popular fitness activities, as it is convenient, inexpensive, and a recognized way to maintain good health and wellness. Distance runners are consistently pushing the envelope of their sport, trying to run further and faster than ever before. As such, there has been an increase in ultra-distance running events, characterized as being 50 km or longer, and along with it an increase in musculoskeletal injuries brought on by the repeated stresses of running such long distances.1
Several previous studies have examined the effect of fatigue on running kinematics and kinetics in novice and competitive runners. Maas et al.2 found that after an exhaustive run, both novice and competitive runners showed kinematic changes at the trunk, pelvis, hip, and knee, but that the changes in novice runners were more pronounced. Novice runners were defined as individuals who ran less than 10 km/week and neither had a history of competitive running nor were following a running program. Similarly, Koblbauer et al.3 found that novice runners had increased trunk flexion and ankle eversion with running-induced fatigue. Mohler et al.4 defined expert runners as those individuals who 1) trained more than 50km/week, 2) were able to run a 10km in less than 35 minutes, and 3) maintained an active membership with a running club. Expert runners showed increased stance time and decreased double float time with increased upper body movements during an exhaustive run.
Considering the effect of the foot-ground impact, which generates ground reaction forces (GRFs) associated with overuse musculoskeletal injury, the act of running actually imposes less stress on the body when compared to other sports.5 However, as running mileage increases, the magnitude of the foot-ground impact can become significant. Derrick et al.5 found that although the changes in kinematics due to exhaustive running did potentially increase impact shock, overall shock attenuation also increased which counteracted the increased impact shock, thus negating potential increased injury risk.
The systematic review by Ceyssens6 revealed that while multiple studies have shown an association between kinematics and kinetics variables and running-related injury (RRI), there is still not strong evidence about the relationship between these biomechanical variables and RRI. Furthermore, the effect of a 10 km training run at a self-selected speed on running kinematics and kinetics is unknown. Do runners alter their running form over the course of a training run at a self-selected pace? Do the changes in running form result in altered GRFs? Do these changes result in an increased risk of a RRI? These research questions led to the primary research purpose, which was to investigate the effects of a 10 km run on running kinematics and kinetics in a sample of experienced runners. The secondary purpose was to determine if these effects were different between the recreational runners and the ultra-runners.
PARTICIPANTS
This study was a cross-sectional study of experienced distance runners with a single data collection session for each runner. An “experienced” runner was operationally defined as a runner who had averaged at least 20 miles/week running over the past year. Participants were recruited from the Denver metro area using posted flyers around the university and in gyms. Running clubs were also contacted and asked to distribute the recruitment flyers. Inclusion criteria included: age 18-50 years, an average of at least 20 miles running per week over the prior year, experience running on a treadmill, comfortable with running a 10 km, no history of limb deformity or surgery to correct limb deformity, and no RRI for the past three months that led to an inability to run for at least three consecutive days. If the runner had completed an ultra-running event (50 km or greater) within the past three years they were classified as an ultra-runner; all others were classified as recreational. The final sample consisted of 12 males and seven females between ages 18-48, eight of whom were ultra-runners, and 11 who were recreational runners.
METHODS
This study was approved by the Regis University Institutional Review Board. Upon arrival, participants reviewed and if agreeable to the terms of the consent, completed the IRB-approved consent form. Runners then took a web-based survey regarding their running training and RRI history. Height, weight, and vitals (blood pressure and heart rate) were measured and recorded. The protocol for treadmill analysis has been used in previous studies7 and the reliability of the 2D measures has been established.8 Each participant was asked to identify their preferred running speed for a typical training run and then were gradually brought to that speed on a fully instrumented treadmill (Bertec Corporation, Columbus, OH). Runners wore their own running shoes and completed at least six minutes of running at their self-selected speed so that they could acclimate to the treadmill. During the final minute of the acclimatization run, running cadence was counted by one of the researchers (KM).
Once the participant had completed at least six minutes on the treadmill and indicated they were acclimated to it, the treadmill was slowed to a stop and reflective markers were placed on the lower limbs in the following locations: left anterior superior iliac spine, bilateral posterior superior iliac spine, lateral condyle of the left femur, left lateral malleolus, left posterior calf above the Achilles tendon (two markers), and over the midline of the left heel (two markers). These locations are consistent with the marker set used in a previous study examining the reliability of 2-D kinematic analysis.8
To maximize consistent placement of the reflective marker for the post-run analysis, the runner’s skin was marked with a skin marker at the reflective marker locations.
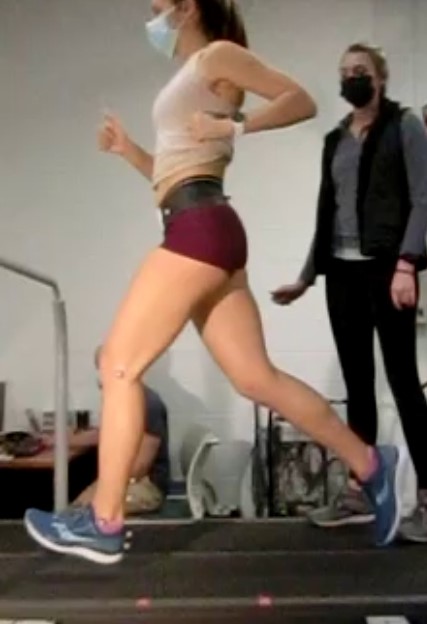
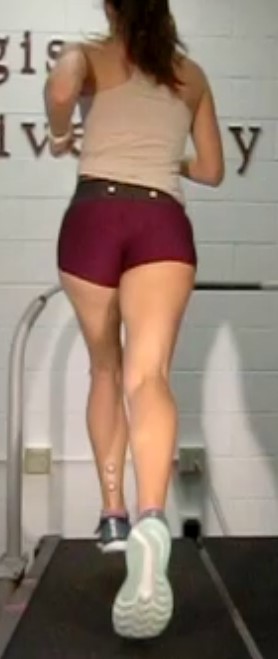
After all markers were in place, the participant was asked to resume running on the treadmill at their pre-selected running speed. When the subject indicated they were comfortable on the treadmill, video data were recorded for the left sagittal plane (lateral view, Figure 1) and frontal plane (posterior view, Figure 2) for 30 sec each using a single high-speed camera (Model# EX FH25, Casio America Inc., Dover, NJ 07801) at 240 frames/sec. Simultaneous to the video capture, GRFs were recorded at 1200 Hz through the instrumented treadmill deck.


Each runner then ran a 10 km run on a paved trail followed by two members of the research team on bicycles. All runners completed the same running course at their self-selected training pace. When the runner returned to the lab after the 10 km run, the reflective markers were immediately reattached to the runner’s skin guided by the skin markings placed before the run. Once all markers were attached, the participants were asked to start running on the treadmill at the same speed as was selected for the pre-run analysis. As soon as the subject indicated they were comfortable on the treadmill, video data and GRF data were recorded in the same fashion as for the pre-run data collection.
DATA ANALYSIS
The video clips for each runner were assessed by a single rater (MFR) who has over 15 years of experience performing 2-dimensional video-based running analyses on runners. All angles were measured in degrees and all distance measurements were recorded in centimeters using a free-access video analysis software program (Kinovea, version 0.9.5, http://www.kinovea.org). A series of t-tests were performed to determine if there were differences between pre-run and post-run data for all kinematic variables assessed in this study, including shoe angle, leg angle, knee flexion at initial contact, knee flexion at midstance, total knee flexion, hip extension at toe-off, trunk lean, change in pelvic angle between initial contact and mid-stance, change between hip adduction angle at initial contact and midstance, change in rearfoot angle between initial contact and midstance, and vertical excursion of center of mass. Additionally, measured vertical ground reaction force, average loading rate, and braking impulse were compared between pre- and post-run. All statistical analyses were performed using SPSS Statistics, Version 26 (IBM Corporation, Armonk, New York 10504). Bonferroni adjustment of an alpha level of .05 was used for all tests of significance.
RESULTS
Participant demographics are provided in Table 1. A significant difference existed for cadence as measured pre-10 km run between recreational runners and ultra-runners, with ultra-distance runners having a higher cadence (p=0.045). Only two runners had been running less than two years with 12 athletes running regularly for over five years. Six of the runners were training over 40 miles/week with the remaining 13 runners training between 20 and 40 miles/week, and most runners (n=15) were running at a pace between 7 min/mile and 9 min/mile. Most of the runners exhibited a rearfoot strike pattern (n=14); the four participants who were forefoot strikers were equally split between ultra-runners and recreational-runners.
Table 2 provides the kinematic data of all participants before and after the 10 km run. The mean differences between the pre-run and post-run were less than 1.5° for all kinematic variables. The spatiotemporal variables (Table 3) for all participants include stride length as represented by the distance between heel at foot strike and a vertical line from the estimated center of mass normalized by body height and the vertical excursion of the estimated center of mass also normalized by body height. The pre-run and post-run differences were less than 0.5% for both variables. Table 4 provides mean values for all kinetic variables. There were also no significant differences in these variables comparing pre-run and post run data. For the kinematic, spatiotemporal, and kinetic data, there were no differences between the ultra-runners and the recreational runners.
DISCUSSION
The objective of this study was to compare the effect of a 10 km run on running kinematics and kinetics in a sample of experienced distance runners, including both ultra-runners and recreational runners. No significant differences between pre-run and post-run values were found for the kinematic, spatiotemporal, and kinetic data.
There are only a few studies examining kinematic and kinetic changes following a run. Derrick et al.5 examined kinematic adjustments in recreational runners during a two-mile exhaustive run and found that after the run, knee angle increased at initial contact and rearfoot inversion increased as well. Willwacher et al.9 found significant changes in frontal and transverse plane joint kinematics in competitive and recreational male runners following a 10 km fatiguing run. Möhler et al.4 examined 13 expert runners who ran on a treadmill to exhaustion. These researchers reported a significant increase in range of motion at the knee and ankle following the exhaustive run as a result of fatigue. Specifically, there was an increase in dorsiflexion and external rotation prior to toe-off, knee flexion increased during late-swing and stance phases, and hip flexion decreased at initial contact and increased prior to toe-off. In a second study using subjects who were novice runners, Möhler et al.10 found that following a run to exhaustion at 13 km/h, the runners showed a decrease in ankle dorsiflexion and increased rearfoot pronation. In the current study, the authors did not observe any significant differences in joint kinematic or running kinetics comparing pre-run and post-run values in the included participants. One key difference between the current study design and previous studies is that the runners ran a self-selected pace for 10 km based on their typical training pace, while in the other studies discussed, runners ran to fatigue or exhaustion. The authors intentionally designed this study to examine the effect of a 10 km overground run at a self-selected pace as this is more representative of how distance runners train.
These findings indicate that running kinematics and kinetics did not change after a 10 km run at a self-selected training pace. These findings are promising as they suggest that in a group of experienced runners, running form and forces are stable after a 10 km run and, as such, there does not appear to be an increased risk of injury with training related to changes in form or forces. The authors chose to allow the participants to self-select their running pace rather than requiring an exhaustive effort to better generalize these findings to a larger population and because the majority of training is not an exhaustive effort. Additionally, this study included a subset of ultra-runners, which is a population that has not been well studied at the time of this publication. No significant differences were found when comparing the changes in kinematics or kinetics comparing ultra-runners and experienced runners other than cadence as previously described.
There are several limitations of this study, with the first being the sample size and pool of participants. Having only 19 runners, with an uneven distribution of recreational to ultra-runners, decreased the power of the study. However, the differences between the pre-run and post-run measures were very small, in fact, less than the standard error of the mean for all temporospatial and kinetic variables and for seven of the eleven kinematic variables. Consequently, the authors’ believe that there was, in reality, no differences between the two time-points. Another limitation of the study was the use of a self-selected pace for the run, rather than requiring participants to run at a percentage of their race pace. This made it difficult to control the effort of each participant and resulted in some runners completing the 10 km run slower than their reported training pace and others completing it faster. No measure of fatigue was used in the study to identify the relative fatigue of the runners after the training run. There was also a limitation with the use of markers for data capture. Since runners did not run the 10 km with the markers attached, there may have been some error in the placement of the markers following the 10 km run. However, the authors attempted to minimize this error by using the same researcher to place the markers on all runners and outlined the initial placement of the reflective markers with a skin marker. Lastly, due to the set-up of the testing environment and placement of the instrumented treadmill, data were collected only for the left lower extremity for all participants, whereas previous studies collected data for both limbs.
CONCLUSION
In conclusion, three questions were addressed in this study. The results indicate that there were very minor and non-significant differences between the pre-run and post-run kinematic measures and consequently, indicating that runners do not alter their form during this length of a training run. The results also indicated that alongside no changes in running form and, there were not changes in running kinetics. Finally, as no changes in running form or forces were detected there is no evidence that a runner increased the risk of a RRI as a consequence of fatigue from a 10 km run.
Conflicts of interest
The authors report no conflicts of interest.
Acknowledgements
The authors thank the running athletes who consented to participate in this study and both Mohamed Aziz and Danielle Colvin for their assistance in data collection.