Introduction
Balance is a critical component of athletic performance and injury prevention, and deficits in dynamic balance have been linked with an increased risk of lower extremity injury.1–3 Therefore, the assessment of reliable tests of dynamic balance, and knowledge of the factors which influence performance on these tests is essential for developing injury screening protocols and injury prevention training. The star excursion balance test (SEBT) is one widely used measure of dynamic balance.1,4–6 The SEBT involves single-leg standing while reaching with the opposite limb in eight different directions. Reach distances in each direction are then normalized to leg length. The SEBT has high interrater and test-retest reliability7,8 and performance on the test is indicative of lower extremity injury risk.1–3 However, the time required to perform all eight reach directions may limit the practicality of using the SEBT in clinical settings. Additionally, reach scores in certain directions of the SEBT are highly correlated with one another and thus likely redundant.9
As a result, the Y-balance test (YBT) was created as a streamlined assessment, which includes only the anterior (ANT), posteromedial (PM), and posterolateral (PL) reach directions from the SEBT. Similar to the SEBT, the YBT has excellent interrater and test-retest reliability8 and also predicts risk of lower extremity injury. Plisky et al.2 found high school basketball players were nearly three times as likely to develop a lower extremity injury if there was a greater than 4 cm difference in anterior reach scores between right and left limbs. The same study also reported that players were three times more likely to become injured if the normalized right reach composite score was less than 94% of those with higher composite scores. Gonell et al.3 reported that male soccer players had nearly quadruple the risk of lower extremity injury if they had greater than a 4 cm difference in PM reach distance between legs. Their study also reported an increased risk of injury for players who had a lower composite score than the sample average. Finally, normalized PL reaches of less than 80% leg length have been linked to increased risk of sustaining lateral ankle sprains.10 Given the growing use of the YBT as a clinical tool, and its potential for injury risk screening, it is critical to understand factors related to performance on the test.
Several authors have evaluated kinematic predictors of performance on the reach directions of the YBT and reported mixed results. Fullam and colleagues11 reported moderate, but not statistically significant correlations between sagittal plane hip, knee, and ankle excursion and ANT reach distance. Robinson and Gribble6 reported that hip flexion was significantly correlated with reach distances in all three directions while knee flexion was significantly correlated with reach distances in the ANT direction. Finally, Kang et al.12 reported only ankle dorsiflexion and trunk extension as being significant predictors of ANT reach distances. Both Kang et al. and Robinson and Gribble reported hip flexion as being important for PL and PM reach.6,12 However, Kang et al.12 reported high reaches in the PL and PM directions were achieved using hip flexion and trunk bending while Robinson and Gribble6 reported greater reach distances were achieved using greater hip frontal and transverse plane rotations.
While kinematic predictors of YBT performance have been examined, kinetic predictors of performance are still unknown. The net joint moment an individual can produce at a given joint might influence YBT performance and have implications for correlating YBT scores to deficits in neuromuscular control or strength of the lower extremity. The net joint moments are also likely responsible for the kinematics observed during the screen. However, information regarding the kinetic predictors of performance on dynamic balance tests such as the YBT is limited and addressing this gap is critical for fully understanding the utility of dynamic balance assessments such as the YBT. Therefore, the purpose of this study was to examine kinematic predictors of YBT performance and determine the joint kinetics which predict YBT performance. Based on the previously reported kinematic predictors of YBT performance it was hypothesized that the sagittal plane hip extensor moments would be predictive of ANT, PM and PL reach, while frontal plane hip abductor moments would be predictive of PM and PL reach.
Materials and Methods
Participants
A convenience sample of thirty-one healthy individuals (sex: 15 M, 16 F; age: 23.06 ± 7.03 years; mass: 59.05 ± 9.83 kg; height: 1.72 ± 0.91 m) participated in this cross-sectional study. Participants were volunteers from the campus community and were all moderate to highly trained athletes whose primary sport was running (8.6 ± 6.0 years running experience; 83.7 ± 30.1 kilometers per week). Inclusion criteria included being between the ages of 18 and 45, havjng no injury which disrupted physical activity in the previous six months, and no history of a lower extremity surgery. Participants were recruited from September 2018 through July 2019, with participation occurring in the same time frame. Prior to participation all participants provided written informed consent. All protocols in this study were approved by the Institutional Review Board at Montana State University.
Protocol
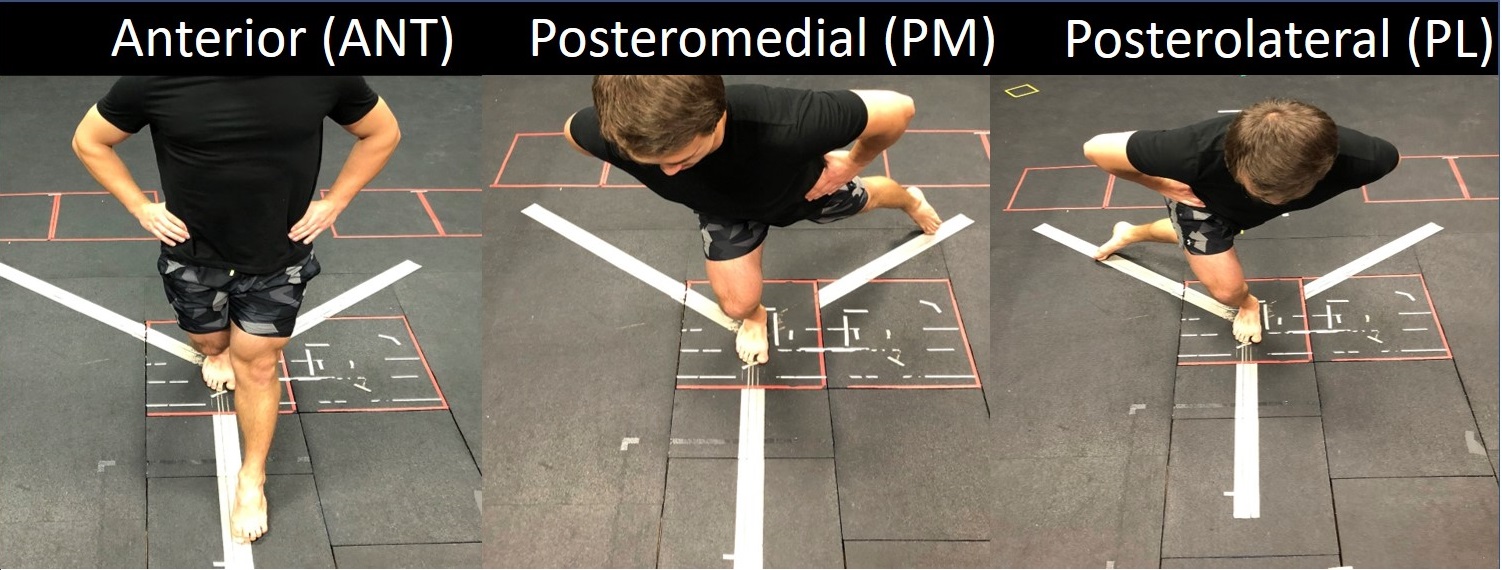
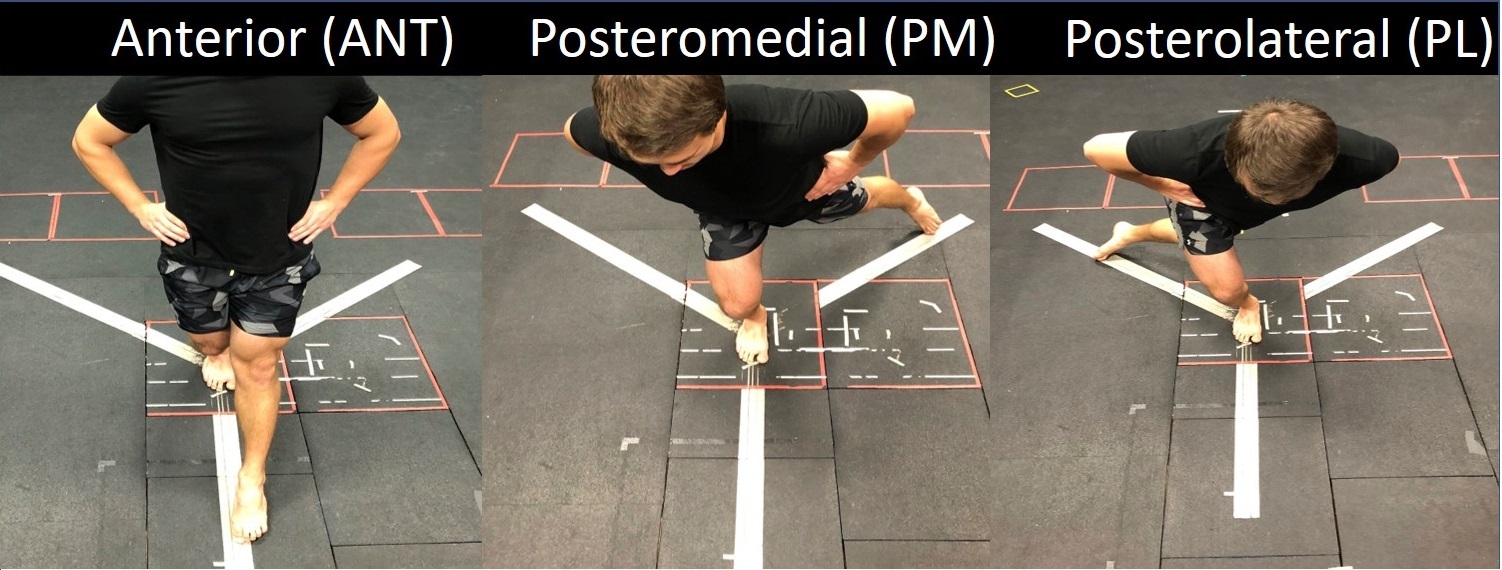
Participants completed a warmup consisting of five minutes of treadmill running at a self-selected pace, followed by a self-selected dynamic stretching routine. They then performed two YBT trials on their dominant limb. Only the dominant limb was considered in this study as previous work has shown no difference in performance between dominant and nondominant limbs in the YBT.13–15 A visual guide for each YBT reach direction was taped on the ground and the subject stood barefoot with the stance foot in the center of this guide.2 Participants were instructed to reach as far as possible in the anterior direction first, followed by the posteromedial and posterolateral directions, and to tap their foot on the ground at the furthest reach (Figure 1). Participants were given approximately one-minute rest between trials. Prior to performing trials, participants received verbal instruction and visual demonstration of the YBT and were allowed two practice trials with corrective feedback.16 All reaches were performed along the taped outline on the floor, and two trials were completed and used for analysis.
Whole body kinematics were recorded using a 10-camera motion capture system (Motion Analysis Corp., Santa Rosa, CA) sampling at 200 Hz while ground reaction forces were simultaneously recorded from a force plate (AMTI, Watertown, MA) sampling at 1000 Hz. Retroreflective markers were placed on the seventh cervical vertebrae and on a headband, and placed bilaterally on the acromioclavicular joints, medial and lateral humeral epicondyles, styloid processes of the radius and ulna, anterior superior iliac spines, iliac crests, posterior superior iliac spines, lateral thigh, medial and lateral femoral epicondyles, lateral shank, medial and lateral malleoli, head of the 1st, 2nd and 5th metatarsals, navicular tuberosities, and the posterior aspect of the heel. Additional tracking clusters of four markers on rigid plastic shells were placed on the lateral aspects of the thigh and shank segments. Following marker placement, a standing static calibration trial was performed after which the medial femoral epicondyle and malleoli markers were removed.
Data Analysis
Raw marker trajectories and ground reaction force data were exported to Visual 3D (C-Motion Inc., Germantown, Maryland, USA) where they were filtered using zero-lag, low pass, Butterworth filters with cutoff frequencies of 8 Hz. To avoid non-physiologic discontinuities in joint moment data, the ground reaction forces were filtered at the same cutoff frequency as the markers.17 Anatomic coordinate systems for the lower extremity were defined based on ISB recommendations.18 Joint angles were calculated as XYZ Cardan angles describing the movement of the distal segment relative to the proximal segment corresponding to flexion/extension, ab/adduction, and axial rotation. Trunk and pelvis angles were calculated using similar rotation sequences and expressed relative to the fixed laboratory coordinate system. Joint moments at the ankle, knee and hip were calculated in each plane using standard Newton-Euler inverse dynamics. Joint moments were expressed as internal moments in the coordinate system of the proximal segment and were normalized to body mass.
The participant’s leg length was calculated using the distance between the ASIS and medial malleolus markers during the static trial. In each direction, reach distance of the participant was measured as the maximum distance between the 2nd metatarsal head markers on the reach limb and stance limb. Reach distances were then normalized to leg length. In each plane, kinematics and kinetics were evaluated at the maximum reach distance for each reach direction.
Statistical Analysis
Peak joint angles and moments at the hip, knee, and ankle, and peak torso and pelvis segment angles in all three planes of motion were calculated on each trial. The mean value for each variable across trials was used for further statistical analysis. Descriptive statistics of each of the above segments were calculated, and the normality of the distributions were analyzed using Kolmogorov–Smirnov tests. Pearson product correlations were analyzed for each kinematic and kinetic variable at peak reach for each reach direction. A stepwise linear regression was performed to determine which kinematic and kinetic variables were predictive of reach distance in each reach direction, with kinematic and kinetic variables each being considered in their own separate regression models. Variables were included in the stepwise regression model if they were correlated with reach distance at the p < 0.2 level. All statistics were performed using SPSS (IBM Corp, Armonk, NY).
Results
Kolmogorov-Smirnov tests indicated all variables were normally distributed (all p > 0.05). Participants’ raw reach scores in the ANT, PL, and PM directions were 0.674 ± 0.068 m, 0.823 ± 0.107 m, and 0.913 ± 0.108 m (mean ± SD), respectively while normalized reach scores were 74 ± 5.8%, 90.7 ± 10.9%, 100.6 ± 10.7% of leg length for the ANT, PL, and PM reach direction, respectively. The kinematics at peak reach distance in each direction of the YBT are shown in Table 1.
Table 2 shows Pearson Product correlations between kinematic variables and normalized reach distance. Hip and knee flexion, torso ipsilateral bending, and pelvis contralateral rotation were highly correlated with reach distance in all three directions.
Table 3 shows the final stepwise linear regression model for kinematic variables and normalized reach distance. A model containing knee flexion and torso contralateral rotation explained 45.8% of the variance in AP reach distances. The combination of hip flexion, ankle dorsiflexion and external rotation explained 76.9% of the variance in PM reach directions. Finally, hip flexion and pelvis contralateral rotation explained 69.6% of the variance in PL reach directions.
Joint moments at the hip, knee and ankle at peak reach distance for each reach direction are displayed in Table 1. Table 4 displays the Pearson Product correlations between kinetic variables and reach distance. Knee extensor moments were strongly correlated with reach distances in all three directions. The kinetic variables included in the final models for the ANT, PM, and PL directions are shown in Table 5. Initially, 20.9% (p=0.01) of the variation in ANT reach distance was explained by the knee extensor moment, and the addition of the hip abductor moment in the stepwise model explained 46.1% (p<0.001) of the variance in ANT reach distance. For the PM direction, the hip extensor moment and the combination of hip extensor moment and hip abductor moment accounted for 44.3% and 67.7% (p<0.001) of the variance in reach distance, respectively. Inclusion of the knee extensor moment increased the explanation of variance for reach distance to 72.6% (p<0.001). The final model for PL reach included only the hip extensor moment, which explained 33.6% (p=0.001) of the variance in PL reach distance.
Discussion
The purpose of this study was to clarify kinematic predictors of YBT performance and determine the joint kinetics which predict YBT reach score in each of the three reach directions. The single best kinematic predictor of performance for ANT reach was knee flexion, and the addition of contralateral torso rotation increased the predictive capability of the model. Hip flexion was the single best kinematic predictor of both posterior reaches, and the addition of ankle dorsiflexion and external rotation improved the PM model, while the addition of contralateral pelvic rotation improved the PL model. The hypothesis regarding which joint moments would predict YBT reach scores, was partially supported. ANT reach was best predicted by the combination of the knee extensor and hip abductor moments. While the hip extensor and abductor moments best predicted PM reach, and PL reach was best predicted by the hip extensor moments
To date, four studies, including the present one, have evaluated kinematic predictors of YBT performance, all reporting different results. Fullam and colleagues11 reported ANT reach direction was moderately correlated with sagittal plane hip, knee, and ankle excursions, only one of which was included in our kinematic model. Kang et. al12 reported a kinematic model for ANT reach which included ankle dorsiflexion and trunk extension, neither of which were significant predictors in our kinematic model. Finally, Robinson and Gribble6 reported that peak hip and knee flexion predicted ANT reach distances, which is partially consistent with our results. The discrepancies in kinematic models for ANT reach distance could be explained by how the ANT reach was conducted. Specifically, Kang et al.12 did not allow participants to lift their heel during the YBT protocol while the current study did not include this limitation with the participants. The allowance of heel lift could reduce the importance of ankle dorsiflexion, while requiring the heel to maintain contact with the ground would emphasize ankle range of motion. That said, Robinson and Gribble6 also did not allow heel lift, and their final kinematic model did not include ankle dorsiflexion. The decision whether or not to allow heel lift is inconsistent across studies, but it is our suggestion that future studies on YBT should not allow heel lift, as plantar flexor strength and ankle ROM have been linked with performance on other balance tests.19,20 Requiring the heel to maintain contact with the ground may increase the ability of the YBT to detect deficits in plantar flexor strength, ankle ROM, and neuromuscular control, and should therefore be required across studies and clinical applications.
While there were some differences in variables included in the final models, the kinematic based prediction models for AP reach, both from previous studies6,12 and the current study, all rely heavily on sagittal plane motion. This highlights the necessity of large range of motion in the sagittal plane in order to perform the ANT reach of the YBT. However, such large ranges of motion require joint stability and how this stabilization happens may reflect individual strategies used to accomplish the AP reach. Robinson and Gribble6 suggest that the knee flexion ROM during the ANT reach of the YBT is an important variable in predicting YBT reach score. The amount of knee flexion that can be achieved is related to the magnitude of the knee extensor moment which can be generated. Indeed, the kinetic model for ANT reach showed that knee extensor moments at peak reach were one of the predictors of ANT reach distance. This finding, coupled with previous studies reporting increased EMG signals in the vasti muscles during the ANT reach21 suggest that the neuromuscular control and strength of the quadriceps muscle group may be crucial for ANT reach performance. Clinically, decreased ANT reach distance might be indicative of insufficient quadriceps function.
The final kinematic model for ANT reach also included contralateral torso rotation. The kinematic model reported by Kang et al.12 noted that trunk extension was an important predictor of ANT reach. Combined, these results suggest that counterbalanced trunk movement, whether obtained through extension or rotation, appears to be important for ANT reach performance. However, it is not possible to effectively rotate the trunk unless one can stabilize the pelvis. In support of this, the final kinetic model for ANT reach also included hip abductor moments as being a predictor of ANT reach distance. Several studies have reported that hip abductor muscle strength is correlated to ANT reach distance22–24 and that gluteus medius activity is highest during the ANT reach direction.25 Thus, clinically, in addition to poor quadriceps function, low ANT reach distances may be indicative of hip abductor insufficiencies. Differentiating between the two requires visualization of YBT performance, and not relying solely on reach distances. Specifically, it is recommended clinicians watch for any knee valgus or femoral internal rotation which may occur during performance of the YBT, as hip abductor weakness has been cited as a contributing factor to both knee valgus and femoral internal rotation.26
In agreement with previous studies,6,12 the kinematic model for both posterior reach directions included hip flexion. The importance of being able to produce large ranges of hip flexion is supported by the kinetic models for posterior reach distances including hip extensor moments for both PM and PL reach, and by other studies which show hip extension strength is strongly correlated with posterior reach performance.22–24,27 However, Kang et al.12 also found that trunk bending away from the direction of reach explained additional variance in both PL and PM reach distances. In contrast, the final kinematic models did not involve any trunk kinematics. Rather, ankle dorsiflexion and rotation improved the PM model, while pelvic rotation improved the PL model. One possible explanation for this difference is the participants in the two studies. While the inclusion criteria were similar, the participants in Kang et al.12 were recreationally active while participants in the current study were moderately to highly trained runners,. Thus, it is possible that participants in the current study had sufficient strength to produce the requisite hip extensor and abductor moments without requiring movement of the torso to counter-balance. While several studies have investigated the relationships between strength and YBT reach distances,22–24,27 to date no studies have reported whether strength influences the strategies individuals use to obtain those reach distances. This would seem to be an important area for future research, as clinically, observing the strategy an individual uses may provide insights into specific deficits in their strength or neuromuscular control.
In addition to hip extensor moments, including the hip abductor moment increased the variance explained by the kinetic model for PM reach. Previous authors have shown that hip abductor strength is correlated with both posterior reach directions.22,27 Hip abduction weakness has also been correlated with an increased risk of lower extremity injury.28 Thus, the ability of the YBT to predict risk of injury may be due the influence of hip extensor and abductor muscle coordination and strength on test performance. This has been suggested for other clinical movement screens such as the single leg drop jump where hip abductor strength is critical for resisting valgus loading of the knee.29 The YBT may predict injury risk through a similar mechanism. As such, clinically, the posterior reaches of the YBT may be especially useful for analysis of hip musculature dysfunction.
There are several limitations to consider when interpreting the results of this study. First, previous studies documenting the ability of YBT to predict injury have included multi-direction sports such as football, soccer, and basketball.1–3 However, participants in the current study were primarily runners, which is a more unidirectional sport. The inclusion of multidirectional athletes, recreationally active, or sedentary individuals may change the kinematic or kinetic predictors of YBT reach scores. Second, subjects performed the YBT barefoot since most prospective studies identifying a relationship between performance on the YBT and injury were done barefoot. It is possible that performance on the YBT, and the relationships observed in the current study, may be influenced either by wearing shoes, or by the type of shoe worn during testing. Third, participants included both males and females who were analyzed together. While some studies have reported differences in YBT reach distances between males and females,30,31 others have reported no differences in reach distances, but differences in the kinematics used to achieve a given reach distance.32 Thus, the relationships observed in the current study may be different if only males or only females were considered. Finally, many YBT studies are performed using the YBT test kit (Move2Perform, Evansville, IN), while this study did not utilize such a device. There may be differences in YBT reach distances between studies which measure reach with a device, and those that measure reach distance as the displacement between bilateral 2nd metatarsals. Future studies should evaluate the effects of footwear and performance method on YBT performance.
Conclusions
In summary, the results of this study indicate that kinematics of the ankle, knee, hip, and torso were all important for predicting YBT reach distances. The joint kinetics during the YBT also predicted performance on the test, most notably, the knee extensor and hip abductor moment explained variance in ANT and PM reaches, while the hip extensor moment explained variance in PL and PM reaches. These results suggest that the ability to generate moments in the sagittal and frontal plane at the hip and knee is critical to YBT performance and may have implications for the ability of the YBT to identify injury risk.
Funding Source
This study was funded by the Ellen Kreighbaum Movement Science Lab Endowment at Montana State University.
Acknowledgements
The authors would like to acknowledge Sara Skammer for her assistance in data collection.
Conflicts of Interest
The authors have no conflicts of interest to disclose.