


Dicarbonyl and oxidative stress may play important roles in the development of diabetes complications, and their response to hyperglycemia could determine individual susceptibility to diabetic nephropathy. This study examines the relationship of methylglyoxal, 3-deoxyglucosone (3DG), and oxidative stress levels to diabetic nephropathy risk in three populations with diabetes. All subjects in the Overt Nephropathy Progressor/Nonprogressor (ONPN) cohort (n = 14), the Natural History of Diabetic Nephropathy study (NHS) cohort (n = 110), and the Pima Indian cohort (n = 45) were evaluated for clinical nephropathy, while renal structural measures of fractional mesangial volume [Vv(Mes/glom)] and glomerular basement membrane (GBM) width were determined by electron microscopy morphometry in the NHS and Pima Indian cohorts. Methylglyoxal and 3DG levels reflected dicarbonyl stress, while reduced glutathione (GSH) and urine 8-isoprostane (8-IP) measured oxidative stress. Cross-sectional measures of methylglyoxal production by red blood cells incubated in 30 mmol/l glucose were increased in nephropathy progressors relative to nonprogressors in the ONPN (P = 0.027) and also reflected 5-year GBM thickening in the NHS cohort (P = 0.04). As nephropathy progressed in the NHS cohort, in vivo levels of methylglyoxal (P = 0.036), 3DG (P = 0.004), and oxidative stress (8-IP, P = 0.007 and GSH, P = 0.005) were seen, while increased methylglyoxal levels occurred as nephropathy progressed (P = 0.0016) in the type 2 Pima Indian cohort. Decreased glyceraldehyde-3-phosphate dehydrogenase activity also correlated with increased methylglyoxal levels (P = 0.003) in the NHS cohort. In conclusion, progression of diabetic nephropathy is significantly related to elevated dicarbonyl stress and possibly related to oxidative stress in three separate populations, suggesting that these factors play a role in determining individual susceptibility.
Patients vary considerably in their propensity to develop diabetes complications. A genetic basis for susceptibility or resistance to the development of diabetes complications has been proposed to explain these observations, suggesting that factors other than glycemic control may be important in their pathogenesis. Strong support for this hypothesis includes concordance of complications in siblings with type 1 diabetes (1) and familial clustering of complications in type 2 diabetic Pima Indians (2). Diabetic nephropathy risk is higher in type 1 diabetic siblings (85%) if nephropathy is present in their proband compared with siblings of probands without nephropathy (15%) (3). Type 1 diabetic siblings also have remarkably similar histological patterns of diabetic glomerulopathy changes (4).
Increased production of advanced glycation end products (AGEs) forms the basis for the nonenzymatic glycation hypothesis of diabetes complications, which over the past decades has gained increasing acceptance as one of the significant mechanisms contributing to the tissue damage seen in diabetes (5–8). Nonenzymatic glycation can be mediated by a large variety of carbohydrates (8–11) including glucose, methylglyoxal, and 3-deoxyglucosone (3DG). Among these sugars, methylglyoxal and 3DG are far more reactive than glucose, forming adducts with amino groups of proteins, nucleic acid, and phospholipids up to 20,000 times more readily than glucose (12).
Although the chemical reactions with these sugars are nonenzymatic, the production and detoxification of these toxic AGE precursors is ultimately controlled by enzymatic mechanisms (Fig. 1). This suggests that genetic and environmental factors that control these mechanisms could regulate tissue glycation and potentially account for the variable complication rates observed when different individuals are exposed to the same degree of hyperglycemia. Testing whether this variable degree of oxidative and dicarbonyl stress generated upon exposure to hyperglycemia may play an important role in susceptibility to nephropathy, we have measured these variables in three populations of diabetic patients, two of whom have undergone sequential renal biopsies to assess progression of nephropathy.
RESEARCH DESIGN AND METHODS
The first cohort, which will subsequently be referred to as the Overt Nephropathy Progressor/Nonprogressor (ONPN) cohort, was recruited at Dartmouth Hitchcock Medical Center and consisted of a complication-resistant group (nonprogressors, n = 7) with type 1 diabetes and no clinical evidence of nephropathy, as defined by urinary albumin excretion (UAE) rates of <30 mg/24 h and glomerular filtration rates (GFRs) of >70 ml/min after ≥25 years of diabetes duration. The second was a complication-susceptible group (progressors, n = 7) who developed overt diabetic nephropathy within 15 years after diabetes onset, as defined by persistent albuminuria of at least 40 mg/24 h. GFR in these groups was determined by creatinine clearance and UAE by radioimmunoassay on 24-h urine collections. HbA1c (A1C) was determined in both groups by high-performance liquid chromatography (HPLC) (Diamat method; Bio-Rad, Hercules, CA). There was one current smoker in the progressor group and two ex-smokers in both the progressor and nonprogressor groups. Because of the distinctly different progression of nephropathy in this cohort, all of the subjects in each group were analyzed by the biochemical parameters noted below.
The second and largest study cohort, which will subsequently be referred to as the Natural History Study (NHS) cohort, consisted of 110 subjects with type 1 diabetes participating in the Natural History of Diabetic Nephropathy Study (13,14). Each subject underwent a renal biopsy at entry and after an interval of 5 years. Glomerular basement membrane (GBM) width and volume fraction of mesangium per glomerulus [Vv(Mes/glom)] were measured on electron microscopic images as previously described (15). Change in these parameters was determined by subtracting the baseline values from 5-year values. This NHS cohort consisted of relatively young individuals (mean age at entry 17 ± 6.3 years) who had no or minimal clinical evidence of renal disease at the time of study. These patients were divided, based on the changes from baseline to the 5-year biopsies, into quintiles from the lowest to the highest values, and these quintiles were compared for the biochemical parameters outlined below. Every 3 months, each subject underwent determination of A1C (Diamat method; Bio-Rad, Hercules, CA) and UAE (fluorescence assay utilizing timed overnight urine collections), while GFR was determined yearly utilizing inulin or iothalomate clearance methods (16). All individuals in this study had normal or elevated GFR and UAE <100 μg/min. Almost all were normotensive at baseline, and there were very few smokers in this cohort, with none in the upper quintile and one in the lower quintile.
The third group consisted of 45 type 2 diabetic Pima Indian patients, subsequently referred to as the Pima Indian cohort, all of whom had undergone a renal biopsy to determine renal morphology. These patients were clinically categorized by urinary albumin-to-creatinine ratio based on spot urine samples as normoalbuminuric (<30), microalbuminuric (30–300), and macroalbuminuric (>300 mg/g), while GFR was measured as the urinary clearance of iothalamate (17). GBM width, [Vv (Mes/glom)], and podocyte number were determined by electron microscopy of renal biopsies obtained at the Stanford University Hospital within 6 months of functional studies (18). Increased GBM width, [Vv (Mes/glom)], and reduced podocyte number were noted as albuminuria increased (18). A1C was determined by HPLC. These patients were divided, based on these measurements, into quartiles from the lowest to the highest values. Quartiles were used in this study, rather than quintiles as in the NHS group, to provide adequate numbers of subjects for analysis, and to achieve morphological correlation with the ∼25% of subjects who had macroalbuminuria. The number of subjects with highest and lowest quartiles for these changes was then compared for the biochemical parameters outlined below.
Approval was obtained in each study from the appropriate human studies committees, and a detailed consent form was reviewed and signed by each subject, and in the case of children, their parents.
Measurement of dicarbonyl stress.
Methylglyoxal production and detoxification to d-lactate in the ONPN and NHS cohorts was measured by erythrocyte response to high glucose incubation. GAPDH activity in the NHS cohort was measured in vitro using erythrocyte incubations while plasma, red blood cells (RBCs), and urine levels of methylglyoxal, 3DG, GAPDH, and oxidative stress (isoprostanes and GSH) were measured in vivo. Methyl glyoxal, d-lactate, and 3DG were determined in plasma in the third (Pima Indian) cohort.
Sample preparation.
Methylglyoxal was measured in plasma and reduced glutathione in erythrocytes at the time of the 5-year renal biopsy in the NHS cohort and at the time of the single biopsy in the Pima Indian cohort. A1C and GAPDH activity were measured in RBCs, and methylglyoxal, d-lactate, and 8-isoprostanes (8-IPs) were measured in urine specimens collected at the time of the 5-year biopsy in the NHS cohort and at the time of the single biopsy in the Pima Indian cohort. Blood was separated into plasma and erythrocytes and frozen at −80°C until shipment. Aliquots of plasma for the determination of methylglyoxal and d-lactate were deproteinized by perchloric acid (PCA), while samples for 3DG determination were prepared in Centricon YM-30 centrifugal filter devices (Amicon, Beverly, MA). RBC samples for GAPDH and GSH determination were snap frozen and stored at −80°C until processing.
Methylglyoxal was measured on PCA supernatants of plasma, RBCs, and in urine as the 1,2-diamino-4,5-dimethoxybenzene derivative by gas chromatography/mass spectroscopy using a modification of the method of McClellan et al. (19) with C13 methylglyoxal as internal standard.
d-Lactate was measured on PCA supernatants of plasma and cell incubation media by HPLC using a modification of the method of Ohmori et al. (20). d-Lactate was quantified as the O-phenylenediamine derivative of pyruvate, following derivatization and reverse-phase resin removal of endogenous pyruvate and subsequent conversion of d-lactate to pyruvate with d-lactate dehydrogenase. 2-ketobutyric acid was used as internal standard (20). 3DG was measured on plasma filtrates and urine by gas chromatography/mass spectroscopy using the method of Lal et al. (21).
Measurement of oxidative stress.
Reduced glutathione was measured in RBC lysates by the colorimetric 5-5′-dithiobis (2-nitrobenzoic acid) method of Beutler et al. (22). 8-IPs were measured in 24-h urine specimens by the ACE Competitive Enzyme Immunoassay (Cayman Chemicals) following purification of the sample by 8-IP affinity columns (23).
Other measurements.
Erythrocyte incubation systems.
A standardized RBC incubation system was used to study the production and detoxification of methylglyoxal in response to hyperglycemia as previously described (26). Cells were incubated overnight with 5 mmol/l glucose before increasing the glucose concentration to 30 mmol/l. After 32 or 48 h of incubation in 30 mmol/l glucose, the cells were harvested and processed. Cells were pelleted and snap frozen, and media was frozen for later analysis and methylglyoxal, GAPDH activity, and GSH were determined. Media was also analyzed for methylglyoxal and d-lactate.
Measuring glyoxalase activity by d-lactate production from methylglyoxal.
Shorter incubations of RBCs with methylglyoxal utilizing d-lactate as the end product were used to quantify the conversion rates of methylglyoxal as well as the Km and Vmax of glyoxalase in ONPN subjects. Determination of Km, Vmax, and first order kinetics involved incubations of 0.2% RBCs with six concentrations of methylglyoxal (62.5–500 μmol/l) for 2 min.
RBC cryopreservation.
RBCs from the NHS cohort were cryopreserved utilizing the method of Rittmeyer and Nydegger (27) to allow shipping and storage of cells before RBC incubation. Viability of these cells was carefully validated by study of their characteristics following cryopreservation. Cells preserved by this method and stored for up to 2 months produce and detoxify methylglyoxal at rates that are identical to fresh RBCs and show no difference in ATP, 2,3DPG, reduced glutathione levels, or GAPDH activity. Therefore, experiments with cryopreserved RBCs were performed within 2 months of preparation.
Statistical analyses were performed by ANOVA or ANCOVA for categorical data and simple or multiple regression analysis for continuous data and by Mann-Whitney or Spearman rank sum analysis for nonparametric data. Data are expressed as means ± SE.
RESULTS
Characteristics of the three study populations
The ONPN cohort.
In this study, albumin excretion was dramatically higher in the progressors while GFR was lower (P = 0.01, Table 1). No statistically significant differences were observed between the two groups for age and duration of diabetes, and, while A1C in the progressors was higher than in nonprogressors, this difference was not statistically significant (Table 1).
The NHS cohort.
At the 5-year evaluation, all subjects in this cohort had normal or increased GFR (mean 131 ± 26 ml/min). Mean UAE was 9.2 ± 14.2 μg/min and 5 of 110 subjects had microalbuminuria (20–200 μg/min). Patients in the upper quintile of 5-year change in GBM width were younger and had also had shorter duration of diabetes. No associations were observed, however, between the change in GBM width and glycemic control (A1C), UAE, or GFR (Table 1).
The 5-year increase in GBM width in the group with the upper quintile of thickening was 135 ± 22 nm, while that in the lower quintile group was −48 ± 35 nm. The absolute values at baseline were 377 ± 53 and 475 ± 95 nm for the upper and lower quintiles, respectively, and were 512 ± 64 and 427 ± 79 nm at the 5-year biopsy. The upper and lower quintiles consisted of 22 subjects as noted on Table 1.
Pima Indian cohort.
GFR was 156 ± 53 ml/min (range 70–270) (note that the mean value for GFR corrected per 1.73 mol/l2 is 138 ± 44 ml/min). Within this study group, 16 individuals were normoaluminuric (<30), 17 were microalbuminuric (30–300), and 12 were macroalbuminuric (>300 mg/g creatinine). Those in the upper quartile of GBM width had shorter duration of diabetes and higher albumin-to-creatinine ratios. There were no statistically significant differences between the groups with the highest and lowest quartiles of GBM width for age, A1C, or GFR (Table 1).
Since only one renal biopsy was performed in each subject, only absolute values for GBM width were available and were 686 ± 71 nm for the upper quartile and 356 ± 52 nm for the lower quartile. For the Pima Indian cohort there were 11 subjects in each quartile (Table 1).
In vitro studies
Methylglyoxal and d-lactate production by erythrocytes
ONPN cohort.
Increased media methylglyoxal levels, followed by elevation in the levels of d-lactate, were observed after RBCs were incubated for 48 h in 30 mmol/l glucose, indicating high glucose increases flux through this pathway. Media methylglyoxal levels were found to be higher in the progressor group (7,505 ± 2421 pmol/g RBC) than in the nonprogressor group (5,398 ± 672 pmol/g RBC; P = 0.023) (Fig. 2A). Media levels of d-lactate were also significantly higher in the progressor group (2,010 ± 570 nmol/g RBCs) than the nonprogressor group (1,334 ± 551 nmol/g RBCs; P = 0.016) (Fig. 2B). However, no statistically significant correlations were found between media levels of methylglyoxal and either the GFR (creatinine clearance) or A1C for the whole study group.
The NHS cohort.
For technical reasons, the intracellular levels of methylglyoxal in erythrocytes from this population were measured. In agreement with the ONPN cohort, production of methylglyoxal by RBCs in subjects in the upper quintile of the 5-year rates of GBM thickening (251 ± 111 pmol/g RBC) was higher than that in the lower quintile (184 ± 68 pmol/g RBC; P = 0.04). (Fig. 3) This finding proved to be independent of age, duration of diabetes, or A1C. Similar results were seen for media levels of d-lactate (upper quintile 505 ± 155 vs. lower quintile 424 ± 135 nmol/g RBC; P = 0.026). No statistically significant difference was observed in the RBC GAPDH activity in the in vitro incubations of erythrocytes from the upper and lower quintiles of this population. The activity appeared unaffected by incubation with 30 mmol/l glucose, showing the same values at baseline and after 48 h of incubations.
Glyoxalase activity in the ONPN cohort.
The Km and Vmax of glyoxalase, determined in both the progressor and nonprogressor groups, were indistinguishable, averaging 976 ± 175 and 979 ± 594 or 177 ± 48 and 169 ± 65 μmol/ml RBC/min, respectively (Table 2).
Plasma and urine studies
NHS cohort
Glycemic control (A1C) and methylglyoxol and 3DG levels.
There was a strong direct correlation between A1C and 3DG in plasma (r = 0.48, P < 0.0001) and urine (r = 0.62, P < 0.0001) in the entire NHS cohort. Relationships between plasma methylglyoxal and A1C were not statistically significant (r = 0.18, P = 0.09), while urine methylglyoxal showed a trend toward a significant correlation with A1C (r = 0.22, P = 0.076).
Methylglyoxal and changes in GBM width.
Urinary methylglyoxal levels were directly correlated with changes in GBM width, when adjusted for duration of diabetes and A1C levels (P = 0.036) by multiple regression analysis (data not shown). Statistically significant relationships were not found between plasma methylglyoxal levels and change in GBM width on simple regression analysis (r = 0.11, P = 0.28), or after adjustment for the above variables (data not shown).
Isoprostanes and changes in GBM width.
When we investigated the relationship between urinary 8-IP in the upper and lower quintiles and quartiles of 5-year GBM expansion, we did not find statistically significant relationships when 8-IP were expressed as either ng/g creatinine or as total 24-h excretion. If similar analyses were performed for 8-IP expressed as ng/ml, we did find borderline significant differences (P = 0.07) between the groups with the upper and lower quintiles and quartiles of GBM expansion. When we performed post hoc analyses of 8-IP levels (ng/ml) in the upper 50% relative to the lower 50%, we observed significant differences (Fig. 4) (P = 0.007). Since we had urine samples for 8-IP analyses on only 65 of 110 NHS subjects, the power of our analysis was limited relative to other biochemical parameters.
Reduced GSH and changes in GBM width.
RBC GSH levels were inversely related to the 5-year increase in GBM width (r = 0.21, P = 0.037). The significance of this relationship was further enhanced when the analysis was adjusted for diabetes duration and A1C (P = 0.005).
3DG and change in GBM width.
Plasma levels of 3DG were correlated with 5-year change in GBM width (r = 0.34, P = 0.004) (Fig. 5), and this relationship remained significant when adjusted for A1C and duration of diabetes (r = 0.58, P = 0.001). Conversely, no significant correlation was observed between urinary levels of 3DG (μmol/g creatinine) and GBM width (r = 0.05, P = 0.67).
Relationship between plasma methylglyoxal and GAPDH activity.
GAPDH activity was measured to evaluate its relationship to methylglyoxal production. As shown in Fig. 6, RBC levels of GAPDH activity were inversely related to the plasma methylglyoxal/glucose ratio (r = −0.34, P = 0.003).
Although plasma levels of methylglyoxal, d-lactate, and 3DG were numerically higher in those in the upper versus the lower quintiles of progression of GBM thickening, these differences were not statistically significant. This was also the case for 24-h urinary levels of methylglyoxal and 3DG, although urinary levels of d-lactate were slightly higher in subjects in the lowest quintile.
There were no statistically significant relationships between [Vv (Mes/glom)] and any of the above plasma and urine parameters.
Pima Indian cohort
Plasma methylglyoxal in the entire Pima population showed a direct relationship with GBM width (r = 0.37, P = 0.016) that remained statistically significant when adjusted for A1C and GFR (Fig. 7), while podocyte number correlated inversely with methylglyoxal (P = 0.02) (data not shown). A significant relationship between plasma 3DG and GBM width (r = 0.35, P = 0.04, data not shown) was also found. This relationship remained significant when adjusted for diabetes duration, but was no longer statistically significant when adjusted for A1C. Conversely, A1C did not show a statistically significant correlation with GBM width in this cohort (r = 0.23, P = 0.14)
There were higher levels of methylglyoxal (116 ± 28 vs. 78 ± 29 nmol/l, P = 0.04) and 3DG (118 ± 39 vs. 81 ± 28 nmol/l, P = 0.02) in the upper versus lower quartiles of GBM width in this cohort. Plasma levels of DL were lower in the upper versus the lower quartile GBM width group (15 ± 4 vs. 20 ± 7 μmol/l, respectively), although this did not achieve statistical significance (P = 0.12). A significant increase in plasma methylglyoxal in those with macroalbuminuria (120 ± 36 nmol/l) versus those with normoalbuminuria (88 ± 34 nmol/l, P < 0.05) were also observed. Relationships between [Vv (Mes/glom)] and methylglyoxal, d-lactate, or 3DG with regression and categorical analyses were not statistically significant.
DISCUSSION
While a compilation of results from three separate studies done at different times could present some problems, the consistency of the observations in the three groups presented here strengthens the case for the involvement of α-dicarbonyls in the development of diabetic nephropathy. These studies demonstrate that methylglyoxal levels are elevated in diabetic subjects with more rapid progression of nephropathy. There was directional consistency in the in vitro and in vivo observations of two type 1 and the type 2 diabetic cohorts. Erythrocytes from type 1 diabetic nephropathy progressors produced more methylglyoxal and d-lactate than nonprogressors when exposed to high in vitro glucose levels. These results are confirmed by the in vivo studies, which show correlations between morphological and clinical indexes of nephropathy progression and the levels of plasma and urinary methylglyoxal. Moreover, urine methylglyoxal levels reflected the preceding 5-year change in GBM width in the NHS cohort, while in the type 2 diabetic Pima Indian cohort a similar significant cross-sectional relationship between nephropathy severity and plasma methylglyoxal was observed.
These findings, in all instances, remained statistically significant after adjustment for glycemia, suggesting that individuals prone to diabetic nephropathy may be exhibiting higher levels of methylglyoxal stress for a given level of glycemic stress. Conversely, a significant relationship between plasma methylglyoxal levels and nephropathy progression was not seen in our type 1 NHS populations. However, urinary levels of methylglyoxal did correlate with nephropathy progression in this cohort, suggesting that the discrepancy could be related to 24-h integration of methylglyoxal in urine compared with the short half-life of methylglyoxal in plasma. Alternatively, greater renal methylglyoxal production could enhance urinary levels relative to plasma levels in nephropathy progressors. Since methylglyoxal is a potent precursor of AGEs and is toxic in its own right, increased levels in nephropathy progressors are consistent with the concept that methylglyoxal could play a causal role in renal damage. However, since AGEs were not measured, the present study could not directly address this point.
The correlation between increased methylglyoxal production and susceptibility to nephropathy observed in this study could be secondary to increased production, decreased detoxification, or both. The triose phosphates, glyceraldehyde-3-phosphate, and dihydroxyacetone phosphate are the major sources of methylglyoxal and in turn are related to the activity of the immediate downstream enzyme GAPDH (Fig. 1) (26). The 3- to 10-fold accumulation of triose phosphates previously observed in diabetic heart muscle, RBCs, and other tissues could occur as a consequence of increased glycolytic flux and/or reduced ability of the glycolytic enzymes downstream from triose phosphate to handle the increased flux (28,29).
Our recent in vitro studies demonstrated that reduced GAPDH activity is associated with elevation of triose phosphate levels and increased methylglyoxal production (26). The observations, in the large NHS type 1 diabetic cohort, that plasma methylglyoxal levels rise as GAPDH declines, support a role for this enzyme in determining methylglyoxal levels. The reasons for the decrease in GAPDH activity is less clear, but it is well known that the activity of this enzyme is susceptible to a number of metabolic perturbations associated with diabetes, including oxidative stress (30), direct glycation (31,32), and altered redox state with reduced levels of NAD+ (33,34). Not precluded is the possibility that variable susceptibility of GAPDH to such modifications or inherent differences in GAPDH per se could be secondary to genetic factors linked to nephropathy risk (35).
Although the data on oxidative stress was not as compelling as that for increased dicarbonyl production, higher levels of 8-IPs and lower levels of GSH were also seen in nephropathy progressors versus nonprogressors in our NHS type 1 diabetic cohort, suggesting that oxidative stress may be a factor in the progression of diabetic nephropathy lesions. Both of these products have been shown to be sensitive clinical markers of oxidative stress (23,36). The lower levels of GSH seen in nephropathy progressors relative to nonprogressors in this cohort supports this possibility. The finding that urinary 8-IP levels were higher in nephropathy progressors in this cohort, however, were based on a post hoc analysis in groups with the upper and lower 50% of GBM expansion and cannot be considered as strong as the GSH data. These results are consistent with previous studies that have demonstrated an association between diabetes complications and increased oxidative stress, although our findings will require confirmation in an independent study cohort (37,38). Hammes et al. (39) showed an association between diabetic retinopathy and increased oxidative product accumulation, while our studies are the first to show systemic increases in oxidative stress in association with early diabetic glomerular structural changes and, importantly, as a correlate of the rate of structural changes in two renal biopsies performed 5 years apart. The potential mechanisms for oxidative stress could include many factors such as the increased mitochondrial generation of reactive oxygen species (40), decreased activity of protective mechanisms (41), or increased generation of reactive oxygen species from Amadori products or Schiff bases (38). The relationship between increased oxidative stress and increased methylglyoxal production is not clear. One possibility is that increased oxidative stress leads to a direct alteration of GAPDH, resulting in decreased GAPDH activity and increased methylglyoxal production (30,42). Concurrent increases in dicarbonyl and oxidative stress, associated with decreased GAPDH activity in the NHS cohort, is also consistent with Brownlee’s (43) proposed unifying hypothesis of diabetes complications, although our observations more specifically support a role for these mechanisms in the pathogenesis of diabetic nephropathy in human diabetic populations.
The higher levels of methylglyoxal in nephropathy progressors could also be due to decreased activity of its main detoxification enzyme, glyoxalase. Studies of glyoxalase activity in vitro, however, have not shown impairment in diabetes (44,45), and we found no evidence of reduced glyoxalase activity in those patients with nephropathy in the ONPN cohort. Nevertheless, despite normal glyoxalase levels in vitro, the activity of this enzyme may be impaired in vivo due to lower levels of GSH. The decreased levels of GSH seen in the progressors in the NHS cohort and similar data reported by others (36,46) are consistent with this idea. Such impaired detoxification would contribute to the elevated methylglyoxal levels observed.
Levels of 3DG, another α-dicarbonyl, also correlated with diabetic nephropathy progression in the NHS and Pima cohorts. Higher 3DG levels could be generated by greater production of its major precursors, Amadori products or Schiff bases, under hyperglycemic conditions or could be secondary to an inability to detoxify these products by enzymatic mechanisms (47,48). The present study confirms a strong relationship between 3DG levels and the Amadori product, A1C, but also the relationship between nephropathy variables and 3DG remained significant after adjusting for A1C. This suggests that additional environmental or genetic factors could play a role in determining 3DG levels in diabetic patients, but this hypothesis is untested.
It is difficult to completely eliminate the possibility that the microangiopathic process itself leads to, rather than results from, dicarbonyl and/or oxidative stress. To avoid this potential issue as much as possible we did select a group of study subjects, particularly in the NHS cohort, with mainly normal UAE, blood pressure, and GFR at the time of study. We also eliminated the possibility that functional deterioration in renal status occurred at 5 years relative to baseline in this population by determining that there was no evidence of progression of nephropathy based on worsening UAE or decline in GFR. Since, at the end of the 5-year NHS study, most subjects were still at the very early stages of the evolution of diabetic nephropathy, it is more reasonable to argue for a causal implication to these findings rather than an outcome of established kidney disease.
Although strong associations between increased GBM width and dicarbonyl/oxidative stress were observed, similar associations were not seen for mesangial expansion. Mauer et al. (49,50) proposed the importance of mesangial expansion in diabetic nephropathy. These cross-sectional studies of long-standing type 1 diabetic patients with a wide range of renal function, from normoalbuminuria and hyperfiltration to proteinuria and reduced GFR, described somewhat stronger correlations with mesangial expansion and UAE and GFR than with GBM width, though both variables were related to these functional parameters (15,51). There are emerging data, however, that GBM width may be a better earlier predictor of the subsequent clinical course of diabetic nephropathy than mesangial fractional volume (49,52). Bangstad et al. (52) found that GBM width, but not mesangial fractional volume, predicted the likely risk of progression to overt proteinuria in young microalbuminuric type 1 diabetic patients. More recently, Steinke et al. (53) found that GBM width, but not mesangial fractional volume, predicted subsequent development of microalbuminuria in normoalbuminuric participants in the NHS. Also, GBM width, but not other structural variables, predicted the subsequent development of overt nephropathy in normoalbuminuric long-standing type 1 diabetic patients. (M.L. Caramori, M.M., unpublished data). Studies of NHS patients have shown, moreover, that GBM thickening is linear over the first 10–15 years of diabetes, while mesangial expansion is nonlinear, with little increase in the first 15 years (54). For these reasons, GBM width may be a superior earlier predictor of subsequent diabetic nephropathy risk, while mesangial expansion remains a better correlate of later developing clinical manifestations. Since the mean duration of diabetes was ≤10 years in the nephropathy progressors in the NHS and Pima studies, one would predict that GBM width would be the most important indicator of nephropathy progression at the time that our studies were carried out. The lack of correlation between mesangial expansion and methylglyoxal levels may also be secondary to the lower precision and greater variability (SE) involved in the mesangial relative to GBM measurements (49,55). If this is the case it may take larger numbers of subjects, with a wider range of diabetic nephropathy lesions, to see similar associations between dicarbonyl and oxidative stress and mesangial expansion.
In summary, these studies utilizing unique cohorts of diabetic patients support the hypothesis that resistance or susceptibility to diabetic renal complications are, at least in part, associated with variable production of methylglyoxal and 3DG and increased levels of oxidative stress. These results support the work of many previous investigators who have proposed a role for nonenzymatic glycation but also suggest that variation in the activity of processes that produce glycation could account at least for some of the marked variability in diabetic nephropathy risk despite similar hyperglycemic exposure. If confirmed, these observations could underpin new strategies for the prevention and treatment of diabetic nephropathy.


A: Media concentration of methylglyoxal in 48-h incubations of RBCs from subjects in the ONPN cohort. The progressors demonstrated significantly higher values than the nonprogressors (P = 0.03). B: Media concentration of d-lactate in 48-h incubations of RBCs from subjects in the ONPN cohort. The progressors demonstrated significantly higher values than the nonprogressors (P = 0.016).
A: Media concentration of methylglyoxal in 48-h incubations of RBCs from subjects in the ONPN cohort. The progressors demonstrated significantly higher values than the nonprogressors (P = 0.03). B: Media concentration of d-lactate in 48-h incubations of RBCs from subjects in the ONPN cohort. The progressors demonstrated significantly higher values than the nonprogressors (P = 0.016).

Erythrocyte methylglyoxal production from nephropathy progressors and nonprogressors in the NHS cohort. Intracellular levels of methylglyoxal in RBCs (means ± SE) incubated in 30 mmol/l glucose for 36 h were significantly higher in subjects from the upper quintile of change in GBM thickening compared with the lower quintile (251.1 ± 111 vs. 183.7 ± 67.5 pmol/g RBC) with a P value of 0.04.
Erythrocyte methylglyoxal production from nephropathy progressors and nonprogressors in the NHS cohort. Intracellular levels of methylglyoxal in RBCs (means ± SE) incubated in 30 mmol/l glucose for 36 h were significantly higher in subjects from the upper quintile of change in GBM thickening compared with the lower quintile (251.1 ± 111 vs. 183.7 ± 67.5 pmol/g RBC) with a P value of 0.04.

8-IPs in the NHS cohort. Urinary levels of 8-IPs (means ± SE) were significantly higher in those with the upper half of 5-year change in GBM width compared with subjects in the lower half (P = 0.025).
8-IPs in the NHS cohort. Urinary levels of 8-IPs (means ± SE) were significantly higher in those with the upper half of 5-year change in GBM width compared with subjects in the lower half (P = 0.025).

Five-year change in basement membrane width and plasma levels of 3DG. Plasma 3DG levels in the NHS cohort were highly correlated with change in GBM width as shown by linear regression analysis (P = 0.004, r = 0.34).
Five-year change in basement membrane width and plasma levels of 3DG. Plasma 3DG levels in the NHS cohort were highly correlated with change in GBM width as shown by linear regression analysis (P = 0.004, r = 0.34).
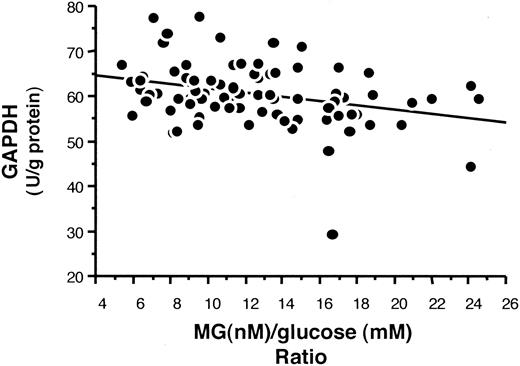
GAPDH activity and the methylglyoxal/glucose ratio in the NHS cohort. In vivo erythrocyte levels of GAPDH activity in the entire NHS cohort was inversely related to the plasma methylglyoxal/glucose ratio when analyzed by linear regression analysis (P = 0.003).
GAPDH activity and the methylglyoxal/glucose ratio in the NHS cohort. In vivo erythrocyte levels of GAPDH activity in the entire NHS cohort was inversely related to the plasma methylglyoxal/glucose ratio when analyzed by linear regression analysis (P = 0.003).
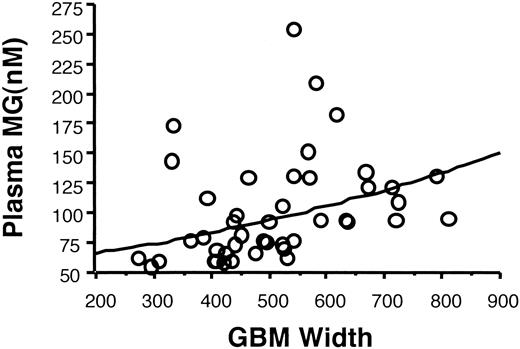
Plasma methylglyoxal levels and GBM width in the Pima Indian cohort. Plasma levels of methylglyoxal showed a significant positive relationship with GBM width by regression analysis (P = 0.005), and this relationship remained significant when adjusted for age, duration of diabetes, A1C, and GFR.
Plasma methylglyoxal levels and GBM width in the Pima Indian cohort. Plasma levels of methylglyoxal showed a significant positive relationship with GBM width by regression analysis (P = 0.005), and this relationship remained significant when adjusted for age, duration of diabetes, A1C, and GFR.
Clinical characteristics of the three study populations
| Category | n | Age (years) | Duration of diabetes (years) | A1C (%) | Albumin excretion (μg/min) | GFR (ml · min−1 · 1.73 mol/l−2) | ||||||
|---|---|---|---|---|---|---|---|---|---|---|---|---|
| ONPN cohort | ||||||||||||
| Progressors | 7 | 42.7 ± 10.8 | 26.5 ± 3.9 | 9.3 ± 1.7 | 90.5 ± 139.2 | 61 ± 36*§ | ||||||
| Nonprogressors | 7 | 44.3 ± 11.4 | 33.5 ± 12. | 8.1 ± 1.3 | 7.5 ± 3.5 | 136 ± 45§ | ||||||
| NHS cohort | ||||||||||||
| Upper quintile GBM width | 22 | 18.7 ± 5.0† | 10.6 ± 2.9† | 9.2 ± 1.9 | 9.0 ± 13.2 | 128 ± 17 | ||||||
| Lower quintile GBM width | 22 | 26.3 ± 8.0 | 15.6 ± 4.8 | 8.2 ± 1.5 | 9.2 ± 9.1 | 130 ± 26 | ||||||
| Pima Indiana cohort | ||||||||||||
| Upper quartile GBM width | 11 | 41.1 ± 12.9 | 6.3 ± 5.5‡ | 9.4 ± 2.4 | 1620 ± 1807‖ | 116 ± 50 | ||||||
| Lower quartile GBM width | 11 | 43.1 ± 10.5 | 17.8 ± 5.4 | 10.8 ± 1.7 | 40 ± 60‖ | 132 ± 36 | ||||||
Data are means ± SD.
P = 0.01,
P < 0.001,
P = 0.002,
creatinine clearance (ml/min),
mg/g creatinine.
Methylglyoxal to d-lactate conversion rates of overt nephropathy progressors compared with nonprogressors
| Nephropathy status | Conversion rate (μmol/g RBC protein/min) per μmol methylglyoxal | Km (μmol/m) | Vmax (μmol/g RBC protein/min) |
|---|---|---|---|
| Progressors | 0.19 ± 0.08 | 976 ± 175 | 177 ± 48 |
| Nonprogressors | 0.17 ± 0.06 | 979 ± 594 | 169 ± 65 |
| P value | NS | NS | NS |
| Nephropathy status | Conversion rate (μmol/g RBC protein/min) per μmol methylglyoxal | Km (μmol/m) | Vmax (μmol/g RBC protein/min) |
|---|---|---|---|
| Progressors | 0.19 ± 0.08 | 976 ± 175 | 177 ± 48 |
| Nonprogressors | 0.17 ± 0.06 | 979 ± 594 | 169 ± 65 |
| P value | NS | NS | NS |
Data are means ± SD.
Article Information
Supported by grant 1-1999-677 from the Juvenile Diabetes Foundation International and by National Institutes of Health grants RO1-DK-62995, DK-002933, and DK-62901.