
Abstract
Keywords
Ethanol Human Foreskin Fibroblast cell line (HFFF2) Proteomics Gene Ontology Protein-protein Interaction (PPIs)
Introduction
Ethanol can contain cytotoxic effect in human body (1, 2). According to studies, many health impairments, chronic diseases, and death around the world is associated with ethanol intake (3, 4). The common kinds are tuberculosis, diabetes mellitus, alcohol use disorders, unipolar depressive disorders, epilepsy, hypertensive heart disease, ischaemic heart disease (IHD), ischaemic and haemorrhagic stroke, conduction disorders and other dysrhythmias, lower respiratory infections (pneumonia), cirrhosis of the liver, preterm birth complications, alcoholic liver ,decrease fertility and fetal alcohol syndrome (1), and medication interactions (5, 6). Furthermore, ethanol consumption has been shown to have a link to cancer onset (7). This is reported in many epidemiological researches (8-10). Mouth, nasopharynx, other pharynx and oropharynx cancer, oesophageal cancer, colon and rectum cancer, liver cancer, and female breast cancer are the some of the known malignancies that are related to polymorphisms in genes implicated in ethanol metabolism. However, the exact underlying molecular mechanism is yet to be recognized (1, 3). Studying molecular layers of biological component introduces us better understanding of how organisms function (11). Proteins as the motor functional parts in human body have a indispensible role (12, 13). Molecular biology indicates that proteins are in the close interaction with other vital molecules including DNA and RNA. These relations mediate metabolic and signaling pathways, cellular processes, and organismal systems. Expression profile of proteins with altered expression can be asses by proteomics (14, 15). This method is a promising application to evaluate proteins in large-scale pattern (16, 17). In fact, significant information related to over-expression or under-expression of designated proteome can be achieved by proteomics (18). In addition, through in-silico experiments, it is possible to decipher molecular basis and relations of different kinds of diseases (19). Examining protein interactions can provide deep insight in biological and biomedical research (1). It is now established that different kinds of complex multi-genetic diseases such as cancer and autoimmune disorders pathogenicity is rooted in complex integration of set of proteins and other molecules (20, 21). Thus, the diseases onset and their progression mechanism can be understood by protein network analysis, in which can provide appropriate diagnostic and therapeutic approaches. Based on recent studies, ethanol showed containing cytotoxic and proteome alteration properties in 270mM dosage (1). Considering this, it is important to examine the proteome alteration concerning candidate proteins in the presence of ethanol. Investigation of protein-protein interaction network and analysis of some proteins involved in ethanol consumption in high dose is the subject of this research.
Experimental
Materials
The human foreskin fibroblast cells (HFFF2) NCBI Code: C163 was obtained from National Cell Bank of Iran, Pasteur Institute of Iran and used for this study. All the proteomics chemicals and Ready Strip™ IPG strips were provided from GE Health Life Science.
Experimental procedure
Treated HFFF2 cells with ethanol and normal HFFF2 cells were prepared as previous study procedure (1). After reaching 80% confluency, they lysed with lysis buffer containing 8 M urea, 4% CHAPS (3-(3-cholamidopropyl) dimethylammonio- 1-propanesulfonate), 40 mM dithiothreitol (DTT), 2% pharmalyte (pH 3–10NL), 1 mM phenylmethylsulfonyl fluoride (PMSF), and 1 mM ethylene diamine tetra-acetic acid (EDTA) for 1h and followed by sonication with a probe sonicator for 5 min to complete the lysis. After that, the samples were centrifuged at 40000 g for 30 min and the supernatants containing proteins were collected for next evaluations. Quantification of proteins was handled by Bradford method, and then the samples were stored at -20oC till the next step (2D electrophoresis) (1). Isoelectric focusing (IEF) as the first dimension electrophoresis was carried out with 17 cm (pH 3–10NL) IPG strips. Approximately 1mg protein was loaded in to each gel and triplicate gels for each sample were run to achieve reproducible results. Briefly, the strips were rehydrated in the absence of electric field for 4 h and then with 50 V for 8 h. First dimension electrophoresis was performed by Isoelectric focusing (IEF), which was programmed at a gradient mode. It was first focused for 3 h at the different voltages including 500, 1000 and 8000 V, respectively, then continued at 8000 V and finally increased to 50 KVh. The focused strips were equilibrated in buffer with 6 M urea, 50 mM Tris–HCl, 30% glycerol, 2% SDS and trace bromophenol blue, and were subsequently treated by the reduction of DTT and alkylation of iodoacetamide. The treated strips were transferred onto 12% uniform SDS polyacrylamide gels (second dimension of electrophoresis) running in 2.5 W each gel for 30 min and 15 W each gel until the bromophenol blue dye reached the bottom of the gel. The gels were visualized by Coomassie brilliant blue staining and scanned by BioRad Image Scanner. Finally, protein expression alteration analysis was performed by SameSpots software based on above significant score threshold (Fold>2) (1). All the experiments including cell culture, protein assay, and 2DE were repeated three times and mean and standard deviation were considered. Furthermore, statistical and bioinformatics analysis was handled by R software and Cytoscape program respectively. The distances of expression level difference of designated proteins were calculated as a constructed matrix. Then it was used for clustering analysis using R programming language version (3.0.2) download from (http://www.r-project.org/). The hierarchical cluster is calculated based on distance dissimilarity and the relevant matrix (22). In addition, Box-plot was illustrated by R software. Cytoscape 3.2.1 is an open source tool that presents resourceful environment for data visualization in the form of complex networks available on (www.cytoscape.org) (23). By the use of this source, it is tried to identify hub proteins as they are important in network function. Additionally, network analysis was performed and data were tabulated in the related table. Gene ontology is the reference of controlled vocabulary of the terms of three biological annotation including cell compartment (CC), molecular function (MF), and biological process (BP) (20). Gene ontology annotations were retrieved by application of BioMart (www.biomart.org), This online tool is designed to provide significantly represented GO terms in a set of genes (24). The significant annotation of terms was carried out based on P<0.05 cut off.
Results
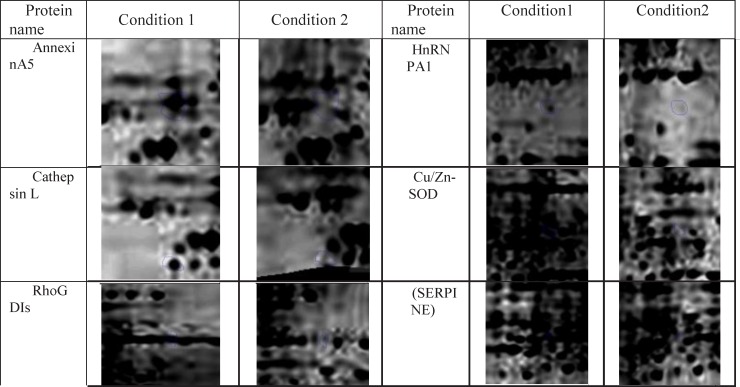
In this research protein expression changes of human fibroblast cells in normal condition and in the presence of ethanol analyzed by 2D gel Electerphoresis and SameSpots software. In Figure 1, six proteins spots with expression alteration are identified. These proteins were recognized via gel comparison from a study conducted by Ge et al. (2012) (25). All of these six proteins showed down-regulation after treatment with ethanol. (Figure 1)
For more resolution, a matrix was constructed based on dissimilarity of changes in protein expression among six identified proteins. In a way that, the distance between every pair of proteins was calculated as expression pattern variation and then compared with the rest of proteins (See Table1).
Constructed distance matrix based on dissimilarity of changes in expression of designated six proteins. Numbers correspond to the proteins (AnnexinA5,1 - Heterogeneous nuclear ribonucleoprotein A1,2 - Cathepsin L,3 - Cu/Zn-SOD ,4 - Rho-GDP dissociation inhibitor ,5 and SERPINE1, 6) The distance between protein 1 and protein 6 is the farthest, whereas the distance between protein 4 and 5 is the closest
| Protein | 1 | 2 | 3 | 4 | 5 | 6 |
|---|---|---|---|---|---|---|
| 1 | 0.00 | 0.06 | 0.10 | 0.15 | 0.16 | 0.20 |
| 2 | 0.06 | 0.00 | 0.04 | 0.09 | 0.10 | 0.14 |
| 3 | 0.10 | 0.04 | 0.00 | 0.05 | 0.06 | 0.10 |
| 4 | 0.15 | 0.09 | 0.05 | 0.00 | 0.01 | 0.05 |
| 5 | 0.06 | 0.10 | 0.06 | 0.01 | 0.00 | 0.04 |
| 6 | 0.20 | 0.14 | 0.10 | 0.05 | 0.04 | 0.00 |
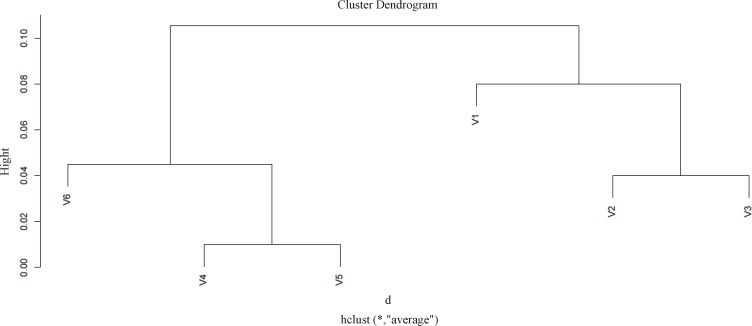
While protein clustering is applied for grouping large sets of objects, it can also provide valuable information for small numbers of elements. The applied clustering algorithm is Agglomerative Hierarchical Clustering as it is depicted in Figure 2.
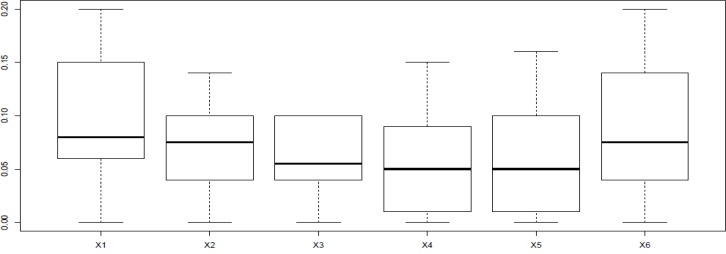
Difference in protein expression profile was plotted by the use of R software (Figure 3)
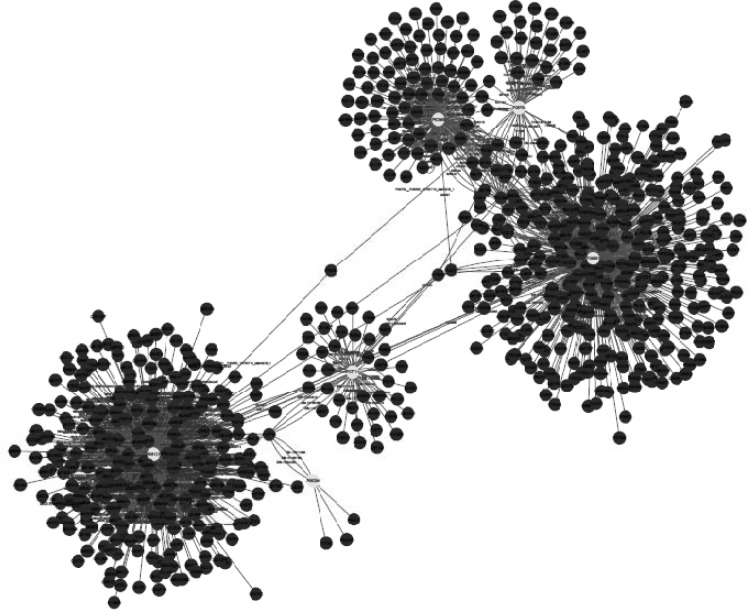
Network visualization of protein-protein interaction was handled by the use of Cytoscape (free open-source software). The integrated network was obtained from Mentha, Reactome-Fls, and STRING Databases by the application of PSICQUIC source, in which nodes of the network represent proteins and their relationship are indicates as edges (Figure 4). The network then analyzed based on degree and betweenness centrality (The data is not shown).
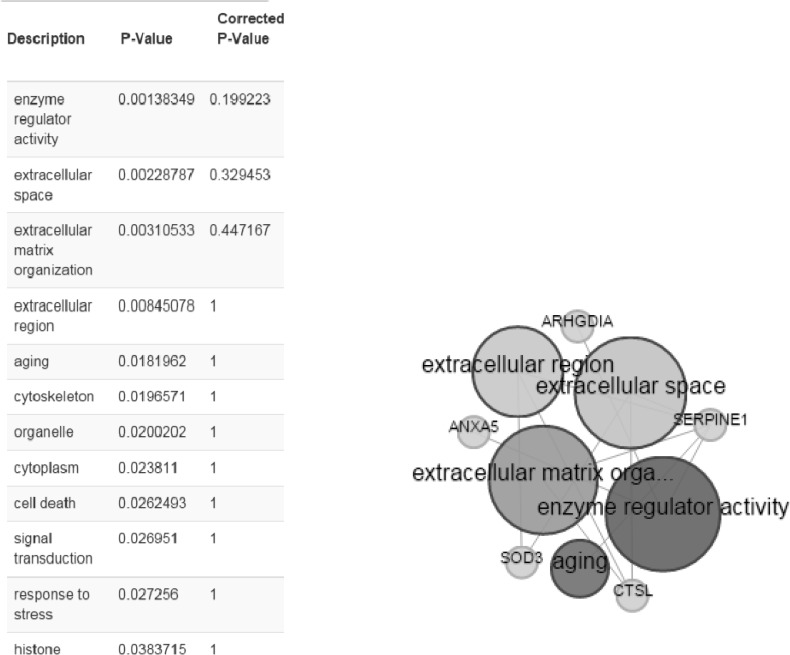
BioMart is applied for gene ontology annotation (www.biomart.org). Here, three different ontology annotation: (MF), (BP), (CC), are enriched for six identified proteins (Figure 5).
Discussion
As ethanol effects on human fibroblast cells survival and can imposes vast expression alteration on human fibroblast proteome profile (1), it is important to investigate the proteins with significant altered expression and their properties. Based on our previous study, a total number of 65 of proteins belong to fibroblast profile showed significant expression alteration induced by 270 mM dosage of ethanol (1). Among the proteins with significantly expression alteration , six of them were identified by the use of gel comparison from literature (25). They include Annexin A5 (or annexin V), Heterogeneous nuclear ribonucleoprotein A1 (HnRNPA1), Cathepsin L, Rho GDP-dissociation inhibitor (Rho-GDI), Cu,Zn-superoxide dismutase (Cu/Zn-SOD), and Plasminogen activator inhibitor-1 (PAI-1) as it is shown in Figure 1. All of the identified proteins with at least a 2-fold change in their expression are down-regulated. Amazingly, all these six proteins were also evince the same pattern in cancer protein profile changes. It is proved in proteomic analysis of nasopharyngeal carcinoma-associated stromal fibroblasts (25). In addition, previous studies suggest that ethanol consumption can increase the risk of other types of malignancies such as digestive tract cancer, and especially breast cancer (7, 9, 26). Annexin A5 (belongs to annexin family) has a role in cellular signal transduction, inflammation, growth and differentiation. Many diseases are related to the activity of this protein including different types of malignancies, complication of pregnancy, cardiovascular disease, systemic lupus erythematosus, and Ischemia (27-29). Many kinds of cancers such as pancreatic adenocarcinoma, sarcoma, tumorigenesis and progression of breast cancer and prostate cancer stem cells are linked to Annexin A5 (Anxa5) activity, but its contribution is different in variety of malignancies. In fact, while it has a high expression in cervical cancer, it has a significant low expression in cervical carcinoma cells. It also has a low expression in thyroid cancer. (30). (HnRNPA1) is a DNA binding protein (31) and its reduction is linked to many kinds of neurodegenerative diseases such as Alzheimer s’ disease (AD), spinal muscular atrophy (SMA), fronto-temporal lobar degeneration (FTLD), amyotrophic lateral sclerosis (ALS), multiple sclerosis (MS), hereditary spastic paraparesis (HSP) and HTLV-I associated myelopathy/tropical spastic paraparesis (HAM/TSP) (32). It is also reported as lung cancer and colon cancer biomarker (33, 34). Cathepsin L involves in progression of the cell cycle regulation via proteolytic processing of the CDP/Cux transcription factor (35). Abnormal expression of this protein is reported for many diseases such as proteinuric kidney disease, atherosclerosis, Parkinson's disease, and breast cancer (36, 37). Many cellular functions regulate by Rho-GDP dissociation inhibitor (Rho-GDIs). It interacts with Rho family GTPases (38). RhoGDI and GDI/D4 are two mainly known GDIs (39). Cu, Zn-superoxide dismutase (Cu/Zn-SOD) is an antioxidant enzyme in the body. Its copper and zinc ions act as free superoxide radicals destroyer (40, 41). It is related to some diseases such as anxiety, Alzheimer and Parkinson diseases, colon cancer, small cell and non-small cell lung cancer, and gastric cancer (42-46). Serpin peptidase inhibitor clade E (SERPINE1) also known as (PAI-1) as a member of the serpin super-family has a prominent function in regulating the physiological and pathological proteolysis (47). Different diseases are related to dysfunction of PAI-1. One of the main ones is Plasminogen Activator Inhibitor Type 1 deficiency (48). It is known as one of the main regulator of tumor invasion and metastasis regulator, and angiogenesis in Leukemia (49) and other malignancies including cancers of gastric, breast, colon, and ovarian (50-53). As tabulated in table 1, dissimilarity of expression level alteration of proteins, is different from each other. Annexin A5 and SERPINE1 are affected differently as their expression level dissimilarity is higher than the others. On the other hand, Rho-GDP dissociation inhibitor and Cu/Zn-SOD show higher correlation in terms of changes in expression. Hierarchical clustering is a useful method to show the protein spots correlation (22). In addition, box-plot is a standard none-parametric way to depict graphically illustration of sample data variation (54, 55). Here, the visualization and better resolution of expression changes of six proteins based on constructed matrix are shown by dendrogram and boxplot (Figures 2 and 3). However clustering is one of the best methods for analysis of large group proteins and genes but here the significant correlation of two proteins including Cu/Zn-SOD and Rho-GDP dissociation inhibitor can be interpreted by the use of clustering and box-plot methods. Protein-protein interaction is important to analysis and comprehend the relationships between network structure and function (20). It introduces the key hub proteins. Fetching information regarded to interaction profile of evaluated six proteins was from public databases through Cytoscape (Figure 4). Interaction graph indicates that some of the investigated proteins are highly involved in biological associations that are known as hub proteins. The most important ones are HNRNPA1 and SERPINE1. On the other hand, it can also be inferred from protein interaction network that proteins, Cu/Zn-SOD and Rho-GDP dissociation inhibitor and also HnRNPA1 and Cathepsin L with a similar pattern in expression changes are also in close interaction. The first pair is characterized by high degree, but not significant in betweenness centrality. According to BioMart analysis of identified proteins, it is confirmed that extracellular part and enzymatic regulatory activity are the most affected region and biological process respectively in ethanol consumption (Figure 5). SERPINE1 is fundamentally located in extracellular region of cell and plays important roles such as protease binding in which is mainly involved in chronological cell aging and angiogenesis, complement and coagulation cascades and loss of function of SMAD2 and SMAD3 in cancer. Based on annotation, the neighbor proteins of SERPINE1 including TGFB1, TP53, SMAD3, SMAD4 are also involved in cancer (56). It seems that SERPINE1 as a hub protein is involved deeply in cancer so its expression changes may impose a great effect in progress of disease. HNRNPA1 as another hub protein is mainly active in nucleus and acts as nucleotide binding in alternative mRNA splicing process. It is also involved in spliceosome mRNA Splicing. This protein as like SERPINE1 plays a key role in cancer. Therefore, HNRNPA1 and SERPINE1 as hub proteins are involved in cancer and also ethanol consumption; they can be candidate for more investigations.
Conclusion
It can be concluded that, there is a similar pattern at least for a part of proteome in cancer and ethanol consumption. This common part includes important proteins that are involved in several key pathways. Since down-regulation of these identified proteins is assigned with cancer and ethanol consumption, they can be consider as biomarker candidate and required to be investigated in more details.
Acknowledgements
References
-
1.
Rezaei-Tavirani M, Rezaei-Tavirani M, Rad SR, Zali H, Hasanzadeh H, Aminigram P. The study of fibroblast proteome changes in the presence of Ethanol. JPS. 2014;5:1-8.
-
2.
Aminigram p, Rezaei Tavirani M, Zamanian Azodi M, Bagheri B, Nasr R, Akbari Eidgahi MR. Ethanol- induced chromosomal abnormalities in human fibroblast cells. koomesh. 2014;16:254-9.
-
3.
Scoccianti C, Lauby-Secretan B, Bello P-Y, Chajes V, Romieu I. Female Breast Cancer and Alcohol Consumption: A Review of the Literature. Am. J. Prev. Med. 2014;46:16-25.
-
4.
Liu Y, Nguyen N, Colditz GA. Links between alcohol consumption and breast cancer: a look at the evidence. Women's Health. 2015;11:65-77.
-
5.
Weathermon R, Crabb DW. Alcohol and medication interactions. Alcohol Res. Health. 1998;23:40-54.
-
6.
Li B, Wang Y, Zhang Y, Liu M. Effects of Ethanol on the Toxicokinetics of Methamphetamine in Rabbits. Iran. J. Pharm. Res. 2014;13:329-336. [PubMed ID: 24734088].
-
7.
Brooks PJ, Zakhari S. Moderate alcohol consumption and breast cancer in women: from epidemiology to mechanisms and interventions. Alcohol Clin. Exp. Res. 2013;37:23-30. [PubMed ID: 23072454].
-
8.
Park SY, Kolonel LN, Lim U, White KK, Henderson BE, Wilkens LR. Alcohol consumption and breast cancer risk among women from five ethnic groups with light to moderate intakes: the Multiethnic Cohort Study. Int. J. Cancer Clin. Res. 2014;134:1504-10.
-
9.
Haas SL, Ye W, Löhr JM. Alcohol consumption and digestive tract cancer. Curr. Opin. Clin. Nutr. Metab. Care. 2012;15:457-67. [PubMed ID: 22797570].
-
10.
Dennis LK, Hayes RB. Alcohol and prostate cancer. Epidemiol Rev. 2014;23:110-4.
-
11.
Fathi F, Majari‐Kasmaee L, Mani‐Varnosfaderani A, Kyani A, Rostami‐Nejad M, Sohrabzadeh K, Naderim N, Zali MR, Rezaei-Tavirani M, Tafazzoli M, Arefi-Oskouie A. 1H NMR based metabolic profiling in Crohn's disease by random forest methodology. Magn. Reson. Chem. 2014;52:370-376. [PubMed ID: 24757065].
-
12.
Jafari M, Mirzaie M, Sadeghi M, Marashi SA, Rezaei-Tavirani M. Exploring biological processes involved in embryonic stem cell differentiation by analyzing proteomic data. Biochimica et Biophysica Acta (BBA)-Proteins and Proteomics. 2013;1834:1063-9. [PubMed ID: 23415726].
-
13.
Tayari M, Moosavi-Nejad Z, Nejad FM, Rezaei-Tavirani M, Shasaltaneh MD. Heterotropic Effect of β-lactam Antibiotics on Antioxidant Property of Haptoglobin (2-2)-Hemoglobin Complex. Iran. J. Pharm. Res. 2011;10:313-20. [PubMed ID: 24250360].
-
14.
Fröhlich H, Speer N, Poustka A, Beißbarth T. GOSim–an R-package for computation of information theoretic GO similarities between terms and gene products. BMC bioinformatics. 2007;8:166. [PubMed ID: 17519018].
-
15.
Kalantari S, Nafar M, Samavat S, Rezaei-Tavirani M, Rutishauser D, Zubarev R. Urinary Prognostic Biomarkers in Patients With Focal Segmental Glomerulosclerosis. Nephrourol Mon. 2014;6:1-4.
-
16.
Zamanian–Azodi M, Rezaei–Tavirani M, Hasanzadeh H, Rad SR, Dalilan S. Introducing biomarker panel in esophageal, gastric, and colon cancers; a proteomic approach. Gastroenterol Hepatol Bed Bench. 2015;8:6-18. [PubMed ID: 25584171].
-
17.
Zali H, Zamanian-Azodi M, Tavirani MR, Baghban AAZ. Protein Drug Targets of Lavandula angustifolia on treatment of Rat Alzheimer's Disease. Iran. J. Pharm. Res. 2015;14:291-301. [PubMed ID: 25561935].
-
18.
Hasanzadeh H, Rezaie-Tavirani M, Seyyedi SS, Zali H, Keshel SH, Jadidi M, Abedelahi A. Effect of ELF-EMF Exposure on Human Neuroblastoma Cell Line: a Proteomics Analysis. Iran J. Cancer Prev. 2014;7:22. [PubMed ID: 25250144].
-
19.
Abad SKR, Pooladi M, Hashemi M, Moradi A, Sobhi S, Zali A, Zamanian Azodi M, Rakhshan A, Vafaei R, Rezaei-Tavirani M. Rho GDP Protein Expression Change and Investigation of ItsEffect on GDP/GTP Cycle in Human Brain Oligodendroglioma. Iran J. Cancer Prev. 2013;6:24-9.
-
20.
Zamanian-Azodi M, Rezaei-Tavirani M, Rahmati-Rad S. Evaluation of Obsessive Compulsive Disorder Related Gene Ontology Perspective. IJAPBS. 2015;4:1-14.
-
21.
Rezaie-Tavirani M, Mortazavi SA, Barzegar M, Moghadamnia SH, Rezaee MB. Study of anti cancer property of Scrophularia striata extract on the human astrocytoma cell line (1321). Iran. J. Pharm. Res. 2010;9:403-410. [PubMed ID: 24381605].
-
22.
Zarnegarnia Y, Majd HA, Tavirani MR, Khaier N, Maboodi A. Application of fuzzy clustering in analysis of included proteins in esophagus, stomach and colon cancers based on similarity of Gene Ontology annotation. Koomesh. 2010;12:14-21.
-
23.
Saito R, Smoot ME, Ono K, Ruscheinski J, Wang P-L, Lotia S, R Pico A, Bader GD, Ideker T. A travel guide to Cytoscape plugins. Nat. Meth. 2012;9:1069-76.
-
24.
Baker M. Quantitative data: learning to share. Nat. Meth. 2012;9:39-41.
-
25.
Ge S, Mao Y, Yi Y, Xie D, Chen Z, Xiao Z. Comparative proteomic analysis of secreted proteins from nasopharyngeal carcinoma-associated stromal fibroblasts and normal fibroblasts. Exp. Ther. Med. 2012;3:857-60. [PubMed ID: 22969981].
-
26.
Singletary KW, Frey RS, Yan W. Effect of ethanol on proliferation and estrogen receptor-α expression in human breast cancer cells. Cancer lett. 2001;165:131-7. [PubMed ID: 11275361].
-
27.
Tsakanova G, Boiadzhian A. [A role of annexin-А5 in pathogenesis of ischemic stroke] Zhurnal nevrologii i psikhiatrii imeni SS Korsakova/Ministerstvo zdravookhraneniia i meditsinskoi promyshlennosti Rossiiskoi Federatsii, Vserossiiskoe obshchestvo nevrologov. Zh. Nevrol Psikhiatr Im. S. S. Korsakova. 2013;114:9-13.
-
28.
Cederholm A, Frostegård J. Annexin A5 in cardiovascular disease and systemic lupus erythematosus. Immunobiology. 2005;210:761-8. [PubMed ID: 16325495].
-
29.
Bogdanova N, Horst J, Chlystun M, Croucher PJ, Nebel A, Bohring A, Todorova A, Schreiber S, Gerke V, Krawczak M, Markoff A. A common haplotype of the annexin A5 (ANXA5) gene promoter is associated with recurrent pregnancy loss. Hum. Mol. Genet. 2007;16:16573-8.
-
30.
Peng B, Guo C, Guan H, Liu S, Sun M-Z. Annexin A5 as a potential marker in tumors. Clin. Chim. Acta. 2014;427:42-8. [PubMed ID: 24121031].
-
31.
Brockstedt E, Rickers A, Kostka S, Laubersheimer A, Dörken B, Wittmann-Liebold B, Bommert K, Otto A. Identification of apoptosis-associated proteins in a human Burkitt lymphoma cell line Cleavage of heterogeneous nuclear ribonucleoprotein A1 by caspase 3. J. Biol. Chem. 1998;273:28057-64. [PubMed ID: 9774422].
-
32.
Bekenstein U, Soreq H. Heterogeneous nuclear ribonucleoprotein A1 in health and neurodegenerative disease: From structural insights to post-transcriptional regulatory roles. Mol. Cell. Neurosci. 2013;56:436-46. [PubMed ID: 23247072].
-
33.
Pino I, Pío R, Toledo G, Zabalegui N, Vicent S, Rey N, M Lozano, Torre W, García-Foncillas J, Montuenga L. Altered patterns of expression of members of the heterogeneous nuclear ribonucleoprotein (hnRNP) family in lung cancer. Lung. Cancer. 2003;41:131-43. [PubMed ID: 12871776].
-
34.
Ma YL, Peng JY, Zhang P, Huang L, Liu WJ, Shen TY, Chen HQ, Zhou YK, Zhang M, Chu ZX, Qin HL. Heterogeneous nuclear ribonucleoprotein A1 is identified as a potential biomarker for colorectal cancer based on differential proteomics technology. J. Proteome Res. 2009;8:4525-35. [PubMed ID: 19715280].
-
35.
Goulet B, Baruch A, Moon N-S, Poirier M, Sansregret LL, Erickson A, Bogyo M, Nepveu A. A cathepsin L isoform that is devoid of a signal peptide localizes to the nucleus in S phase and processes the CDP/Cux transcription factor. Mol. cell. 2004;14:207-19. [PubMed ID: 15099520].
-
36.
Sever S, Altintas MM, Nankoe SR, Möller CC, Ko D, Wei C, Henderson J, del Re EC, Hsing L, Erickson A, Cohen CD, Kretzler M, Kerjaschki D, Rudensky A, Nikolic B and Reiser J. Proteolytic processing of dynamin by cytoplasmic cathepsin L is a mechanism for proteinuric kidney disease. J.Clin. Invest. 2007;117:2095-104. [PubMed ID: 17671649].
-
37.
Castiglioni T, Merino MJ, Elsner B, Lah TT, Sloane BF, Emmert-Buck MR. Immunohistochemical analysis of cathepsins D, B, and L in human breast cancer. Hum. Pathol. 1994;25:857-62. [PubMed ID: 8088759].
-
38.
Zhang B, Zhang Y, Dagher M-C, Shacter E. Rho GDP dissociation inhibitor protects cancer cells against drug-induced apoptosis. Cancer Res. 2005;65:6054-62. [PubMed ID: 16024605].
-
39.
Adra CN, Manor D, Ko JL, Zhu S, Horiuchi T, Van Aelst L. RhoGDIγ: a GDP-dissociation inhibitor for Rho proteins with preferential expression in brain and pancreas. Proc. Natl. Acad. Sci. 1997;94:4279-84. [PubMed ID: 9113980].
-
40.
Leinartaite L, Saraboji K, Nordlund A, Logan DT, Oliveberg M. Folding catalysis by transient coordination of Zn2+ to the Cu ligands of the ALS-associated enzyme Cu/Zn superoxide dismutase 1. J. Am. Chem. Soc. 2010;132:13495-504. [PubMed ID: 20822138].
-
41.
Yim M, Chock PB, Stadtman E. Enzyme function of copper, zinc superoxide dismutase as a free radical generator. J. Biol. Chem. 1993;268:4099-105. [PubMed ID: 8382691].
-
42.
Russo A. Increased serum Cu/Zn superoxide dismutase in individuals with anxiety. Atherosclerosis. 2010;16:1-6.
-
43.
Gulubova M, Vlaykova T. Expression of the xenobiotic-and reactive oxygen species-detoxifying enzymes, GST-pi, Cu/Zn-SOD, and Mn-SOD in the endocrine cells of colorectal cancer. Int. J. Colorectal Dis. 2010;25:1397-405. [PubMed ID: 20714737].
-
44.
Kaynar H, Meral M, Turhan H, Keles M, Celik G, Akcay F. Glutathione peroxidase, glutathione-S-transferase, catalase, xanthine oxidase, Cu–Zn superoxide dismutase activities, total glutathione, nitric oxide, and malondialdehyde levels in erythrocytes of patients with small cell and non-small cell lung cancer. Cancer lett. 2005;227:133-9. [PubMed ID: 16112416].
-
45.
Lin Y, Kikuchi S, Obata Y, Yagyu K. Serum Copper/Zinc Superoxide Dismutase (Cu/Zn SOD) and Gastric Cancer Risk: a Case‐Control Study. Cancer Sci. 2002;93:1071-5.
-
46.
Choi J, Rees HD, Weintraub ST, Levey AI, Chin LS, Li L. Oxidative modifications and aggregation of Cu, Zn-superoxide dismutase associated with Alzheimer and Parkinson diseases. J. Biol. Chem. 2005;280:11648-55. [PubMed ID: 15659387].
-
47.
Jankun J, Specht Z, Szkudlarek M, Greenfield R, Gaikwad B, Trifonov L, Vaugeois J, Aleem A, Basrur V, Selman S, Zavodszky M and Skrzypczak-Jankun E. Plasminogen activator inhibitor-1 is locked in active conformation and polymerizes upon binding ligands neutralizing its activity. Int. J. Mol. Med. 2006;17:437-47. [PubMed ID: 16465390].
-
48.
Mehta R, Shapiro A. Plasminogen activator inhibitor type 1 deficiency. Haemophilia. 2008;14:1255-60. [PubMed ID: 19141166].
-
49.
Bond J, Adams S, Richards S, Vora A, Mitchell C, Goulden N. Polymorphism in the PAI-1 (SERPINE1) gene and the risk of osteonecrosis in children with acute lymphoblastic leukemia. Blood. 2011;118:2632-3. [PubMed ID: 21885611].
-
50.
Chorostowska-Wynimko J, Skrzypczak-Jankun E, Jankun J. Plasminogen activator inhibitor type-1: Its structure, biological activity and role in tumorigenesis (Review). Int. J. Mol. Med. 2004;13:759-66. [PubMed ID: 15138609].
-
51.
Costantini V, Sidoni A, Deveglia R, Cazzato OA, Bellezza G, Ferri I. Combined overexpression of urokinase, urokinase receptor, and plasminogen activator inhibitor‐1 is associated with breast cancer progression: An immunohistochemical comparison of normal, benign, and malignant breast tissues. Cancer. 1996;77:1079-88. [PubMed ID: 8635127].
-
52.
Mashiko S, Kitatani K, Toyoshima M, Ichimura A, Dan T, Usui T, Ishibashi M, Shigeta S, Nagase S, Miyata T, Yaegashi N. Inhibition of plasminogen activator inhibitor-1 is a potential therapeutic strategy in ovarian cancer. Cancer Biol. Ther. In Press.
-
53.
Suh Y-S, Yu J, Kim BC, Choi B, Han TS, Ahn HS, Kong S, Lee H, Kim W, Yang H. Overexpression of Plasminogen Activator Inhibitor-1 in Advanced Gastric Cancer with Aggressive Lymph Node Metastasis. Cancer Res. Treat. In press.
-
54.
Taube JH, Herschkowitz JI, Komurov K, Zhou AY, Gupta S, Yang J, Hartwell K, Onder T, Gupta P, Evans K, Hollier B, Ram P, Lander E, Rosen J, Weinberg R, Mani S. Core epithelial-to-mesenchymal transition interactome gene-expression signature is associated with claudin-low and metaplastic breast cancer subtypes. Proc. Natl. Acad. Sci. 2010;107:15449-54. [PubMed ID: 20713713].
-
55.
McGill R, Tukey JW, Larsen WA. Variations of box plots. Am. Stat. 1978;32:12-6.
-
56.
Alazzouzi H, Alhopuro P, Salovaara R, Sammalkorpi H, Järvinen H, Mecklin JP, Hemminki A, Schwartz S JR. SMAD4 as a prognostic marker in colorectal cancer. Clin. Cancer Res. 2005;11:2606-11. [PubMed ID: 15814640].