Abstract
This article presents the results of laboratory studies of a two-stage gear transmission regarding the process of intentionally increasing damage of its tooth. Also, this study discusses the construction of a gear transmission of a military helicopter on the basis of basic kinematic results of its vibroacoustic signals. What is important, the article describes the aim of laboratory stand, which was to authenticate the applied algorithms of technical condition evaluation of combat helicopter. Also, the process of deepening the damage to the tooth of the gear transmission was described. It was made with the use of stable ranges of rotational speed of measurements of transmission casing in three mutually perpendicular directions and have been referred to the condition without damage. In the article, diagnostic criteria are also determined for the assessment of technical conditions of military helicopter equipped with a gear transmission.
1. Introduction
The issue of monitoring and diagnosis of the technical condition of machines, detecting defects and consumption of their components is of interest to every staff, which conducts operations and maintenance activities with regard to safety economic and time aspect [1-3]. However, it should be noted that applied methods and resources in the form of implemented measuring and control units as well as specified routine maintenance are not always sufficient and as a result, these machines often get damaged.
This problem is faced by Engineering and Aviation Services of Polish Armed Forces exploiting combat helicopters, including its main transmissions. In the helicopter’s main transmission only the temperature and oil pressure value and rotational speed of the input shaft shall be continuously monitored. The above-mentioned input shaft is equipped with magnetic plugs detecting products consumed in the lubricating oil, but it is not provided with any vibration control system. What is more, technical condition evaluation of main transmission is carried out periodically during scheduled maintenance works on the basis of developed overhaul life. However, in spite of the above-mentioned activities, they become damaged. Due to this fact, the Air Force Institute of Technology in Warsaw strived to determine the possibilities of applying the vibroacoustic method to evaluate the technical condition of military helicopter main transmission, in view of the above-mentioned conditions.
The literature presents a lot of methods of transmission diagnosing on the basis of the analysis of vibroacoustic signals measured on the transmission casing.
Fraser and King (1990) using kurtosis observed that when a gearbox component is severely damaged multiple impulses will appear in the frequency domain, resulting in a cumulative response that tend to reduce the kurtosis value. Another approach is to apply cestrum based techniques, in attempt to condense the frequency domain information into form that would be easier to interpret, thus providing a practical system for routine prognostic monitoring. Forester (1990) demonstrates that time-frequency techniques, such as Wigner-Ville distribution can describe how the spectral content of the signal is changing in time and provided a framework for developing robust detection and classification schemes for helicopter gearbox faults. Polyshchuk V. V et al. (2002), presents the development of a novel method in gear damage detection using a new gear fault detection parameter based on the energy change in the joint time-frequency analysis of the vibration analysis of the vibration signal.
The existing methods were classified into four groups: analyses in the time domain, analyses in the frequency domain [4], time and frequency analyses and others [5]. The above-mentioned methods are based on well-known failure modes of anti-friction bearings and gear transmissions [6].
2. The general characteristics of study objects
The object of the research was the main transmission of the helicopter (Fig. 1), with the kinematic scheme depicted in Fig. 2.
The structure of the transmission and its location on the helicopter results in a lot of input functions, which occur in the vibroacoustic signal [7].
Fig. 1View of the location of the transmission in relation to the basic helicopter assemblies. (1 – engines, 2 – fan, 3 – oil cooler, 4 – fan propeller shaft, 5 – main transmission, 6 – power unit, 7 – intermediate transmission, 8 – tail transmission)
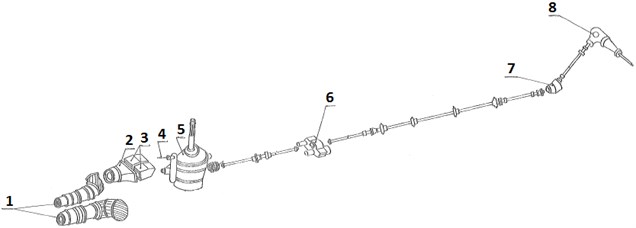
Fig. 2The kinematic scheme of the main transmission
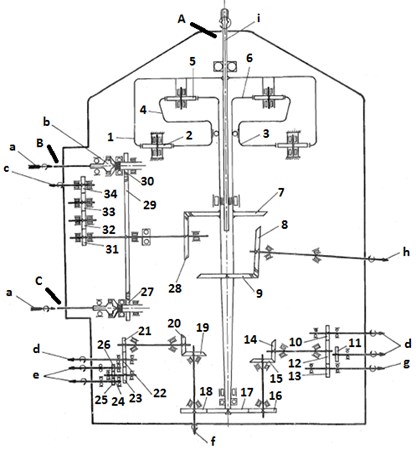
First of all, the transmission is powered by two turbine engines, by means of a freewheel unit (b) and a drive shaft (a). In the engine, apart from the number of units coupled with it, the most relevant elements include: a power turbine, generating power output for the transmission and turbo compressor motor, which is not cinematically connected with the transmission. Secondly, the transfer of torque onto helicopter rotor shaft (i) derived from the power turbine takes place by three gear stages. The first gear stage transmits revolutions from two engines, through freewheel units and gear wheels 27 and 30 onto the oblique gear wheel 29. The second gear stage consists of two bevel wheels 28 and 7 with spiral teeth. Third stage includes a closed planetary differential gear with gear wheels 1, 2, 3, 4, 5, and 6. The gear wheel 6 mounted on one of the shafts with bevel wheel 7 is a drive wheel (solar wheel) of transmission. Gear wheels 5, in the quantity of 5 pieces, work as planet wheels of planetary gear. The yoke of planet wheels creates a single entity with drive gear wheel 1 and is connected with helicopter rotor shaft. Gear wheels 2, in the quantity of 7 pieces, function as intermediate wheels closing the whole assembly. The vasing of these gear wheels is immovable. Thirdly, power from the transmission is transferred on the whole range of receiving units, including auxiliary rotor and transmission units. The transfer of power onto auxiliary rotor (h) takes place by the first and second gear stage (which is common for helicopter rotor power unit) and by the additional stage increasing the rotational speed and consisting of two bevel wheels 9 and 8 with spiral teeth. Power units of main transmission units are located on the front, left and right side of transmission casing. The front side, beginning from gear wheel 29 through gear wheels 31, 32, 33 and 34 houses fan drive (c). On the left side, through gear wheels 19 and 20 as well as cylindrical gear wheels 21-26, transmitter drives of rotational speed of helicopter rotor (e) and hydraulic pump (d) are situated. On the right side, through gear wheels 17 and 16, bevel wheels 15 and 14 and cylindrical gear wheels 10-13, one can observe drive of two hydraulic pumps and a compressor (g). Apart from the assemblies of the above mentioned kinematic pairs of gear transmissions, there is also a whole range of bearings.
For such a complex kinematics, dependencies describing the characteristic frequencies are shown below:
– Rotational frequency of turbo compressor (100 % revolutions corresponds to the speed of 19500 rev/min):
– Rotational frequency of power turbine (100 % revolutions corresponds to the speed of 15000 rev/min):
– Characteristic frequencies of gear wheels with permanent axes (it regards wheels from 7 to 34, for instance, for the pair of gear wheels and this relationship is as follows):
– Mesh frequency:
– Side bands’ frequency (similarly for other frequencies):
– Frequency of helicopter rotor blades ( – number of blades – 5 pcs.):
Gear wheels to create a planetary gear with the arrangement depicted on Fig. 3.
Fig. 3Planetary gear set-up
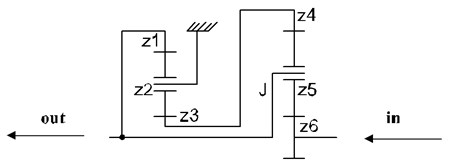
Planetary gear has number of independent variables:
where: – number of movable elements; – number of rotational elements; – number of meshing’s.
Rotational frequencies of planetary gear assembly shall be determined in compliance with the following dependencies:
Rotational frequency values for rated operating conditions were compiled in Table 1, what, knowing the number of teeth of gear wheels and appropriate bearings parameters [8], made it possible to establish other characteristic frequencies associated with symptoms of bearing defects [9] and gear transmissions [10].
Table 1Rotational frequency values of main transmission, power unit and helicopter rotor
Designation | Value [Hz] | Designation | Value [Hz] |
325 | 49,3 | ||
250 | 49,3 | ||
20 | 59,6 | ||
250 | 33,5 | ||
86,8 | 59,6 | ||
86,8 | 40,6 | ||
250 | 40,6 | ||
39,7 | 40,8 | ||
39,7 | 53,9 | ||
39,7 | 40,8 | ||
39,7 | 40,8 | ||
40,6 | 1,5 | ||
59,6 | –8,8* | ||
59,6 | –8,8* | ||
49,3 | –14,6* | ||
49,3 | 4 | ||
40,8 | *opposite direction | ||
3. Laboratory studies of two-stage gear transmission
The planned measurements of vibrations of helicopter main transmission were supposed to be performed without the application of signal informing about a temporary rotational speed, thus limiting the possibility to apply certain algorithms, e.g. time synchronous averaging [11]. Due to operational restrictions of combat helicopters and the inability to mount a rotational speed phase tag, it was impossible to apply a synchronous sampling relative to phase tag by conducting measurements on combat helicopter [12]. Owing to this, laboratory studies aimed at preparing the measurement chain and algorithm to verify operational condition of combat helicopters not applied on station of phase tag. Therefore, the inability to utilize synchronous sampling relative to the signal from phase tag was a natural core of the matter.
The aim of laboratory stand was to authenticate the applied algorithms of technical condition evaluation of combat helicopter. The expected outcome was supposed to be information regarding the general vibrations level and the possibility to detect bearings’ defects of transmission teeth.
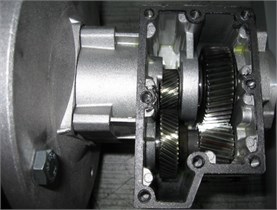
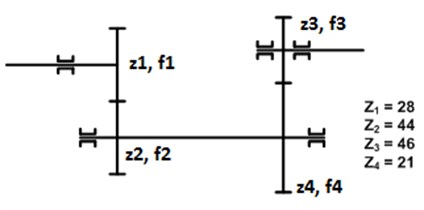
The study covered gear transmission is presented on Fig. 4.
Fig. 4The view of the transmission under consideration and its kinematic scheme
The process of deepening the damage to the tooth (Fig. 5), performed in three stages, was made with the use of stable ranges of rotational speed of measurements of transmission casing in three mutually perpendicular directions and have been referred to the condition without damage.
Fig. 5View of the consecutive damage phases of gear wheel z3
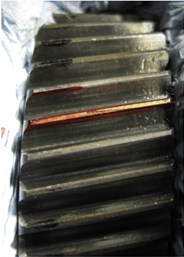
a) Ok – teeth not damaged
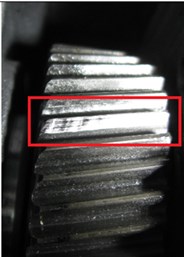
b) Damage 1 – one tooth surface slightly grinded off
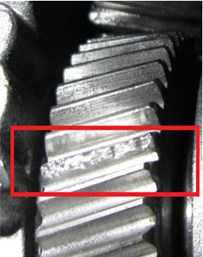
c) Damage 2 – opposite tooth surface slightly grinded off
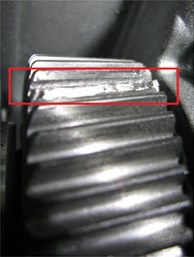
d) Damage 3 – broken tooth surfaces (on a length of up to 4 mm) deeper grinded off
Subsequently, various analyses in time and frequency domain were carried out. In time domain, in band of 10 Hz-10 kHz, was designated among others effective values of vibration velocity , kurtosis , peak factor and signal strength , which were illustrated on Fig. 6.
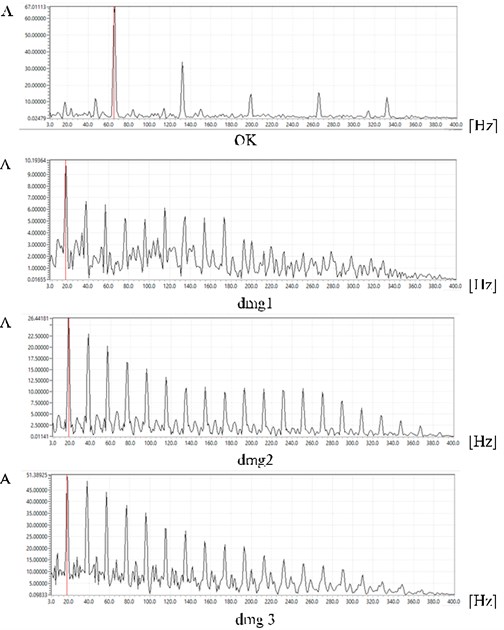
In frequency domain, the amplitudes of particular harmonics resulting from kinematics of the transmission under consideration as well as spectral envelope (method of envelope narrowband analysis with the application of Hilbert transform, Fig. 7) were determined.
Fig. 6Results in the time domain
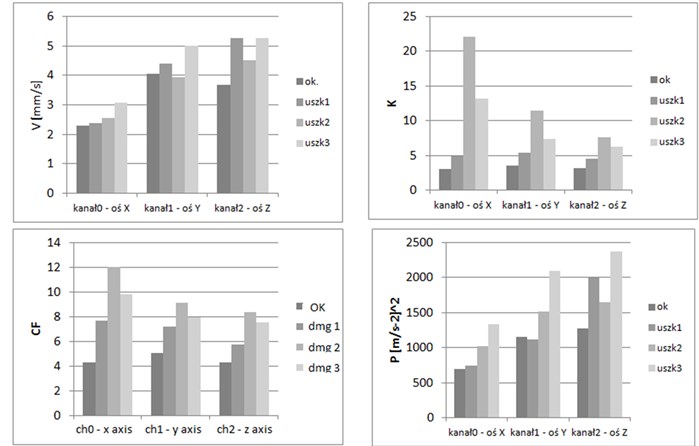
Fig. 7Results of analyses in frequency domain – the spectral envelope
Rotating bearing generates a pulse train corresponding to subsequent rolling elements revolving through the defect. Repeat time of impulses associated with bearing defect is strictly related to rotational speed of shaft measured in revolutions per minute (RPM). It means that the generated pulse train connected with the defect inside the bearing will be subject to modulation with rotational speed signal of shaft measured in RPM. It leads to the signal with information about defects (broadband signal with small frequency) being coded (hidden) in temporary changes of carrier signal amplitude (rotational speed signal). A signal modulated in this way is called a narrowband signal.
The procedure of drawing Fig. 7 is as follows: time signal is calculated into spectral form. The appropriate frequency band is selected from spectrum and then the amplitude of positive frequencies is doubled and the amplitude of negative frequencies is neutralized (which corresponds to the conversion of signal by applying the Hilbert transform). After that, this signal is also applied to calculate the inverse Fourier transform, what gives the analytical signal. Having used the function to multiply the time window, signal envelope is calculated (in this case an absolute value), and then its spectrum, which was illustrated in Fig. 7.
Escalation of transmission damage causes the increase of analyses’ parameters in the time domain [13]. Narrowband analysis of envelope allowed to establish modulating frequencies, including, for state without damage – the frequency amounting to 67 Hz (denoted as OK) and the number of its multiplicities, while for state containing damages it conveyed a message regarding damage of meshing and frequency of 19 Hz as well as the number of its multiplicities. Frequency amplitude increased along with damage. However, it appears to be inconvenient that it is also a rotational frequency informing about unbalance. This method was also applied to identify damages of antifriction bearings both on laboratory stand and on real technical facility.
4. The study of a helicopter main transmission
Vibrations’ measurements of main transmission casing were conducted during ground-based helicopter test, on fixed and intermediate ranges, changing the speed of power units up to maximally permissible (helicopter hovering in the air). Test profile was determined on the basis of record of parameters derived from flight recorder, which contains values of rotational speeds of turbo compressor of the left engine, right engine and helicopter rotor and it is depicted on Fig. 8.
Fig. 8Profile of the helicopter ground-based test
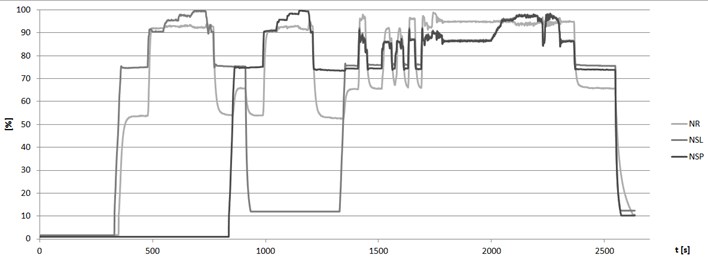
Fig. 8 presents the graph of on-ground tests during which the measurements were conducted. It is a presentation of changes of rotor speed (NR), revolutions of the left engine (NSL) and revolutions of the right engine (NSP) during on-ground tests.
Due to structural reasons (non-magnetic casing without technological orifices, without planes, with the possibility to glue sensors) and for safety considerations there was a limitation in assembling sensors measuring temporary vibrations of transmission casing. Monsena and Dzwonczyc (1995) proposed a hybrid (digital/analog) neural system as an accurate off-line monitoring tool used to reduce helicopter maintenance costs, and an all analog neural network as a real-time helicopter gearbox fault monitoring. Therefore, accelerators were installed (Fig. 2) in measuring points: A (by gluing) – three mutually perpendicular directions marked as WNX, WNY and WNZ, in points: B, C (by using permanent magnet)-vertical direction marked as LSZ and PSZ. Information regarding the current rotational speed was preliminary established from test cards and data indexing, by correcting with values from Fig. 8, and determining from spectrum of vibration signal.
Similarly, as in the case of laboratory studies a number of analyses in time and frequency domain were carried out. In time domain, i.e. in band 45-1590 Hz, 25-10 kHz, 190-340 Hz, 2 Hz-10 kHz – Fig. 9, one determined for the whole test root-mean-square values of vibration speed V and their maximum values.
The graph shows vibrations in band recorded by triaxial sensor on helicopter main transmission in -, - and -axes. However, the remaining two measurement points were located on the left and right engine and measured by one axle sensor in the direction of -axis (due to the assembly and temperature difficulties).
Maximum values of vibration speed in particular points for certain bands were summarized on Fig. 10.
Fig. 9Course of changes of root-mean-square values of vibration speeds in band of 2 Hz-10 kHz
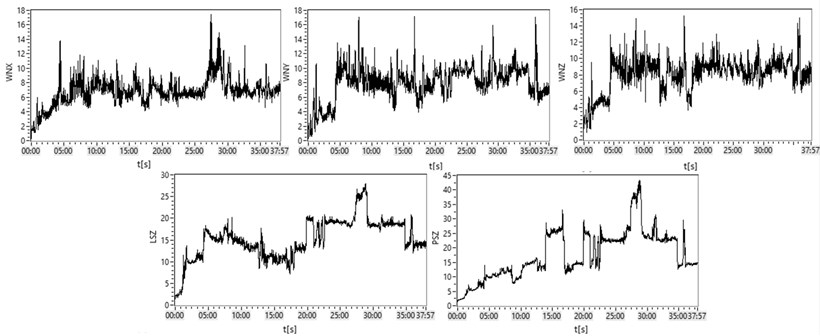
Fig. 10Maximum values of vibration speed in particular points for certain bands
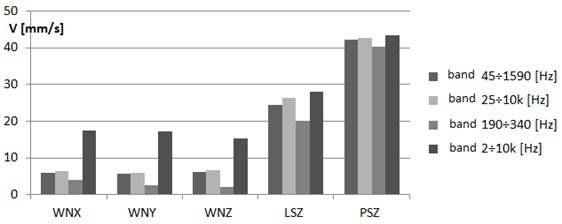
These values refer to assumed limit values. In point B (vertical axis marked as LSZ) and C (vertical axis marked as PSZ) – to values of power unit defined by producer (equaling 45 mm/s → warning value and 60 mm/s → limit value). In point A (directions WNX, WNY and WNZ) it pertained to norm [14]. Polish Norm describes technical conditions of machines, the ranges of which were presented on Fig. 10. WNX – are vibrations in a band of main transmission of helicopter rotor in direction of -axis, WNY, WNZ in subsequent axes and LSZ – vibrations in a band of a left engine in vertical direction of -axis, LSP – vibrations in a band of a right engine in a vertical direction of -axis.
Only in band 2 Hz-10 kHz, it was observed that the limit value was exceeded.
In time domain, i.e. the values of kurtosis (Fig. 11), peak factor and signal strength were ascertained. It was performed on stable operating ranges of left or right engine, as well as on both engines simultaneously.
Fig. 11Kurtosis values in particular directions on stable ranges of rotational speed
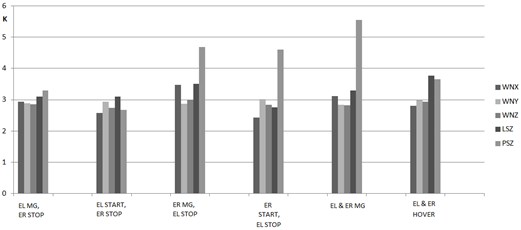
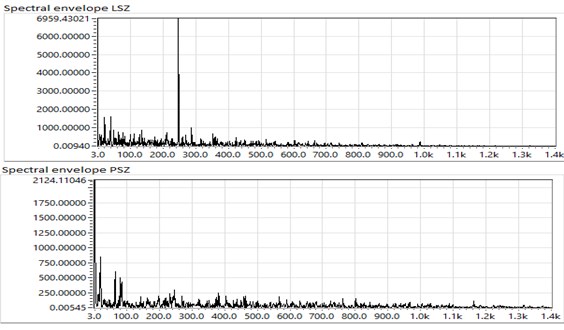
Fig. 12Spectral envelope (left engine – booster and right engine – turned off)
The above analyzes and a number of others made in the field of time analysis, due to lack of unequivocal levels describing permissible limit values, were treated as informative and intended to be compared in the case of expanding the population of the examined objects [15].
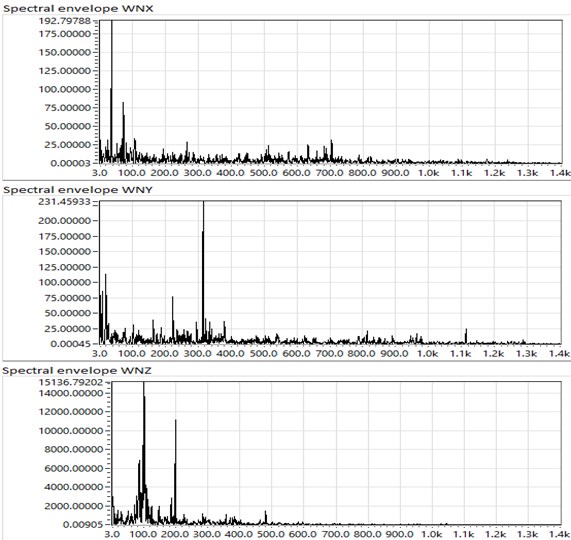
To discover defects of bearings and transmission teeth, the analysis of spectral envelope (method of narrowband analysis of flight envelope) was applied.
In this spectrum there were frequencies, which corresponded to kinematic calculations; however, some of the frequencies were not related to the detected kinematics of the tested gear (Fig. 12).
By applying a narrowband envelope analysis, spectra of envelopes in measuring points were obtained. Due to not fully recognized kinematics (on the day the analyses were carried out) of the main transmission under consideration in the obtained spectrum characteristic frequencies were acquired, which did not find confirmation in the calculated kinematics. Therefore, further research and innovation in the diagnostics of transmission in required.
5. Conclusions
Using vibroacoustic studies to evaluate the technical condition of a transmission is the issue which is widely discussed in the literature. A number of processing methods of measured signal characterized by different efficiency has been already developed. There are also certain requirements, which should be met. For example, correct parameters describing the studied kinematics, which enable to determine characteristic frequencies, as well as the adequate number of sensors mounted at appropriate places. In view of operational limitations, it was not possible to utilize a phase marker, because, by having a reference signal, other fault detection algorithms could be used.
The results of the investigations outlined above associated with the diagnostics of helicopter main transmission might indicate that there is a possibility to monitor some of its assemblies with a vibroacoustic method. However, the population of the objects should be widened and the parameters describing the studied kinematics should be verified to determine the characteristic frequencies.
References
-
Jacyna-Gołda I., Żak J., Gołębiowski P. Models of traffic flow distribution for various scenarios of the development of proecological transport system. Archives of Transport, Vol. 32, Issue 4, 2014, p. 17-28.
-
Jacyna M., Semenov I. N., Trojanowski P. The research directions of increase effectiveness of the functioning of the RSA with regard to specialized transport. Archives of Transport, Vol. 35, Issue 3, 2015, p. 27-39.
-
Żurek J., Smalko Z., Zieja M. Methods applied to identify causes of air events. Reliability, Risk and Safety: Theory and Applications, CRC Press/Balkema, 2010, p. 1817-1822.
-
Livebardon Thomas, Moreau Stephane, Gicquel Laurent, Poinsot Thierry, Bouty Eric Combining LES of combustion chamber and an actuator disk theory to predict combustion noise in a helicopter engine. Combustion and Flame, Vol. 165, 2016, p. 272-287.
-
Lei Yaguo, Lin Jing, Zuo Ming, He Zhengija Condition monitoring and fault diagnosis of planetary gearboxes: a review. Measurement, Vol. 48, 2014, p. 292-305.
-
Miao Lizhen, Zhang Haibo, Ning Jingtao Law of torsional vibration and discussion on vibration suppression based on helicopter/engine system. International Journal of Turbo and Jet-Engines, Vol. 33, Issue 1, 2016, p. 55-67.
-
Henriksson Markus, Sjoqvist Lars, Seiffer Dirk Helicopter engine exhaust rotor downwash effects on laser beams. Technologies for Optical Countermeasures XII and High-Power Lasers 2015: Technology and Systems Book Series: Proceedings of SPIE, Vol. 9650, 2015, p. 96500.
-
Cao Yihua, Wu Zhenlong, Huang Junsen Numerical simulation of aerodynamic interactions among helicopter rotor, fuselage, engine and body of revolution. Science China-Technological Sciences, Vol. 57, Issue 6, 2014, p. 1206-1218.
-
Aherwar Amit, Khalid Saifullah Vibration analysis techniques for gearbox diagnostic. International Journal of Advanced Engineering Technology, 2012.
-
Samuel Mathews P. Differential degradation assessment of helicopter engines operated in marine environment. Defense Science Journal, Vol. 64, Issue 4, 2014, p. 371-377.
-
Bojdo Nicholas, Filippone Antonio Comparative study of helicopter engine particle separators. Journal of Aircraft, Vol. 51, Issue 3, 2014, p. 1030-1042.
-
Taha Mma The influence of bearing misalignment on the performance of helicopter gear boxes. Wear, Vol. 92, Issue 1, 1983, p. 79-97.
-
Jammu V. B., Danai K., Lewicki D. G. Experimental evaluation of a structure-based connectionist network for fault diagnosis of helicopter gear boxes. Journal of Mechanical Design, Vol. 120, Issue 1, 1998, p. 106-112.
-
The Provisions of Gear Trains Receiving. Determination of Mechanical Vibrations of Gear Trains during Acceptance Tests. Polska Norma PN-ISO 8579-2, PKN, 1996.
-
Żurek J., Tomaszek H., Zieja M. Analysis of structural component’s lifetime distribution considered from the aspect of the wearing with the characteristic function applied. Safety, Reliability and Risk Analysis: Beyond the Horizon, CRC Press/Balkema, Leiden, 2014, p. 2597-2602.
-
Fraser K. F., King C. N. Helicopter Gearbox Condition Monitoring for the Australian Navy. Detection, Diagnosis, and Prognosis of Rotating Machinery to Improve Reliability, Maintainability, and Readiness Through the Application of New and Innovative Techniques. Woodbury, New York, 1986, p. 49-58.
-
Forrester B. D. Analysis of Gear Vibration in the Time-Frequency Domain. Current Practices and Trends in Mechanical Failure Prevention. Vibration Institute, Willowbrook, IL, 1990, p. 225-234.
-
Polyshchuk V. V., et al. Gear fault detection with time frequency based parameter NP4. International Journal of Rotating Machinery, Vol. 8, Issue 1, 2002, p. 57-70.
-
Monsena P. T., Dzwonczyk M. Analog neural network-based helicopter gearbox health monitoring system. Journal of Acoustical Society of America, Vol. 98, Issue 6, 1995, p. 3235-3249.
Cited by
About this article

